Article

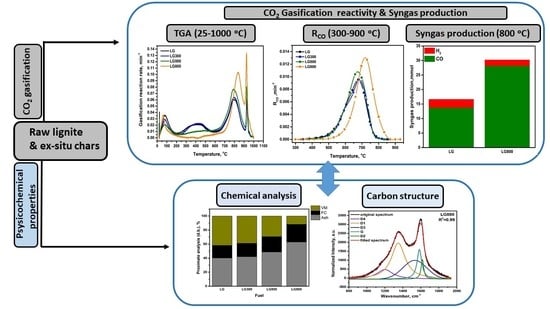
CO2 Gasification Reactivity and Syngas Production of Greek Lignite Coal and Ex-Situ Produced Chars under Non-Isothermal and Isothermal Conditions: Structure-Performance Relationships

by
Athanasios Lampropoulos
1,
Vassilios D. Binas
2,
Leila Zouridi
2,3,
Costas Athanasiou
4,
Miguel A. Montes-Morán
5,
J. Angel Menéndez
5,
Michalis Konsolakis
6,* and
George E. Marnellos
1,7,*
1
Department of Mechanical Engineering, University of Western Macedonia, 50100 Kozani, Greece
2
Institute of Electronic Structure and Laser, Foundation for Research and Technology-Hellas, 70013 Heraklion, Greece
3
Department of Material Science & Technology, University of Crete, 70013 Heraklion, Greece
4
Department of Environmental Engineering, Democritus University of Thrace, 67132 Xanthi, Greece
5
Instituto de Ciencia y Tecnología del Carbono (INCAR-CSIC), 33010 Oviedo, Spain
6
School of Production Engineering and Management, Technical University of Crete, 73100 Chania, Greece
7
Centre for Research & Technology Hellas, Chemical Process & Energy Resources Institute, 57001 Thessaloniki, Greece
*
Authors to whom correspondence should be addressed.
Energies 2022, 15(3), 679; https://doi.org/10.3390/en15030679
Submission received: 19 November 2021 / Revised: 23 December 2021 / Accepted: 11 January 2022 / Published: 18 January 2022

Abstract

:
The presented work explores the structural properties, gasification reactivity, and syngas production of Greek lignite fuel (LG) and ex-situ produced chars during CO2 gasification. Three different slow pyrolysis protocols were employed for char production involving torrefaction at 300 °C (LG300), mild-carbonization at 500 °C (LG500), and carbonization at 800 °C (LG800). Physicochemical characterization studies, including proximate and ultimate analysis, X-ray Diffraction (XRD), and Raman spectroscopy, revealed that the thermal treatment under inert atmospheres leads to chars with increased fixed carbon content and less ordered surface structures. The CO2 gasification reactivity of pristine LG and as-produced chars was examined by thermogravimetric (TG) analysis and in batch mode gasification tests under both isothermal and non-isothermal conditions. The key parameters affecting the devolatilization and gasification steps in the overall process toward CO-rich gas mixtures were thoroughly explored. The gasification performance of the examined fuels in terms of carbon conversion, instant CO production rate, and syngas generation revealed an opposite reactivity order during each stage. TG analysis demonstrated that raw lignite (LG) was more reactive during the thermal devolatilization phase at low and intermediate temperatures (da/dtmax,devol. = 0.022 min−1). By contrast, LG800 exhibited superior gasification reactivity at high temperatures (da/dtmax,gas. = 0.1 min−1). The latter is additionally corroborated by the enhanced CO formation of LG800 samples under both non-isothermal (5.2 mmol) and isothermal (28 mmol) conditions, compared to 4.1 mmol and 13.8 mmol over the LG sample, respectively. The pronounced CO2 gasification performance of LG800 was attributed to its higher fixed carbon content and disordered surface structure compared to LG, LG300, and LG500 samples.

Graphical Abstract

1. Introduction

The world coal proved reserves were estimated at 1070 billion tons (bt) at the end of 2019, with the global coal production reaching ca. 8.1 bt in 2019, resulting in the largest reserves-to-production ratio of 132 years among the fossil fuels [1,2]. Nowadays, coal accounts for a ca. 28% share of global primary energy consumption and almost 40% of electricity generation [2], with future projections highlighting the importance of coal for the emerging economies and the high energy scenario [3,4].
In 2019, the European Commission announced the European Green Deal to direct the EU economy down a pathway focused on climate neutrality by 2050 [5]. This ambitious target will require a fundamental transformation of the energy system. Traditional energy sectors relying on the production and use of coal and other fossil fuels will shrink, with concomitant negative consequences on the GDP and employment rates of the coal-intensive regions that are on their way to clean energy transition. In the current decade, the estimated number of direct coal mining and power generation jobs at risk under various coal phase-out scenarios ranges from 54,000 to 112,000, without considering the losses in jobs indirectly related to the coal sector [6,7]. The countries likely to see the most coal-related job losses are Poland, Germany, Romania, Bulgaria, and Greece [5]. Therefore, alternative strategies to diversify local economies are required to ensure that the transition will be fair and leave no one behind [6,7].
Apart from the progressive shut-down of coal-fired plants in Europe, the Green Deal strategy foresees the large-scale deployment of renewables in the energy mix (wind/solar combined shares target up to 70% of electricity generation for 2050 EU full decarbonization scenario), which is expected to counterbalance the income and employment losses in the traditional EU coal regions. However, the timeframe for this transition may take longer than expected since challenges associated with the efficiency and cost of renewables as well as with the development of efficient grid-scale energy storage technologies to avoid curtailment of excess renewable power still need to be resolved, decelerating to some extent the progress toward clean energy transition [7]. On the other hand, in case of peak demands or grid instabilities, coal can be regarded as a domestic and cheap natural source that can ensure the safe, stable, and reliable operation of the power grids. Moreover, the backup use of native fuel sources could secure the energy supply and protect the economy of energy-importing countries in case of high energy prices. Thus, for the short-to-medium term, environmentally friendly and energy-efficient approaches for coal exploitation should also be considered in future national energy plans.
Gasification is an established thermochemical route for coal utilization [8,9,10,11]. By employing different gasifier configurations (i.e., up-draft, down-draft, fluidized, etc.), operational conditions (i.e., temperature, heating rate, feed flows, equivalence ratios, etc.) and gasifying agent mixtures (air, pure oxygen, steam, carbon dioxide, or mixtures), coal fuels can be efficiently converted to high heating value syngas. Syngas is a mixture consisting mainly of H2 and CO, which can be employed, depending on its composition, for power generation or as a valuable building block for a variety of chemicals (e.g., methanol, olefins, DME) and liquid synthetic fuels [12,13,14,15].
When industrial captured CO2 emissions are coupled with the gasification of solid fuels, this integrated approach can be regarded as an alternative CO2 utilization technology that turns a climate change threat into a CO-rich gas mixture, suitable for synthesizing several added-value chemicals employing downstream catalytic processes [16,17,18,19]. CO is a versatile molecule that can act as a significant precursor and intermediate for a wide range of chemicals (different types of acids, dimethyl carbonate, formamides). Moreover, CO is a significant feedstock for hydrogen production via the water-gas shift reaction [16,20].
The Boudouard reaction (C + CO2 ↔ 2CO, ΔH = 172 kJ/mol) is the main method of converting carbon fuels and CO2 to carbon monoxide [7]. The reaction is highly endothermic and favored at high temperatures (typically >700 °C). Compared to other gasifying agents (air and/or steam), CO2 reveals noteworthy advantages [21,22]. In contrast to air gasification, when using CO2 as a gasifying medium the dilution of syngas with air-derived N2 is avoided, leading to higher heating value fuel gas mixtures. In addition, contrary to steam gasification, the use of CO2 as gasifying agent eliminates the heat demands associated with water evaporation [23]. Moreover, CO2 favors the cracking of volatiles, resulting in reduced tar formation and higher syngas production. In light of the above considerations, many researchers [24,25,26,27] have explored the reaction mechanism and kinetics of CO2 gasification using various coal types regarding its practical application in industrial (gasification) plants.
The first stage during gasification is the drying of solid fuel followed by the pyrolysis step, which leads to the thermal degradation of carbon structures through the release of volatiles and loosely-bonded functional groups. The thermal treatment of carbonaceous solid fuels under inert atmospheres produces chars with upgraded fuel characteristics and higher energy content than the pristine fuel, along with liquids and non-condensable gases, with the individual yields being dictated by the pyrolysis conditions. Many researchers [28,29,30,31,32,33,34,35,36] have examined the effect of different pyrolysis parameters prior to gasification, involving the carrier gas, temperature, heating rate, and residence time. The gasification performance of as-produced chars is dependent on their physicochemical properties, including the elemental composition, proximate analysis, degree of aromaticity, structural order/disorder, particle size, etc. [28,29,30,37].
In order to examine and validate the gasification performance of solid fuels, several experimental procedures have been employed. For instance, the gasification of solid fuels may be conducted either isothermally or non-isothermally. Non-isothermal gasification offers the advantage of revealing the relationship between the temperature range, heating rate, and reaction characteristics [17,19]. On the other hand, thermogravimetric (TG) analysis is the optimum choice for assessing the gasification reactivity and kinetics of carbonaceous solid fuels since it is a quick and accurate method, requiring small sample amounts [19]. Moreover, fixed bed lab-scale reactor gasifiers coupled with Gas Chromatography are employed to monitor the amount and composition of produced syngas, thus allowing the direct correlation of gasification performance with syngas quality [17,38,39].
Lignite belongs to the family of “Brown” coals and is Greece’s most important local energy resource. Due to its low extraction costs, stable prices, and security of supply, Greek lignite supported the national electricity grid as well as the local economies and national growth for more than six decades [6,7]. In the light of the necessity to explore alternative pathways to exploit the existing lignite deposits and consider the great importance of mitigating climate change, the present work originally investigates the CO2 gasification performance of Greek lignite and as-produced chars in terms of gasification reactivity, carbon conversion, and CO production. This particular approach could combine the energy conversion of Greek lignite with the parallel utilization of industrially captured CO2 emissions towards mitigating the environmental impact of coal utilization.
In the present work, low-rank lignite coal from the Western Macedonia region in Greece was sampled, grounded, and slowly pyrolyzed at 300, 500, and 800 °C. Then the raw lignite and the ex-situ derived chars were characterized in terms of ultimate and proximate analysis as well as utilizing structural analysis (XRD, Raman) with the main aim of exploring the effect of thermal treatment protocol on the physicochemical properties of as-produced chars. TG experiments under non–isothermal conditions were employed to assess the CO2 gasification reactivity and explore the underlying reaction mechanism for all fuels. Finally, the CO production rate was monitored under non-isothermal and isothermal conditions to reveal possible relationships between the gasification performance of fuel samples and their physicochemical characteristics. To the best of our knowledge, most of the CO2 gasification works reported in the literature are limited to kinetic and gasification reactivity studies using thermogravimetric analysis (TGA), while the experimental data on syngas evaluation and its correlation with the physicochemical characteristics and gasification reactivity of fuels are barely discussed. Remarkably, there are no relevant studies focused on the gasification reactivity and syngas production of raw lignite and ex-situ pyrolyzed chars under both isothermal and non-isothermal experimental conditions, highlighting the novelty of the present work [19,40].

2. Materials and Methods

2.1. Materials and Chemical Analysis

Low-rank lignite coal from the Western Macedonia basin (Ptolemais Region) in Greece was employed as fuel feedstock in the present study. The as-received pristine lignite (LG) was first crushed to a particle size of between 1–3 mm, air-dried, and milled to 100–200 μm using an agate mortar. Then, grounded lignite samples were slowly pyrolyzed under nitrogen flow at 300, 500, and 800 °C, resulting in three different chars, i.e., LG300, LG500, LG800. The experimental procedure for chars preparation has been thoroughly described elsewhere [41]. Ultimate and proximate analyses of all samples were performed in a Vario Macro CHN/CHNS analyzer (Elementar, Langenselbold, Germany) and TGA LECO 701 analyzer (LECO, St. Joseph, MO, USA), correspondingly, and the results are illustrated in Table 1.

2.2. Structural Characterization

X-ray diffraction patterns of fuels were obtained using a Bruker AXS D8 (Bruker, Germany) Advance copper anode diffractometer (CuKα radiation) equipped with a Nickel foil monochromator operated at 40 kV and 40 Ma, over the 2θ collection range of 10–80°. The scan rate was 0.05°s−1. The Origin 2019® software was used to remove noise from the XRD spectra. Crucial parameters such as peak position (2θ), area (A), and aromaticity factor, fa, obtained from XRD spectra were calculated according to Jingyu Jianga et al. [42] methodology.
Raman measurements were performed at room temperature using a Nicolet Almega XR Raman spectrometer (Thermo Scientific, Waltham, MA, USA) with a 473 nm blue laser as an excitation source. The laser power was 15 mW, and the beam was focused on the sample through a confocal microscope equipped with a 50× objective. Analysis and deconvolution of the obtained data was performed using Origin 2019®.

2.3. Thermogravimetric Analysis

Non-isothermal thermogravimetric (TG) analysis was carried out to gain insight into the different stages involved during the gasification process of raw lignite and as-derived chars. Themogravimetric experiments were conducted in a Q600 SDT (TA Instruments, USA) thermobalance. About 15 mg of sample were heated at 20 °C/min from room temperature to 1000 °C under a pure carbon dioxide stream of 100 mL/min.
Carbon conversion, a, in terms of the sample weight loss, was calculated by the following equation:
a = (m0 − mt)/ (m0 − m)
where m0 is the initial weight of the sample, mt is the weight at the reaction time t, and m is the final weight after the end of the gasification process. Equation (2) was applied to estimate the instant gasification reaction rate (R, min−1) with respect to the instantaneous weight loss rate (dm/dt):
R = −(1/(m0 − m))/(dm/dt) = da/dt
To further gain insight into the gasification performance of samples, the comprehensive gasification characteristic index (S), initial (Ti), and final process temperature (Tf), along with the maximum and mean carbon conversion rate (da/dt), were introduced to assess the reactivity of fuels during the different steps of the gasification process.
S = ((da/dt)max × (da/dt)mean)/ (Ti2 × Tf)

2.4. Gasification Experiments

To assess the gasification performance of fuel samples in terms of syngas production, isothermal and non-isothermal gasification experiments under the batch mode of operation using pure CO2 or CO2/He mixtures as gasifying agents were carried out. Non-isothermal experiments were carried out in a quartz fixed-bed, U-shaped reactor loaded with 100 mg of fuel, in the temperature range of 300–950 °C (heating rate 5 °C/min). Helium was used as a diluent to obtain different gasifying agent mixtures (5/95, 10/90, 20/80, 50/50, 100/0 vol.% CO2/He) at a total feed flow rate of 30 cm3 (STP)/min. The experimental apparatus of non-isothermal experiments has been described in detail elsewhere [41].
In the case of isothermal gasification tests, instead of the quartz reactor, a tailor made inox reactor with a custom funnel was used to deliver the fuel feedstock into the reactor upon reaching the set up temperature. During isothermal experiments, 0.5 gr of LG or LG800 were gasified under 30 cm3 (STP)/min of pure CO2 flow rate at 800 °C. Gas sampling from the effluent stream was performed at 1, 2, 3, 4, 5, 7, 10, 14, 17, 22, 27, 35, 40, 45, 50, 55, 60 min since the introduction of feedstock into the reactor (t = 0 min) and subsequently at intervals of dt = 10 min until fuel depletion.
Since CO was practically the only product during gasification, the carbon to CO conversion, XC, the instant CO production rate, RCO (min−1), and the cumulative CO yield, YCO (mol), were determined by using the following expressions [43,44]:
X C = t = 0 t pyrolysis y CO , t × 12 m × w c + t pyrolysis t f y CO , t × 12 2 × m × w c
RCO = dXC/dt
Y CO = 0 t f F t × [ CO ] V M × 100 × dt
where yCO,t corresponds to the cumulative CO production moles in time t, m is the initial mass of fuel sample (gr), [CO] is the concentration of CO, Ft is the effluents flowrate (lt/min), wc is the elemental carbon content of fuels, and VM is the molecular volume at 298 K and 1 atm (24.436 lt/mol). Equation (4), used to evaluate the carbon to CO conversion, XC, contains two terms. The first term stands for the CO production during the devolatilization stage, whereas the second term corresponds to the CO formation associated with the Boudouard reaction (C + CO2 → 2 CO) during the gasification stage [43,44].
In both non-isothermal and isothermal gasification tests, the effluent stream was passed through a cold trap to remove the existing tarry matter in the produced syngas prior to Gas Chromatography analysis. The contained ash in fuels was trapped in the frit inside the gasifier and removed mechanically at the conclusion of each experiment.
To ensure the accuracy and reliability of the experimental results, all tests were repeated 3 times.

3. Results and Discussion

3.1. Physicochemical Characterization

3.1.1. Chemical Analysis
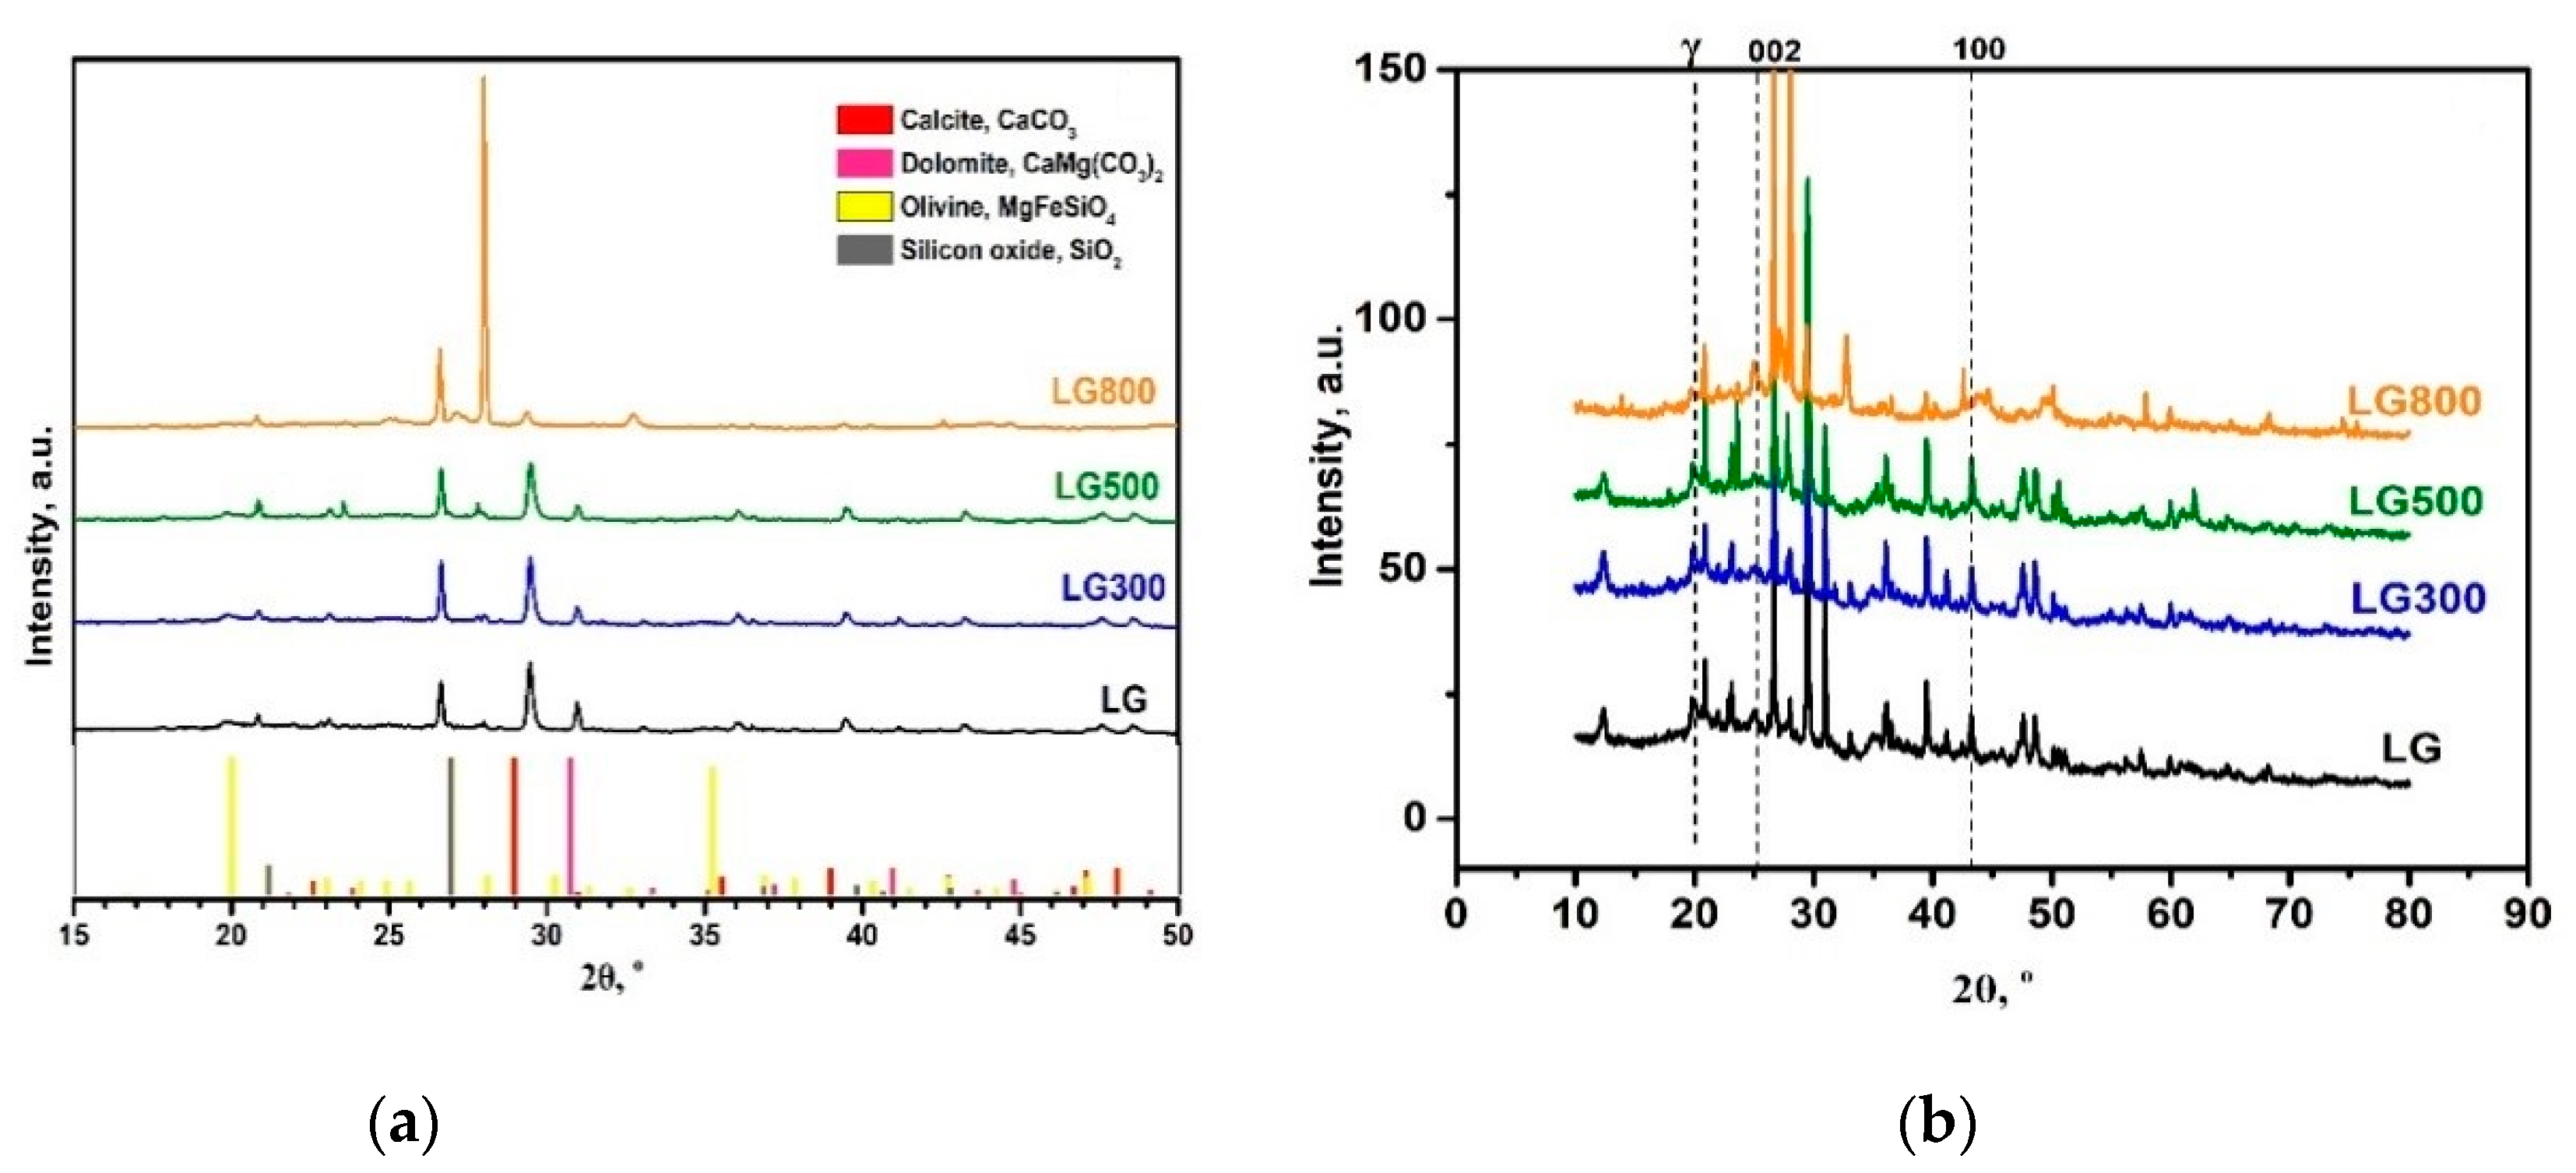
Table 1 presents the chemical composition of both raw and thermally treated lignite samples. The fixed carbon and ash contents gradually increase upon increasing the treatment temperature, whereas the moisture, volatile matter, hydrogen, and oxygen contents showed an opposite trend [41]. The aromaticity factor values of all fuel samples were calculated after applying empirical mathematical expressions provided in the literature and taking the average value for each sample [45]. The increasing trend of the aromaticity factor is reflected in the increasing number of aromatic carbon atoms in lignite chars, as confirmed by the XRD analysis presented below.

3.1.2. XRD Analysis

The XRD patterns of both raw and thermally treated samples are depicted in Figure 1. The minerals identified in all fuels were calcite, dolomite, olivine, and silicon oxide (Figure 1a). The same minerals were also observed in Turkish and other Greek lignite samples, as reported in the literature [46,47]. A closer inspection of XRD patterns (Figure 1b) reveals the existence of two peaks at ca. 20 and 42°, corresponding to 002 and 100 planes of the aromatic carbon/graphite lattice, respectively. The 002 plane corresponds to the cross-section plane, from which the interlayer distance (d002) between the aromatic ring layers can be derived, while the 100 plane corresponds to the parallel plane of the aromatic ring layers. Moreover, the 002 band reflects the distance between the aromatic ring layers [48,49]. On the left side of the 002 peak the γ-band appears, ascribed to the aliphatic side chains connected to the edge of aromatic rings from which the packing distance of saturated structures can be derived [50]. To further elaborate on the aromaticity of the fuels used in this study, the ratio of carbon atoms in aliphatic chains and aromatic rings (fa), was calculated according to the following equation [42]:
fa = Car/(Car + Cal)= A002/(Aγ + A002)
where Car and Cal are the numbers of aromatic and aliphatic carbon atoms, respectively. From the XRD spectra depicted in Figure 1 and the area Aγ used to calculate the aromaticity factor, fa, through Equation (7), the area of γ peak is decreased as the temperature of thermal treatment increases, i.e., from 3.47 for LG to 1.61 for LG800 sample. This behavior indicates the decrease in the number and length of aliphatic side chains at the aromatic structure edges, i.e., the decrease of the aliphatic character of fuels. However, there is an increase in the area of the 002 band upon increasing the thermal treatment temperature (from 2.2 for LG to 4.76 for LG 800), which could be indicative of larger crystals for the condensed aromatic rings. Therefore, the increased aromaticity of chars with thermal treatment temperature could be attributed to both shorter/less aliphatic chains present in the samples, as well as to the larger microcrystals of the aromatic structure. The fa values extracted from XRD analysis (Table 1) revealed the same trend as that obtained from ultimate and proximate analysis (Table 1), further verifying the enhanced aromaticity of char fuels upon increasing the thermal treatment temperature.

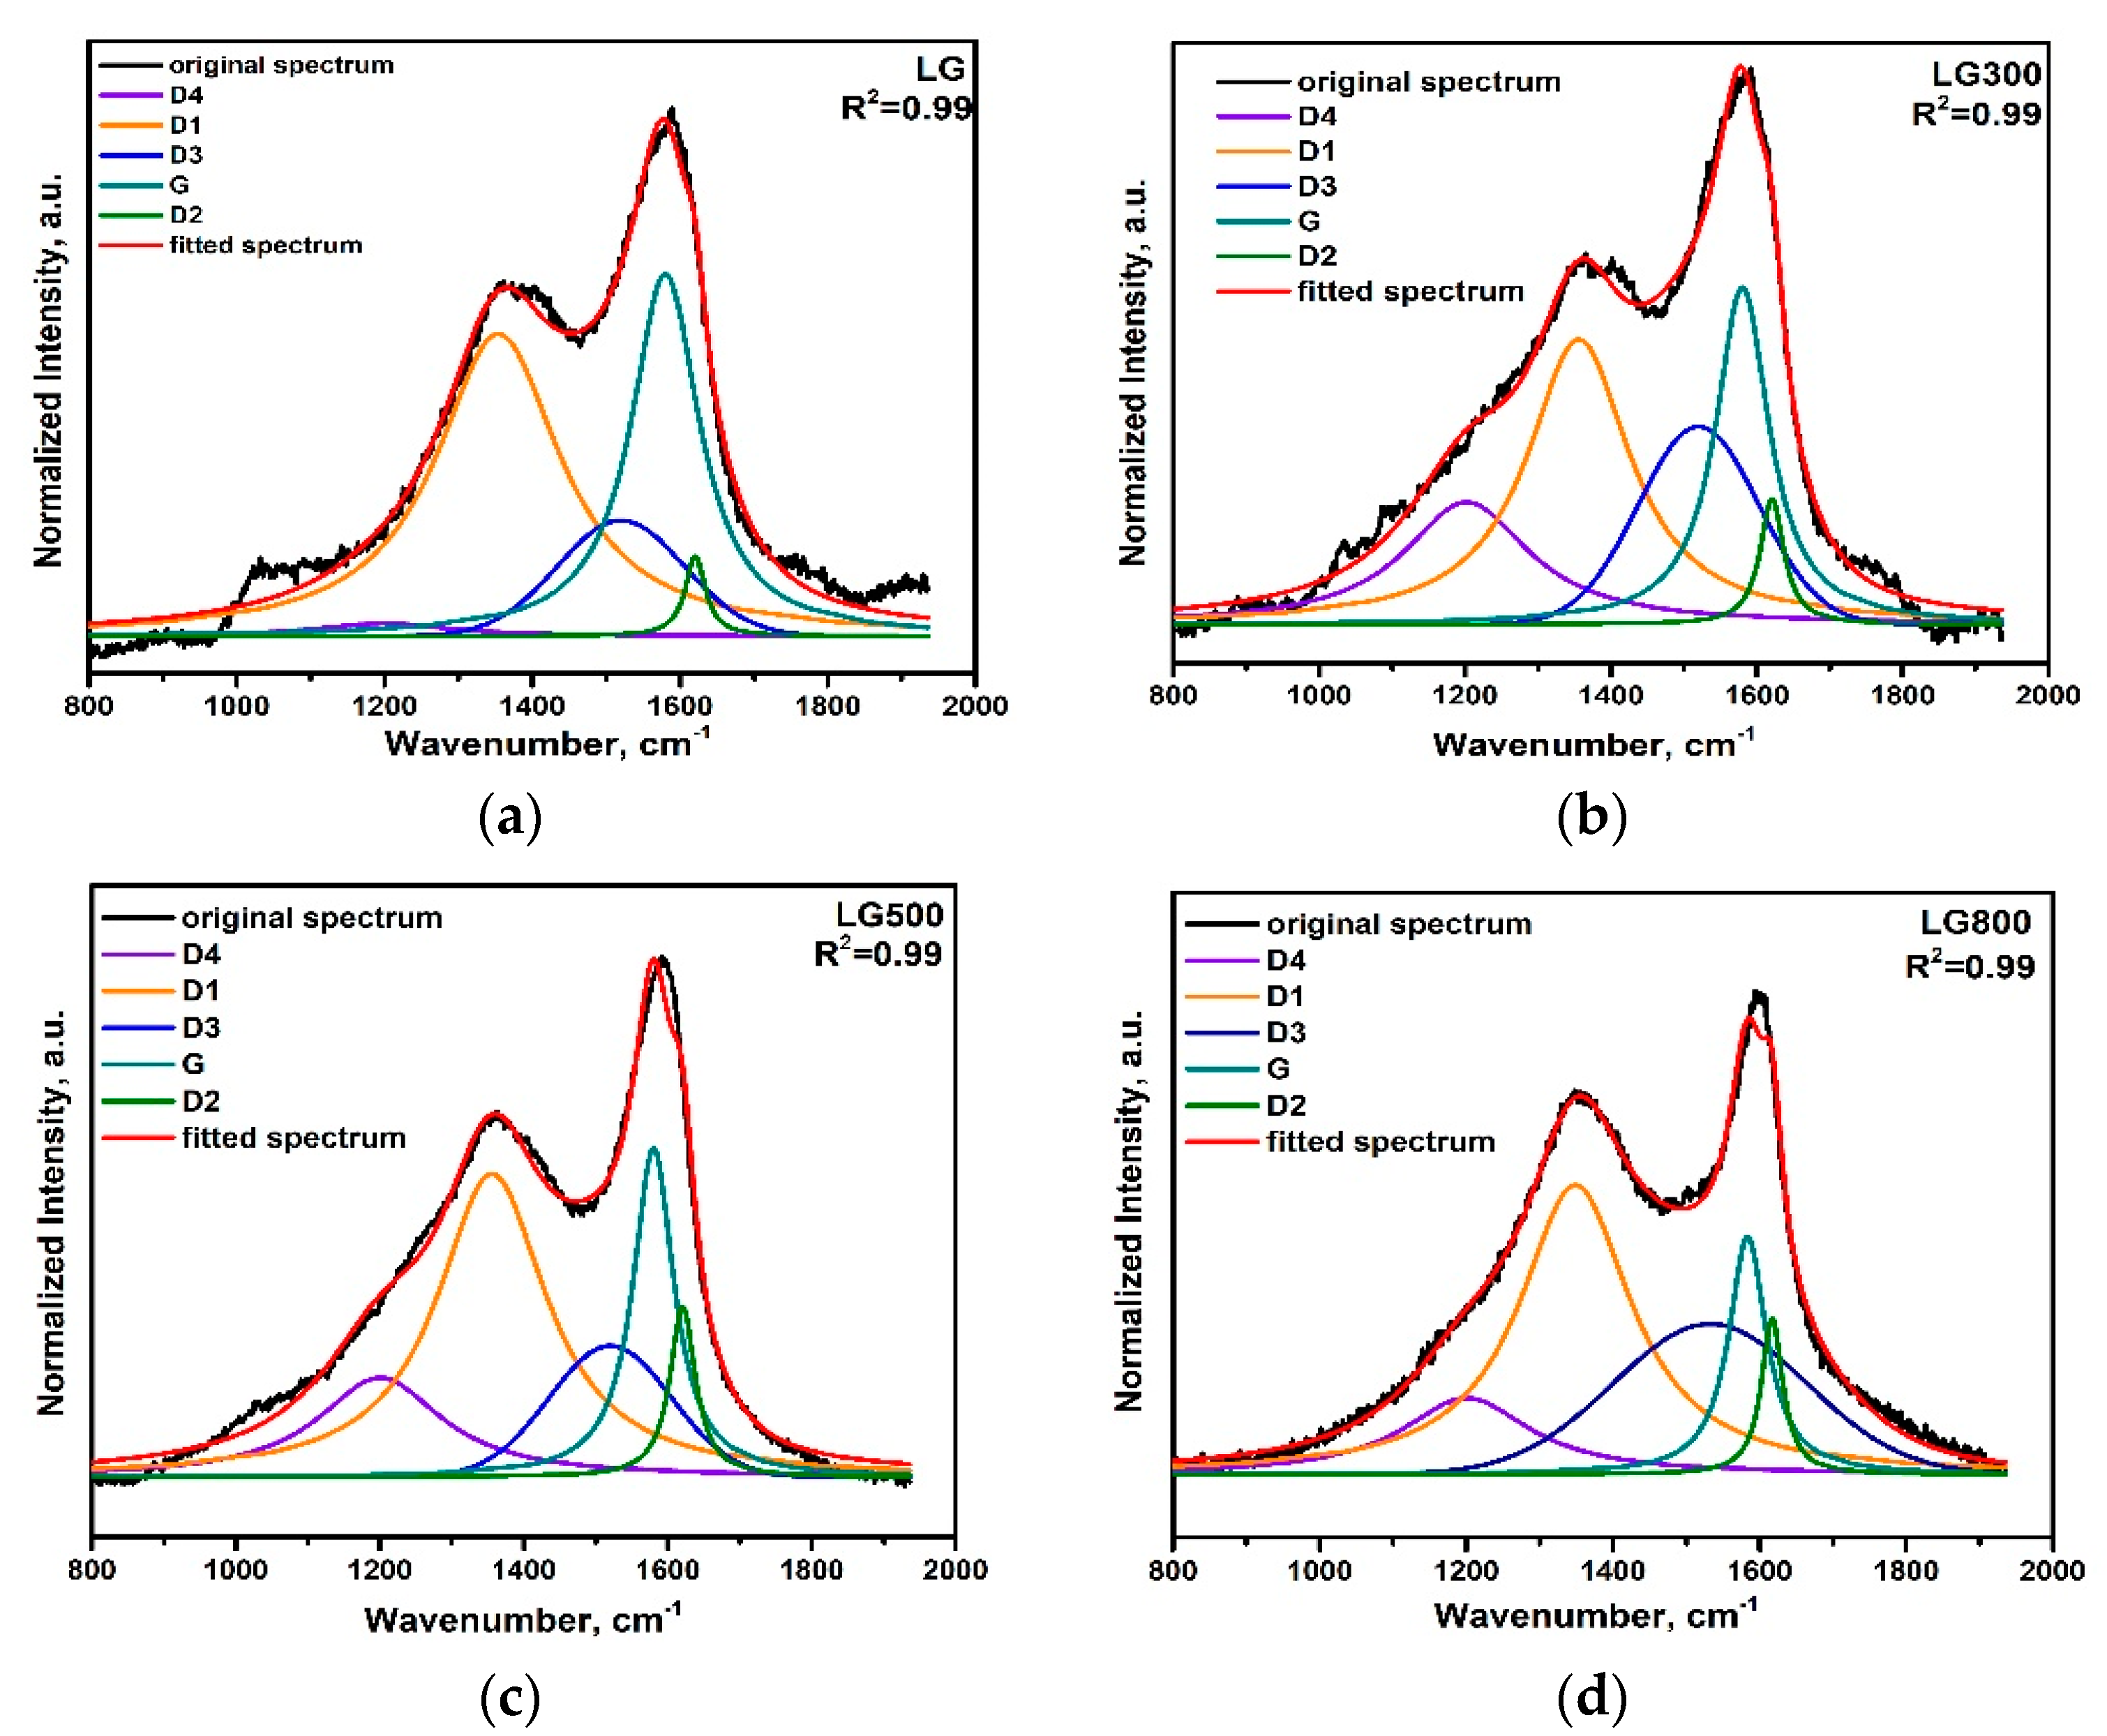
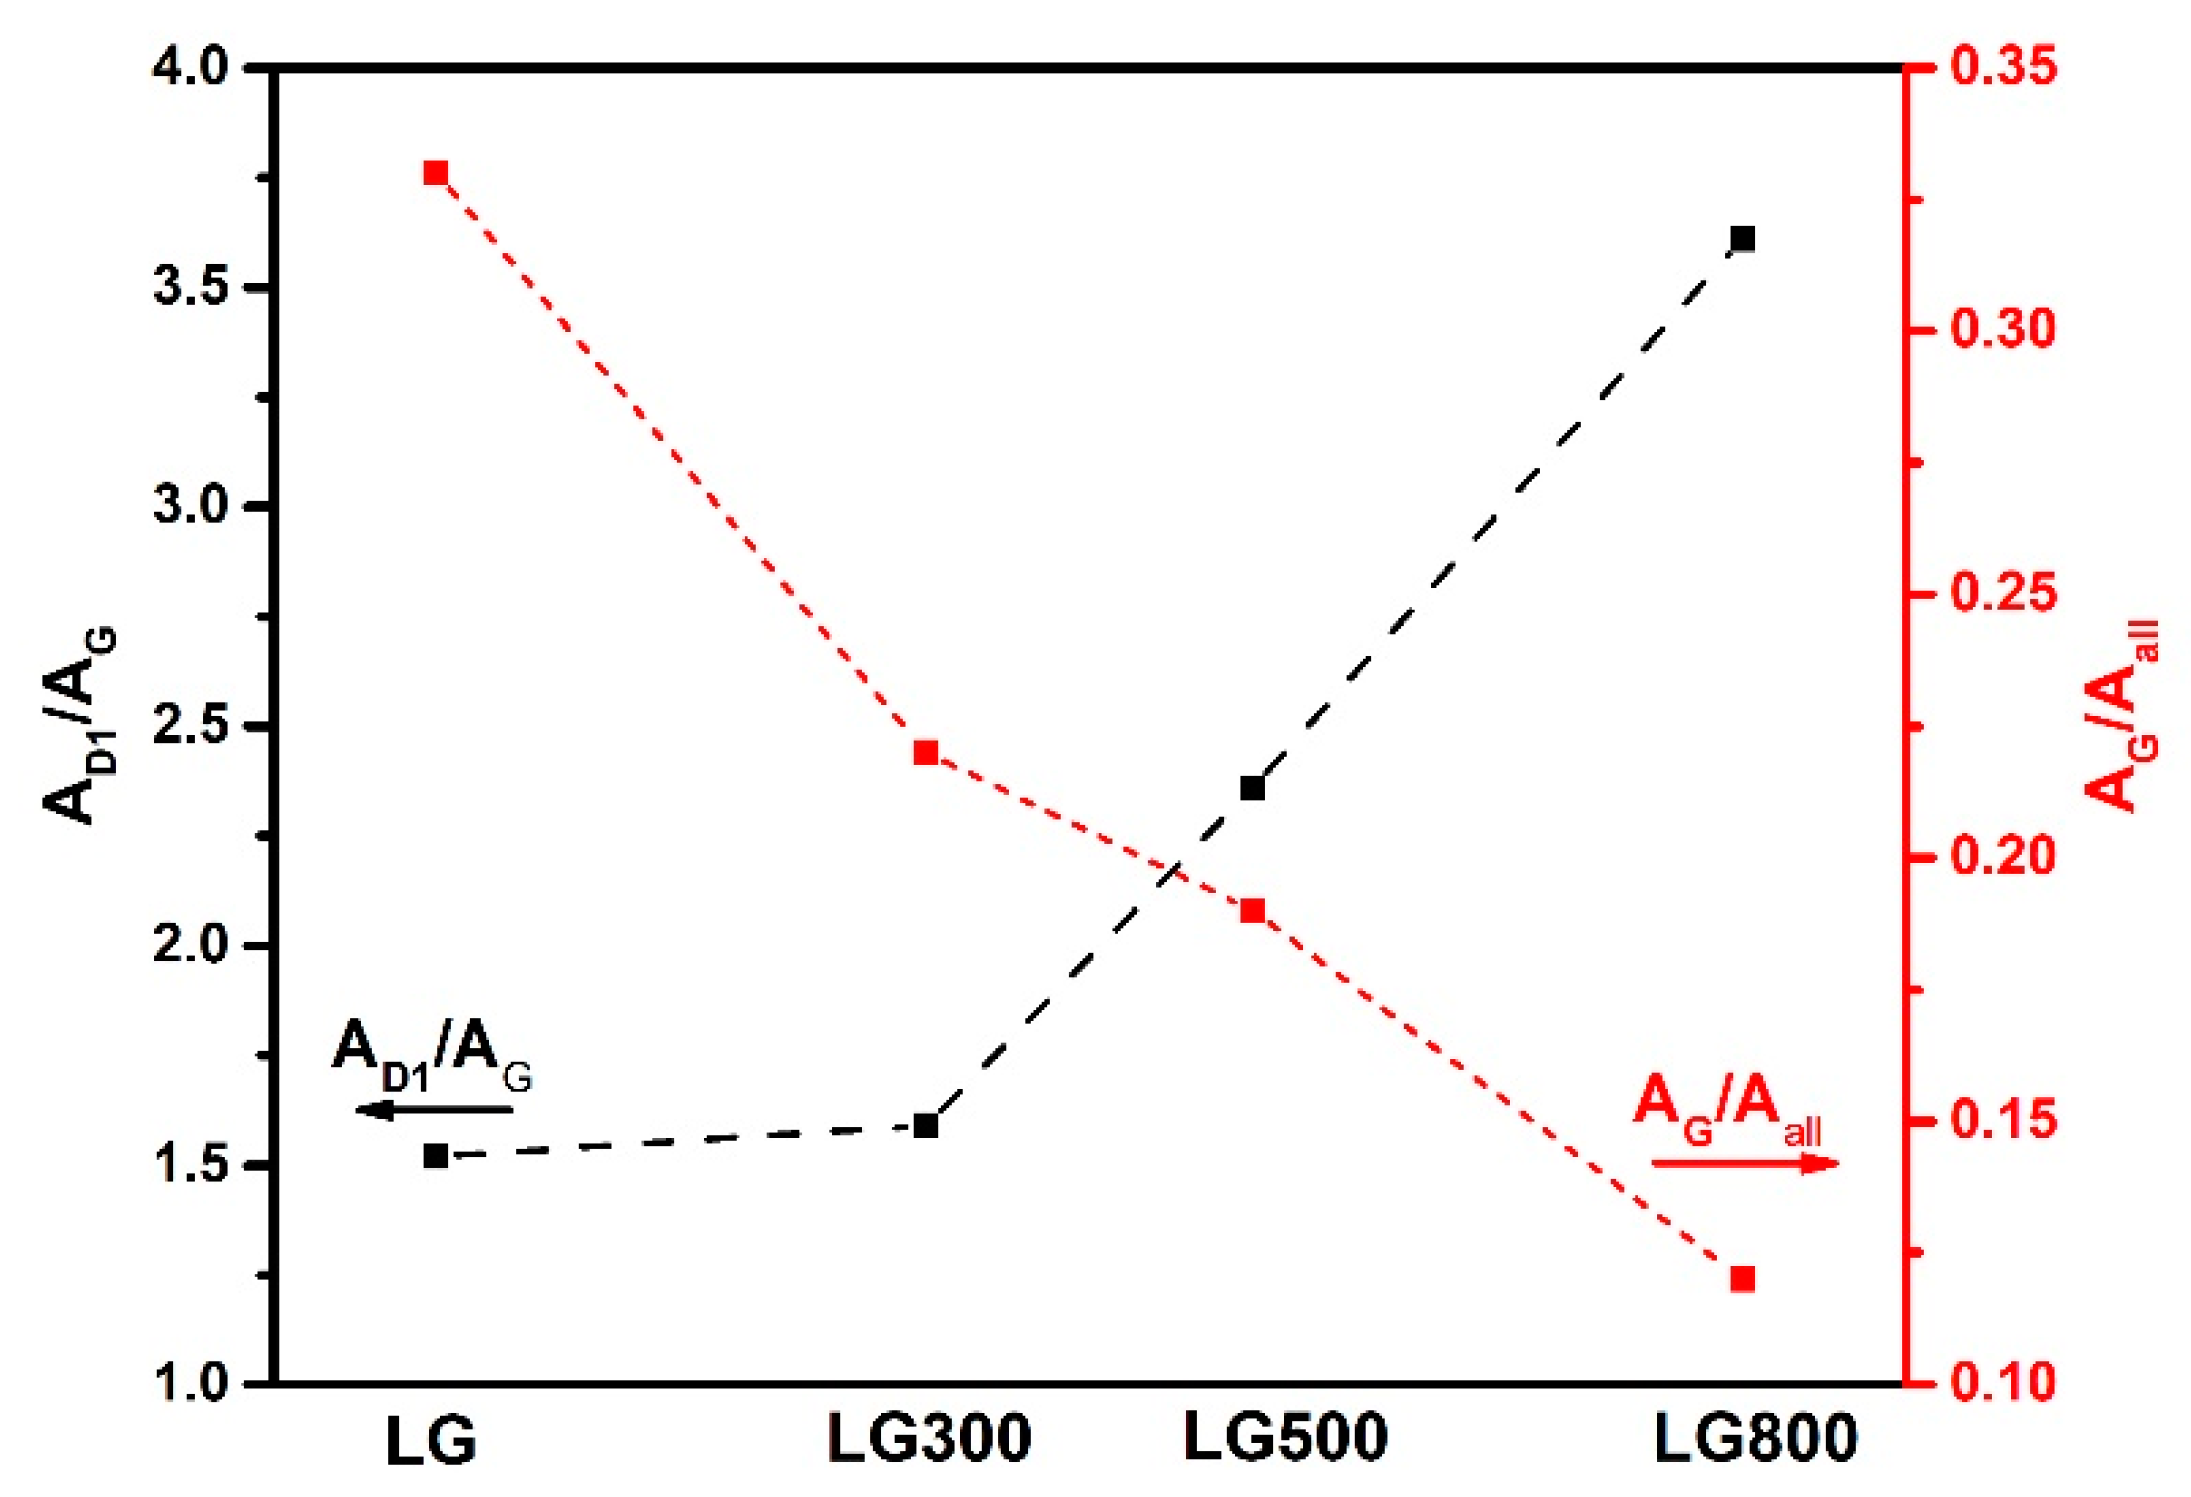
3.1.3. Raman Analysis

Figure 2 illustrates the Raman spectra of all fuel samples. Two distinct bands at 1350 cm−1 (D band) and 1590 cm−1 (G band) can be clearly observed.
D band is ascribed to the disordered structure of carbonaceous matter, while G band is associated with the vibrations of aromatic rings (graphite lattice) presented at varying intensities in highly or less ordered carbonaceous structures [42,51,52,53,54,55,56]. However, the significant overlap between the D and G bands results in a loss or misinterpretation of structure information, especially for highly disordered carbonaceous materials such as low-rank coals. To resolve this issue, deconvolution of original Raman spectra was conducted in order to more precisely analyze the fuels’ structural properties. In specific, each Raman spectra was baseline corrected and peak-fitted into four Lorentzian bands (D4, D1, G, D2) and one Gaussian band (D3), as depicted in Figure 3a–d. The G band corresponds to the stretching mode of the C=C alkene bond found on perfect single crystal graphite, while the D1 band indicates large sp2 bonding of more than six aromatic carbon atoms being presented as in-plane graphite lattice flaws. Detailed analysis concerning the position and origin of the aforementioned bands is well described in literature [54,57,58,59].
It can be observed that, as the pretreatment temperature increases, the intensity of the G band is progressively decreased, as compared to that of the D1 band. This is an indication that thermal pretreatment resulted in chars with a more disordered structure at their surface compared to the raw fuel, in accordance with relevant literature studies [53,54,60]. Bands area ratios, AD1/AG and AG/Aall, are usually used to semi-quantitatively define the disorder and graphitic carbon degree of the examined fuels, where AD1 and AG correspond to the integral areas of D1 and G bands, respectively. Total Raman area, denoted as Aall, results from the sum of the AD4, AD1, AD3, AG, and AD2. As shown in Figure 4, the band area ratios of AD1/AG and AG/Aall follow an opposite trend upon increasing the pyrolysis temperature.
More specifically, the AD1/AG ratio, which is proportional to the disordered carbonaceous structure, is increased with pyrolysis temperature, implying chars with a more disordered carbon structure than the pristine lignite. This behavior can be further verified by the descending trend of the AG/Aall ratio, taking into account that the G band is related to the vibrations of the ideal graphitic lattice. The lower degree of order in the surface structure of chars, compared to the raw lignite, could be attributed to the formation of molecular amorphous structures on the surface of chars due to the breakage of chemical bonds in macromolecular compounds during the condensation stage of the pyrolysis process [53,56,61].

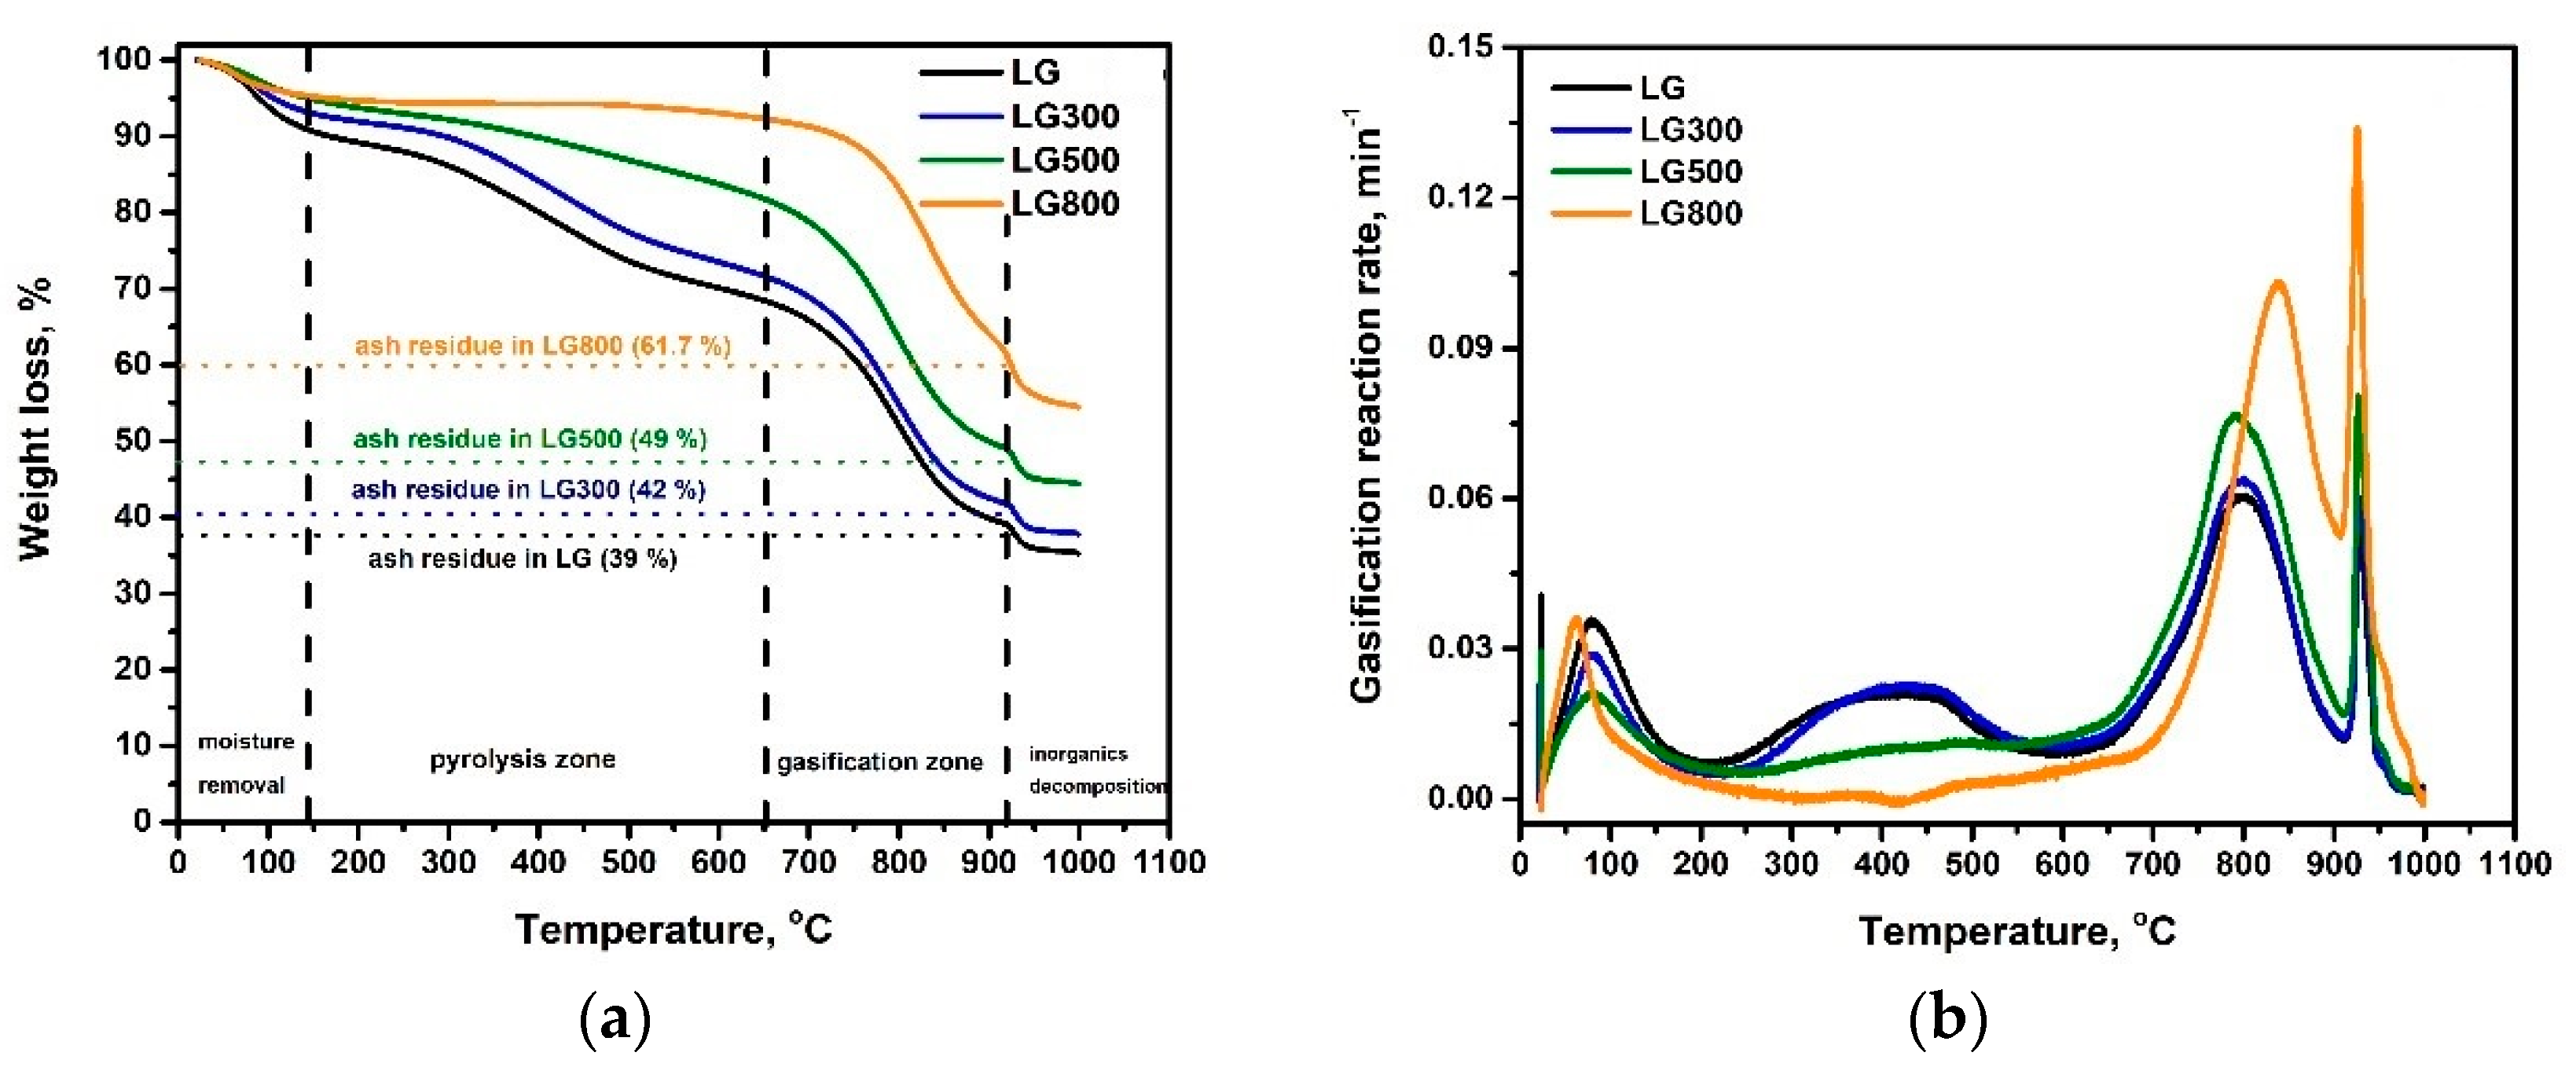
3.2. Gasification Reactivity

Temperature programmed thermogravimetric analysis under a pure CO2 atmosphere was performed to assess the gasification reactivity of both raw lignite and as-produced chars. Figure 5 illustrates the TG curves and gasification reaction rate (min−1) for all fuel samples under non-isothermal CO2 gasification conditions.
It is generally agreed that during non-isothermal TGA gasification tests, mass loss is attributed to phenomena which occur at different temperature regimes (Figure 5a). Initially, inherent moisture is released at temperatures below 150 °C. Weight loss due to water removal follows the order LG > LG300 > LG500 > LG800 in complete agreement with the moisture content of the fuels (Table 1). Pyrolysis and gasification stages are clearly separated with regard to the temperature regime they take place. In the temperature range between 150–650 °C, mass loss is 22.6, 21.6, 13.8, and 4% for LG, LG300, LG500, and LG800, respectively (Table 2), following the order of the volatile matter content (Table 1). In this temperature range, mass loss is attributed to the primary and secondary devolatilization reactions, including the release of volatile matter, degradation of loosely bonded macromolecules, and thermal decomposition of aliphatic and aromatic structures [62]. The gasification process, for all cases, is initiated at higher temperatures compared to pyrolysis, mainly attributed to the Boudouard reaction, which is thermodynamically favored at temperatures above 700 °C [18]. All fuels present almost the same weight loss in this temperature regime (Table 2). Notably, for LG800, both the initiation and peak temperatures are ca. 50 °C higher compared to the other fuels, possibly due to the higher fixed carbon content along with the lower volatile matter content. The insignificant mass loss presented above 920 °C is associated with the decomposition of the remaining inorganic matter. Notably, the residual mass of all fuels at 920 °C is identical to the content of unreacted ash (Table 1). The high concentration of minerals in both raw Greek lignite and chars can be easily noticed.
Table 2 summarizes the temperature range of the different processes along with the characteristic parameters used to describe the reactivity of fuels during the pyrolysis and gasification stages. Figure 5b presents the gasification reaction rate, R, as described by Equation (2). Below 650 °C, the reactivity of fuels can be mainly ascribed to primary and secondary devolatilization and oxidation reactions due to the release of oxygenated compounds. In this temperature regime, the reactivity of fuels is consistent with the order of mass loss and volatile matter content, i.e., LG ≈ LG300 > LG500 > LG800 (Figure 5a, Table 1).
In the temperature range of 650–920 °C, where the Boudouard reaction is thermodynamically favored, the gasification rate of fuels reveals an opposite trend compared to the pyrolysis stage, i.e., LG800 > LG500 > LG300 > LG. The parameters (da/dt)max and (da/dt)mean were calculated in order to quantitatively evaluate the comprehensive gasification characteristic index (S), according to Equation (3). The comprehensive gasification characteristic index follows the same trend regarding the reaction rate for both pyrolysis and gasification stages, implying the validity of the S index to assess the reactivity of raw lignite and as-produced chars.
Moreover, a linear relationship between the S index and AD1/AG ratio was revealed (Figure 6), further confirming the suitability of first-order Raman band ratios to correlate the gasification reactivity of fuels with their structure. Similar findings have also been reported for different carbonaceous feedstock [54,63,64]. For instance, Wang et al. [63] explored the effect of carbonization conditions on the gasification reactivity of biocarbon. The enhanced reactivity of chars prepared at 800 °C compared to chars produced at 600 °C was ascribed to the higher fixed carbon content and lower volatile matter content. Yu et al. [54] examined the effect of pyrolysis conditions on the CO2 gasification reactivity of lignite and bituminous coal chars. Thermal pretreatment under an N2 atmosphere of up to 900 °C led to the formation of amorphous carbon structures on the surface of the coals. Further increase in the pyrolysis temperature resulted in the gradual modification of these amorphous structures to more ordered ones, indicating the formation of chars with higher graphitization degree and thus lower gasification reactivity.

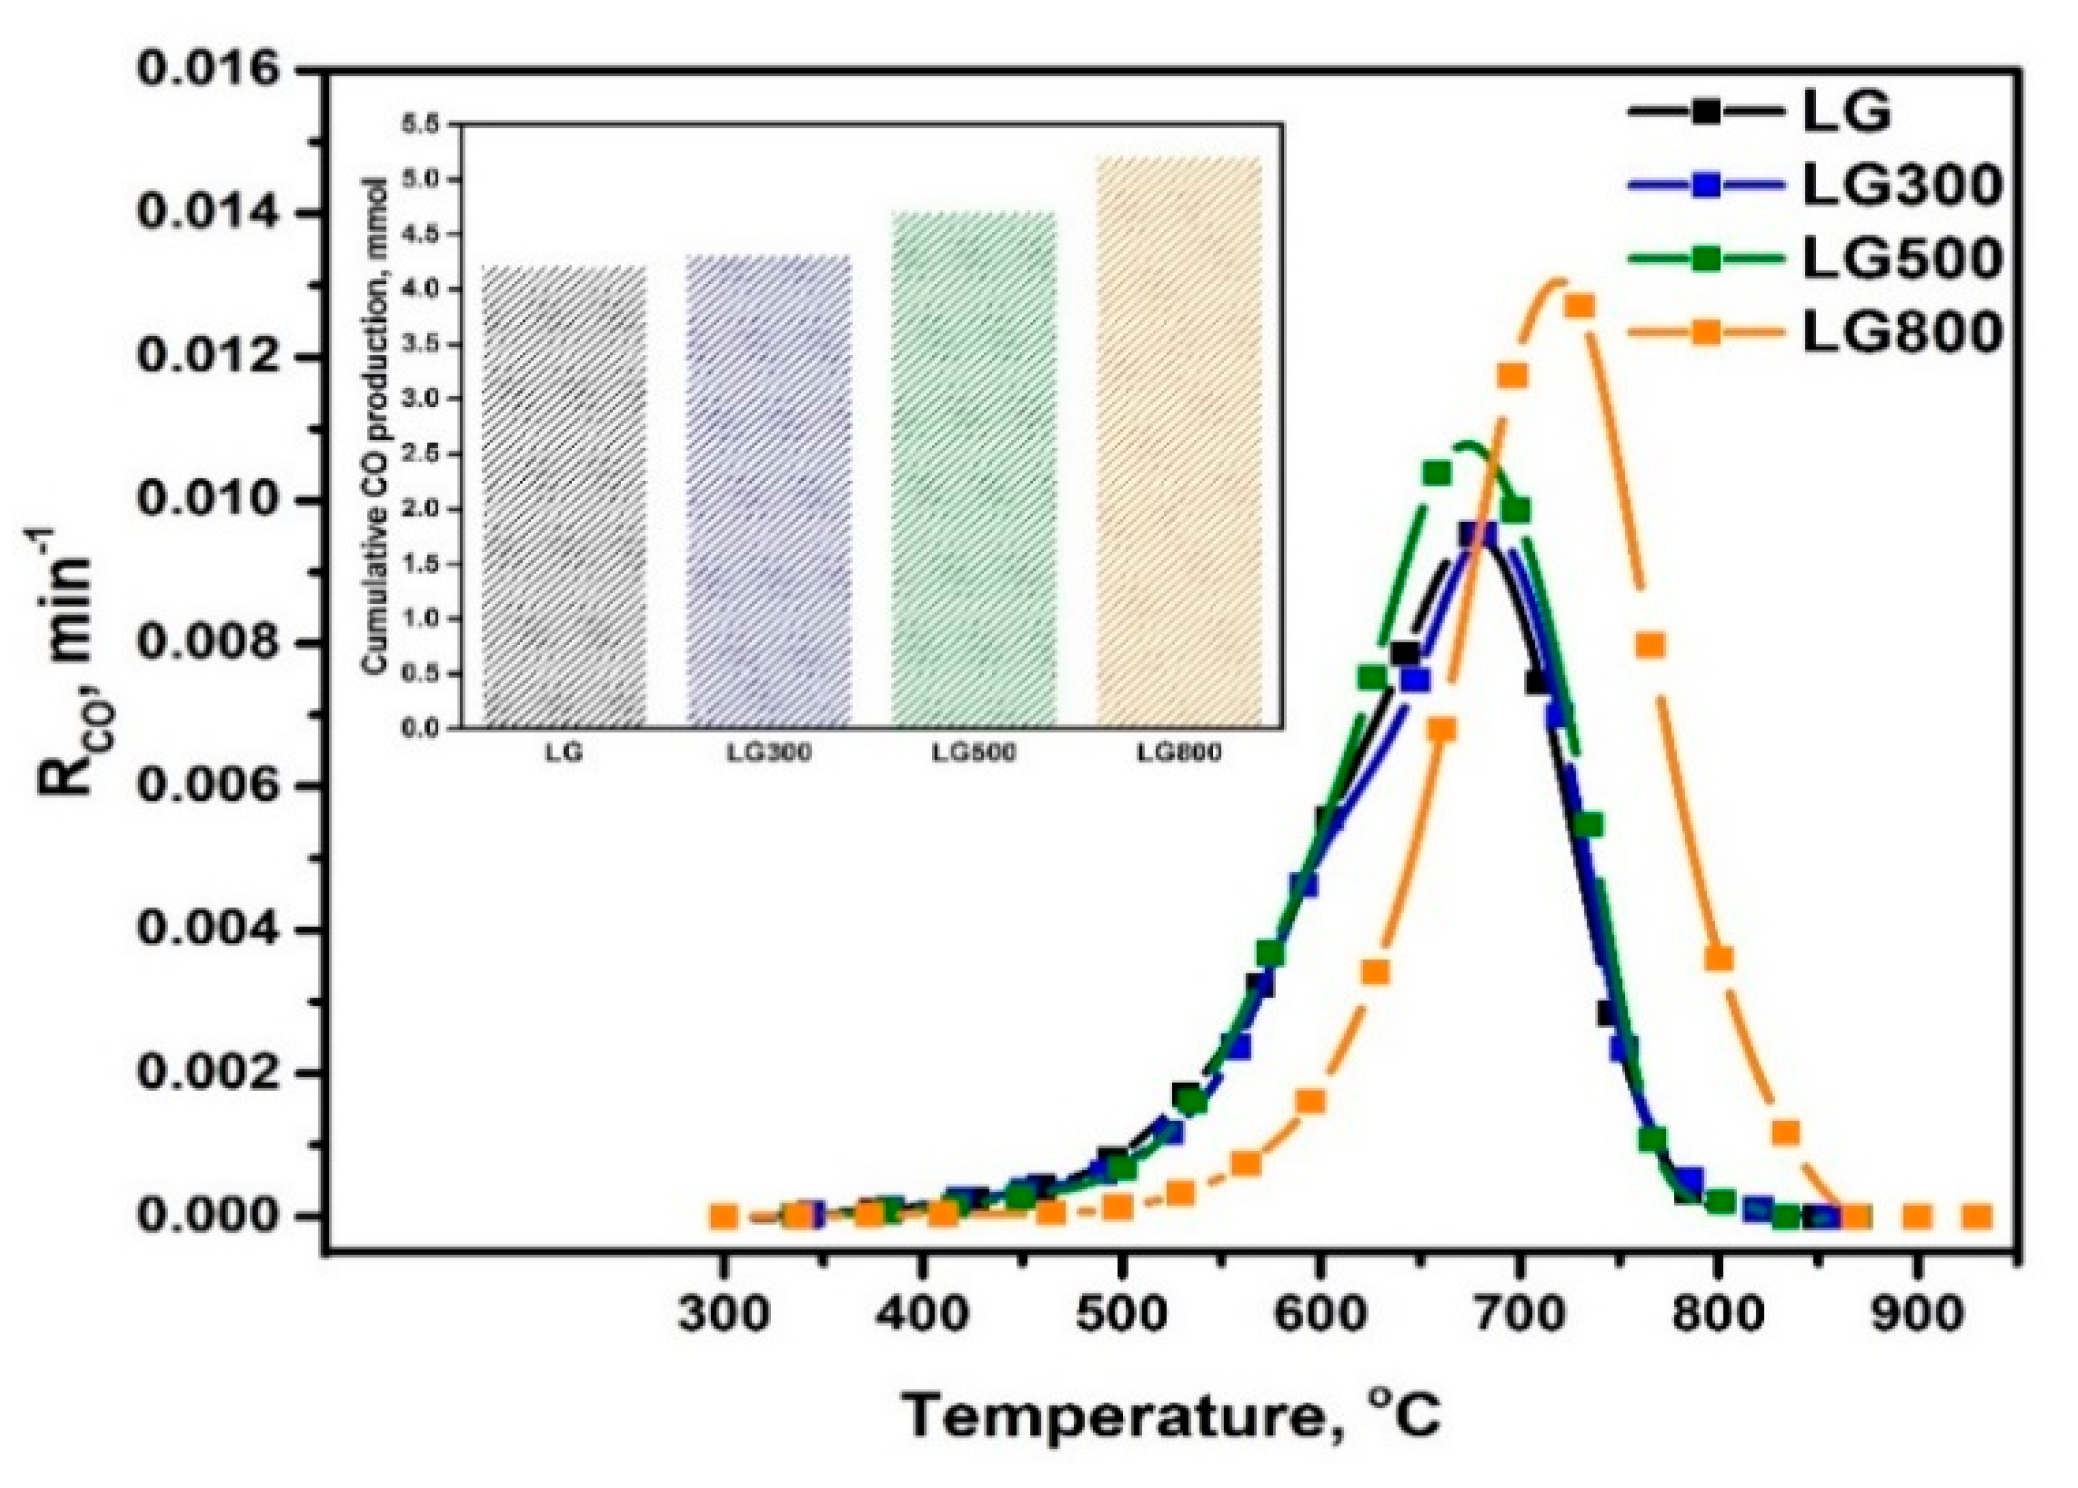
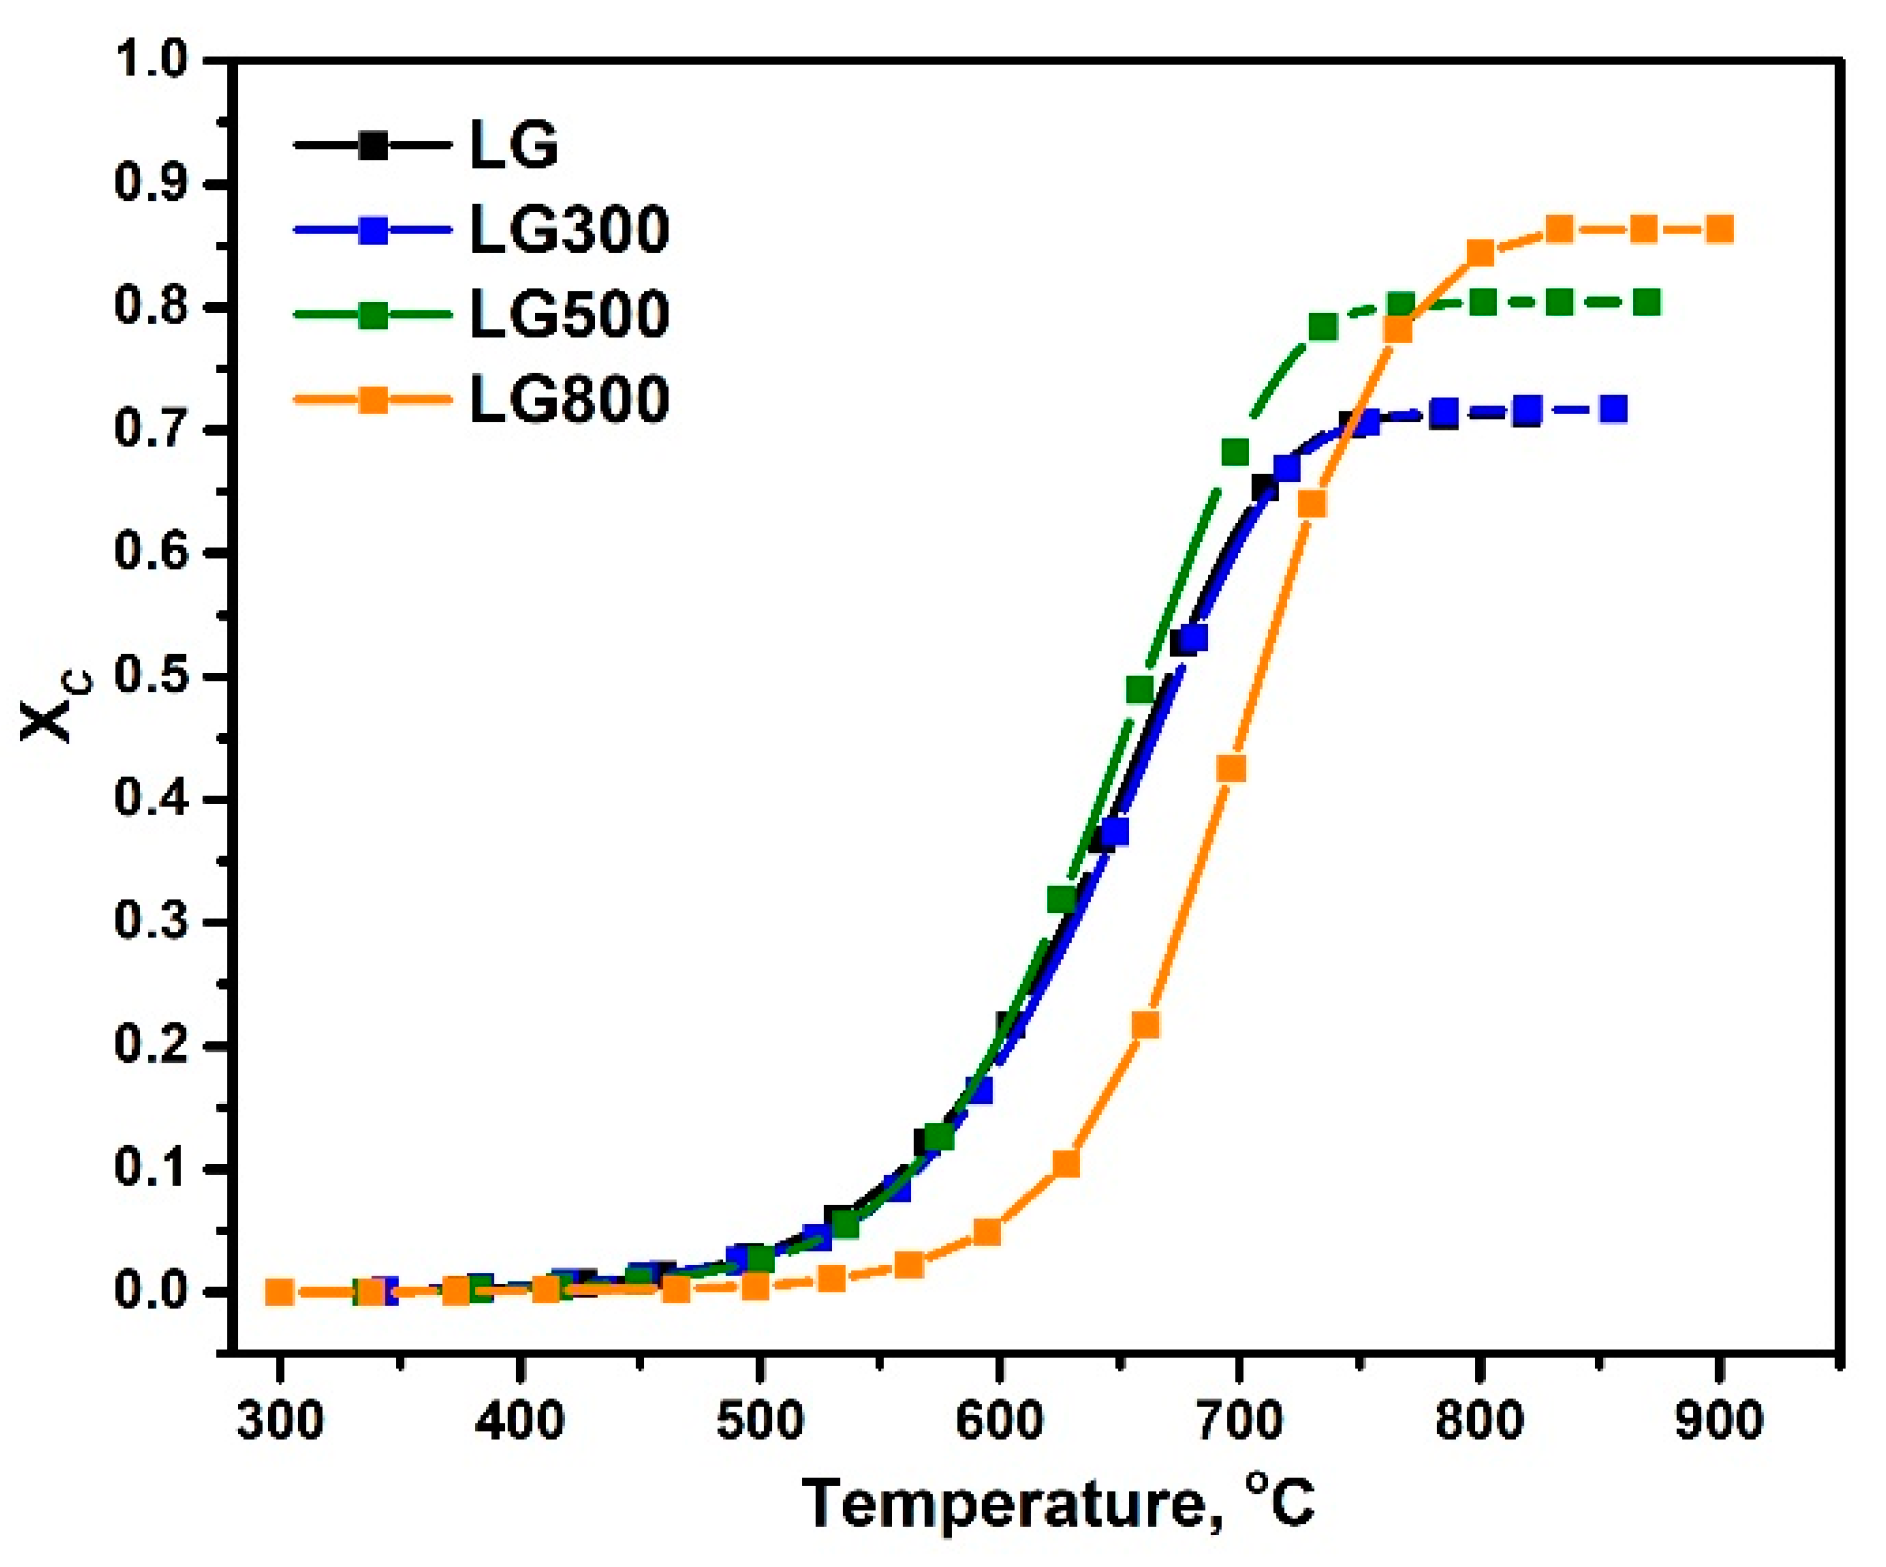
3.3. Syngas Production during Non-Isothermal Gasification Tests

Figure 7 depicts the instant CO production rate, RCO (min−1), and the cumulative CO production (mmol) as a function of temperature during the non-isothermal CO2 gasification of raw lignite and as-produced chars.
In all cases, carbon monoxide was the main product of gasification, started to appear at ca. 550 °C, reaching its maxima between 650 and 750 °C, and then gradually decreased at temperatures higher than ca. 850 °C until fuel depletion. The production of CO is enhanced with temperature due to the high endothermic nature of the Boudouard reaction [17,32,33,65,66,67]. The LG300 sample exhibited a similar RCO value with raw lignite LG (0.009 min−1), whereas the chars at 500 °C (LG500) and 800 °C (LG800) showed increased instant CO production rates equal to 0.011 and 0.013 min−1, respectively. Notably, the maximum RCO for LG800 shifts at a slightly higher temperature (ca. 730 °C) than the maxima for LG, LG300, and LG500. These findings are consistent with the gasification reaction rate (Figure 5b) and the comprehensive gasification characteristic index (Table 2) obtained by the thermogravimetric analysis. This behavior is also reflected in the higher CO production of LG800 (5.2 mmol) compared to other samples (4.7, 4.3, and 4.1 mmol for LG500, LG300, and LG, respectively), as shown in the inset of Figure 6.
Figure 8 shows the effect of thermal pretreatment temperature on carbon to CO conversion efficiency during non-isothermal CO2 gasification of both raw and as-produced lignite chars. Notably, there are three distinct temperature regimes. At temperatures up to 600 °C, where the devolatilization and tar thermal cracking reactions are prevailing, carbon conversion to CO is almost equal for LG, LG300, and LG500 (XC = 0.2), whereas it is almost zero for the LG800 sample. This behavior implies that CO production for LG800 is essentially negligible during the pyrolysis step reactions due to its very low volatile matter content (Table 1) compared to LG, LG300, and LG500 samples. At the temperature regime between 600 and 750 °C, carbon starts to react with CO2, resulting in a significant CO production. At 750 °C, XC follows the order LG500 (0.81) > LG800 (0.78) > LG300 (0.71) ≈ LG (0.70). At higher temperatures, the carbon conversion for raw and thermally treated lignite chars at 300 and 500 °C reaches a plateau, whereas LG800 exhibits a slight increase up to 800 °C where Xc levels off at ca. 0.90. The superior behavior of LG800 can be attributed to its enhanced fixed carbon content as well as to its more disordered surface structure compared to LG, LG300, and LG500 samples, as previously discussed.
Apart from CO, which is the primary product during CO2 gasification of lignite and as-produced chars, substantially lower amounts of hydrogen and methane were also detected at the effluent of the reactor. Figure 9 illustrates the H2 and CH4 concentration profiles over the examined temperature range. By integrating the corresponding curves in Figure 9a, the cumulative hydrogen production was calculated, and it was found equal to ca. 0.1 mmol for LG and LG300 and 0.08 mmol for LG500 and LG800. Remarkably, for LG and LG300 fuels, hydrogen production appears in the temperature range between 300 and 600 °C, while for LG500 and LG800 samples, H2 evolution is shifted to higher temperatures (600–700 °C). In general, during CO2 gasification, hydrogen is mainly derived by the rapture of the hydrogen rich-matrix in lignite’s structure during the devolatilization step [68]. In this regard, the evolution of H2 during LG and LG300 gasification with CO2, which is maximized at ca. 450 °C, can be attributed to the dehydrogenation of aliphatic and alicyclic structures [69].
Methane production (Figure 9b) was favored at temperatures up to ca. 600 °C, being, however, two orders of magnitude lower compared to CO, i.e., 0.017 mmol, 0.016 mmol, and 0.008 mmol for LG, LG300, and LG500, respectively, following the order of volatile matter content. In the case of LG and LG300, CH4 appeared between 300 and 500 °C and can be attributed to the thermal cracking of alkyl- and aryl-ether bonds as well as to tar cracking reactions [69,70]. In LG500, methane was released in the temperature range between 500 and 600 °C, resulting from the breakage of strongly bonded functional groups such as methyl and methylene [70]. The almost negligible production of methane in the case of the LG800 sample is in solid agreement with its limited volatile matter content compared to the other fuel samples.

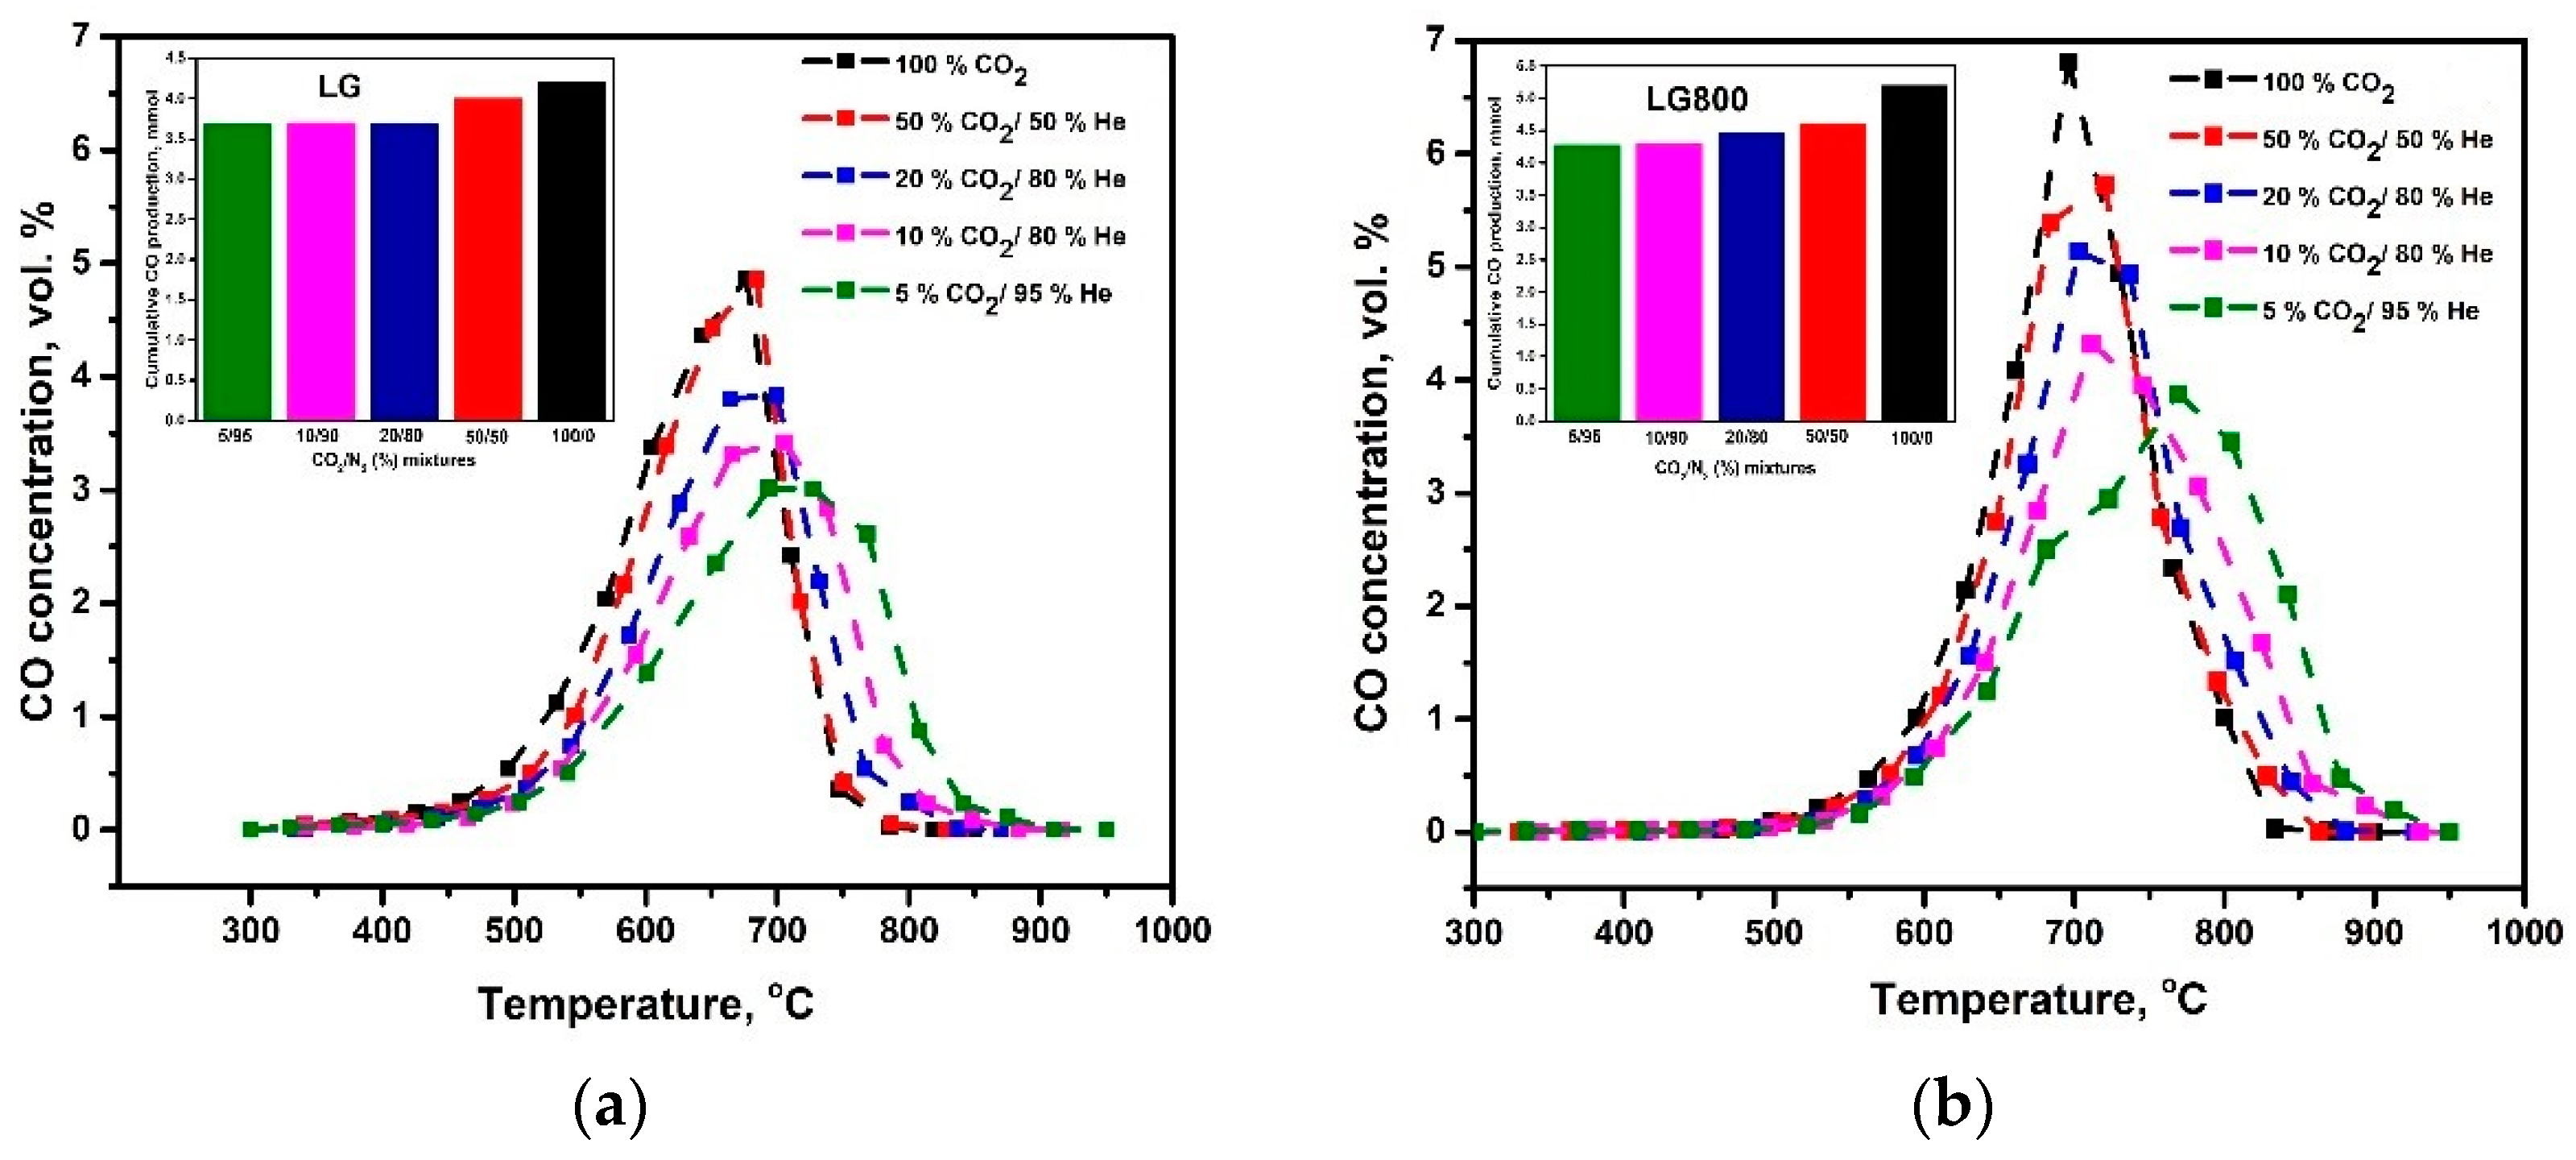
Effect of CO2 Concentration on the Gasification Performance

The CO2 gasification process is regarded as an integrated approach to convert industrial captured CO2 emissions to a CO-rich gas mixture that can be used to produce value-added chemicals. There are many industrial processes where CO2 is emitted in large quantities and its concentration in flue gases varies depending on the application [71,72]. Therefore, it is worth examining the effect of CO2 concentration in the gasifying agent mixture on CO production.
Figure 10 presents the outlet CO concentration profiles in the examined temperature range and the overall production of CO (mmol) under different CO2/He mixtures as gasifying agents and for two representative samples, i.e., LG and LG800. For both fuels, upon increasing CO2 concentration from 5 vol.% CO2/He to pure CO2, CO generation steadily increases, with the effect being more pronounced in the case of LG800 char. Interestingly, as the amount of CO2 decreases, the CO concentration profiles are shifted to higher temperatures retarding at the same time the complete depletion of fuels. In the case of LG and for CO2 concentrations higher than 50 vol.%, the differences in CO production are marginal. This indicates that for CO2 concentrations above 50 vol.%, the process is taking place under excess CO2 conditions. However, this is not the case for LG800, where an increase in CO production is observed upon increasing the CO2 content in the gasifying agent from 50 vol.% to pure CO2 flow. This could be attributed to the higher fuel quantity entering the gasification stage and the increased fixed carbon content of LG800, in agreement with relevant studies [66,70,73,74,75,76].

3.4. Syngas Production during Isothermal CO2 Gasification Tests

The pristine lignite sample, LG, and the char at 800 °C, LG800, were further examined during isothermal CO2 gasification tests at 800 °C under the batch mode of operation. Slow pyrolysis of raw coals at such high temperatures leads to more energy condensed fuels, as in the case of LG800, with higher fixed carbon content and much less volatility compared to pristine lignite (Table 1). A mild operation temperature of 800 °C was selected to perform the experiments since at higher temperatures agglomeration and melting phenomena are enhanced, posing several challenges in the design and operation of gasifiers [77].
Figure 11 depicts the evolution of syngas constituents over time on stream for LG and LG800 fuel samples until fuel depletion. Focusing on the CO concentration profile, two distinct areas are clearly observed in both cases. Regarding the LG sample, the presence of CO in the first 4 min is mainly ascribed to the devolatilization and tar cracking reactions, which occur during the pyrolysis step. On the contrary, CO evolution at t > 4 min is attributed to the Boudouard reaction, which is thermodynamically favored at 800 °C. The CO concentration profile exhibited a second peak at t = 5 min and then decreased exponentially with time due to fuel consumption. The corresponding concentration profiles for hydrogen and methane are only present during the first four minutes and then totally disappear, indicating the completion of the pyrolysis step and confirming that both H2 and CH4 are mainly derived through the thermal cracking reactions.
Significant differences are observed in the case of the LG800 sample. The pyrolysis stage lasts about 3 min, a shorter period compared to raw lignite (LG). In this first stage, both H2 and CH4 concentrations are clearly lower than the corresponding pyrolysis stage of LG in accordance with the difference in the volatile matter content of LG and LG800 samples (Table 1). Again, the concentration profiles of H2 and methane sharply decreased over time on stream, denoting the end of the pyrolysis step. At t > 3 min, CO concentration exhibits a notable increase showing a second maximum peak at t = 10 min, and then gradually decreases upon fuel’s depletion at ca. 80 min. For both fuels, the process involves two different distinct phases: a rapid pyrolysis stage followed by the slow char gasification stage via the Boudouard reaction.
The previous observations are quantitatively mirrored in syngas production, depicted in Figure 12. Carbon monoxide, derived from both pyrolysis and gasification stages, is the primary product, followed by lower quantities of hydrogen and negligible amounts of methane (Figure 12a). The overall production of hydrogen was equal to ca. 2.8 and 2.0 mmol for LG and LG800, respectively. Larger differences were observed for CO production. LG800 produced almost two times higher CO (28 mmol) compared to LG (13.8 mmol) and thus substantial higher amounts of syngas. Figure 12b depicts the individual contribution of pyrolysis and gasification stages to the overall CO production, where it identifies as the enhanced share of char gasification in the case of LG800 char. This indicates that the gasification process is significantly affected by the fuel thermal treatment history. The ex-situ char, LG800, exhibited better gasification performance in terms of syngas production compared to the as-derived “in-situ char” after the devolatilization stage.
Figure 13 shows the corresponding instant CO production rate (RCO, min−1) and carbon to CO conversion (XC) as a function of time on stream during CO2 gasification of LG and LG800 samples at 800 °C. The CO production rate for both fuels is sharply increased until carbon conversion (XC) of c.a. 0.2, corresponding to the devolatilization and tar thermal cracking stage. Interestingly, both the raw lignite and the ex-situ produced char at 800 °C did not reveal any substantial differences concerning instant CO production rate, indicating the insignificant effect of thermal pretreatment on the CO formation rate during this step. Remarkably, the two examined fuels illustrated a different behavior during the gasification stage. In the case of LG, RCO is drastically decreased and almost nullified at Xc ≈ 0.55. Comparably, RCO illustrated a gradual descending trend for the LG800 sample and became equal to zero when complete conversion of carbon was achieved. Notably, the instant CO production rate for LG800 during the gasification stage was clearly higher than LG. The pronounced gasification performance of LG800 can be presumably ascribed to its higher fixed carbon content and disordered surface structure compared to raw lignite.
The aforementioned considerations were also highlighted by other researchers in relevant studies dealing with the isothermal gasification of fossil and bio-based solid fuels [40,43,66,78,79,80,81]. For instance, Porada et al. [81] examined CO production during CO2 gasification of coals and their chars under isothermal conditions at 750, 850, and 950 °C. They concluded that the enhanced CO production of coal chars was attributed to the higher fixed carbon and ash content of coal chars due to the pyrolysis pretreatment stage. Xie et al. [43] noticed that the thermal pretreatment of raw coal led to 1–6 times higher CO production in the case of coal char pyrolyzed at 750 °C.

4. Conclusions

The CO2 gasification performance of pristine Greek lignite fuel and ex-situ produced chars under various pyrolysis protocols, and its correlation with their structural/chemical properties, was systematically examined in the present work. The thermal pretreatment of raw lignite under an inert atmosphere at different temperatures led to significant alterations in the chemical composition and structure of as-produced chars. Notably, by increasing the thermal treatment temperature, the fuel undergoes several modifications leading to less ordered and more active surface structures, as confirmed by the observed trend of AD1/AG and AG/Aall Raman band area ratios. The reactivity of fuels, in terms of mass loss, was evaluated by TG analysis under a CO2 reactive atmosphere. During the devolatilization phase, the reactivity of fuels is in accordance with the order of volatile matter content, i.e., LG ≈ LG300 > LG500 > LG800, whereas at higher temperatures, the gasification performance follows the opposite behavior compared to the pyrolysis stage, i.e., LG800 > LG500 > LG300 > LG. A linear relationship between the comprehensive characteristic gasification index, S, and the band area ratio AD1/AG was revealed, confirming the suitability of first-order Raman band ratios to correlate the gasification reactivity with the structure of the different fuels. Syngas production was monitored during both non-isothermal and isothermal batch mode gasification tests. In both cases, CO was the primary product with its production following the order of fuels reactivity during the gasification stage. The higher amount of fuel, which remains after devolatilization and enters the gasification stage, along with the higher fixed carbon content and the more disordered surface structure, are the key factors that presumably lead to the pronounced gasification performance of LG800 compared to raw lignite and chars at 300 and 500 °C.

Author Contributions

A.L., V.D.B., L.Z., M.A.M.-M., and J.A.M. contributed to samples preparation and characterization; A.L contributed to gasification studies; G.E.M., M.K., and C.A. contributed to the conception, design, and results interpretation; G.E.M., M.K., and C.A. validated the results and administered the project. A.L. wrote the original draft. Finally, G.E.M., M.K., and C.A. reviewed, edited, and submitted the manuscript in the final form. All authors have read and agreed to the published version of the manuscript.

Funding

This research was co-financed by the European Union and Greek national funds through the Operational Program Competitiveness, Entrepreneurship and Innovation, under the call RESEARCH-CREATE-INNOVATE (project code: T1EDK-01894). Funds from the MCIN/AEI/10.13039/501100011033 (Grant PID2020-115334GB-I00) are also acknowledged.

Institutional Review Board Statement

Not applicable.

Informed Consent Statement

Not applicable.

Data Availability Statement

Not applicable.

Conflicts of Interest

The authors declare no conflict of interest.

References

  1. Martins, F.; Felgueiras, C.; Smitkova, M.; Caetano, N. Analysis of fossil fuel energy consumption and environmental impacts in european countries. Energies 2019, 12, 964. [Google Scholar] [CrossRef] [Green Version]
  2. Looney, B. Statistical Review of World Energy, 2020, 69th ed.; Bp: London, UK, 2020; Volume 69, p. 66. [Google Scholar]
  3. IEA. Coal 2020; IEA: Paris, France, 2020; p. 124. [Google Scholar]
  4. International Energy Agency. Energy Policies IEA Countries: Greece 2017 Review; IEA: Paris, France, 2017. [Google Scholar]
  5. Directorate-General for Research and Innovation (European Commission). Europe’s 2030 Climate and Energy Targets. Research & Innovation Actions; Directorate-General for Research and Innovation (European Commission): Bruxelles, Belgium, 2021; Volume 3. [Google Scholar]
  6. Pavloudakis, F.; Roumpos, C.; Karlopoulos, E.; Koukouzas, N. Sustainable rehabilitation of surface coal mining areas: The case of greek lignite mines. Energies 2020, 13, 3995. [Google Scholar] [CrossRef]
  7. Karasmanaki, E.; Ioannou, K.; Katsaounis, K.; Tsantopoulos, G. The attitude of the local community towards investments in lignite before transitioning to the post-lignite era: The case of Western Macedonia, Greece. Resour. Policy 2020, 68, 101781. [Google Scholar] [CrossRef]
  8. Zhang, J.; Wang, Z.; Zhao, R.; Wu, J. Gasification of shenhua bituminous coal with CO2: Effect of coal particle size on kinetic behavior and ash fusibility. Energies 2020, 13, 3313. [Google Scholar] [CrossRef]
  9. Kapusta, K. Effect of lignite properties on its suitability for the implementation of underground coal gasification (UCG) in selected deposits. Energies 2021, 14, 5816. [Google Scholar] [CrossRef]
  10. Zdeb, J.; Howaniec, N.; Smoliński, A. Utilization of carbon dioxide in coal gasification—An experimental study. Energies 2019, 12, 140. [Google Scholar] [CrossRef] [Green Version]
  11. Czajka, K.M. Gasification of coal by CO2: The impact of the heat transfer limitation on the progress, reaction rate and kinetics of the process. Energies 2021, 14, 5569. [Google Scholar] [CrossRef]
  12. Jewulski, J.; Skrzypkiewicz, M.; Struzik, M.; Lubarska-Radziejewska, I. Lignite as a fuel for direct carbon fuel cell system. Int. J. Hydrog. Energy 2014, 39, 21778–21785. [Google Scholar] [CrossRef]
  13. Zabaniotou, A.; Mitsakis, P.; Mertzis, D.; Tsiakmakis, S.; Manara, P.; Samaras, Z. Bioenergy technology: Gasification with internal combustion engine application. Energy Procedia 2013, 42, 745–753. [Google Scholar] [CrossRef] [Green Version]
  14. Li, H.; Xu, N.; Fang, Y.; Fan, H.; Lei, Z.; Han, M. Journal of Materials Science & Technology Syngas production via coal char-CO 2 fluidized bed gasification and the effect on the performance of LSCFN//LSGM//LSCFN solid oxide fuel cell. J. Mater. Sci. Technol. 2018, 34, 403–408. [Google Scholar]
  15. Selvatico, D.; Lanzini, A.; Santarelli, M. Low Temperature Fischer-Tropsch fuels from syngas: Kinetic modeling and process simulation of different plant configurations. Fuel 2016, 186, 544–560. [Google Scholar] [CrossRef]
  16. You, S.; Ok, Y.S.; Tsang, D.C.W.; Kwon, E.E.; Wang, C.H. Towards practical application of gasification: A critical review from syngas and biochar perspectives. Crit. Rev. Environ. Sci. Technol. 2018, 48, 1165–1213. [Google Scholar] [CrossRef] [Green Version]
  17. Lahijani, P.; Zainal, Z.A.; Mohammadi, M.; Mohamed, A.R. Conversion of the greenhouse gas CO2 to the fuel gas CO via the Boudouard reaction: A review. Renew. Sustain. Energy Rev. 2015, 41, 615–632. [Google Scholar] [CrossRef]
  18. Renganathan, T.; Yadav, M.V.; Pushpavanam, S.; Voolapalli, R.K.; Cho, Y.S. CO2 utilization for gasification of carbonaceous feedstocks: A thermodynamic analysis. Chem. Eng. Sci. 2012, 83, 159–170. [Google Scholar] [CrossRef]
  19. Roncancio, R.; Gore, J.P. CO2 char gasification: A systematic review from 2014 to 2020. Energy Convers. Manag. X 2021, 10, 100060. [Google Scholar] [CrossRef]
  20. Mondal, P.; Dang, G.S.; Garg, M.O. Syngas production through gasification and cleanup for downstream applications—Recent developments. Fuel Process. Technol. 2011, 92, 1395–1410. [Google Scholar] [CrossRef]
  21. Pohořelý, M.; Jeremiáš, M.; Svoboda, K.; Kameníková, P.; Skoblia, S.; Beňo, Z. CO2 as moderator for biomass gasification. Fuel 2014, 117, 198–205. [Google Scholar] [CrossRef] [Green Version]
  22. Jayaraman, K.; Gökalp, I.; Jeyakumar, S. Estimation of synergetic effects of CO2 in high ash coal-char steam gasification. Appl. Therm. Eng. 2017, 110, 991–998. [Google Scholar] [CrossRef]
  23. Xiang, Y.; Cai, L.; Guan, Y.; Liu, W.; Cheng, Z.; Liu, Z. Study on the effect of gasification agents on the integrated system of biomass gasification combined cycle and oxy-fuel combustion. Energy 2020, 206, 118131. [Google Scholar] [CrossRef]
  24. Bielowicz, B. The suitability of Polish lignite for gasification. Clean Technol. Environ. Policy 2019, 21, 1115–1130. [Google Scholar] [CrossRef] [Green Version]
  25. Liu, S.; Zhao, H.; Liu, X.; Li, Y.; Zhao, G.; Wang, Y.; Zeng, M. Effect of hydrothermal upgrading on the pyrolysis and gasification characteristics of baiyinhua lignite and a mechanistic analysis. Fuel 2020, 276, 1–12. [Google Scholar] [CrossRef]
  26. Skodras, G.; Nenes, G.; Zafeiriou, N. Low rank coal—CO2 gasification: Experimental study, analysis of the kinetic parameters by Weibull distribution and compensation effect. Appl. Therm. Eng. 2015, 74, 111–118. [Google Scholar] [CrossRef]
  27. Łabojko, G.; Kotyczka-Morańska, M.; Plis, A.; Ściazko, M. Kinetic study of polish hard coal and its char gasification using carbon dioxide. Thermochim. Acta 2012, 549, 158–165. [Google Scholar] [CrossRef]
  28. Liu, H.; Chen, T.; Fang, L. Evolution of char structure during non-isothermal low temperature pyrolysis of ZhunDong coal by microwave heating: A comparative study with conventional heating. J. Energy Inst. 2020, 93, 1195–1206. [Google Scholar] [CrossRef]
  29. Xi, J.; Liang, J.; Sheng, X.; Shi, L.; Li, S. Characteristics of lump lignite pyrolysis and the influence of temperature on lignite swelling in underground coal gasification. J. Anal. Appl. Pyrolysis 2016, 117, 228–235. [Google Scholar] [CrossRef]
  30. Jayaraman, K.; Gokalp, I.; Bonifaci, E.; Merlo, N. Kinetics of steam and CO2 gasification of high ash coal-char produced under various heating rates. Fuel 2015, 154, 370–379. [Google Scholar] [CrossRef]
  31. Gomez, A.; Vargas, M.; Mahinpey, N. A theoretical model to estimate steam and CO2 gasification rates based on feedstock characterization properties. Fuel Process. Technol. 2016, 149, 187–194. [Google Scholar] [CrossRef]
  32. Zhu, S.; Bai, Y.; Hao, C.; Li, F.; Bao, W. Investigation into the structural features and gasification reactivity of coal chars formed in CO2 and N2 atmospheres. J. CO2 Util. 2017, 19, 9–15. [Google Scholar] [CrossRef]
  33. Zhou, L.; Zhang, G.; Schurz, M.; Steffen, K.; Meyer, B. Kinetic study on CO2 gasification of brown coal and biomass chars: Reaction order. Fuel 2016, 173, 311–319. [Google Scholar] [CrossRef]
  34. Edreis, E.M.A.; Luo, G.; Yao, H. Investigations of the structure and thermal kinetic analysis of sugarcane bagasse char during non-isothermal CO2 gasification. J. Anal. Appl. Pyrolysis 2014, 107, 107–115. [Google Scholar] [CrossRef]
  35. Li, R.; Zhang, J.; Wang, G.; Ning, X.; Wang, H.; Wang, P. Study on CO2 gasification reactivity of biomass char derived from high-temperature rapid pyrolysis. Appl. Therm. Eng. 2017, 121, 1022–1031. [Google Scholar] [CrossRef]
  36. Tong, W.; Liu, Q.; Yang, C.; Cai, Z.; Wu, H.; Ren, S. Effect of pore structure on CO2 gasification reactivity of biomass chars under high-temperature pyrolysis. J. Energy Inst. 2020, 93, 962–976. [Google Scholar] [CrossRef]
  37. Kirtania, K.; Bhattacharya, S. CO2 gasification kinetics of algal and woody char procured under different pyrolysis conditions and heating rates. ACS Sustain. Chem. Eng. 2015, 3, 365–373. [Google Scholar] [CrossRef]
  38. Parvez, A.M.; Afzal, M.T.; Victor Hebb, T.G.; Schmid, M. Utilization of CO2 in thermochemical conversion of biomass for enhanced product properties: A review. J. CO2 Util. 2020, 40, 101217. [Google Scholar] [CrossRef]
  39. Irfan, M.F.; Usman, M.R.; Kusakabe, K. Coal gasification in CO2 atmosphere and its kinetics since 1948: A brief review. Energy 2011, 36, 12–40. [Google Scholar] [CrossRef]
  40. Chan, Y.H.; Syed Abdul Rahman, S.N.F.; Lahuri, H.M.; Khalid, A. Recent progress on CO-rich syngas production via CO2 gasification of various wastes: A critical review on efficiency, challenges and outlook. Environ. Pollut. 2021, 278. [Google Scholar] [CrossRef] [PubMed]
  41. Lampropoulos, A.; Binas, V.; Konsolakis, M. ScienceDirect Steam gasification of Greek lignite and its chars by co-feeding CO2 toward syngas production with an adjustable H2/CO ratio. Int. J. Hydrog. Energy 2021. [Google Scholar] [CrossRef]
  42. Jiang, J.; Yang, W.; Cheng, Y.; Liu, Z.; Zhang, Q.; Zhao, K. Molecular structure characterization of middle-high rank coal via XRD, Raman and FTIR spectroscopy: Implications for coalification. Fuel 2019, 239, 559–572. [Google Scholar] [CrossRef]
  43. Xie, Y.; Yang, H.; Zeng, K.; Zhu, Y.; Hu, J.; Mao, Q.; Liu, Q.; Chen, H. Study on CO2 gasification of biochar in molten salts: Reactivity and structure evolution. Fuel 2019, 254, 115614. [Google Scholar] [CrossRef]
  44. Xu, M.; Hu, H.; Yang, Y.; Huang, Y.; Xie, K.; Liu, H.; Li, X.; Yao, H.; Naruse, I. A deep insight into carbon conversion during Zhundong coal molten salt gasification. Fuel 2018, 220, 890–897. [Google Scholar] [CrossRef]
  45. Singh, K.P.; Kakati, M.C. Comprehensive models for predicting aromaticity of coals. Chem. Eng. Commun. 2003, 190, 1335–1347. [Google Scholar] [CrossRef]
  46. Sakintuna, B.; Yürüm, Y.; Çetinkaya, S. Evolution of carbon microstructures during the pyrolysis of Turkish Elbistan Lignite in the temperature range 700–1000 °C. Energy Fuels 2004, 18, 883–888. [Google Scholar] [CrossRef]
  47. Samaras, P.; Diamadopoulos, E.; Sakellaropoulos, G.P. The effect of mineral matter and pyrolysis conditions on the gasification of Greek lignite by carbon dioxide. Fuel 1996, 75, 1108–1114. [Google Scholar] [CrossRef]
  48. Lampropoulos, A.; Kaklidis, N.; Athanasiou, C.; Montes-Morán, M.A.; Arenillas, A.; Menéndez, J.A.; Binas, V.D.; Konsolakis, M.; Marnellos, G.E. Effect of Olive Kernel thermal treatment (torrefaction vs. slow pyrolysis) on the physicochemical characteristics and the CO2 or H2O gasification performance of as-prepared biochars. Int. J. Hydrog. Energy 2020, 46, 29126–29141. [Google Scholar] [CrossRef]
  49. Guo, W.; Wang, Y.; Lin, X.; Wang, G.; Zheng, P.; Yang, Y.; Mochida, I. Structure and CO2 Gasification Reactivity of Char Derived through Pressured Hydropyrolysis from Low-Rank Coal. Energy Fuels 2019, 33, 8032–8039. [Google Scholar] [CrossRef]
  50. Nawaz, S.; Butt, M.; Sheikh, N.; Hassan, M. Chemical, Microscopic and XRD Studies on Makerwal Coal. J. Fac. Eng. Technol. 2010, 16, 41–49. [Google Scholar]
  51. Zhu, X.; Sheng, C. Evolution of the char structure of lignite under heat treatment and its influences on combustion reactivity. Energy Fuels 2010, 24, 152–159. [Google Scholar] [CrossRef]
  52. He, X.; Liu, X.; Nie, B.; Song, D. FTIR and Raman spectroscopy characterization of functional groups in various rank coals. Fuel 2017, 206, 555–563. [Google Scholar] [CrossRef]
  53. Qi, J.; Fan, C.; Li, S. Characteristics of lignite char derived from oxy-pyrolysis. Fuel 2021, 291, 120261. [Google Scholar] [CrossRef]
  54. Yu, J.; Guo, Q.; Ding, L.; Gong, Y.; Yu, G. Studying effects of solid structure evolution on gasification reactivity of coal chars by in-situ Raman spectroscopy. Fuel 2020, 270, 117603. [Google Scholar] [CrossRef]
  55. Liu, X.; Zheng, Y.; Liu, Z.; Ding, H.; Huang, X.; Zheng, C. Study on the evolution of the char structure during hydrogasification process using Raman spectroscopy. Fuel 2015, 157, 97–106. [Google Scholar] [CrossRef]
  56. Ma, C.; Zou, C.; Zhao, J.; Shi, R.; Li, X.; He, J.; Zhang, X. Pyrolysis Characteristics of Low-Rank Coal under a CO-Containing Atmosphere and Properties of the Prepared Coal Chars. Energy Fuels 2019, 33, 6098–6112. [Google Scholar] [CrossRef]
  57. Liu, J.; Chen, L.; Wang, Y.; Fu, Y.; Guo, Y.; Zhang, Y. Studies of low-temperature pyrolysis characteristics of the binder cold-briquetted lignite-II: Three-phase pyrolytic products. J. Energy Inst. 2017, 90, 776–786. [Google Scholar] [CrossRef]
  58. Wang, M.; Roberts, D.G.; Kochanek, M.A.; Harris, D.J.; Chang, L.; Li, C.Z. Raman spectroscopic investigations into links between intrinsic reactivity and char chemical structure. Energy Fuels 2014, 28, 285–290. [Google Scholar] [CrossRef] [Green Version]
  59. Zhu, X.; Sheng, C. Influences of carbon structure on the reactivities of lignite char reacting with CO2 and NO. Fuel Process. Technol. 2010, 91, 837–842. [Google Scholar] [CrossRef]
  60. Baysal, M.; Yürüm, A.; Yıldız, B.; Yürüm, Y. Structure of some western Anatolia coals investigated by FTIR, Raman, 13C solid state NMR spectroscopy and X-ray diffraction. Int. J. Coal Geol. 2016, 163, 166–176. [Google Scholar] [CrossRef]
  61. Sun, J.; Feng, H.; Xu, J.; Jin, H.; Guo, L. Investigation of the conversion mechanism for hydrogen production by coal gasification in supercritical water. Int. J. Hydrog. Energy 2021, 46, 10205–10215. [Google Scholar] [CrossRef]
  62. Gmbh, B. Review of the kinetics of pyrolysis and hydropyrolysis in relation to the chemical constitution of coal. Fuel 1983, 63, 731–737. [Google Scholar]
  63. Wang, L.; Alsaker, N.; Skreiberg, O.; Hovd, B. Effect of carbonization conditions on CO2 gasification reactivity of biocarbon. Energy Procedia 2017, 142, 932–937. [Google Scholar] [CrossRef]
  64. Hussein, A.; Larachi, F.; Ziegler, D.; Alamdari, H. Effects of heat treatment and acid washing on properties and reactivity of charcoal. Biomass Bioenergy 2016, 90, 101–113. [Google Scholar] [CrossRef]
  65. Kandasamy, J.; Gökalp, I. Pyrolysis and Gasification Characteristics of High Ash Indian and Turkish Coals. Gasif. Low-Grade Feed. 2018. [Google Scholar] [CrossRef] [Green Version]
  66. Shahabuddin, M.; Kibria, M.A.; Bhattacharya, S. Evaluation of high-temperature pyrolysis and CO2 gasification performance of bituminous coal in an entrained flow gasifier. J. Energy Inst. 2021, 94, 294–309. [Google Scholar] [CrossRef]
  67. Wei, R.; Ren, L.; Geng, F. Gasification reactivity and characteristics of coal chars and petcokes. J. Energy Inst. 2021, 96, 25–30. [Google Scholar] [CrossRef]
  68. Porada, S. The reactions of formation of selected gas products during coal pyrolysis. Fuel 2004, 83, 1191–1196. [Google Scholar] [CrossRef]
  69. Xu, Y.; Zhang, Y.; Wang, Y.; Zhang, G.; Chen, L. Gas evolution characteristics of lignite during low-temperature pyrolysis. J. Anal. Appl. Pyrolysis 2013, 104, 625–631. [Google Scholar] [CrossRef]
  70. Gao, S.P.; Zhao, J.T.; Wang, Z.Q.; Wang, J.F.; Fang, Y.T.; Huang, J.J. Effect of CO2 on pyrolysis behaviors of lignite. Ranliao Huaxue Xuebao/J. Fuel Chem. Technol. 2013, 41, 257–264. [Google Scholar] [CrossRef]
  71. Abu-zahra, M.R.M.; Feron, P.H.M.; Versteeg, G.F. CO2 capture from power plants Part I. A parametric study of the technical performance based on monoethanolamine. Int. J. Greenh. Gas Control 2007, 1, 37–46. [Google Scholar] [CrossRef]
  72. Aaron, D.; Tsouris, C. Separation of CO2 from Flue Gas: A Review. Sep. Sci. Technol. 2011, 40, 2005. [Google Scholar] [CrossRef]
  73. Standish, N.; Tanjung, A.F.A. Gasification of single wood charcoal particles in CO2. Fuel 1988, 67, 666–672. [Google Scholar] [CrossRef]
  74. Kwon, T.W.; Kim, S.D.; Fung, D.P.C. Reaction kinetics of char-CO2 gasification. Fuel 1988, 67, 530–535. [Google Scholar] [CrossRef]
  75. Ahn, D.H.; Gibbs, B.M.; Ko, K.H.; Kim, J.J. Gasification kinetics of an Indonesian sub-bituminous coal-char with CO2 at elevated pressure. Fuel 2001, 80, 1651–1658. [Google Scholar] [CrossRef]
  76. Adánez, J.; Miranda, J.L.; Gavilán, J.M. Kinetics of a lignite-char gasification by CO2. Fuel 1985, 64, 801–804. [Google Scholar] [CrossRef]
  77. He, Q.; Guo, Q.; Ding, L.; Wei, J.; Yu, G. CO2 gasification of char from raw and torrefied biomass: Reactivity, kinetics and mechanism analysis. Bioresour. Technol. 2019, 293, 122087. [Google Scholar] [CrossRef]
  78. Ahmed, I.; Gupta, A.K. Characteristics of cardboard and paper gasification with CO2. Appl. Energy 2009, 86, 2626–2634. [Google Scholar] [CrossRef]
  79. Guizani, C. Effects of CO2 on the biomass pyro-gasification in High Heating Rate and Low Heating Rate conditions. Ph.D. Thesis, Ecole des Mines d’Albi-Carmaux, Albi, France, 2014; p. 277. [Google Scholar]
  80. Manera, C.; Perondi, D.; Barcellos, T.; Godinho, M. CO2 gasification of elephant grass in a fixed bed reactor. Sci. Cum. Ind. 2018, 6, 27–30. [Google Scholar] [CrossRef]
  81. Porada, S.; Czerski, G.; Grzywacz, P.; Makowska, D.; Dziok, T. Comparison of the gasification of coals and their chars with CO2 based on the formation kinetics of gaseous products. Thermochim. Acta 2017, 653, 97–105. [Google Scholar] [CrossRef]
Figure 1. XRD patterns of pristine lignite and as-produced chars (a), closer inspection of XRD patterns (b).
Energies 15 00679 g001
Figure 2. Raman spectra of raw lignite and as-produced chars.
Energies 15 00679 g002
Figure 3. Curve fitting of Raman spectra for raw lignite and as-produced chars.
Energies 15 00679 g003
Figure 4. AD1/AG and AG/Aall area ratios for all fuels.
Energies 15 00679 g004
Figure 5. Non-isothermal thermogravimetric analysis (a), and instant gasification rate (b), for raw lignite and chars under pure CO2 atmosphere.
Energies 15 00679 g005
Figure 6. Relationship between the comprehensive characteristic gasification index (S) and AD1/AG ratio.
Energies 15 00679 g006
Figure 7. Effect of temperature on the instant CO production rate, RCO, and the cumulative CO production (inset) for raw lignite and chars during non-isothermal CO2 gasification. Fuel: 100 mg, Flowrate: 30 cm3/min.
Energies 15 00679 g007
Figure 8. Effect of temperature on carbon conversion for raw lignite and chars during non-isothermal CO2 gasification. Fuel: 100 mg, Flowrate: 30 cm3/min.
Energies 15 00679 g008
Figure 9. H2 (a) and CH4 (b) evolution profiles for raw lignite and chars during non-isothermal CO2 gasification. Fuel: 100 mg, Flowrate: 30 cm3/min.
Energies 15 00679 g009
Figure 10. Effect of CO2 feed concentration on CO evolution profiles and overall CO production (inset) for raw lignite (a), and LG800 (b) samples. Fuel: 100 mg, Flowrate: 30 cm3/min.
Energies 15 00679 g010
Figure 11. Syngas composition with time on stream for LG (a) and LG800 (b) CO2 gasification at 800 °C. Fuel: 500 mg, Flowrate: 30 cm3/min.
Energies 15 00679 g011
Figure 12. Syngas production (a), and shares of pyrolysis and gasification steps to the overall CO production for LG and LG800 (b) during isothermal CO2 gasification tests at 800 °C. Fuel: 500 mg, Flowrate: 30 cm3/min.
Energies 15 00679 g012
Figure 13. Instant CO production rate and the corresponding carbon conversion vs. time on stream for LG and LG800 samples under isothermal CO2 gasification at 800 °C. Fuel: 500 mg, Flowrate: 30 cm3/min.
Energies 15 00679 g013
Table 1. Proximate and ultimate analysis of fuel samples.
FuelLGLG300LG500LG800
Proximate analysis (wt.%) adb
Fixed carbon17.9619.1221.8925.23
Volatile matter41.8538.8429.3111.79
Ash40.1842.0348.7962.97
Moisture7.673.362.820.91
Elemental analysis (wt.%) db
Carbon36.2236.3235.2632.01
Hydrogen2.942.751.751.01
Sulfur0.970.920.680.90
Nitrogen1.051.050.990.73
Oxygen *18.6316.9312.530.37
Aromaticity factor daf,a0.410.440.540.79
Aromaticity factor b0.390.420.470.74
Note: adb: air dry basis, db: dry basis, daf: dry ash-free basis, *: determined by difference, a: obtained from ultimate and proximate analysis, b: obtained from XRD analysis.
Table 2. Characteristic parameters of pyrolysis and gasification stages during non-isothermal thermogravimetric analysis under pure CO2 atmosphere.
FuelDevolatilization Stage
Temp. Range, °CWeight Loss,
%
da/dtmax, min−1da/dtmean,
min−1
S × 10−12
LG150–65022.60.0220.0141.85
LG300150–65021.60.0220.0141.85
LG500150–65013.80.0120.0090.68
LG800150–70040.0070.0020.22
FuelGasification Stage
Temp. Range,°CWeight Loss,
%
da/dtmax, min−1da/dtmean,
min−1
S × 10−12
LG650–920290.060.042.24
LG300650–920300.0640.0422.50
LG500650–920310.0760.0513.69
LG800700–920310.10.0595.43
Publisher’s Note: MDPI stays neutral with regard to jurisdictional claims in published maps and institutional affiliations.

