1. Introduction
Sustainable development and the potential irreversible loss of natural capital has recently been at the forefront of environmental, economic and social discussions globally. The energy-related CO
2 emissions produced by the building and construction sectors amount to 37% [
1]. At the same time, the final energy demand for the building stock continues to rise as actions to increase energy efficiency have failed to compensate for the increasing floor area [
1]. In order to reduce these emissions, ambitious targets and policies have been set by governments and other entities. For example, EU targets address a notable CO
2 reduction of 80% to 95% by 2050 compared to 1990 levels [
2]. Moreover, wide deployment of renewable energy technologies is already an indispensable element of energy planning, and it is anticipated that, together with electrical energy storage technologies, they will play an important role in the future built environment [
3], assisting significantly towards the reduction of carbon emissions.
This paper focuses on residential buildings, which are the biggest energy-consuming sector from the industrial, commercial, transport and other sectors [
4]. In 2020, global residential building energy consumption accounted for 22% of total energy use [
1]. Speaking of energy consumption in the UK residential sector, space heating, for which energy from fossil fuels is typically used, held the largest part and primarily contributed to the direct building CO
2 emissions with a share of 77% [
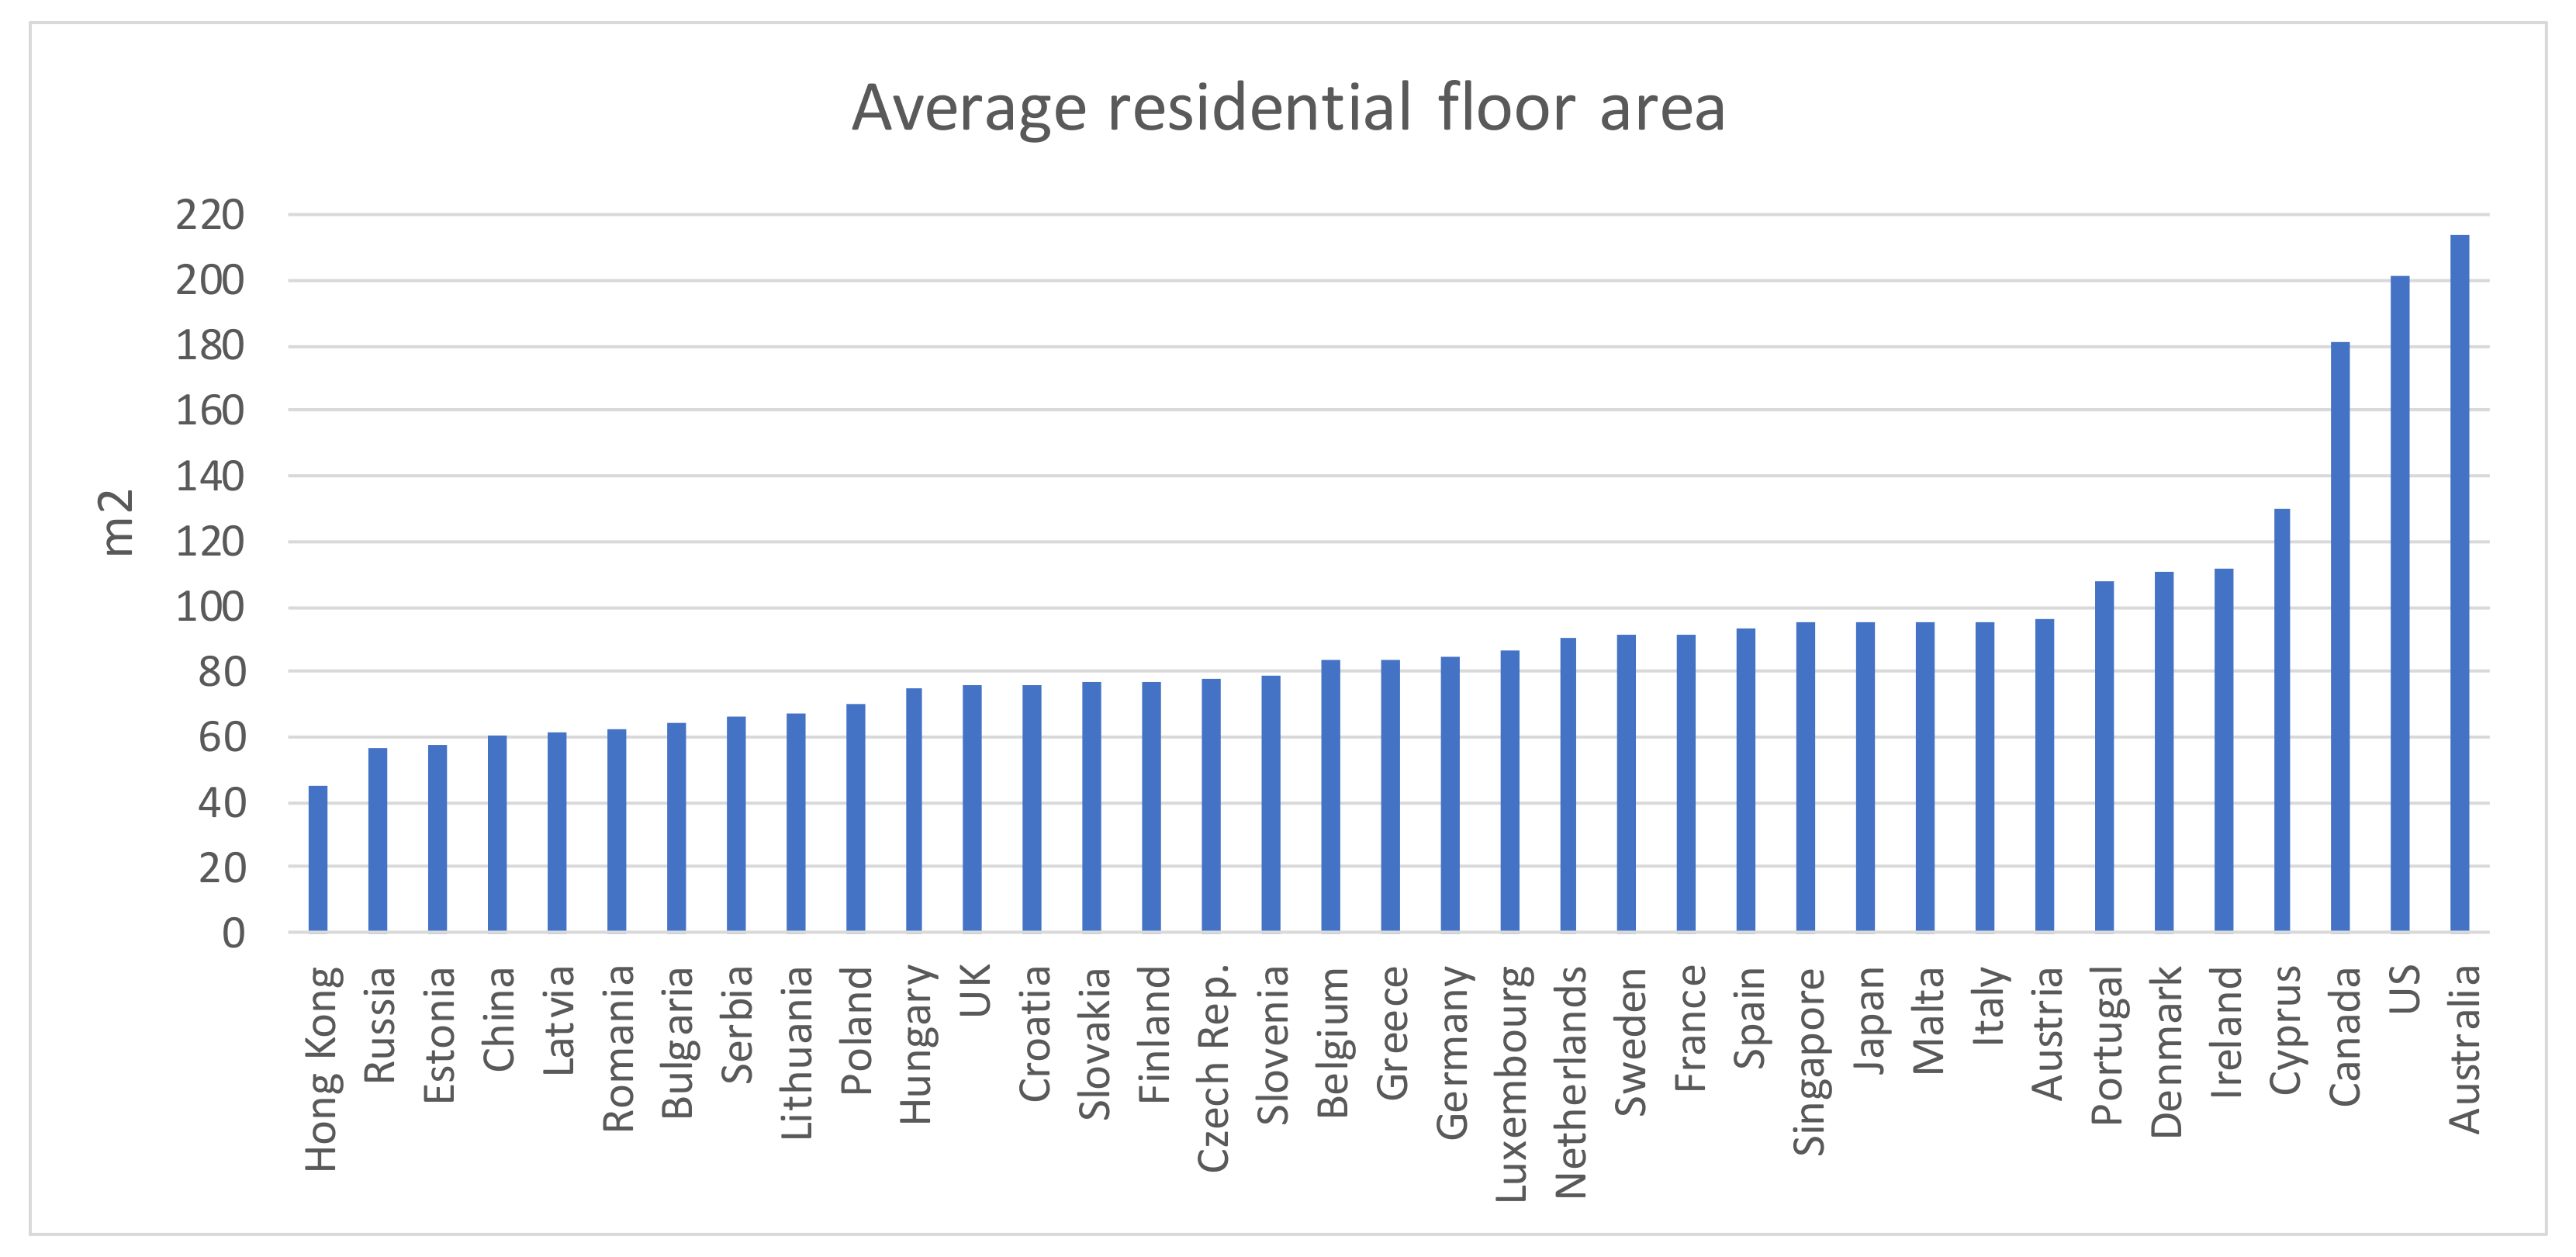
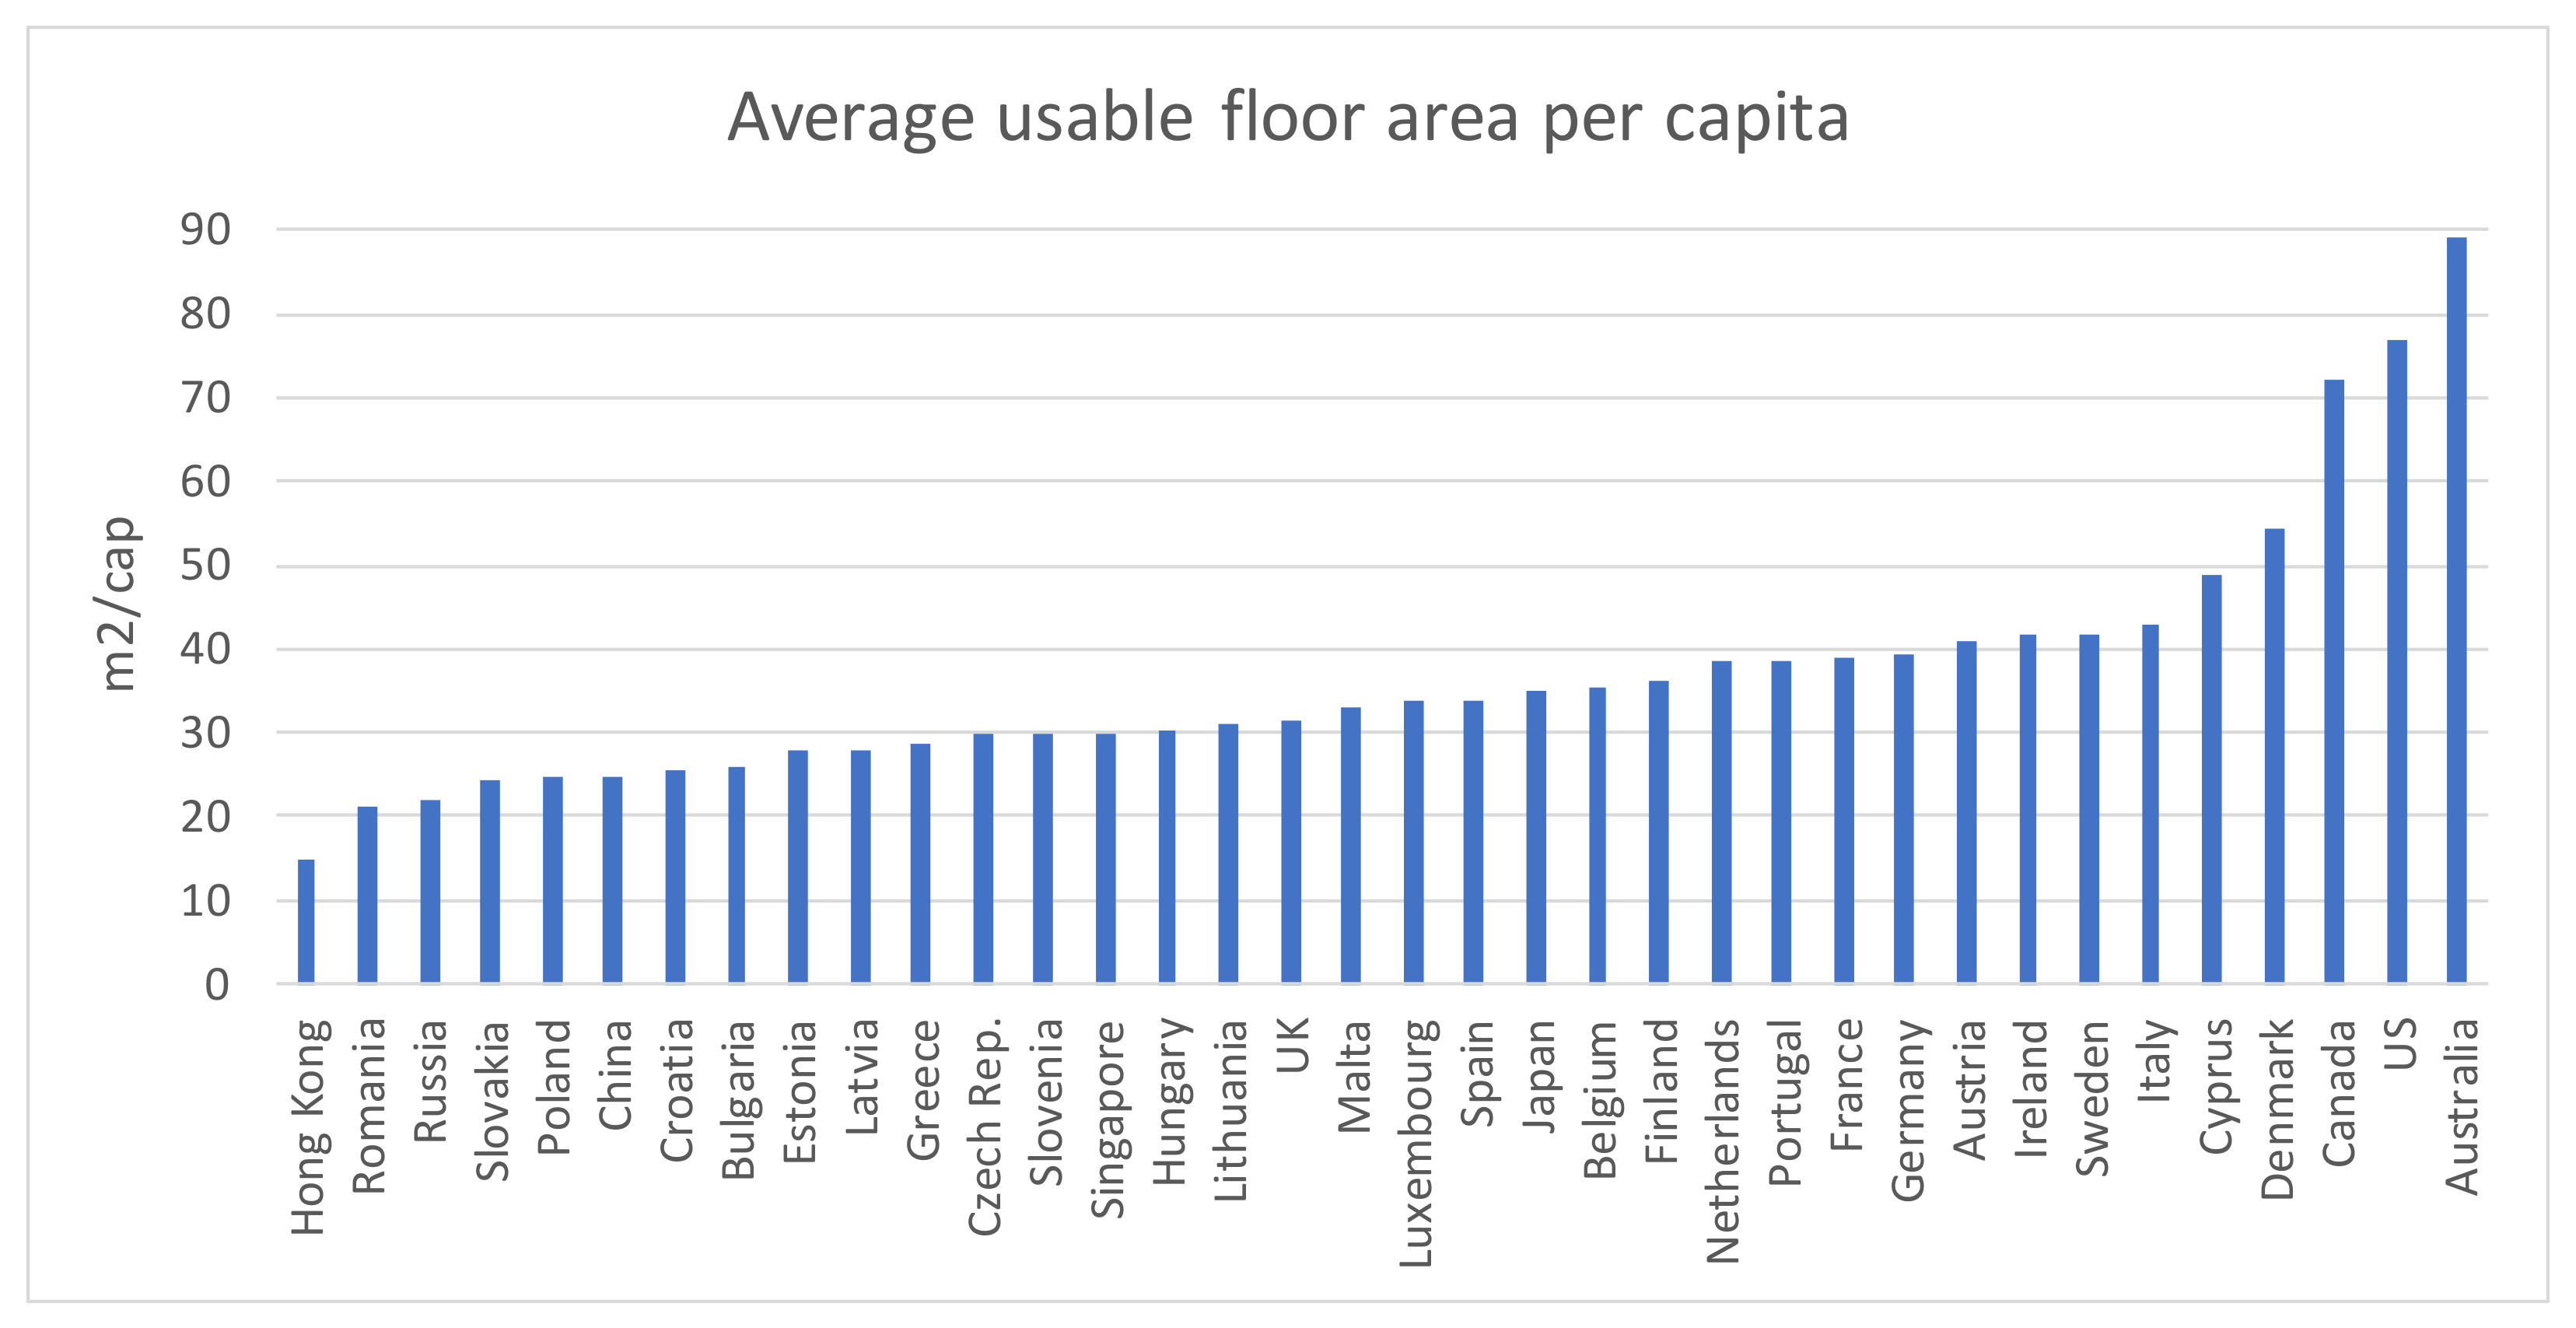
5]. Furthermore, there is great diversity in dwelling sizes around the world and in some contexts, size is decreasing. Average dwelling sizes around the world and useful floor area per capita are shown in
Figure 1 and
Figure 2, respectively. The standard deviation for the data presented in
Figure 1 is 36.4 and for the data in
Figure 2 is 15.2. These values are considered low and show that data are clustered closely around the mean, which is 92 m
2 and 37 m
2/cap, respectively. As [
6] claim, space availability and dwelling sizes in many countries, such as the UK, Italy, Sweden and Portugal, are getting smaller over the years.
Looking particularly at the UK, there are multiple studies [
6,
11,
12,
13] showing that, since the 1970’s, houses tend to be smaller. More specifically, they are currently as much as 32% smaller [
14], but they also tend to have more, but smaller, rooms [
15]. This is driven by a number of factors, such as the smaller plot sizes that have been observed in newer homes [
16], the developers’ aspiration to maximise output by building higher volumes of smaller homes in certain high-demand urban areas and the increase in the number of office buildings being converted to flats [
14]. From a housing typology viewpoint, more than 41.9% of Europeans lived in flats in 2017 [
17]. A 2012 UK survey found that there was an increase in the share of purpose-built flats in the residential building stock [
16]. It also showed that, although they comprised only 16% of the total stock, they comprised nearly half of all homes built after 2002. Flats have the lowest average floor space of all domestic housing typologies, with a typical floor area of around 50 m
2 to 60 m
2 and are less able to provide additional space through alterations or extensions [
16]. Challenges in internal dwelling space availability might also arise in constrained site developments in towns and cities, where there is a need to house the growing populations on a global scale. Smaller houses could potentially be associated with a lower carbon footprint, lower energy consumption and increased social and financial sustainability.
Considering the ongoing reduction in absolute and per capita dwelling floor areas, the increasing proportion of purpose-built flats in the total housing stock, and the limited space availability in constrained site developments, it is evident that internal dwelling space is becoming scarcer and more valuable in many major cities around the world.
In a parallel line of inquiry, energy storage systems require a certain amount of space to be accommodated. According to British Standards [
18], batteries should be accommodated in a protected space, such as in individual rooms in buildings or cupboards and enclosed spaces in the interior or exterior of a building. When this is successfully implemented, it ensures protection of the battery from adverse environmental conditions, a potential fire or water risk and similar hazards. Given the inherent battery hazards, such as high voltage, explosion or corrosion, the battery accommodation should also be able to provide a safe environment for people, preventing access unless required [
18]. Similar aspects are considered as requirements for battery installation in guidance documents, for example, the Code of Practice on Electrical Energy Storage Systems by the Institution of Engineering and Technology [
19]. It is, therefore, important to establish the space requirements needed for the various renewable energy storage solutions available so that developers can design for their inclusion as efficiently as possible.
From a practical perspective, energy storage cost is highly dependent on the operation and cost of electricity purchase [
20,
21]. This means that, while a particular storage application might be economically viable in a certain context, it might not be viable in others. Battery systems exhibit high costs at present but are expected to have a significant cost reduction in the near future [
20,
22]. For example, according to IRENA’s [
22] projections, by 2030, the total installed cost of a Li-ion battery could fall by 54–61%; that of a NaS battery by 56%; that of a NaNiCl battery by 60%; that of flow batteries by 66% and the cost of a Lead-acid battery by about 50%. While prices are falling rapidly, currently, batteries are economically viable, mainly in off-grid applications, the transport sector and behind-the-meter uses [
22]. However, the cost decrease is expected to bring a wider range of economically viable applications, as battery performance (e.g., efficiency, lifecycle etc.) will improve due to continued research and development (R&D). The residential sector is, therefore, likely to play a key role regarding battery storage use cases in 2030, driven by economic opportunities to provide demand–response services, such as peak-shifting and peak-shaving [
22].
This paper presents an exploration of the electrical storage requirements for sub-daily autonomy at different residential scales through the exploration of four case studies. The study aim is to investigate the architectural implications of battery storage applications on different residential building scales in the UK. The investigation in this research work considered battery integration in grid-connected systems, providing sub-daily autonomy. The study outlines the considerations that architects and designers need to give in the design of buildings as the world transitions to a low carbon future and considering the increased deployment of nearly zero-energy buildings [
23]. This is an introductory paper and provides a range of prices and options to give readers an idea of the extent to which the use of batteries is practical.
There are no existing models or tools specifically addressing the size and location of energy storage systems [
24]; therefore, this study partially addresses this knowledge gap. In addition, current literature has focused on the sizing of storage systems for power systems applications [
25], low voltage networks [
26], microgrids [
27,
28,
29,
30,
31] and wind-powered isolated grids in a remote areas [
32], addressing parameters such as storage capacity, cost, reliability, frequency control, operation performance and energy management strategies, but not physical space requirements. This paper is, therefore, the first to focus on the physical size of storage systems required to provide particular storage characteristics. The presented work facilitates informed design decisions regarding energy storage systems from a designer and end user viewpoint.
The remainder of this paper is divided into four sections and is organised as follows.
Section 2 presents the methodology used in this study, outlining the four end-use cases investigated. By calculating the nominal capacity for the nine battery technologies, their applicability at different scales, their spatial, mass and cost requirements can then be estimated (
Section 3). The results are then discussed in
Section 4. The conclusions of the study are presented in
Section 5.
2. Materials and Methods
The research used a quantitative case study methodology and focused on the investigation of nine battery technologies based on potential technology and energy consumption scenarios in 2030, i.e., DR 2030 and Te 2030, presented in earlier studies conducted by the authors [
33,
34,
35,
36]. In brief, DR 2030 refers to a scenario addressing demand response through peak shifting in 2030 and Te 2030 to a scenario addressing the electrification of transport in 2030, by assuming one electric vehicle per household. Te 2030 is further classified into Te 2030 off-peak and Te 2030 on-peak. Te 2030 off-peak is used when off-peak EV charging is assumed, while Te 2030 on-peak is used when on-peak EV charging is assumed. To better understand the research trajectory, [
33] formed a review paper including technical and non-technical characteristics of battery storage technologies, the 2017 article [
34] looked at scenario building, the following publication [
35] focused on daily storage requirements, while the 2019 study [
36] investigated sub-daily autonomy periods, as is the case with this current paper. The difference between this study and [
36] is that the use case explored in [
36] assumed that the battery from an Electric Vehicle (EV) could contribute to overall residential consumption, while this study explores four different use cases that do not include EV contribution.
The battery types explored in this study include Pb-acid, NiCd, NiMH, Li-ion, NaNiCl, NaS, V-Redox, ZnBr and Zn-air. The methodology includes the calculation of the nominal capacity for the nine battery technologies at different residential scales, the assessment of their applicability at those scales and the estimation of their spatial and cost requirements. The methodology is similar to the one employed in an earlier study by the authors [
36], which investigated a different usage case; however, it is also summarised here to assist understanding and contribute to the comprehensiveness of this paper. The assumptions behind the scenarios relate to UK conditions. The housing energy data provides ranges, informing the effective required battery capacity. The lowest and highest consumption values used correspond to low and high consumption households, respectively. This study focuses on a neighbourhood in the UK served by a substation at the final (415/240V) stage of the distribution network in the UK. Based on current power supply constraints, a maximum of 75 households can be electrically heated at this supply level [
37]. This sets the upper boundary of the community scale in this study. All houses are assumed to be heated electrically without storage heating, grid-connected and coupled with renewable energy technologies in the form of photovoltaics (PVs) that convert solar energy to electricity. This study focussed on Class 1 standard domestic profile [
38], as it currently has a higher uptake. In addition, BRE [
39] expect a lower number of Class 2 customers in the medium term due to the lower use of electric storage heaters. This study does not consider systems interaction with the grid, e.g., PV export to the grid, as well as aggregation effects and control mechanisms [
40], as, although important, these are outside its scope. Three stages are used to indicate the battery storage requirements for the domestic buildings:
Calculation of the battery pack’s nominal capacity.
Assessment of the applicability of the nine battery technologies at the various scales.
Estimation of the batteries’ spatial and cost requirements, determined from their nominal capacity values.
The study derived two separate sets of data and graphs to cover the expected ranges of domestic demands. These are the ‘low’ and ‘high’ ranges in the figures.
The house PVs generate electricity during the day, and the study deems that surplus electricity is stored in a battery. Then the stored electricity is used during the evening and/or night hours to meet the house’s electricity requirements. It is assumed in this study that the battery is emptied each night, as suggested by [
41], which is relatively realistic if the household energy loads follow a similar pattern each day.
2.1. Case Studies
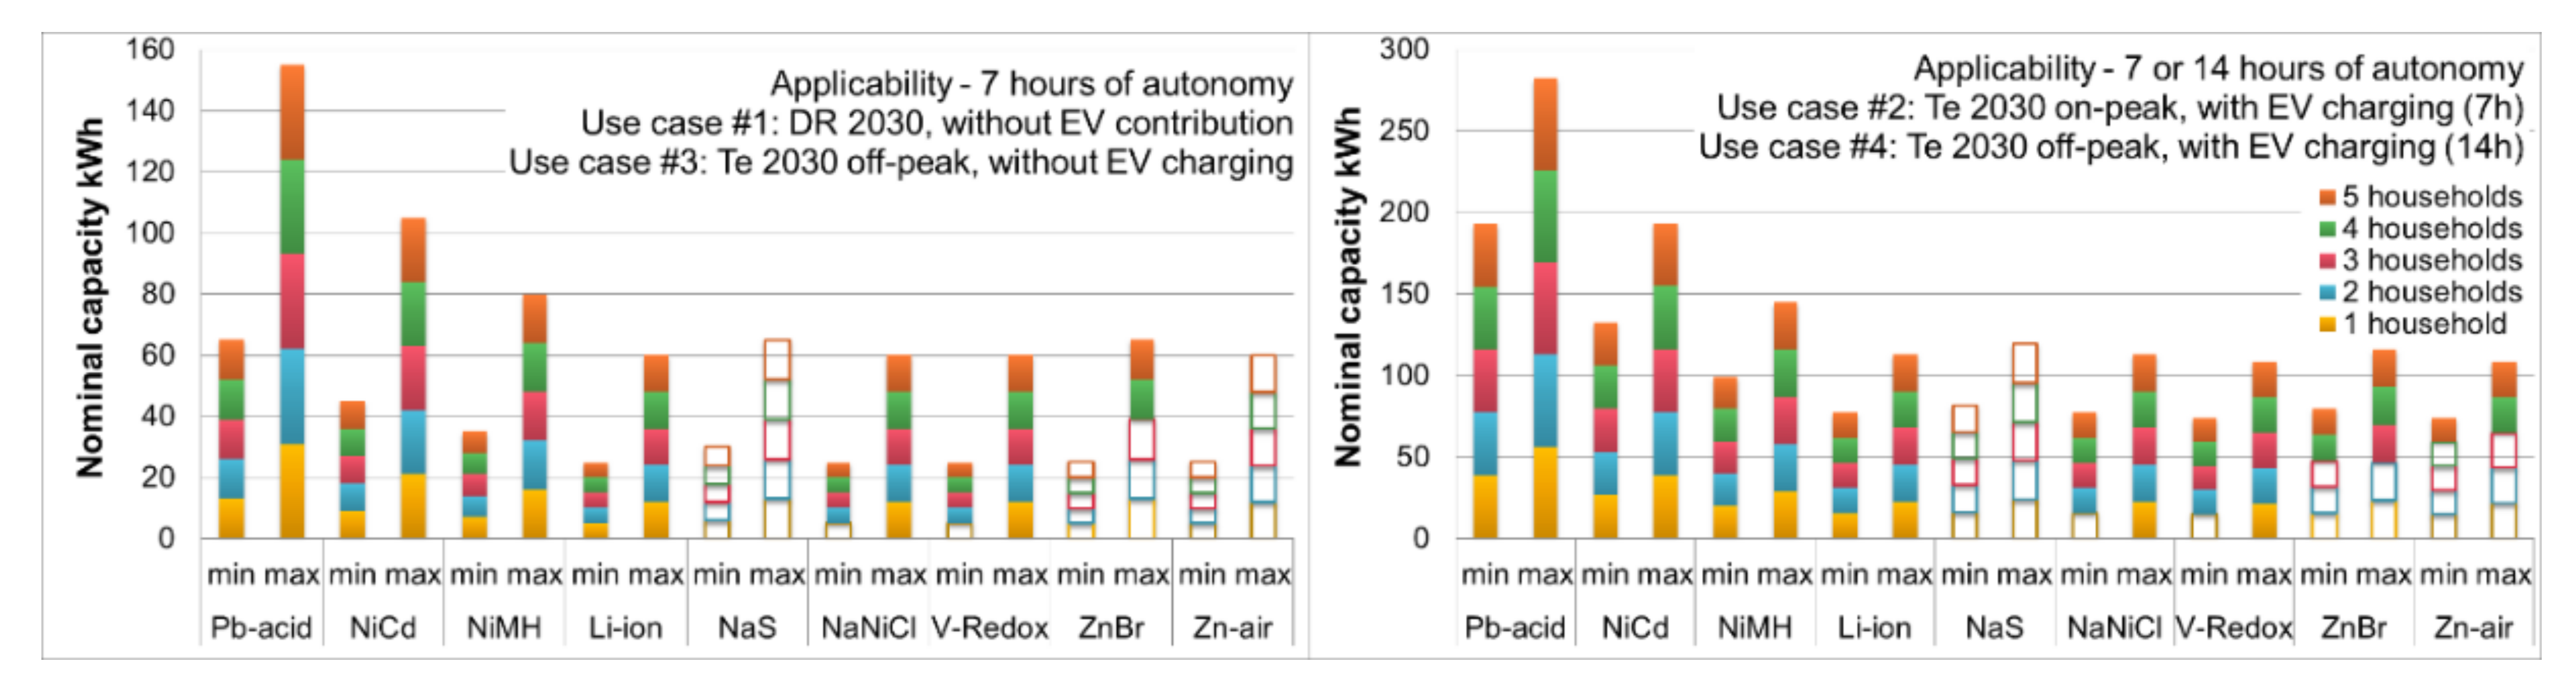
As the highest electricity requirement in residential buildings occurs on weekend days in winter, the end-use cases presented in this section use those values. Four usage cases were investigated in total, and more specifically, one usage case addressed DR 2030, another one Te 2030 on-peak, and two cases addressed Te 2030 off-peak. The use case for the DR 2030 study was a typical use of one of battery discharging in the evening hours, after charging during the day from PVs. The same scenario was used in two Te 2030 on-peak and Te 2030 off-peak studies, enabling exploration of the difference between the storage requirements, and especially the impact from charging an EV during evening hours (Te 2030 on-peak). In addition to these three case studies, another Te 2030 off-peak study accounts for the overnight charging of an EV in the early morning hours. These usage cases complement the usage case presented in the earlier study conducted by the authors [
36], in which the charged EV feeds back to the home in the evening hours.
Assumptions
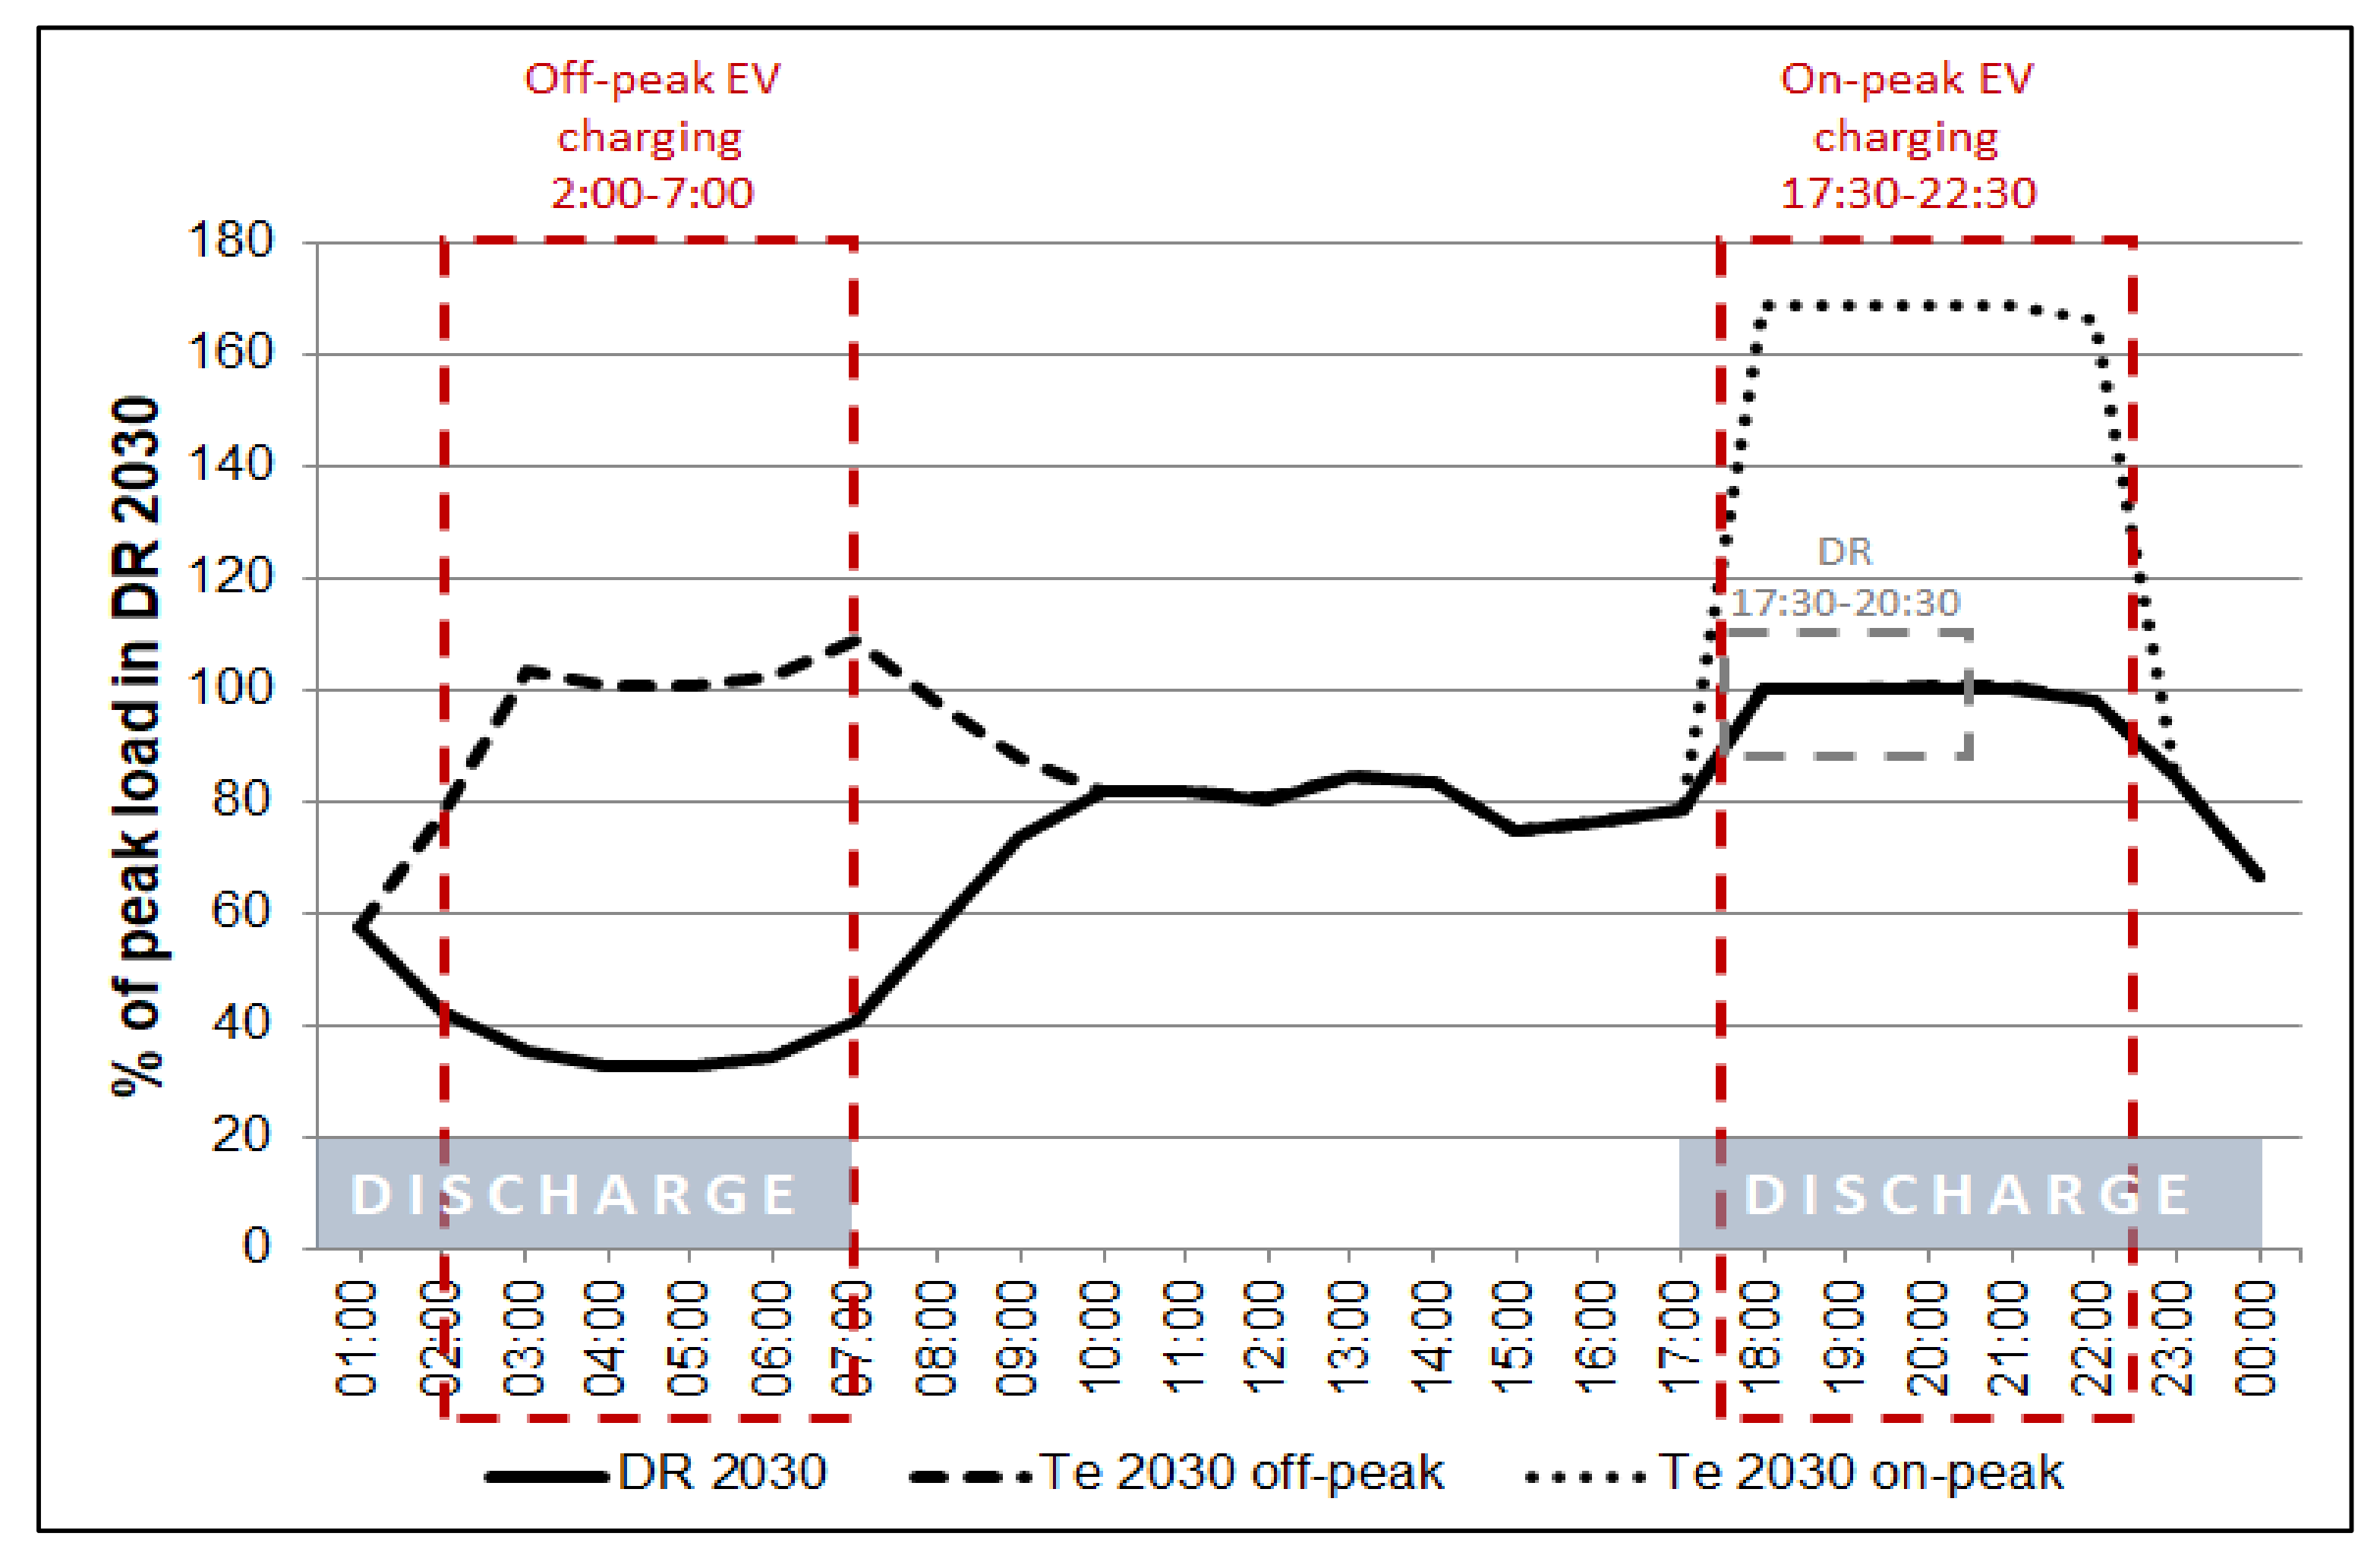
Figure 3 show the model uses a battery discharge period (grey band) from 17:00 to 00:00 for all case study scenarios. That requires 7 h of storage capacity, as [
42] suggests. This timing was chosen because load shifting in the DR scenario begins at 17.30. This is the time at which the evening peak load takes place (as shown in
Figure 3). The use of the battery during that time could also reduce costs, considering that high electricity cost at peak times is driven by high demand. Therefore, efficient energy management and cost savings, but also the consideration that the home would typically start to be occupied at that time when the occupants would be back from work, were the drivers behind these timings. Due to the current uncertainty of the potential smart grid load [
43,
44], it is assumed in this paper that there will still be a very basic Time of Use (ToU) pricing regime by 2030, with low-cost electricity applied after midnight. However, based on currently active research and development in this area, further moves towards dynamic pricing schemes in the domestic sector are expected, which could challenge this assumption.
To account for the electricity demand increase between 17:00 and 17:30, (
Figure 3), it was assumed that the battery starts being discharged at 17:00. The time which the battery would stop being discharged in the cases of 7 h of storage capacity in the DR 2030 and Te 2030 on-peak case studies is determined by both the load and the grid electricity prices being much lower after 00:00. Therefore, storage discharge is only required until 00:00.
An additional battery discharge period from 00:00 to 07:00 is assumed for the Te 2030 EV case study. Therefore, a total of 14 h of storage capacity allow for both evening demand and EV charging. This requires storage discharge from 17:00 to 07:00 on the following day (as indicated with the grey band). This timing was assumed as the EV would likely be needed in the morning after 07:00 by the occupants to get to work.
The four case studies are shown in
Table 1. The minimum and maximum overall daily electricity consumption values on a weekend’s winter day for a single electrically-heated household are derived from [
34] and used in each scenario. These are 7.1 kWh and 17 kWh, respectively. This is the basis of the calculation of the consumption from 17:00 to 00:00.
Based on the load profiles presented in [
34], the consumption for this time (17:00–00:00) in DR 2030 was 43% of the overall daily consumption, and considering the minimum and maximum energy use values per day, this is equivalent to 3.1 kWh and 7.3 kWh as the minimum and maximum daily values, respectively, as presented in
Table 1. This demand addressed case studies #1 and #3 and is used in
Figure 3.
In the three use cases in which the provision for storage also included the EV charging needs (Te 2030 scenarios), the value of 6 kWh was additionally used to account for additional consumption. This value was derived from information provided by Element Energy [
45] and the UK Department for Transport [
46]. More specifically, the study considered an electrical energy consumption of 0.16 kWh/km [
45] and a distance of 37 km covered daily [
46], resulting in an EV contribution of 6 kWh. Therefore, the minimum value becomes 9.1 kWh and the maximum value 13.3 kWh, as applied in case studies #2 and #4. The electrical energy consumption values for the different periods in
Table 1 equal the battery’s requirement in effective capacity
Ceff/h. These data are used to provide an understanding of the EV’s contribution; however, actual and current data should be used, if possible, for a more representative use of the EV in domestic applications.
2.2. Electricity Storage Capacity and Technology Applicability at the Different Scales
For each of the nine battery technologies, the nominal capacity, applicability, floor area, volume, mass, investment cost and levelised cost of electricity (LCOE) were estimated based on the methodology presented in an earlier publication by the authors [
35]. The nominal capacity
for each battery technology in the four case studies used Equation 1 below based on the effective storage capacity
from
Table 1 and the associated values from
Table 2. Data in
Table 2 include assumed values for round-trip efficiency, DOD, temperature factor, ageing factor, design margin and inverter’s efficiency. It should be noted that the inverter efficiency is applied twice to account for the PV energy conversion to AC and then to DC to charge the battery, assuming similar efficiency (0.95% [
47]) from DC to AC and from AC to DC.
where:
is the battery’s round-trip efficiency;
DOD is the battery’s depth of discharge;
is the temperature factor;
is the ageing factor;
DM is the design margin;
is the inverter’s efficiency.
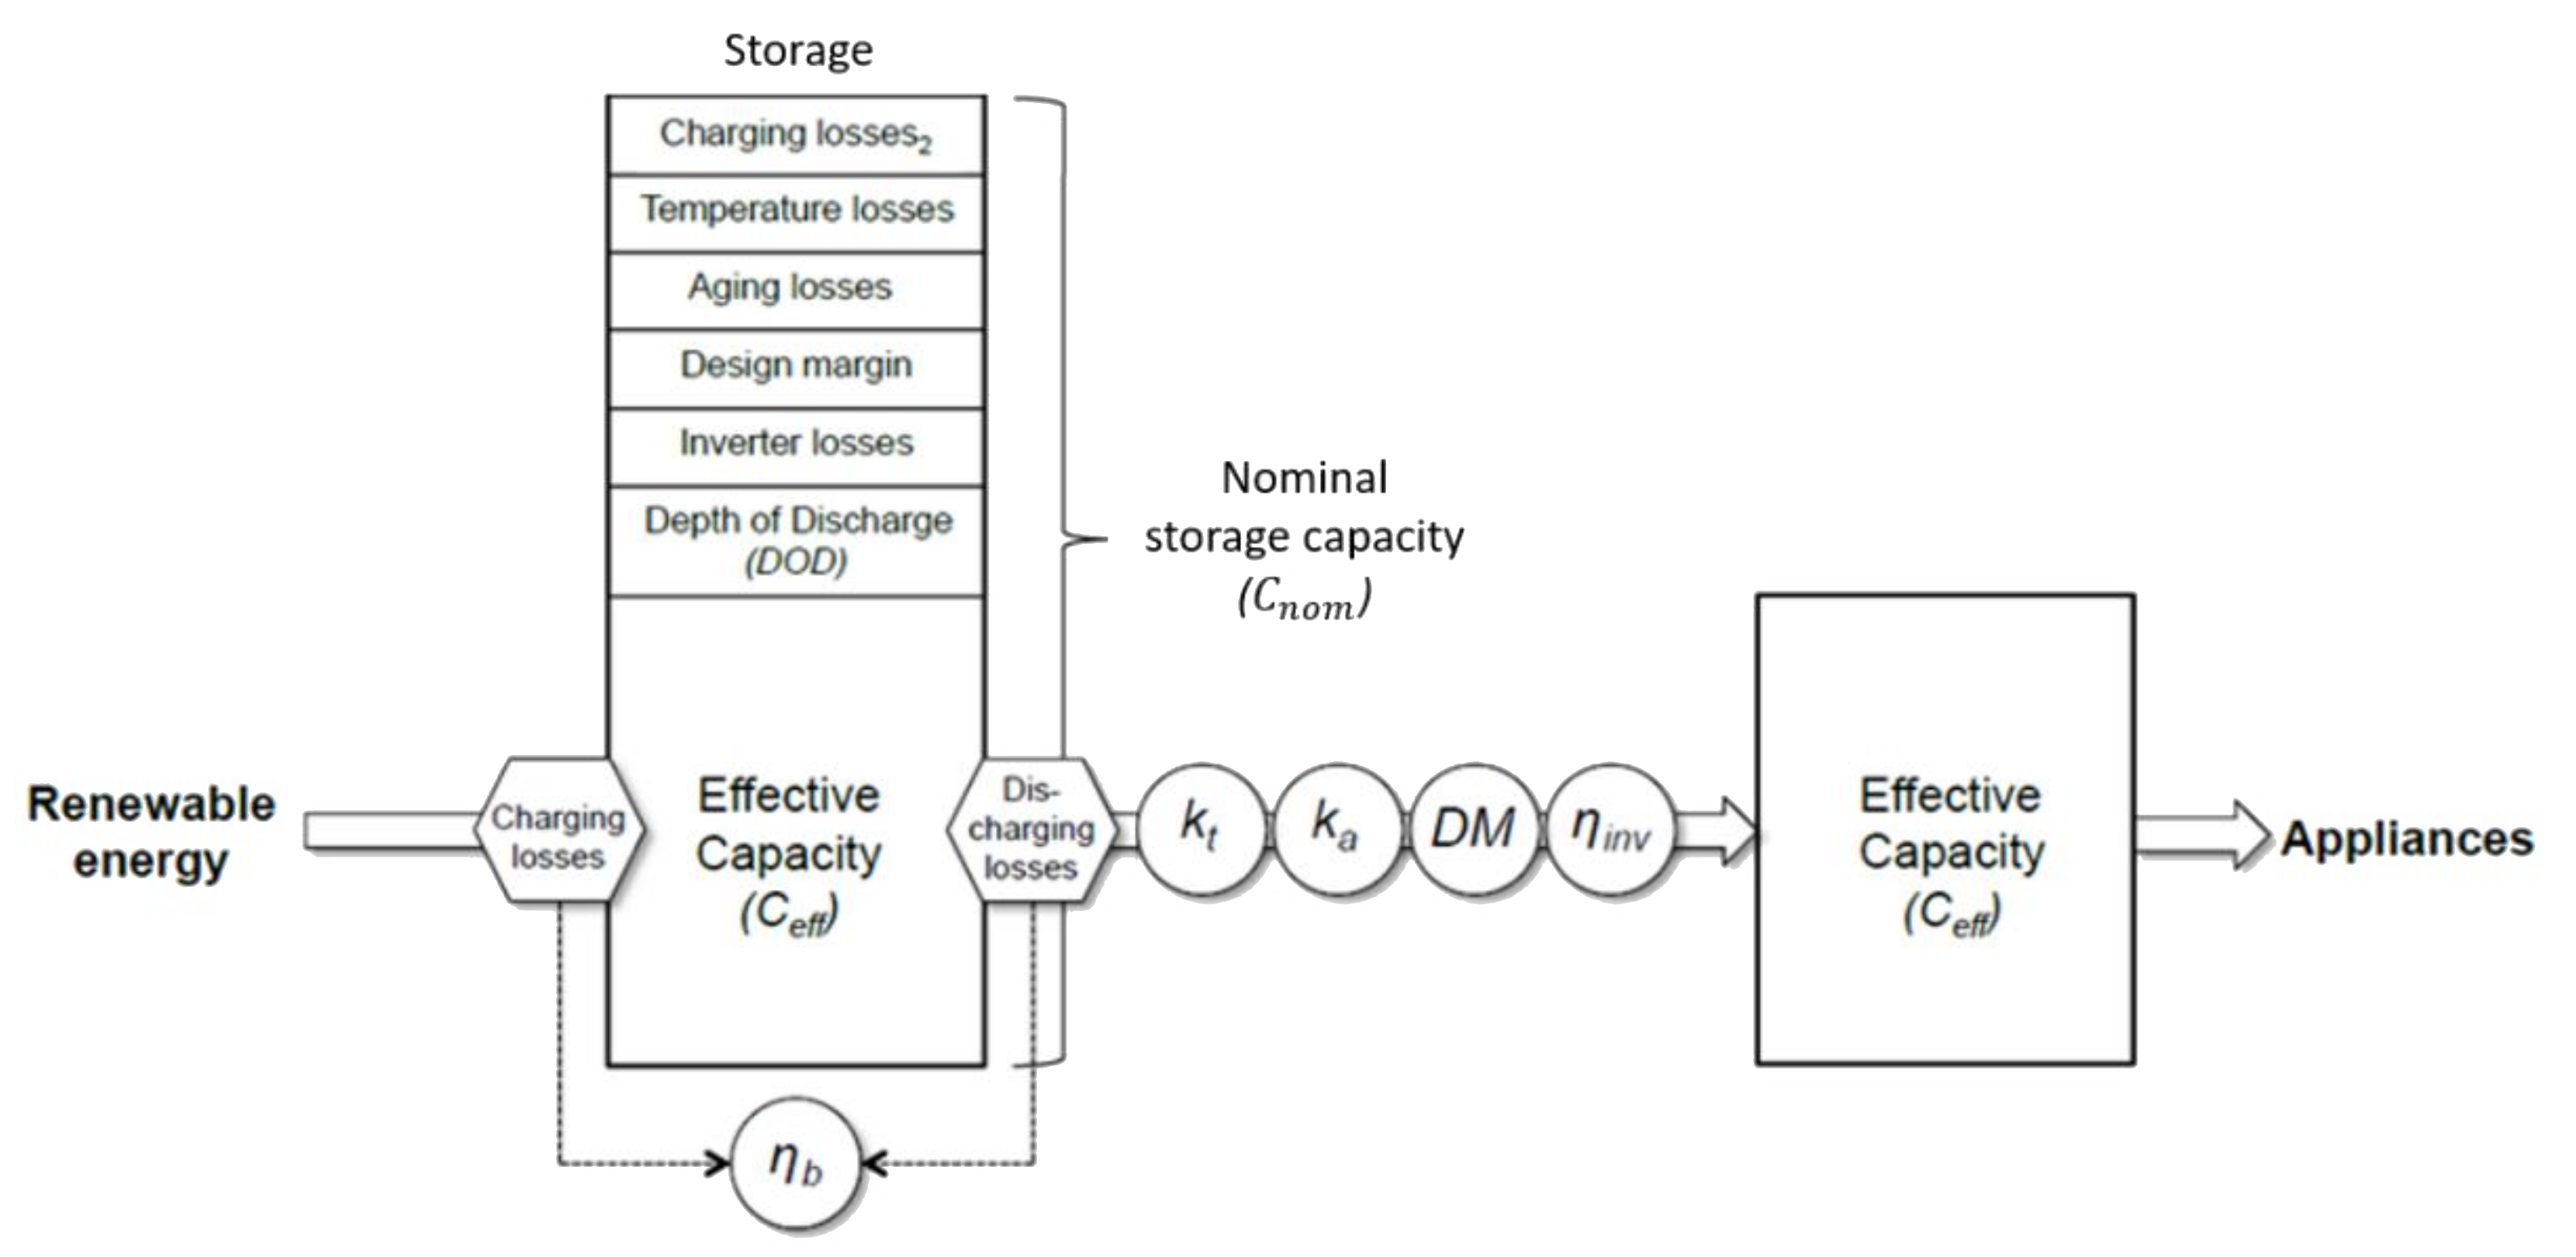
An illustration of electricity flow through a storage system indicating the various parameters impacting the nominal storage capacity is provided in
Figure 4. As the impact of self-discharge during the battery’s operation would be negligible, the model did not consider a self-discharge factor. In order to assess the batteries’ applicability on different scales, the required nominal capacity values are compared with the energy rating range for each technology, as presented in [
33]. In the case that the nominal capacity value was not within the energy rating range, the technology was deemed unsuitable for that particular scale.
2.3. Spatial, Mass and Cost Requirements
The spatial (floor area and volume), mass and cost requirements for the battery technologies at the scales of interest were estimated taking into account the nominal battery capacity values derived from
Section 2.2 and the data presented in
Table 3. Data include current and potential values in the future for spatial requirement, energy density, specific energy and investment energy cost. For example, the footprint for NiMH for the DR 2030 scenario, assuming a low consumption household, would be 6.8 kWh × 0.032 m
2/KWh = 0.22 m
2. An inflation rate of 2% [
48] has been considered for the lower investment energy cost values, as these are more likely in 2030 due to R&D. With regard to the values that are provided in ranges, two sets of data and graphs were produced and included in the following section. Hence, by considering the minimum and maximum values, a current range of the various aspects and an anticipated one in the future due to research and development (R&D) advances are derived, respectively.
For the calculation of the LCOE of the battery
(€/kWh of electricity generated over the lifetime of technology), Equation (2) below, taken from [
34], was used, and the same inflation value of 2% was also applied:
where
(€/kWh) is the battery investment cost;
is the nominal capacity of the battery;
is the round-trip efficiency of the battery;
is the battery’s cycle life at the specified DOD and;
is the depth of discharge.
This calculation did not consider the operation and maintenance costs of the different technologies. Instead, the study assumed that they have fixed annual operation and maintenance costs, and they are thus not dependent on the batteries’ performance. Furthermore, the equation did not include the balance of system cost; instead, the study assumed that this cost is the same for all batteries.
4. Discussion
The findings regarding floor area, volume, mass and investment cost for sub-daily autonomy are similar to the ones for daily autonomy (included in [
35]). However, as the nominal storage capacity values are lower in this study, the values regarding the various aspects explored and technology applicability are also lower.
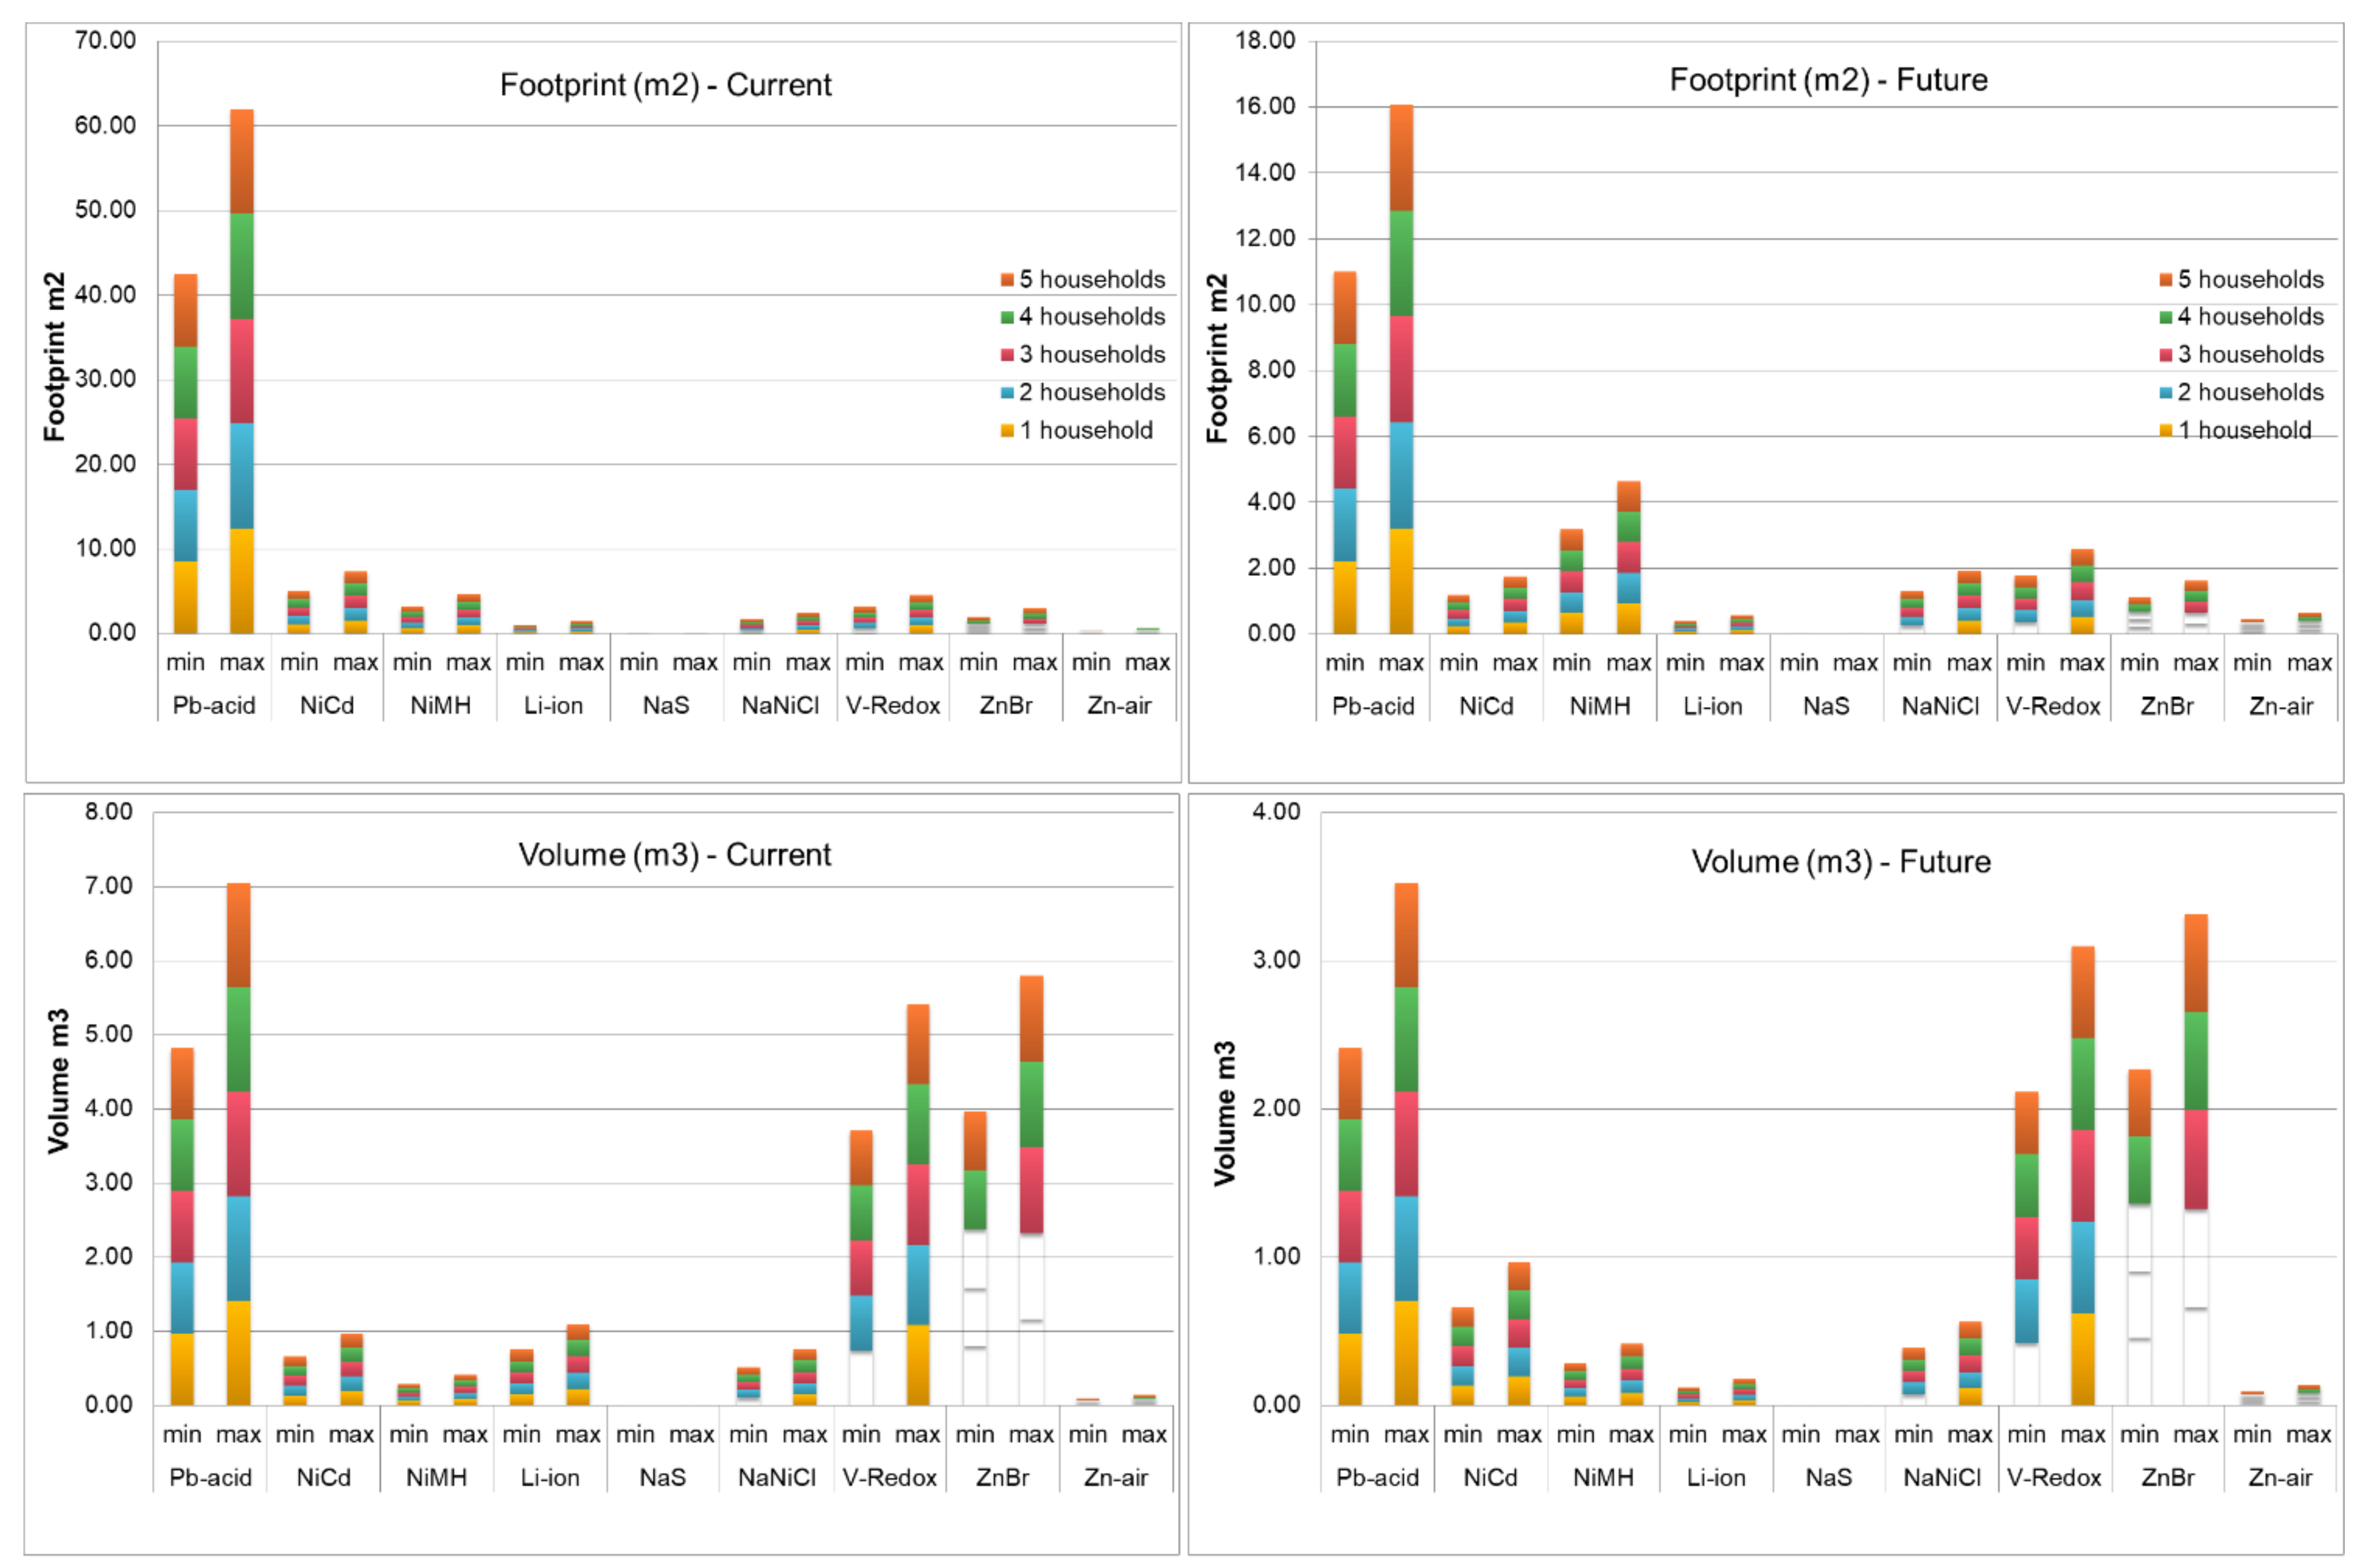
4.1. Floor Area Findings
Pb-acid batteries require, by far, the most floor space in all case studies, and this is irrespective of the spatial requirement value (minimum or maximum) taken into account. Li-ion and Zn-air, in the applicable scales, are found to be the most preferable technologies where a minimal floor area is required. To understand this at a more practical level, let us assume that a Li-ion battery was to be used as a storage device at the neighbourhood level, shared among five houses. The battery would discharge over 7 h during the evening/night-time—from 17:00 to 00:00—to power the electrical energy needs of the five houses. It would also charge the EV (use case #2). The investigation in this study shows that the Li-ion battery would require a floor area of approximately 0.6–1.5 m
2 in total if these were high consumption households or an area of about 0.4–1.0 m
2 if they were all low consumption households. Similarly, if a Pb-acid battery were to be used, it would require an area of approximately 16–60 m
2 or 10–40 m
2 if the households were high or low consumption ones, respectively. Depending on the technology and the household consumption, the current requirement per household would thus be between 0.09–12.5 m
2, with the potential to decrease to about 0.08–3.2 m
2 in the future. These are ‘battery only’ physical spaces, so access and servicing need consideration too. This could add considerable additional area depending on the location of the battery for some technologies. Considering typical UK housing floor area sizes of about 55–152 m
2 [
16], the derived floor area values indicate that the architectural implications regarding floor area required range from potentially minor through to very significant.
4.2. Volume Findings
Regarding volume requirements, Pb-acid would again be the least favourable, requiring the highest volume in all case studies. This is irrespective of the energy density value (minimum or maximum) considered. Li-ion and Zn-air, in the applicable scales, are again found to be the most preferable technologies. Revisiting the example given in
Section 4.1 regarding the required floor area of Li-ion and Pb-acid at a neighbourhood level shared among five houses, the Li-ion battery would now need a volume of about 0.2–1.0 m
3 if these were high consumption households or a volume of about 0.1–0.8 m
3 if they were all low consumption households. If Pb-acid technology were to be used, the battery would require a volume of about 3.5–7.0 m
3 or 2.5–5.0 m
3 if the households were high or low consumption ones, respectively. Depending on the technology and the household consumption, current volume requirements per household are thus between 0.02–1.4 m
3 per household, having the potential to decrease to about 0.02–0.7 m
3 in the future. Considering typical UK housing sizes, with an average usable volume of 143–395 m
3 (based on the usable floor area specified earlier and a room height of 2.6 m), the derived volume values indicate that the architectural implications regarding volume may be less difficult to accommodate compared to floor area requirements.
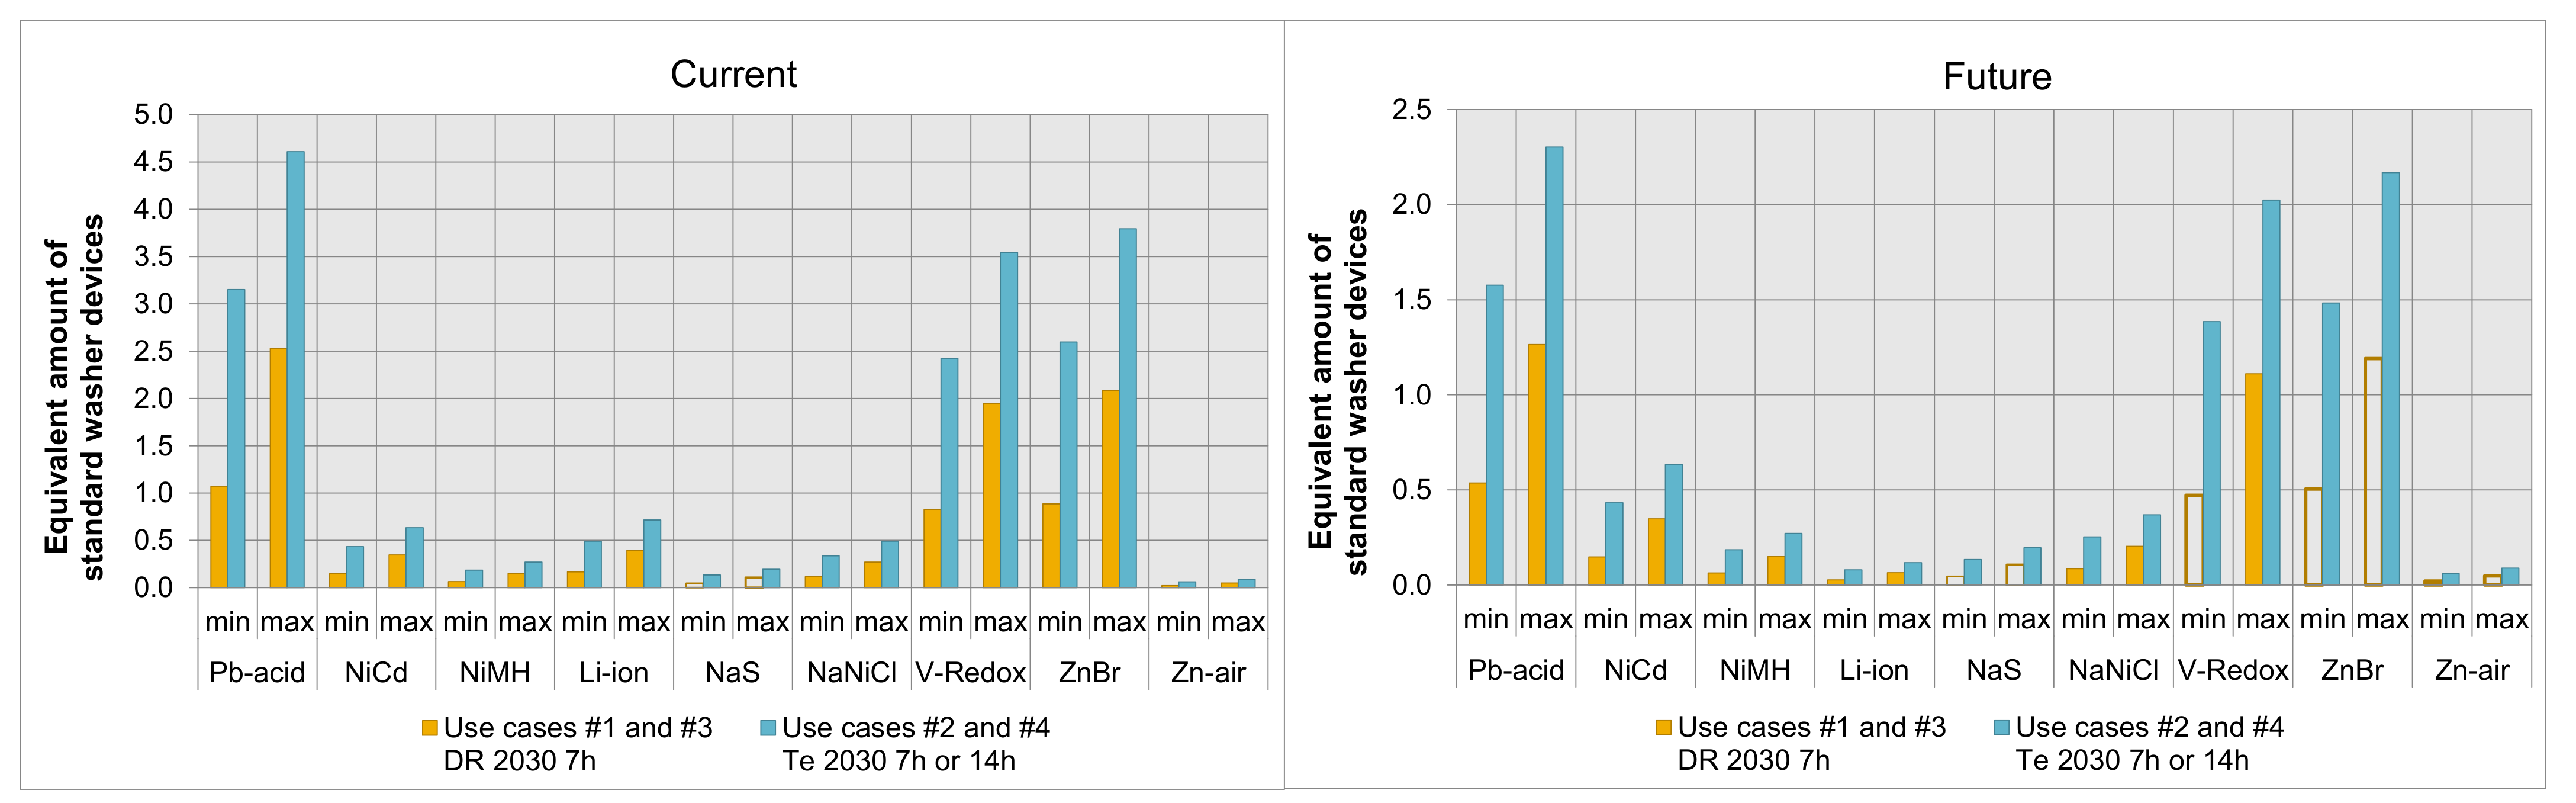
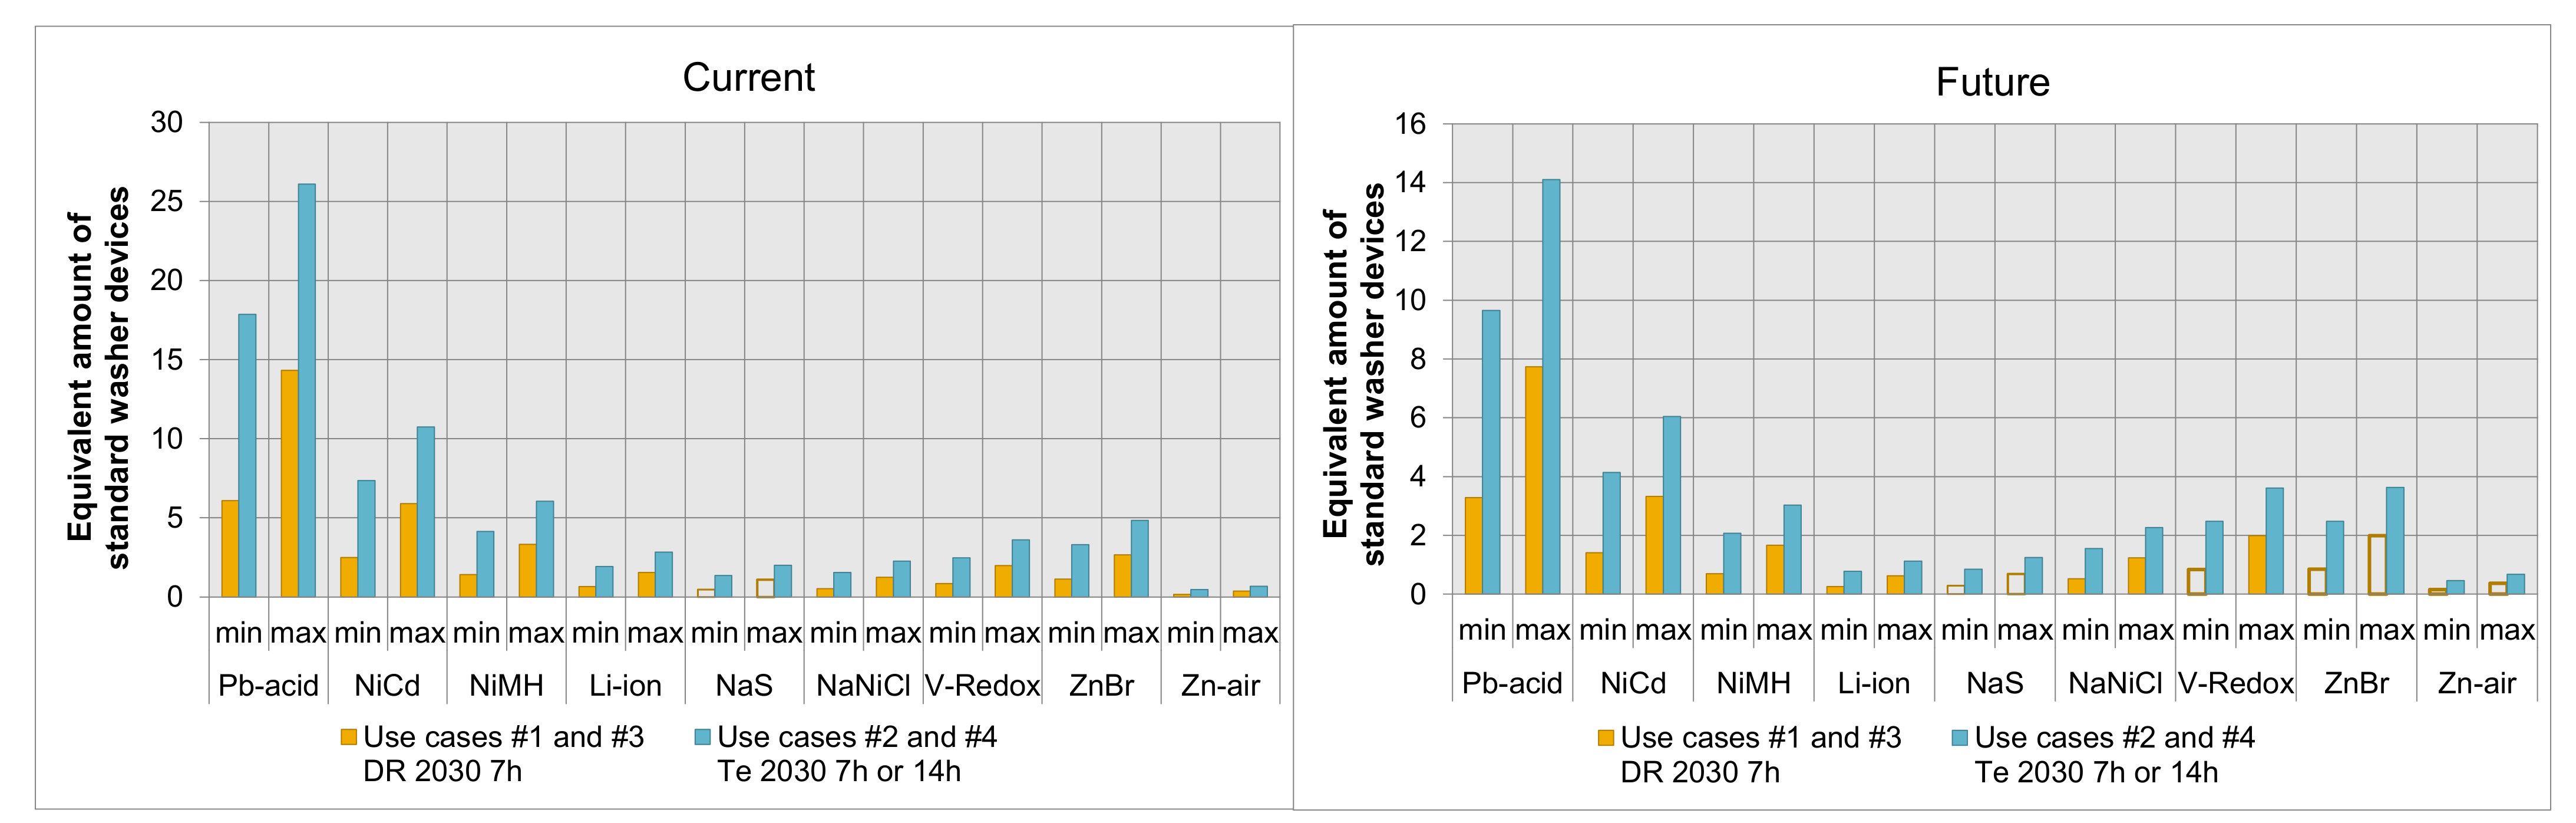
Volumetric Analogy
A volumetric analogy was undertaken relative to a standard washer device measuring 0.6 m × 0.6 m × 0.85 m [
49]. This was pursued as a deeper exploration of the implications of the battery technologies’ volume on the design of buildings. One household was assumed, as the impact would be proportional to the number of households. A volumetric analogy is presented for all case studies in
Figure 8.
As
Figure 8 show, when considering the maximum energy density values, which are probable in the future due to technological advances, the maximum equivalent volume a household would require considering 7 or 14 h of autonomy is that of approximately 2.3 standard washer devices. That value is applicable for Pb-acid, V-Redox and ZnBr batteries in case studies #2 and #4, where the home battery also charges the EV battery. If other technologies were used alternatively, a smaller volume requirement would be incurred, in the range of an equivalent volume of 0.1–0.5 washers. Whilst not insignificant when combined with a balance of system and access needs, these more likely volume requirements should not prove too onerous to accommodate for designers.
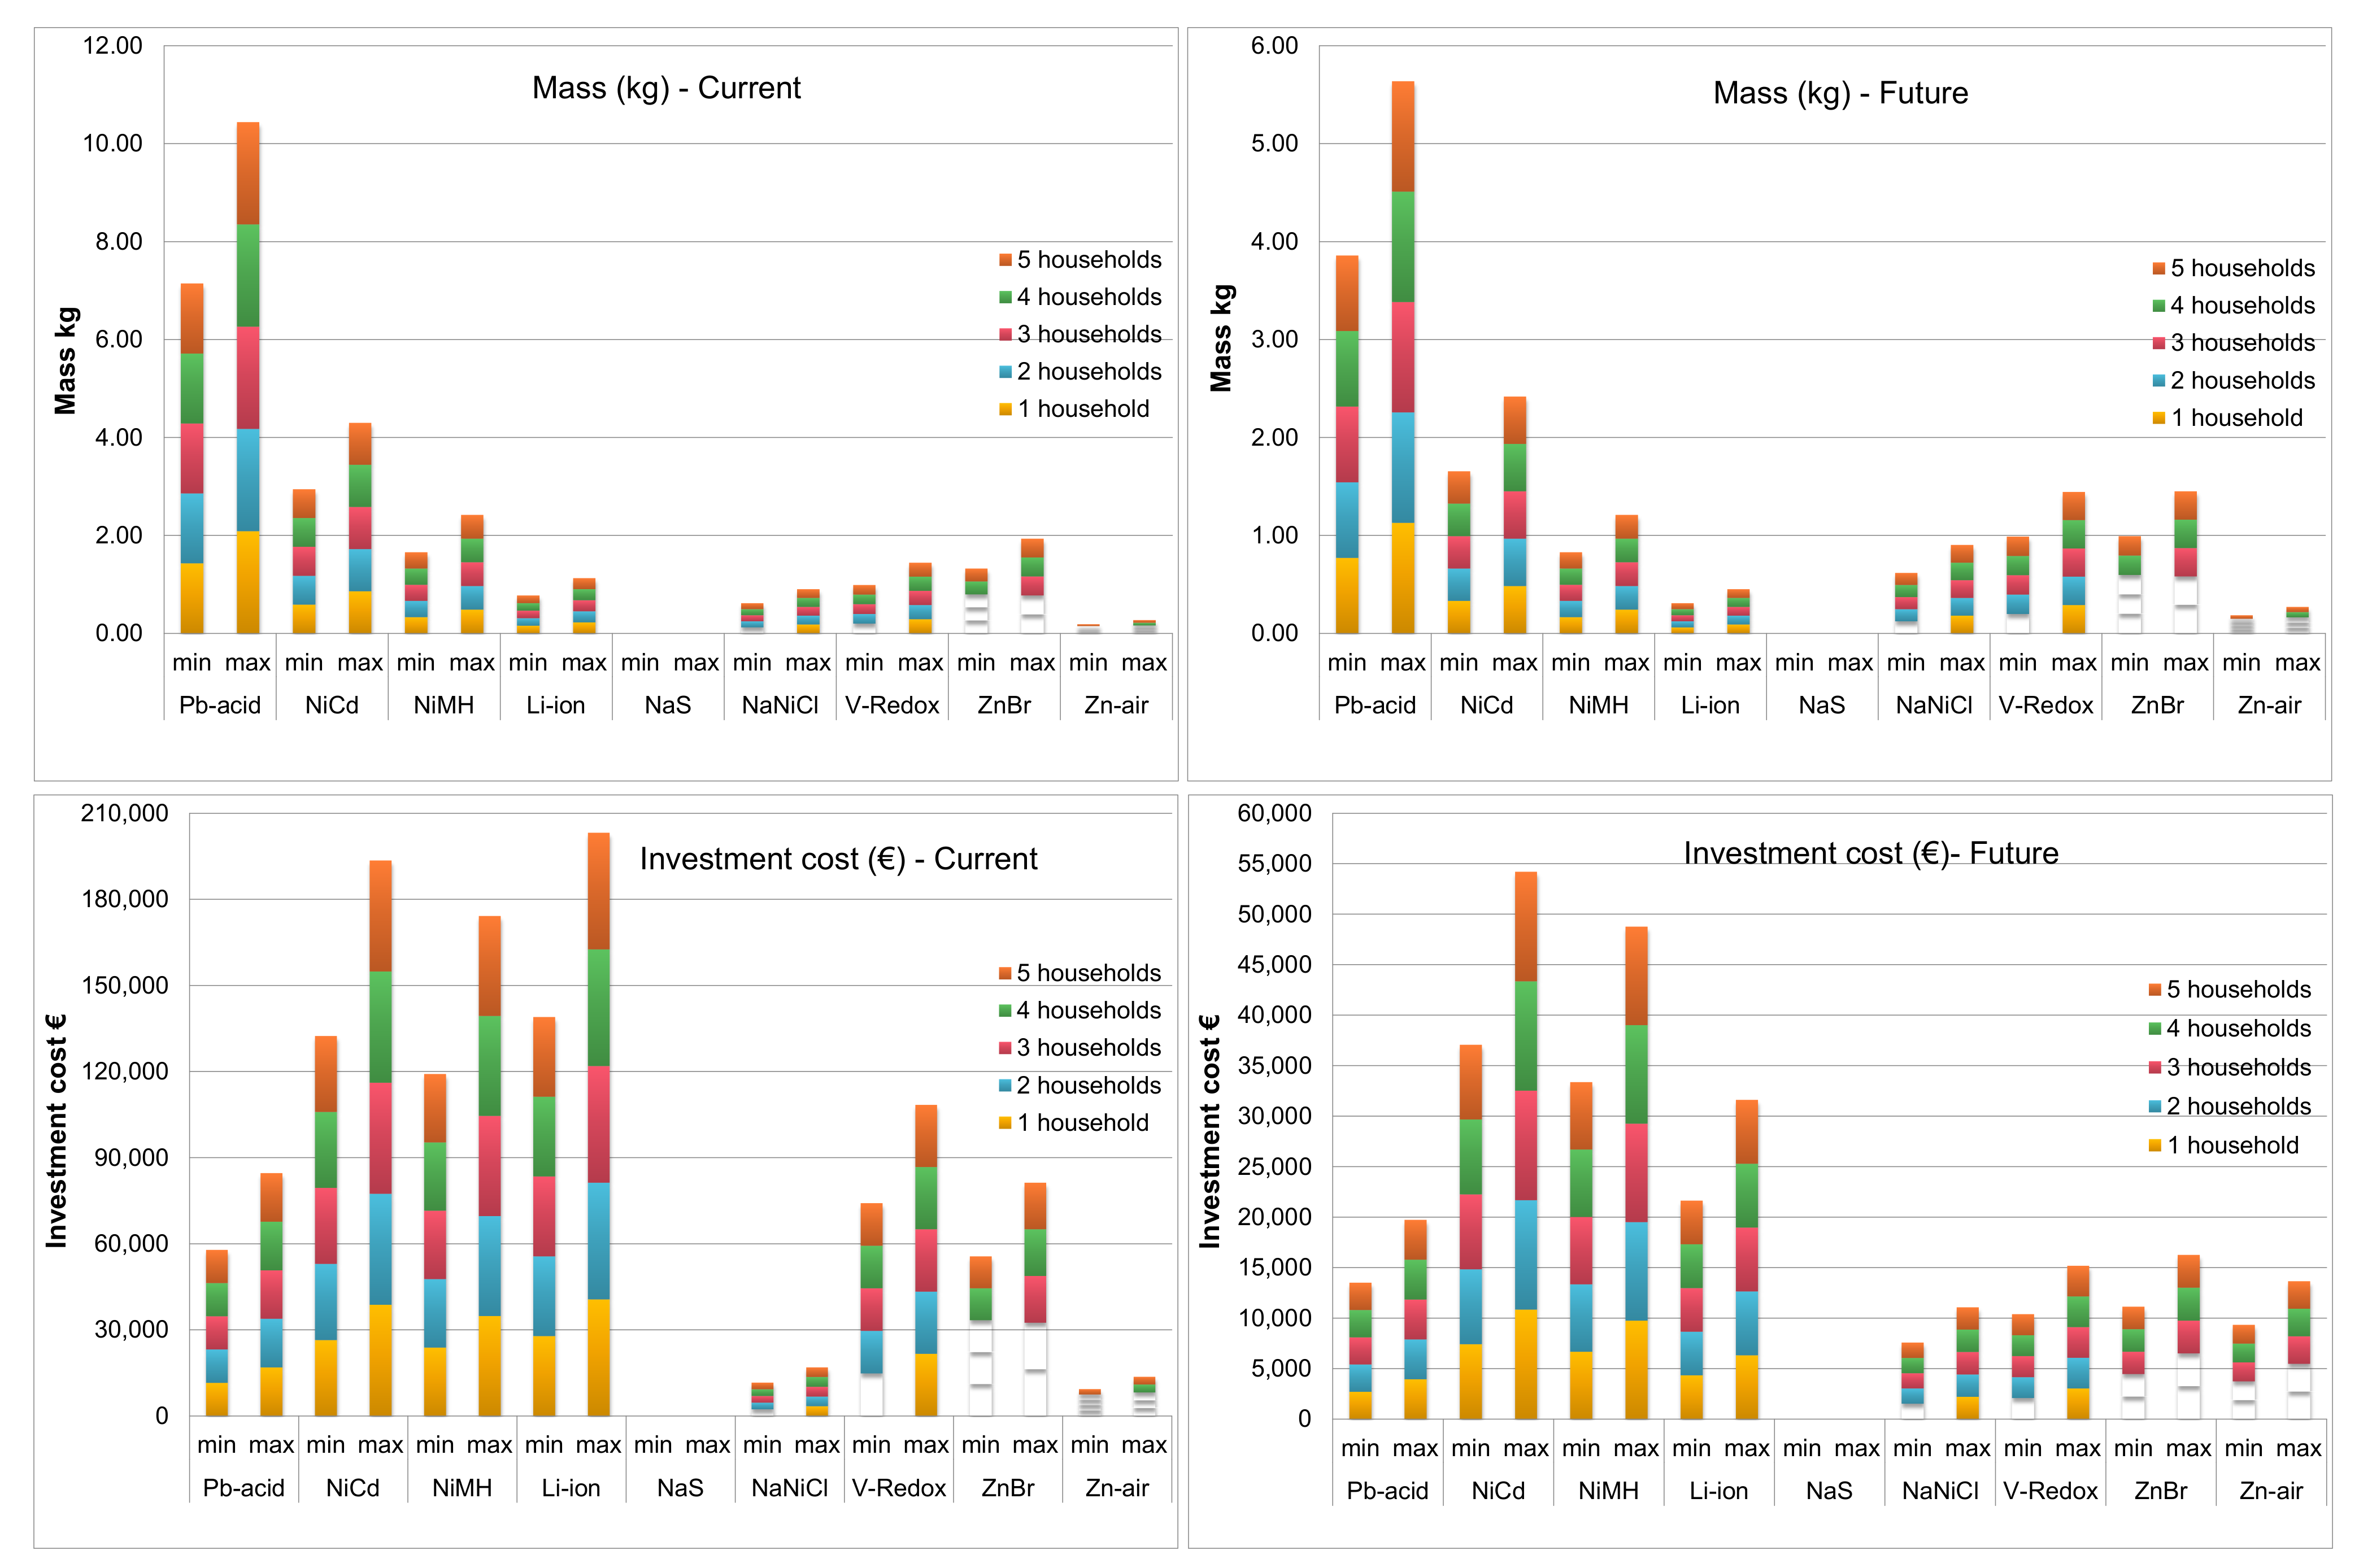
4.3. Mass Findings
In terms of mass requirements, Pb-acid would again be the least favourable technology, exhibiting the highest mass in all case studies. This is irrespective of the energy density value (minimum or maximum) considered. Li-ion, NaNiCl and Zn-air, in the applicable scales, are the most preferable technologies. Using the same example as stated previously, the Li-ion battery’s mass would be approximately 450–1100 kg if these were high consumption households or about 300–800 kg if they were all low consumption households. If a Pb-acid battery were to be used, it would weigh about 5500–10,500 kg or 4000–8000 kg if the households were high or low consumption ones, respectively. Depending on the technology and the household consumption, the current mass requirement would be about 37–2088 kg per household, having the potential to decrease to about 37–1128 kg in the future.
Gravimetric Analogy
A gravimetric analogy was undertaken assuming the same standard washer device, weighing 80 kg [
49]. Similarly to the volumetric analogy, this was pursued as a deeper exploration of the implications of the battery technologies’ mass on the design of buildings. A gravimetric analogy is presented for all case studies in
Figure 9.
As
Figure 9 show, when considering the maximum specific energy values, which are probable in the future due to technological advances, the maximum equivalent mass a single household would require considering 7 or 14 h of autonomy is that of approximately 14 standard washer devices. Although this value is relatively high, it would only apply for Pb-acid, a technology exhibiting low specific energy values, for case studies #2 and #4. Alternatively, the rest of the technologies could be used to overcome any potential structural design limitations of the floor, as they have 5–40% of Pb-acid technology’s mass, equaling a mass of 0.2–6 washer devices. It is demonstrated through this analogy that the architectural implications as far as battery mass aspects and associated structural requirements of the floor are concerned should not prove to be a major obstacle to designers wishing to incorporate sub-daily storage.
4.4. Investment Cost Findings
Regarding investment cost, NiCd, NiMH and Li-ion technologies would be the least favourable. NaNiCl and Zn-air, in the applicable scales, are found to be the most preferable technologies. Using the same example as stated previously, the cost of the Li-ion battery would be approximately €32,000–200,000 if these were high consumption households or about €22,000–140,000 if they were all low consumption households. If a Pb-acid battery were to be used, the cost would be in the range of €20,000–85,000 or €13,500–58,000 if the households were high or low consumption ones, respectively. In the case Zn-air was selected, the investment cost would be approximately €14,000 or €9000 for high and low consumption households, respectively. Note that the source of these costings is from earlier studies conducted by the authors [
27,
28,
29], and caution should be used, given the fairly rapid changes in various battery costs at present.
In the cases where the EV was not charged by the battery at the home level (case studies #1 and #3), the floor area, volume, mass and investment cost would be reduced by 45–65%, depending on the exact value of the spatial requirement, energy density, specific energy and investment cost per kWh used.
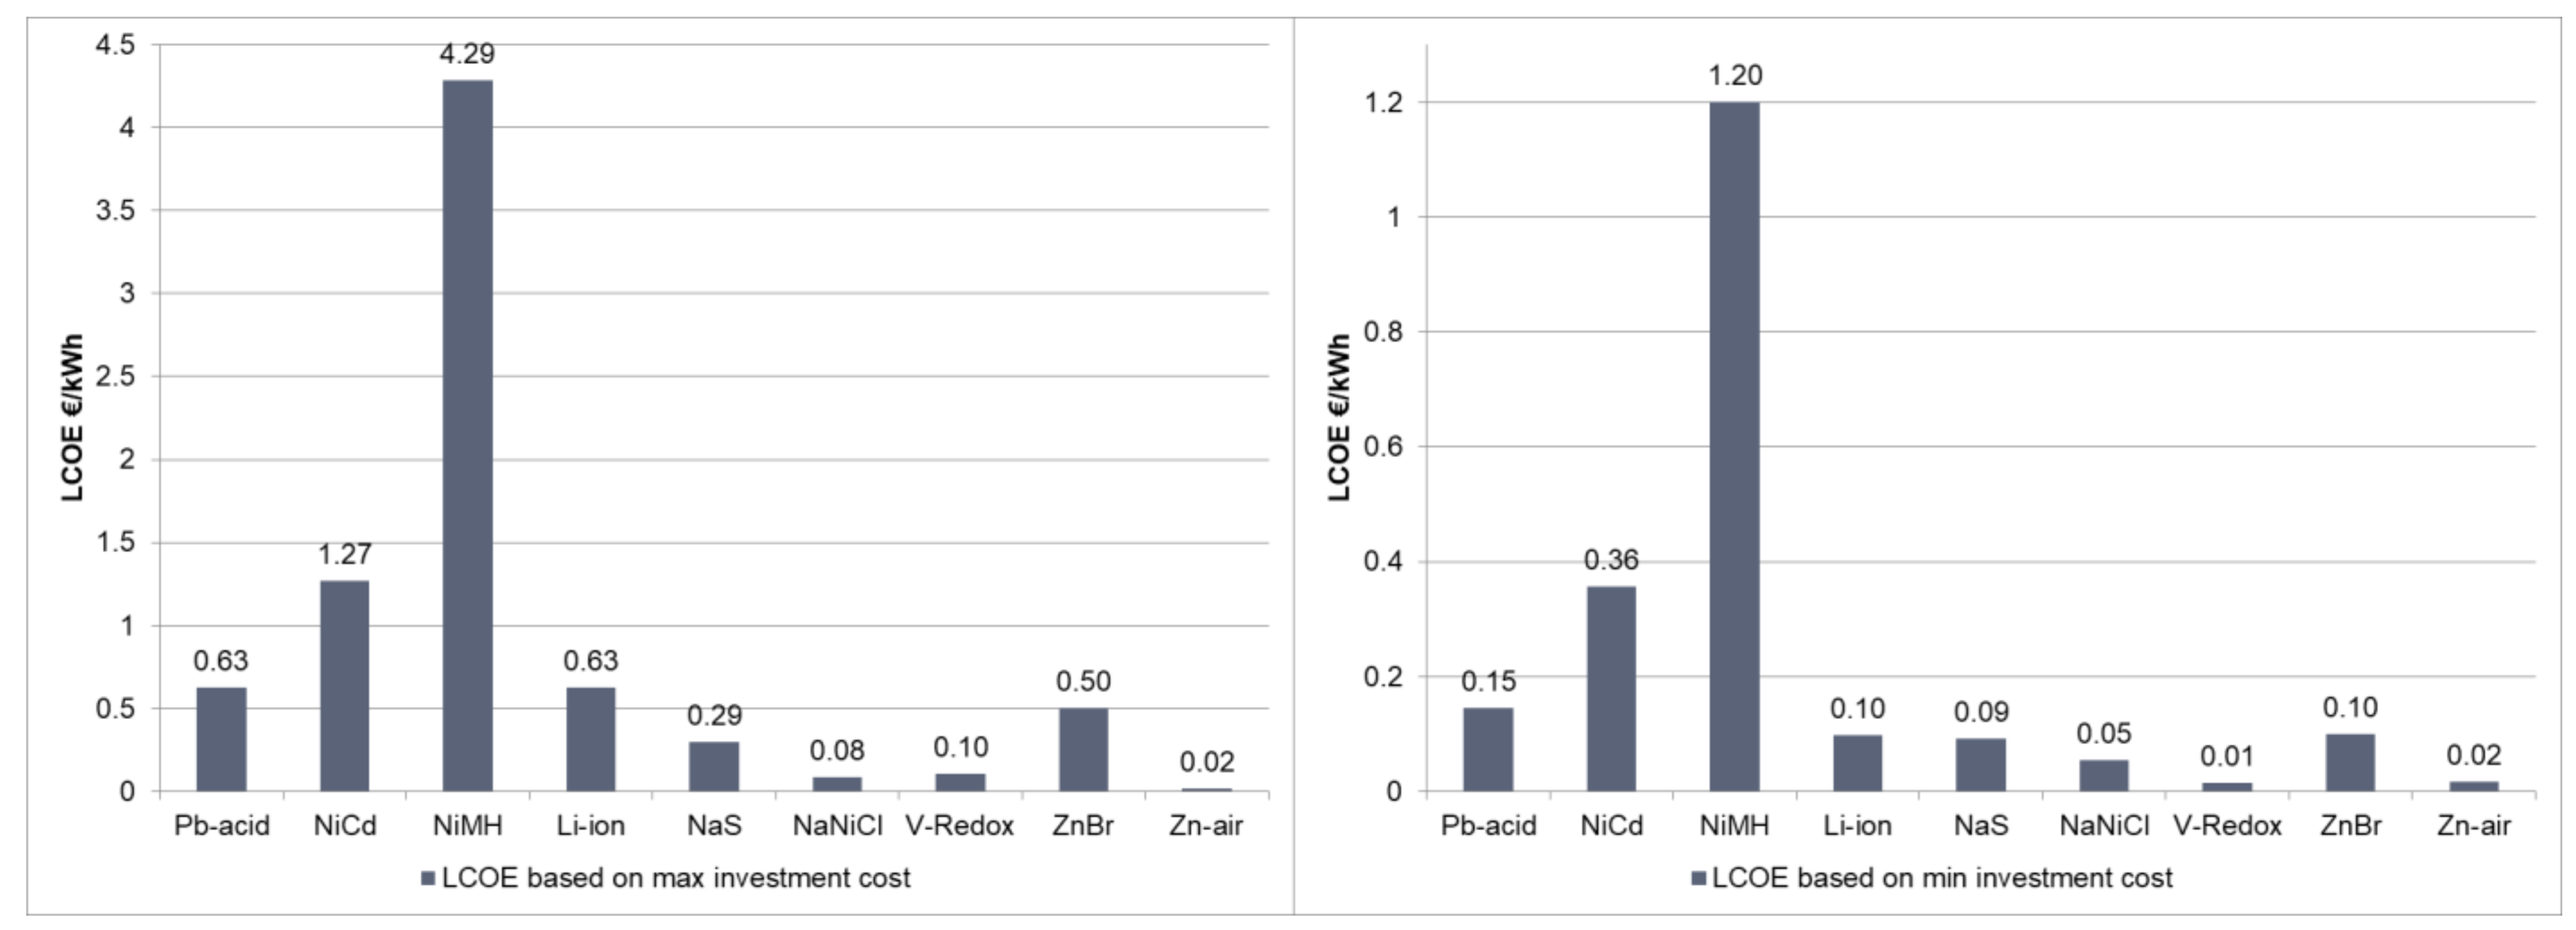
As far as the LCOE is concerned, as presented in
Figure 7, all technologies but NaNiCl could potentially exhibit significantly lower LCOE values in 2030 by at least 70%. NaNiCl has a lower LCOE value reduction potential of about 35%. Considering expected cost reductions, the Zn-air technology could also have a lower LCOE value by 2030; however, this could not be quantified due to the lack of data on or projections of a lower investment cost in the literature or through manufacturers. Li-ion and V-Redox present the highest LCOE reduction, which is from 0.63 €/kWh to 0.10 €/kWh and from 0.10 €/kWh to 0.01 €/kWh, respectively. When the maximum investment cost is considered, Zn-air and NaNiCl are the least expensive options, while V-Redox is the next most preferable one. When the minimum investment cost is considered, V-Redox and Zn-air are the most favourable technologies, while NaNiCl, NaS, Li-ion and ZnBr are the next most preferable ones.
To better understand these values, considering an average cost for standard electricity in the UK of £0.17/kWh [
50] or 0.21 €/kWh (the exchange rate of 1.2 EUR per GBP for 2022 has been used [
51].), by installing a Li-ion battery the cost would currently be up to about 0.63 €/kWh, but in 2030 it could come down to 0.10 €/kWh, while electricity prices could increase to £0.20/kWh or 0.24 €/kWh in 2030 considering 2% inflation and according to [
52]. It is, therefore, observed that there is great potential for reduction of the LCOE for all technologies by 2030 as well as economic viability that can lead to greater deployment of battery storage.
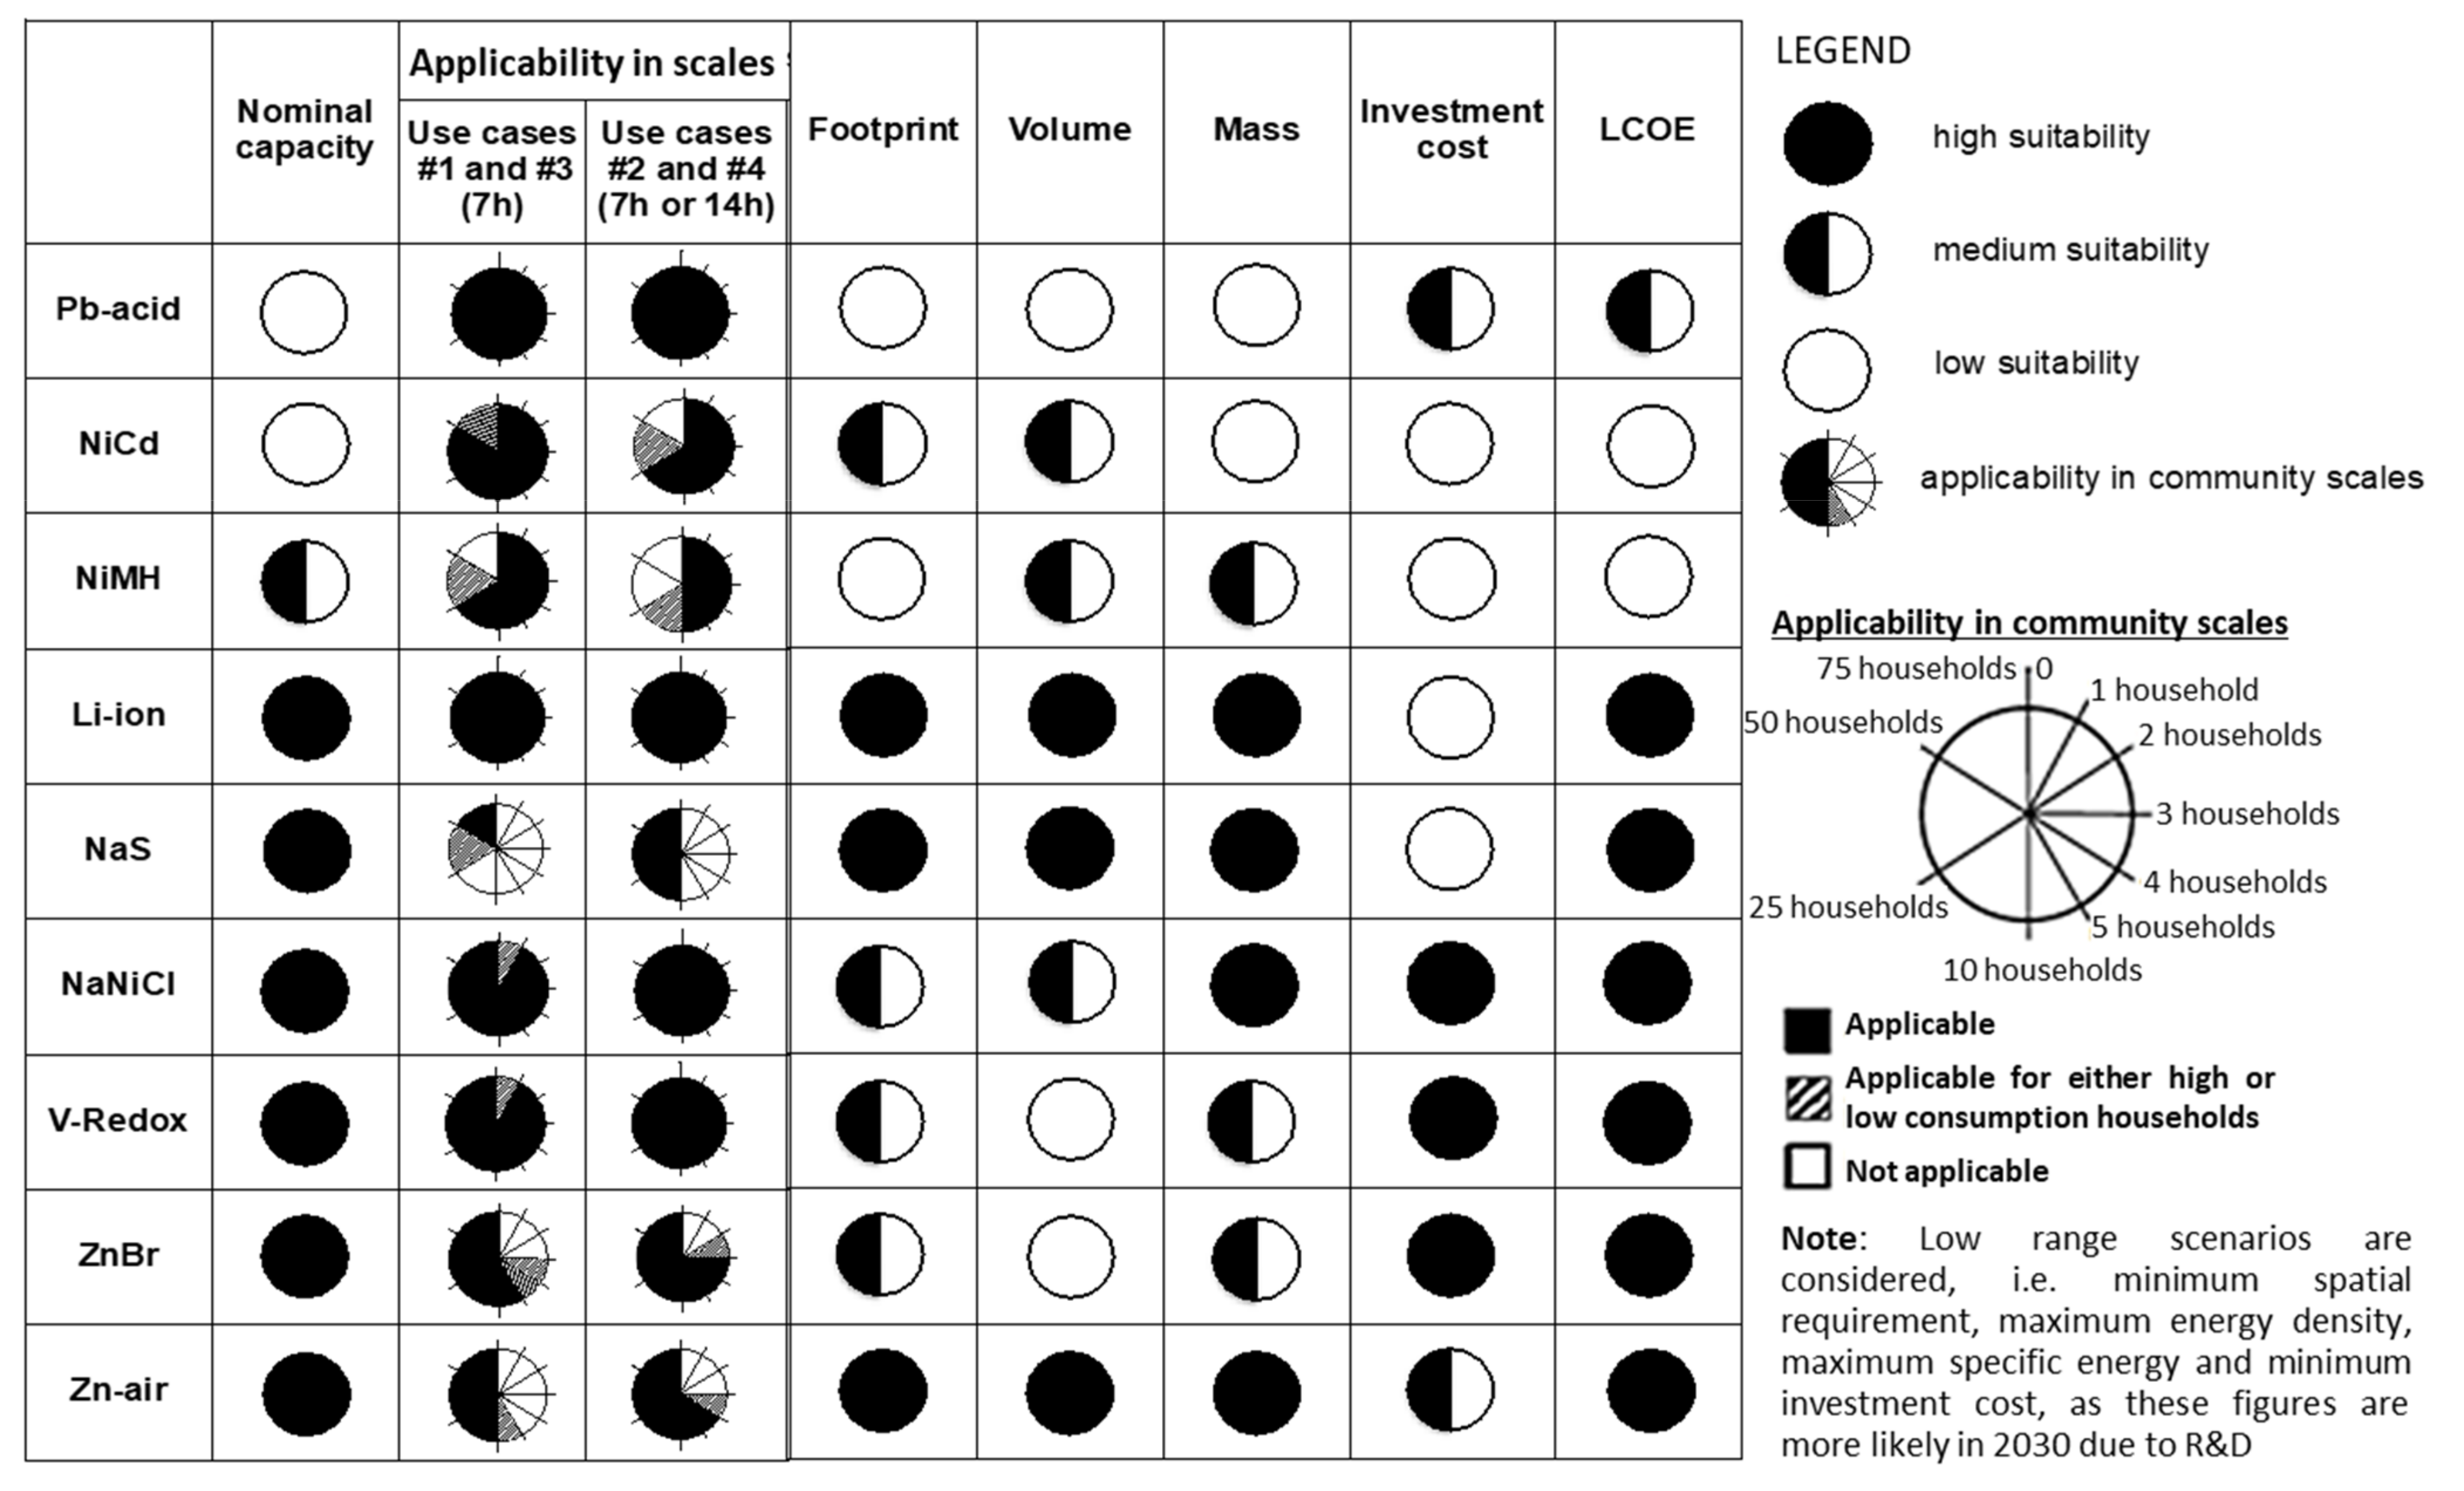
4.5. Suitability Criteria
Based on the floor area, volume, mass and cost findings from this study,
Figure 10 show a schematic characterisation of the battery technologies considering their suitability across the aforementioned aspects as well as their applicability at different scales in the case of sub-daily autonomy periods. This table should prove to be a useful starting point for consideration of each battery technology in architectural design. Depending on the building scale, household consumption and requirements, a careful investigation should be undertaken on a case-by-case basis.
4.6. Limitations and Future Work
Further work investigating where the EV contributes part of the storage requirement is required to cover the most common scenarios. It would be of interest to explore whether there would then be a requirement of storage at the home level, and if so, what the battery’s effective capacity would then need to be and what reduction in space, mass and cost requirements could be made possible. Future work could also explore the space requirements surrounding the battery systems, including location, access and servicing, as these could add considerable additional area depending on the location of the battery for some technologies. In addition, future work could focus on a sensitivity and uncertainty analysis of the presented methodology and the associated parameters to observe how the change in one or all factors influence the outcomes.
One of the limitations of this study is that it is relevant to the UK climate context and environmental conditions, so future work should look into examining these scenarios in other contexts and compare findings. Other limitations include that this study has assumed a number of expected values regarding the technical specifications of the batteries, which is based on what is currently published in the literature; however, this hugely depends on R&D trends and other factors, so careful consideration of these aspects is needed in order to take into account any updated information regarding the specifications. On a similar note, a wide range between minimum and maximum values on the different dimensions explored in this study can be observed. The rationale behind this was to be as inclusive as possible based on current information provided in the literature and other sources while providing a reliable methodology that could be replicated with updated data as needed. However, this means that the impact across the studies dimensions, e.g., footprint, volume, mass and cost, could range from negligible to significant given the current ranges. Perhaps such discrepancies will be reduced when batteries become a more mature and established technology in the residential context. Therefore, depending on the building scale, household consumption and technical requirements, a careful investigation on a case-by-case basis should therefore be undertaken when battery storage systems are to be considered in architectural design.
Moreover, occupants’ behaviour is a critical factor in the design and operation of buildings, so the incorporation of such aspects, including potential changes in the future, would be favoured for a more holistic approach. Furthermore, this study focuses on electricity use as it is likely that electricity becomes the main energy carrier for the building sector due to its low carbon potential; however, other scenarios favouring an energy mix in the way buildings are run might as well take place [
53]. Therefore, additional scenarios exploring the possibility of an energy mix would be welcomed. Last but not least, the COVID-19 pandemic has alerted us to factors of further uncertainty on electricity use and associated CO
2 emissions, so these need to be considered, as they are likely to bring about changes in the way we occupy and use buildings. The above demonstrates that, as this research field is rapidly evolving and is rather multidisciplinary, there are a number of aspects that would be likely to impact the scenarios explored in this study, and alternative future scenarios could be devised for a more comprehensive picture.


