Article

Design Optimization of Centralized–Decentralized Hybrid Solar Heating System Based on Building Clustering

State Key Laboratory of Green Building in Western China, School of Building Services Science and Engineering, Xi’an University of Architecture and Technology, Xi’an 710055, China
*
Author to whom correspondence should be addressed.
Energies 2022, 15(3), 1019; https://doi.org/10.3390/en15031019
Submission received: 9 December 2021 / Revised: 26 January 2022 / Accepted: 27 January 2022 / Published: 29 January 2022

Abstract

:
Clean heating has not been widely applied in rural Chinese areas. Considering the abundance of solar energy resources, harvesting solar energy for heating can be an effective solution to the problem of space heating in most rural areas. As the disperse building distribution in rural areas makes it difficult to implement centralized heating on a large scale, deploying centralized–decentralized hybrid solar heating system can achieve the best result from both the technical and economic perspectives. Taking a virtual village in Tibet as an example, this paper explores how to obtain optimal design of centralized–decentralized hybrid solar heating system based on building clustering. The results show that: (1) Compared with the fully centralized system and fully decentralized system, the centralized–decentralized hybrid solar heating system in the studied case could achieve a life cycle cost (LCC) saving of 4.8% and 2.3%, respectively; (2) The LCC of centralized–decentralized hybrid solar heating system basically decreases when the cost of the heating pipelines in the whole region decreases, but the emergence of single-household solar heating system may greatly increase the operating cost; (3) The necessity of designing a centralized–decentralized hybrid solar heating system can be determined by the pipeline price and building density, but the threshold values of pipeline price and building density are highly case-specific.

1. Introduction

Buildings in rural areas of China are commonly dispersed in different locations, making it difficult to implement centralized heating. For this reason, no effective heating solution that can perfectly strike the balance between technical efficiency and economic efficiency [1,2] has been found for rural areas. Abundant solar energy and low population density in rural areas provide favorable conditions for the utilization of solar energy [3,4]. However, for rural areas with a scattered building layout, choosing an appropriate solar heating mode is difficult. If a centralized solar energy system is used to provide heating for multiple households, heat loss during long-distance heat transmission will increase heating costs [5,6]. If independent solar heating systems are used to provide heating for individual households [7,8,9], the overall energy efficiency of the heating systems cannot be improved [10,11] because it is impossible to fully utilize the complementing effect [12,13,14] between the heating loads of different buildings that are located relatively close to each other. Therefore, neither a fully centralized solar heating system nor a fully decentralized solar heating system is a good solution to space heating in dispersed rural areas; thus, there is an urgent need to raise a new design method for solar heating systems in scattered rural areas.
The energy loads of different types of buildings in an area can differ to varying extents. As the load pattern varies from building to building, demand profiles of several adjacent buildings can be aggregated over the same time horizon to level off the overall heating demand profile [15] so as to reduce the energy supply cost [16,17]. This is called the complementing effect. To fully utilize the complementing effect, a centralized–decentralized hybrid heating has been conceived [18,19]. To implement centralized–decentralized hybrid heating, a building space clustering analysis needs to be carried out for the target area based on building spacing and the complementary characteristics of loads. Then, independent centralized solar heating systems can be designed for different building groups. Spatial clustering is an analysis method that divides objects in a spatial data set into multiple clusters composed of similar objects [20,21]. Spatial clustering methods mainly include partition clustering algorithm [22,23], hierarchical clustering algorithm [24,25], density-based clustering method [26,27], grid-based clustering method [28,29], and model-based clustering method [30,31]. Among them, partitioning clustering algorithms, density-based methods, and graph theory-based methods are more often used in regional building clustering.
A partitioning clustering algorithm is a heuristic method (e.g., based on K-means or K-medoids algorithms) that divides a given set of objects into groups, so that each group contains at least one object and each object belongs to and can only belong to one of the groups. Unternährer et al. [32] used K-means clustering technique to divide the entire urban area into several smaller neighborhoods. Similarly, Samira et al. [33] proposed a systematic approach combining the K-means partitioning clustering method with a GIS model to represent an urban area macroscopically as a set of “integrated partitions” integrated by consumers, resources, and energy conversion technologies, solving the problem of energy system design and operational strategy optimization in urban areas. However, the center point of each region in this study was chosen autonomously. To overcome this shortcoming, Giovanni et al. [34] used classification techniques and clustering algorithms to identify representative buildings in each cluster. Predictive modeling was used to expand cluster membership in the case where some buildings were excluded from the analysis. The graph-theory-based approach, also known as the Minimum Spanning Tree (MST) clustering algorithm, was first proposed by Zahn [35]. The main idea of this clustering method is to first consider each object to be processed as a node of a “graph” and then find similar relations (e.g., proximity relations) to form an undirected graph, and the constraint weights are assigned to each edge of graph. Regnauld [36,37] analyzed the scale-independent Gestalt parameters such as average size, shape, and density of each building group and then established rules and constraints on the spatial structure of the triangular network, but these constraints were not introduced hierarchically into the building clustering. To disentangle the degree of influence of multiple constraints, Qi and Li [38] introduced the constraints hierarchically into the building clustering process based on various influencing factors such as distance, direction, and similarity. Although the above two methods were often applied to the study of regional clustering of buildings, each method has obvious limitations. For the K-means divisional clustering method, a pre-determined number of clusters should be determined previously. Moreover, the initial cluster centers are generated by random selection and sensitive to noisy data. For the graph-theory-based method, constraints such as the number of clusters should also be determined in advance. Therefore, these two methods are not suitable for spatial clustering of buildings with different distributions in areas where the buildings are scattered.
The density-based clustering method, which can identify any number of clusters with arbitrary shape in noisy datasets, is an appropriate solution to building clustering in various regions [39]. The basic idea of the Density-based Spatial Clustering of Application with Noise (DBSCAN) algorithm is that for each point of a cluster, the neighborhood of a given radius has to contain at least a minimum number of points ( M i n p t s ) where radius and M i n p t s are input parameters, but this initial method is sensitive to noisy data. Duan et al. [40] improved on this by proposing a density clustering algorithm for discovering clusters of different local densities in spatial databases, which is able to solve the problem of clustering data with different local densities. The algorithm improved by Dharni et al. [41] for multi-density data can obtain different values of neighborhood radius according to the density of different data regions, which can effectively handle multi-density data, but each additional one has to traverse the data set, which greatly affects the efficiency of the algorithm. A fast clustering algorithm for DBSCAN was proposed in study [42], which reduces the number of region queries and thus the clustering time by selecting individual representative objects in the core object neighborhood as seed points for class expansion. Liu et al. [43] applied a new density-based spatial clustering algorithm, which is able to detect clusters of arbitrary shape and non-uniform density in the presence of noisy points in spatial objects. However, all of the above studies only performed density clustering for spatial locations but failed to consider the load differential characteristics between demand-side buildings. Wang [44] used a density-based clustering method that considered the complementary effects of spatial dimensions and different demand curves to improve the efficiency and accuracy of large urban energy–water linked system optimization. Marquant [45] considered the building distances along with the load demand of building users based on a density clustering algorithm and divided the urban-scale case into multiple zones to solve the multi-scale energy network planning problem. However, the above studies mostly target large-scale conventional energy systems in urban areas with relatively stable energy production system. Very few studies have examined solar heating systems, which are characterized by large fluctuations of power output.
In summary, although there has been some research focused on combining building clustering with energy system optimization [46,47] to improve the overall financial and technical performance [48], solar heating systems are rarely considered in which hydraulic and thermal characteristics are fully studied in the calculation of transmission loss. In this study, a new methodology is adopted to carry out an in-depth analysis of the impact of building clustering on the design and operation of solar heating systems. After the buildings with an area are clustered into multiple building groups, the designs of the solar heating systems for different building groups are optimized separately, and the optimal design of the centralized–decentralized hybrid solar heating system is obtained by comparing the system life cycle costs (LCCs) [49] under different clustering schemes. The results of this study provide theoretical support for the design of solar heating systems in areas with a dispersed building layout. The main contributions of this study are as follows:
  • An optimization framework is developed for centralized–decentralized hybrid solar heating systems based on building clustering.
  • A building clustering method is proposed by combining the DBSCAN with the Kruskal minimum spanning tree algorithm.
  • A sensitivity analysis is conducted to investigate the impacts of pipeline price and building spacing on the design of solar heating systems.
The remainder of this paper is organized as follows: the methodology is provided in Section 2, the results of the study are presented in Section 3, the discussion is presented in Section 4, and the conclusions of the study are given in Section 5.

2. Methodology

The flowchart of the combined optimization method proposed in this paper is shown in Figure 1. The process can be roughly divided into the following five steps:
(1)
Collecting data;
(2)
Building clustering based on density;
(3)
Generating pipeline network in each building group;
(4)
Optimizing the solar heating system design for each building group;
(5)
Determining optimal building clustering scheme and optimal system design.
From Step (1) to Step (3), various categories of data are collected, the whole district is divided into several clusters by using the density-based building clustering technique, and the pipeline network is generated by using the Kruskal minimum spanning tree algorithm. In Step (4) the corresponding solar heating systems for all the building clusters are designed. Finally, by comparing the total system cost, the optimal building clustering scheme and optimal system design can be determined in Step (5). The technical details of the involved approaches are described in Figure 1.

2.1. Building Clustering

Among density-based building clustering methods, the DBSCAN algorithm is the most widely used because (1) there is no need to specify the number of building groups in advance, (2) building groups with arbitrary shapes can be discovered, (3) noise points can be identified, (4) outliers can be handled properly. Because the DBSCAN algorithm is sensitive to the initial parameter settings, we adjusted the neighborhood radius E p s and minimum number of samples M i n p t s within a certain range to obtain different clustering schemes.
The execution steps of the DBSCAN algorithm are as follows:
Input: Dataset D , neighborhood radius E p s , and minimum number of samples M i n p t s .
Step 1: Randomly select an unprocessed object p from dataset D . If this object meets the requirement of minimum number of samples within its neighborhood radius E p s , it is called “core object”.
Step 2: Traverse the entire dataset; find all the objects that are density reachable from object p (Ii an object set D , if there is a point chain p 1 , p 2 , …, p n , p i D ( 1 i n ), and p i + 1 is directly density-reachable from p i , then point p n is deemed as density reachable from p 1 ) to form a new group.
Step 3: Generate the final clustering result based on density connections (of there is an object o that makes both object p and object q density reachable from o , then object p and object q are deemed as density connected).
Step 4: Repeat steps 2 and 3 until all objects in the dataset are processed.
It can be seen from the above steps that a density-based cluster is a group of density-connected objects, and its purpose is to maximize density reachability. After clustering the buildings using the DBSCAN algorithm, we can analyze the distribution of sample points of each building group and set the core object point of each building group as the location to install the centralized solar heating system.

2.2. Generation of Pipeline Network in Each Building Group

After the buildings are clustered using the DBSCAN density-based clustering method, it is necessary to determine the pipeline network with minimum length in each building group. The conventional Delaunay triangulation method can generate a two-dimensional planning map of buildings in each group and reduce the pipeline connections between buildings far away from each other, but it cannot generate the pipeline network with minimum length. On the basis of triangulation-based planning, this paper further applies the Kruskal minimum spanning tree algorithm to generate pipeline network with minimum total length while ensuring that all buildings can be connected.
The minimum spanning tree algorithm assumes that in a given undirected graph G = ( V , E ) , ( u , v ) represents the edge connecting vertex u and vertex v , and w ( u , v ) represents the weight of this edge. Suppose there exists a subset of E called T ; if T is an acyclic graph and w ( T ) has the minimum value, then T is the minimum spanning tree of G . The minimum edge weight can be calculated using Equation (1):
w ( T ) = ( u , v ) T w ( u , v )
The Kruskal algorithm assumes that the initial state of the minimum spanning tree is a non-connected graph T = ( V , { } ) with only n vertexes and zero edge, and each vertex in the graph constitutes a connection component. The algorithm selects the minimum cost edge from E . If the vertices attached to the edge are on different connection components in T , the edge is added to T ; otherwise, this edge is discarded and the next minimum cost edge is selected. This operation is repeated until all vertices in T end up forming a connection component. Therefore, Kruskal algorithm determines the shortest path connecting all vertices according to the distribution of edge connections in the graph.

2.3. Design Optimization of Solar Heating System in Each Building Group

2.3.1. System Structure and Components

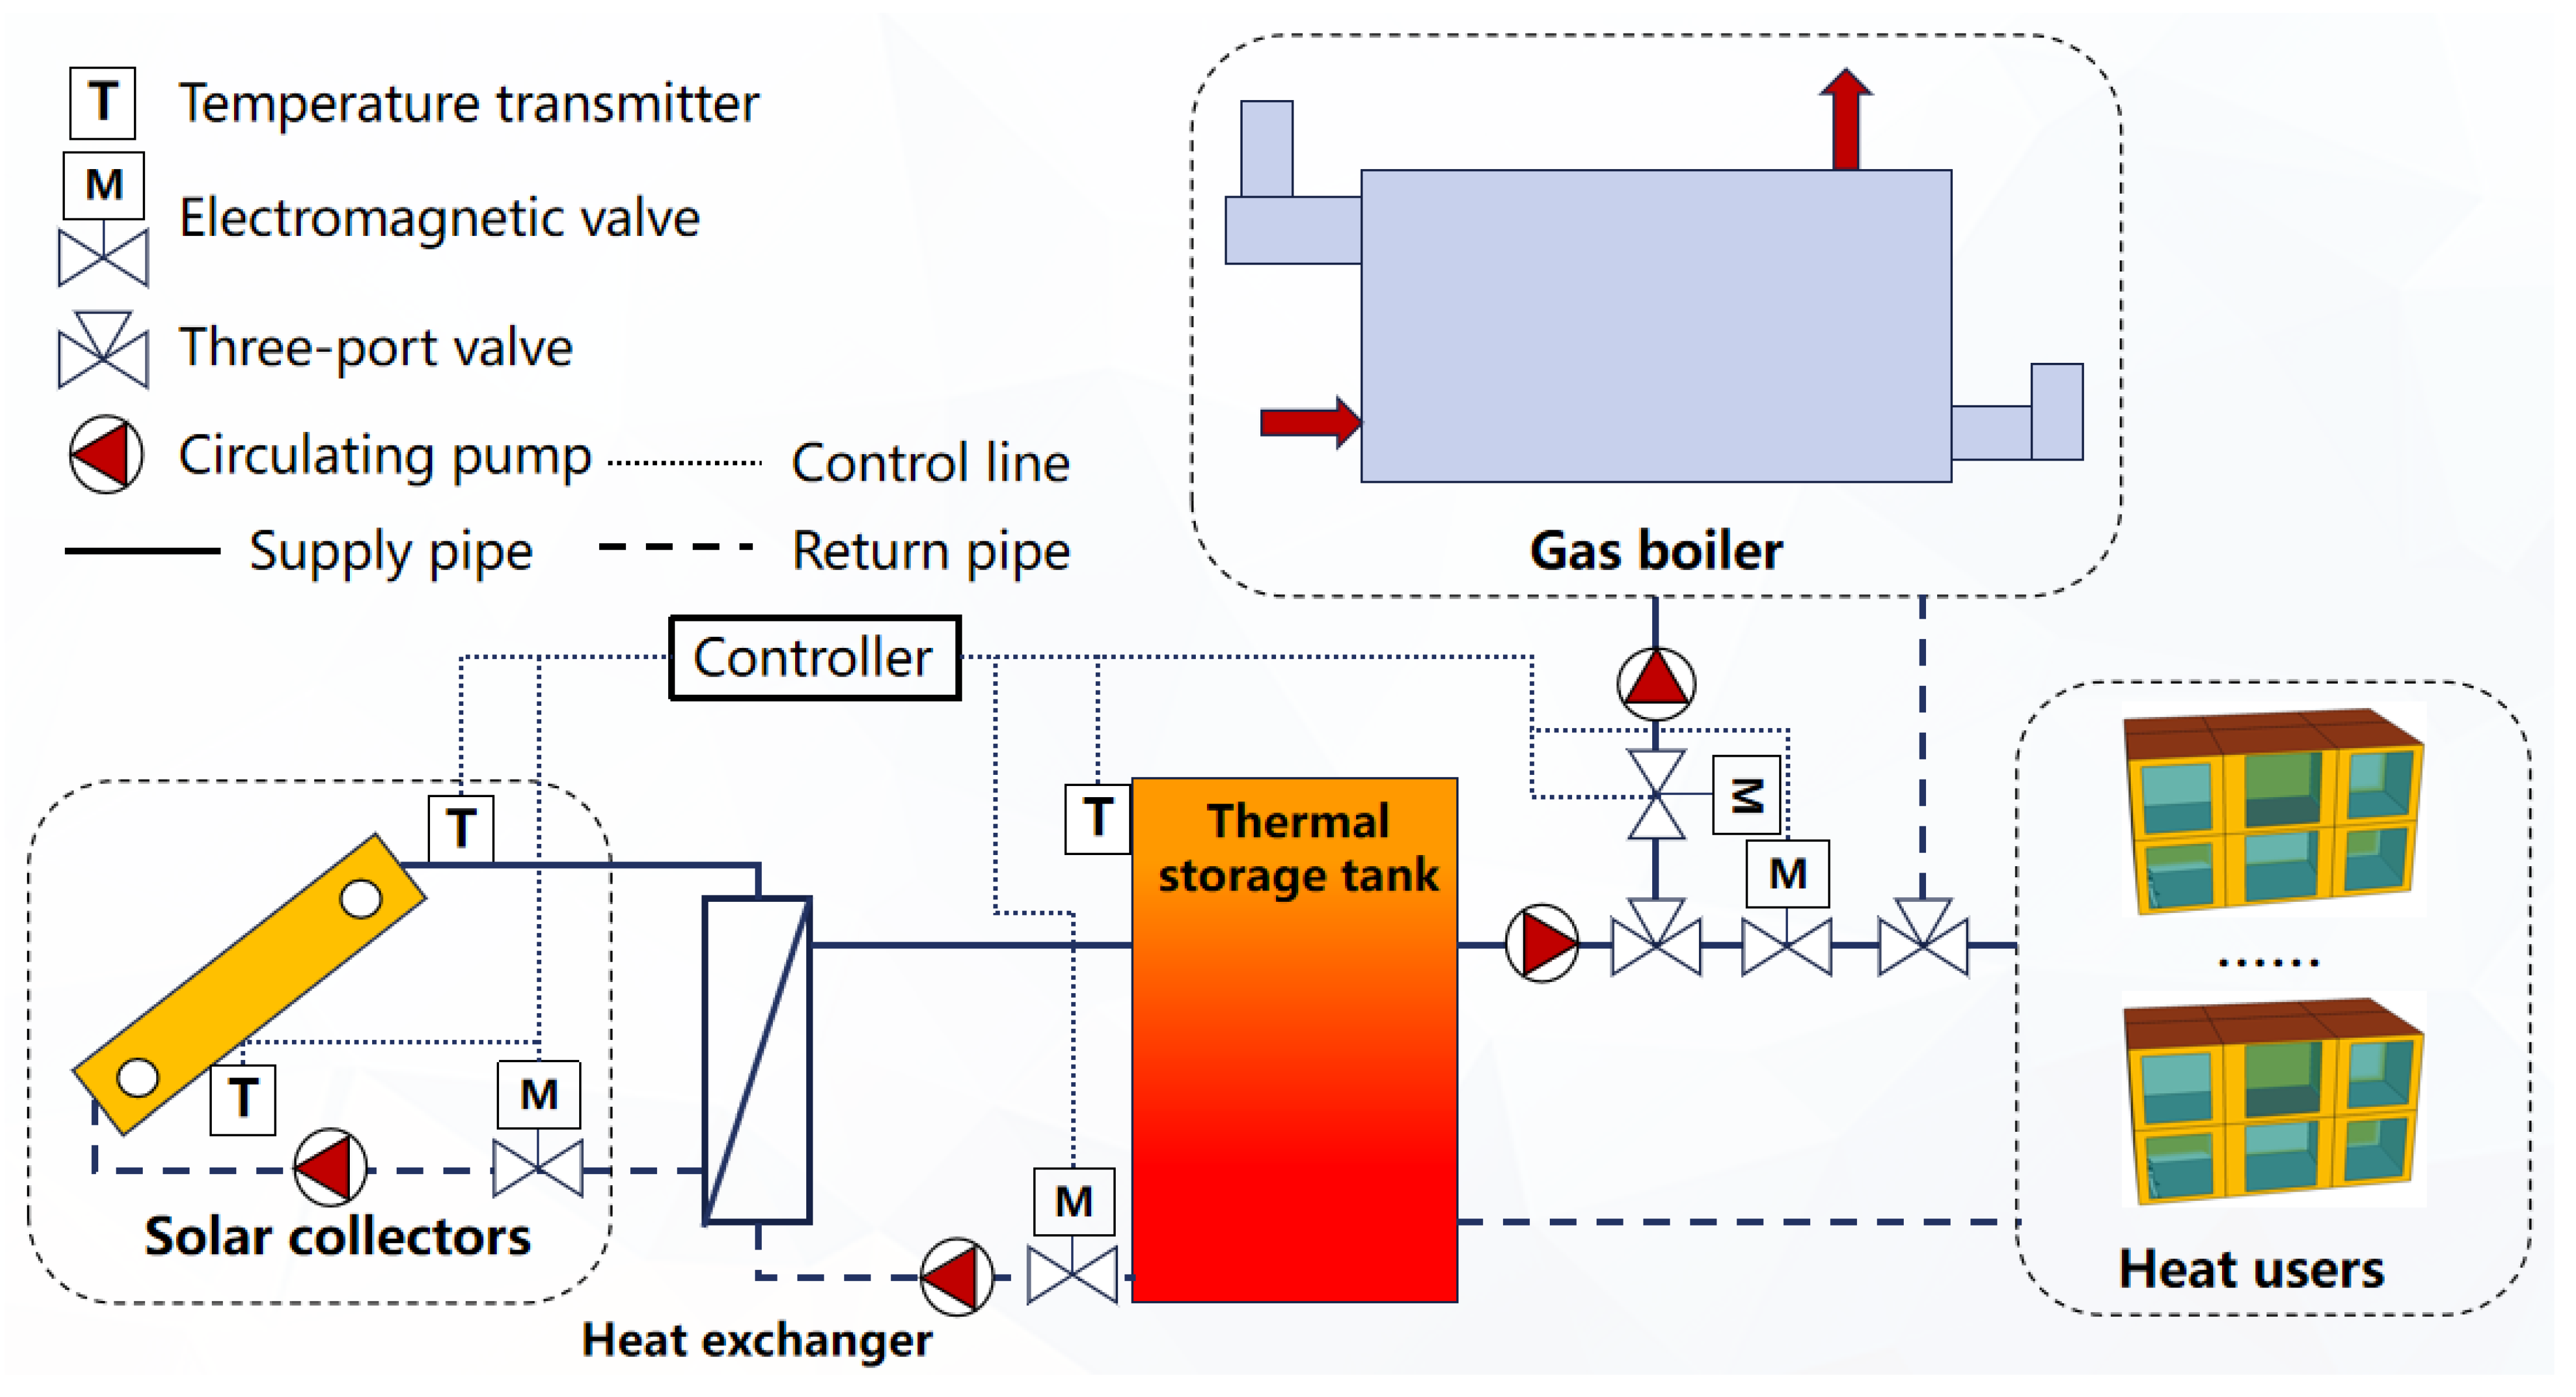
After the building groups are determined, a centralized solar heating system for each building group can be constructed. The structure of the solar heating system in this study is shown in Figure 2. The system consists of solar collectors, a natural gas boiler (auxiliary heat source), a water tank, heating pipelines, and multiple heat users.
(1)
Solar collector
In solar heating systems, a flat plate collector is the most widely used collector type. The formulas [50] for calculating heat collection, inlet water temperature, and outlet water temperature of collectors are as follows:
Q S C ( τ ) = 3.6 A C [ F R ( τ α ) e I C ( τ ) F R U L ( T c i ( τ ) T α ( τ ) ) ]
where Q S C ( τ ) represents the heat collection capacity of collector at the time τ , kJ; F R represents the dimensionless heat transfer factor of collector; A C represents the effective heat collecting area of collector, m2; ( τ α ) e represents the product of effective transmittance τ and absorptivity α ; I C ( τ ) represents the solar radiation intensity, W/m2; U L represents the total heat loss coefficient of collector, W/(m2·°C); T c i ( τ ) represents the inlet temperature of collector at the time τ , °C; and T α ( τ ) represents the ambient temperature at the time τ , °C. The constant 3.6 in Equation (2) is required to convert heat units. The unit of heat collection for solar collectors on the left side of the equation is kJ, while the unit of heat collection on the right side is W. Therefore, the right side is multiplied by 3.6 to unify the units.
T c o ( τ ) = Q S C ( τ ) c s m s c + T c i ( τ )
where, c s represents the specific heat of thermal mass, kJ/(kg·°C), and m s c represents the circulation mass flow of collector, kg/h. T c o represents the outlet temperature of collector, °C. Equation (2) calculates the amount of heat collected by the solar collector, which is used as a known value in Equation (3) to calculate the outlet water temperature of the collector.
(2)
Water tank
In this paper, the short-term water tank is chosen as the heat storage facility, and a single node model is developed. The mathematical expression of the temperature variation of the water in the water tank is as follows [51]:
( ρ w V tan k C w ) d T s ( τ ) d τ = Q S C ( τ ) + Q g b ( τ ) - Q tan k l o s s ( τ ) - Q p i p e l o s s ( τ ) Q h ( τ )
where ρ w is the water density, kg/m3; C w is the specific heat capacity of water at constant pressure, kJ/(kg·°C); V tan k represents the water tank volume, m3; d T s ( τ ) d τ is the temperature change in the water tank per unit time; Q g b ( τ ) represents the heat output from gas boiler at the time τ , kJ; Q tan k l o s s ( τ ) represents the heat lost to the ambient environment from the water tank at the time τ , kJ; Q p i p e l o s s ( τ ) is the amount of heat loss from the transmission of the pipe network at the time τ , kJ; Q h ( τ ) represents the heating demand of the building group at the time τ , kJ.
The formula for calculating heat loss of water tank is as follows:
Q tan k l o s s ( τ ) = U tan k V tan k ( T S ( τ ) T α ( τ ) )
where U tan k represents the heat loss coefficient of water tank, W/(m3·°C).
(3)
Auxiliary heat source
In this paper, the natural gas water boiler is used as the auxiliary heat source in the solar heating system, and its heat output can be calculated using Equation (6),
Q g b ( τ ) = 3600 η g b η l o a d P g b
where η l o a d represents the operating load rate of gas boiler, %; η g b represents the heating efficiency (85%) of gas boiler, %; P g b represents the rated power of gas boiler, kW.
(4)
Heat loss during transmission
When each clustering scheme is determined, the amount of heat loss Q p i p e l o s s ( τ ) during transmission to each heat consumer at the time τ can be calculated as follows:
Q p i p e l o s s ( τ ) = ( T s u ( τ ) T r e ( τ ) ) m · p ( τ ) C w ρ w Q h ( τ )
T s u ( τ ) = { 50 , T s ( τ ) < 50   ° C T s ( τ ) , T s ( τ ) 50   ° C
Q h , n = ε ρ w c w m · n ( T s u , n T n )
Q h , n = ρ w c w m · n ( T s u , n T r e , n )
T out = ( T in T a ) e λ k L k / ( c w ρ w m · k ) + T a
where m · p ( τ ) represents the water flow of primary network at the time τ , m3/h; T s u ( τ ) represents the temperature of the water supply out of the tank, °C; T r e ( τ ) represents the final return water temperature of the primary network, °C; T s u , n , T r e , n represents the primary network inlet and outlet water temperature at user n, °C; T n represents the secondary network inlet water temperature at user n, °C; λ k represents the heat transfer coefficient of the pipe at pipe k, W/(m2·°C); L k represents the length of pipe k, m; ε represents the heat transfer efficiency of the heat exchanger at user n, %; m · n represents the water supply flow of primary network at user n, m3/h; m · k represents the water supply flow in pipe k, m3/h; T in , T out represents the inlet and outlet water temperature of the pipe, °C; and Q h , n represents the heating demand of the building group at user n, kJ.

2.3.2. System Control Strategy

The starting and stopping of the solar collector and auxiliary heat source are affected by the temperature of tank. The control strategy of the solar heating system is shown in Figure 3. The upper limit value of the water tank heating temperature is 85 °C. When the difference between the outlet temperature of the solar collector ( T c o ) and the water tank temperature ( T S ) is larger than or equal to 8 °C and the water temperature of the heat storage tank is less than 85 °C, the circulating water pump at the collector end is turned on; otherwise it is turned off. When the water temperature of the heat storage tank is less than 50 °C, the auxiliary heat source is turned on; otherwise it is turned off. In Figure 3, S represents the start–stop control switch for each device, Sco represents the start-stop control switch for the solar collector, and Sgb represents the start-stop control switch for the auxiliary heat-source gas boiler. When the device start-stop factor S is equal to 0, the device is off; when S is equal to 1, the device is on.

2.3.3. Objective Function

For each building group, the optimization objective is to minimize the LCC of the centralized solar heating system in that building group. The objective function is
min LCC = min ( C R F y C i n + C o m C r c )
where C i n represents the total initial investment of all equipment in the system (including the cost of pipe network construction), CNY; C o m represents the operation cost of system equipment within the service life, CNY; C r c represents the residual value of system equipment, CNY.
The initial investment of the system can be expressed as:
C i n = C c o A c o + C tan k V tan k + C g b P g b + C p i p e L p i p e + C a n
where C g b represents the equipment cost per input power of gas-fired boiler, CNY/kW; C c o represents the unit price of solar collector, CNY/m2; C tan k represents the equipment cost of unit volume of water tank, CNY/m3; C p i p e represents the unit price of pipe network, CNY/m; L p i p e represents the total length of pipe network, m; C a n represents the cost of accessories, including piping accessories such as water pumps, valves, etc., CNY.
The annual operating and maintenance (O&M) cost of the heating system refers to the fuel consumption cost incurred by the equipment operation and the related transportation cost. In this study, the O&M cost largely consists of the cost of natural gas consumed by the heating equipment. Therefore, the operation cost of the system equipment during the operation period is
C o m = C u h g b i = 1 y Q h g b + C E i = 1 y L p u m p + C i n ζ
where C u h g b represents the unit heat price of the gas-fired boiler, CNY/kJ; Q h g b represents the annual heat output of gas boiler, kJ; C E represents the unit electricity price, CNY/kWh; L p u m p represents the cumulative power consumption of the pump in a year, kWh; ζ represents the ratio of equipment maintenance cost to equipment purchase cost, which is set to 2%.
The unit heat price of the gas-fired boiler can be calculated as
C u h g b = C g a s / ( η g b C a l g a s )
where C g a s represents the unit price of the gas, CNY/m3, and C a l g a s represents the calorific value of natural gas, kJ/m3.
The residual value of system equipment is calculated using Equation (16):
C r c = C i n r .
where C r c represents net residual value of fixed assets (portion of the residual value of a fixed asset at the end of its useful life, less any fixed asset liquidation costs payable), CNY, and r represents the ratio of the net residual value of fixed assets to the original value of fixed assets (varies in the range of 3–5% [52], set to 4% in this paper).
The capital payback factor is calculated as follows:
C R F = i ( 1 + i ) y ( 1 + i ) y 1
where i is the annual interest rate, set to 8%, and y is the service life of the system, set to 15 years [53].

2.3.4. Constraints

(1)
Equality constraints
For each building group, the hourly heating supply of the solar heating system should always be equal to the hourly heating demand of all users in the building group. The mathematical expression of the equality constraint is
Q s c ( τ ) + Q g b ( τ ) Q tan k ( τ ) - Q tan k l o s s ( τ ) - Q p i p e l o s s ( τ ) = Q h ( τ )
where Q tan k ( τ ) represents the amount of heat stored by the water tank at the time τ , kJ.
(2)
Inequality constraints
The system inequality constraints are expressed as follows.
0 A c o A max
0 V s x V max
0 P g b Q hmax η load η gb
40   ° C T S 85   ° C
where A c o represents the total area of all solar collectors, m2; V s x represents the volume of water tank, m3; and Q hmax represents the maximum heating demand of building group, in this case the maximum hourly heating load is set as 6.55 kW. The maximum area limit for solar flat plate collectors is taken from a simulated typical building, whose roof area is 65.88 m2. The related parameter settings are shown in Table 1.
At the beginning, the water temperature in the water tank is set to 50 °C, and the temperature of the working medium in the collector is set to 10 °C.
The model is solved using the genetic algorithm in the Matlab environment, with the time step set to one hour and the whole heating season (1 November to 31 March) set as the calculation cycle. The optimization variables include the total area of solar collectors ( A c o ), volume of water tank ( V tan k ), and rated power of gas-fired boiler ( P g b ). The related calculation parameter settings are shown in Table 2.
The population initialization number of genetic-algorithm-related studies is generally set within 50 to 200 in the relevant literature [56,57]. Each individual in the initialized population corresponds to the capacity of a device in an optimized configuration scheme. Within the reasonable range, the population initialization number is set to 150 in this study, and the number of iterations is set to 20.

2.4. Comparison and Selection of Optimal Building Clustering Scheme and Optimal System Design

After multiple clustering schemes are obtained through density-based cluster analysis, we can optimize the design of solar heating system for each building group in each scheme and calculate the LCC of the solar heating system of each building group. Thus, the total LCC of the solar heating systems in each building clustering scheme can be obtained by adding up the LCCs of the solar heating systems of all building groups in that building clustering scheme. The scheme with the lowest total LCC is the optimal building clustering scheme, and the corresponding system design is the optimal design of the centralized–decentralized hybrid solar heating system [58]. The principle is shown in the following equation.
T L C C = min i = 1 n LCC ( c l u s t e r i )

3. Results

3.1. Case Analysis

Taking a virtual village in Tibet as an example, this paper selects a typical building to simulate different heating load on a typical day (17 January) for analysis. The typical building has two floors, with a total building area of 131.76 m2. In rural areas, there are various type of buildings with different functions, including office buildings such as village committees and some scattered offices. As some rural residents work at office buildings in the daytime and rest in residential buildings at nighttime, the heating demands of office buildings and residential buildings are totally different. Thus, the office building, together with other two types of residential buildings, are assumed to be the three typical buildings in this study. Three major building heating load types are generated via TRNSYS simulation: residential building heating load (type 1) with people staying in the rooms all day (stay time: 00:00–24:00), residential building heating load (type 2) with people out during the day (stay time: 18:00 current day–08:00 next day), and office building heating load (type 3) with people working in the rooms during work hours (stay time: 08:00–18:00). Table 3, Table 4 and Table 5 show the specific differences of the three types.
The envelope parameters for a typical building are set [59] as shown in Table 6. The ventilation rate for heating is set to 0.5 times/h [59], the cold air permeability coefficient is set to 0.2 times/h [59], and only the bedrooms and living rooms are heated (the staircase is not heated). The target indoor temperature is set to 15 °C [60], which can basically meet the needs of people’s daily work and living. The lighting power density is set to 6 W/m2, the equipment power density is set to 3.8 W/m2, and it is assumed that there are two persons in one bedroom and three persons in a living room. The windows are double-layer insulating glass, and the heat transfer coefficient is 2.88 W/(m2·K). The three types of heating loads on the typical day are shown in Figure 4.
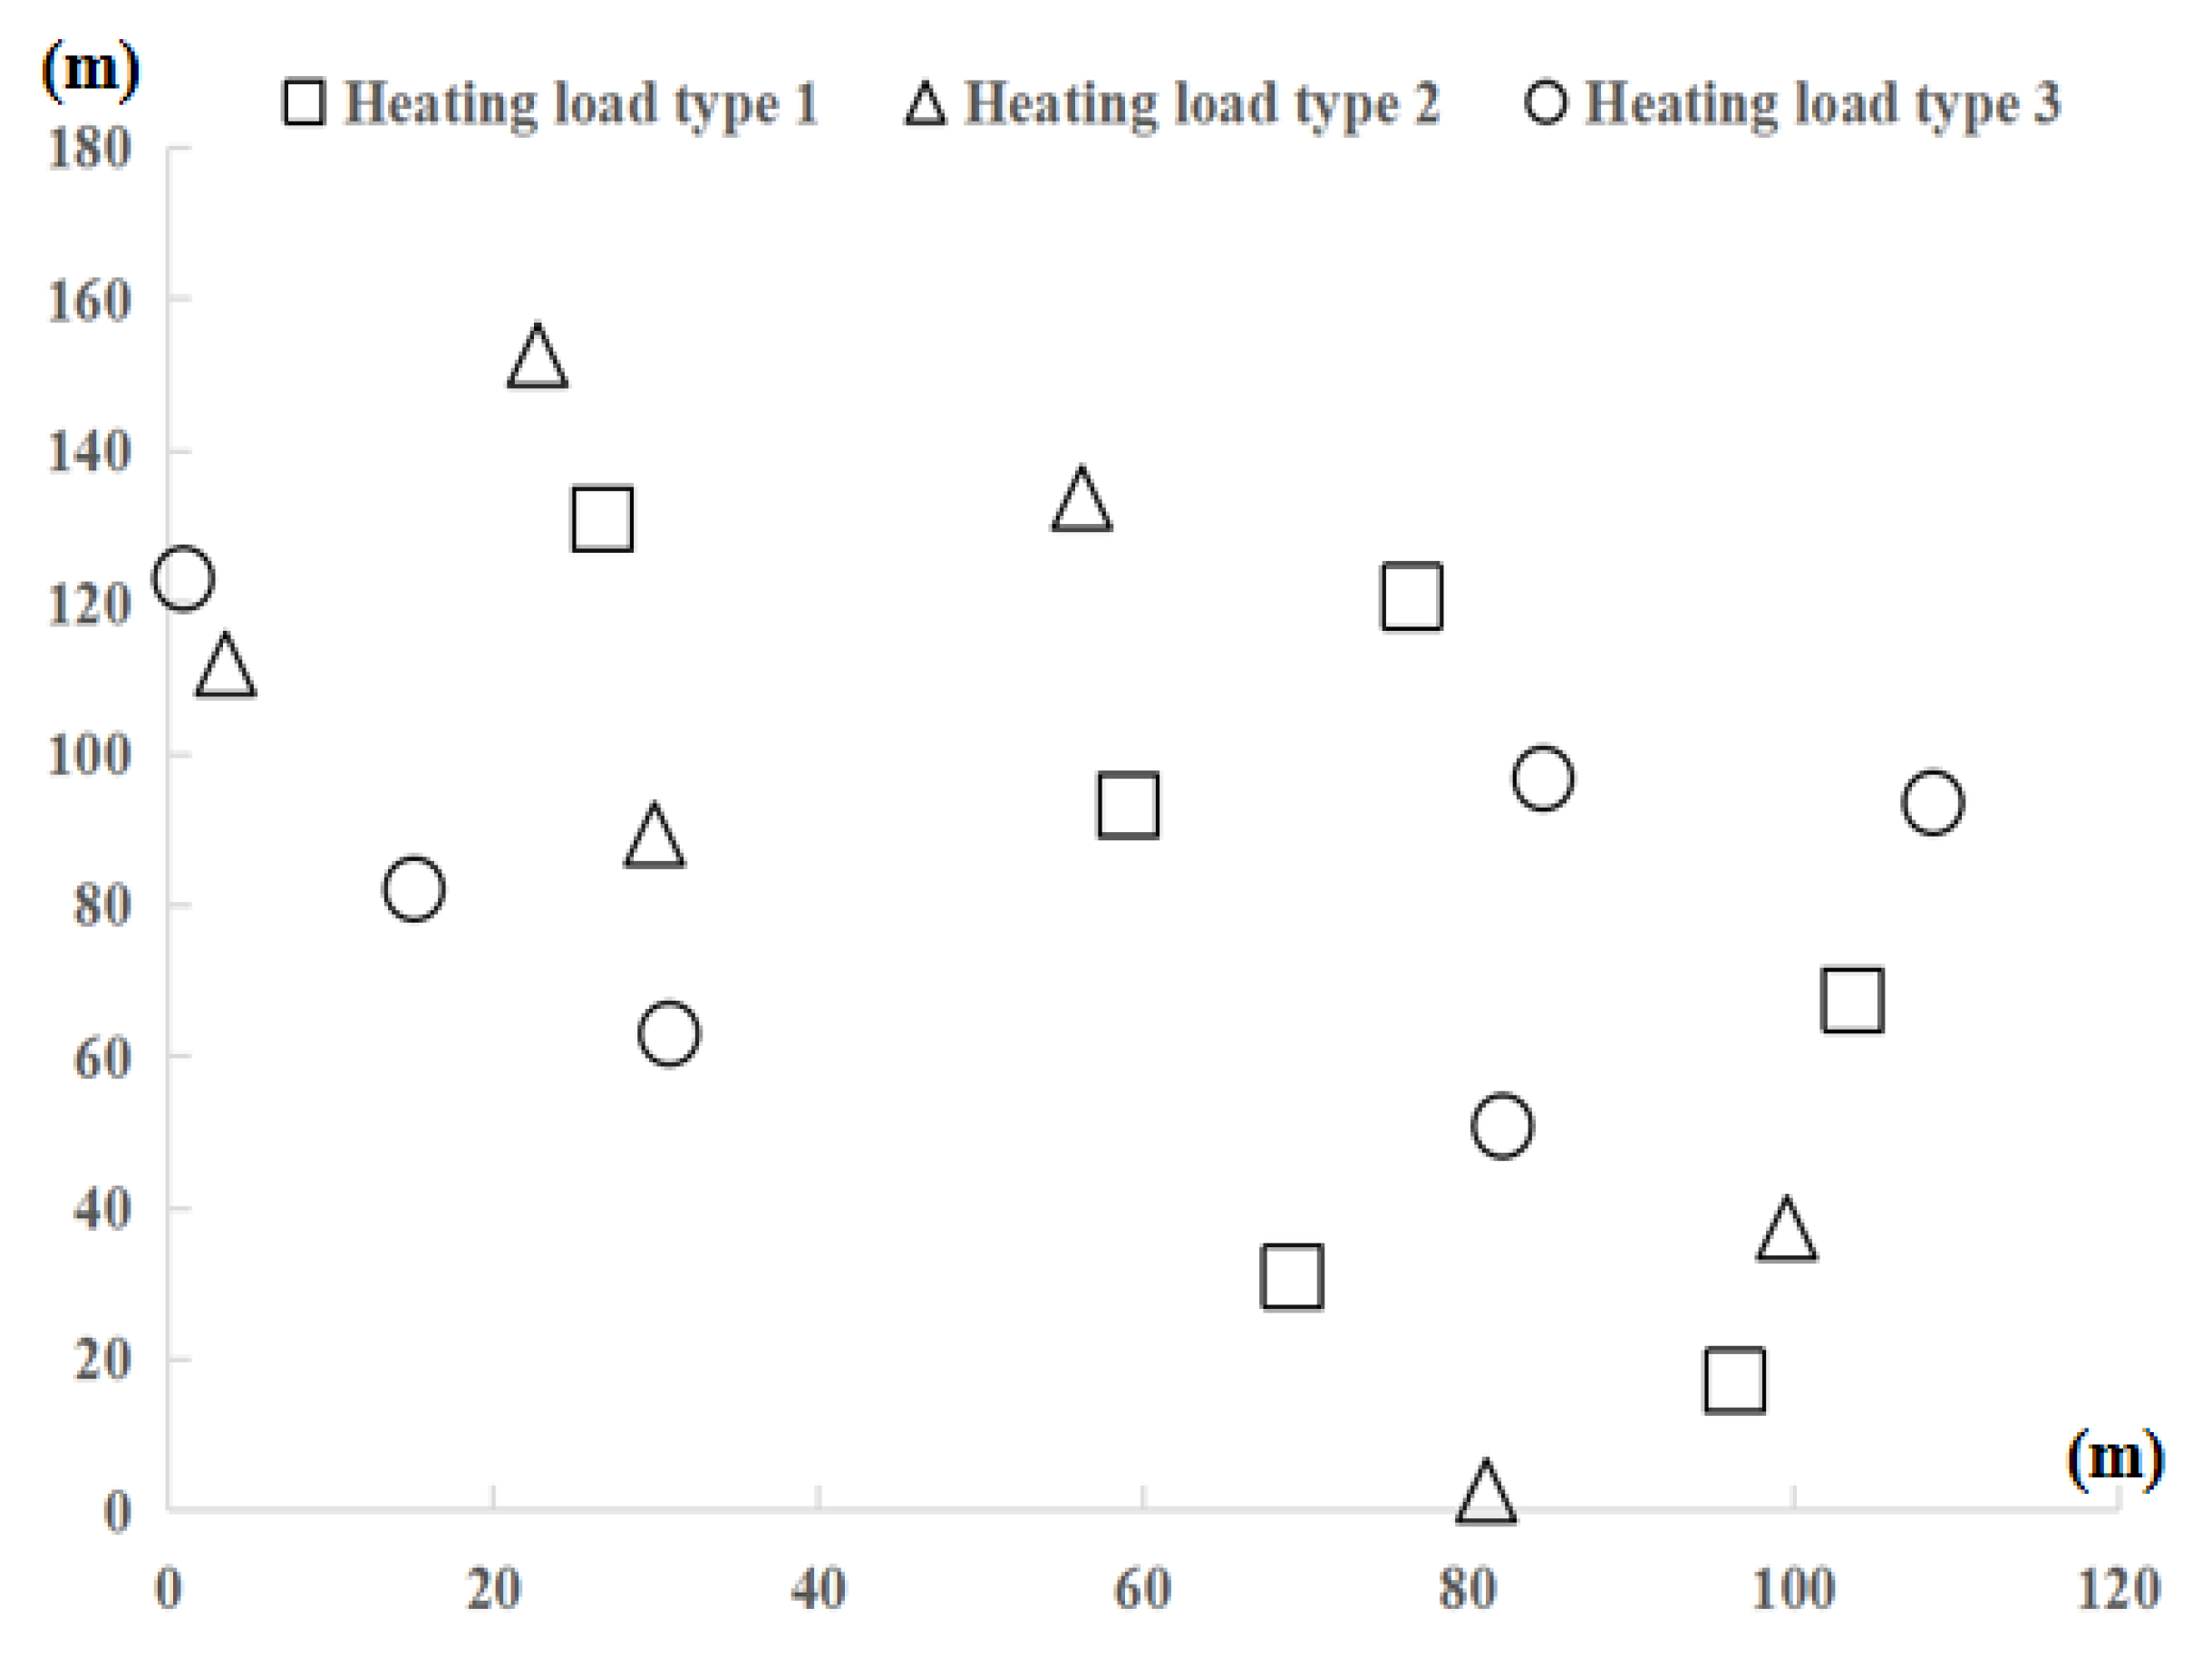
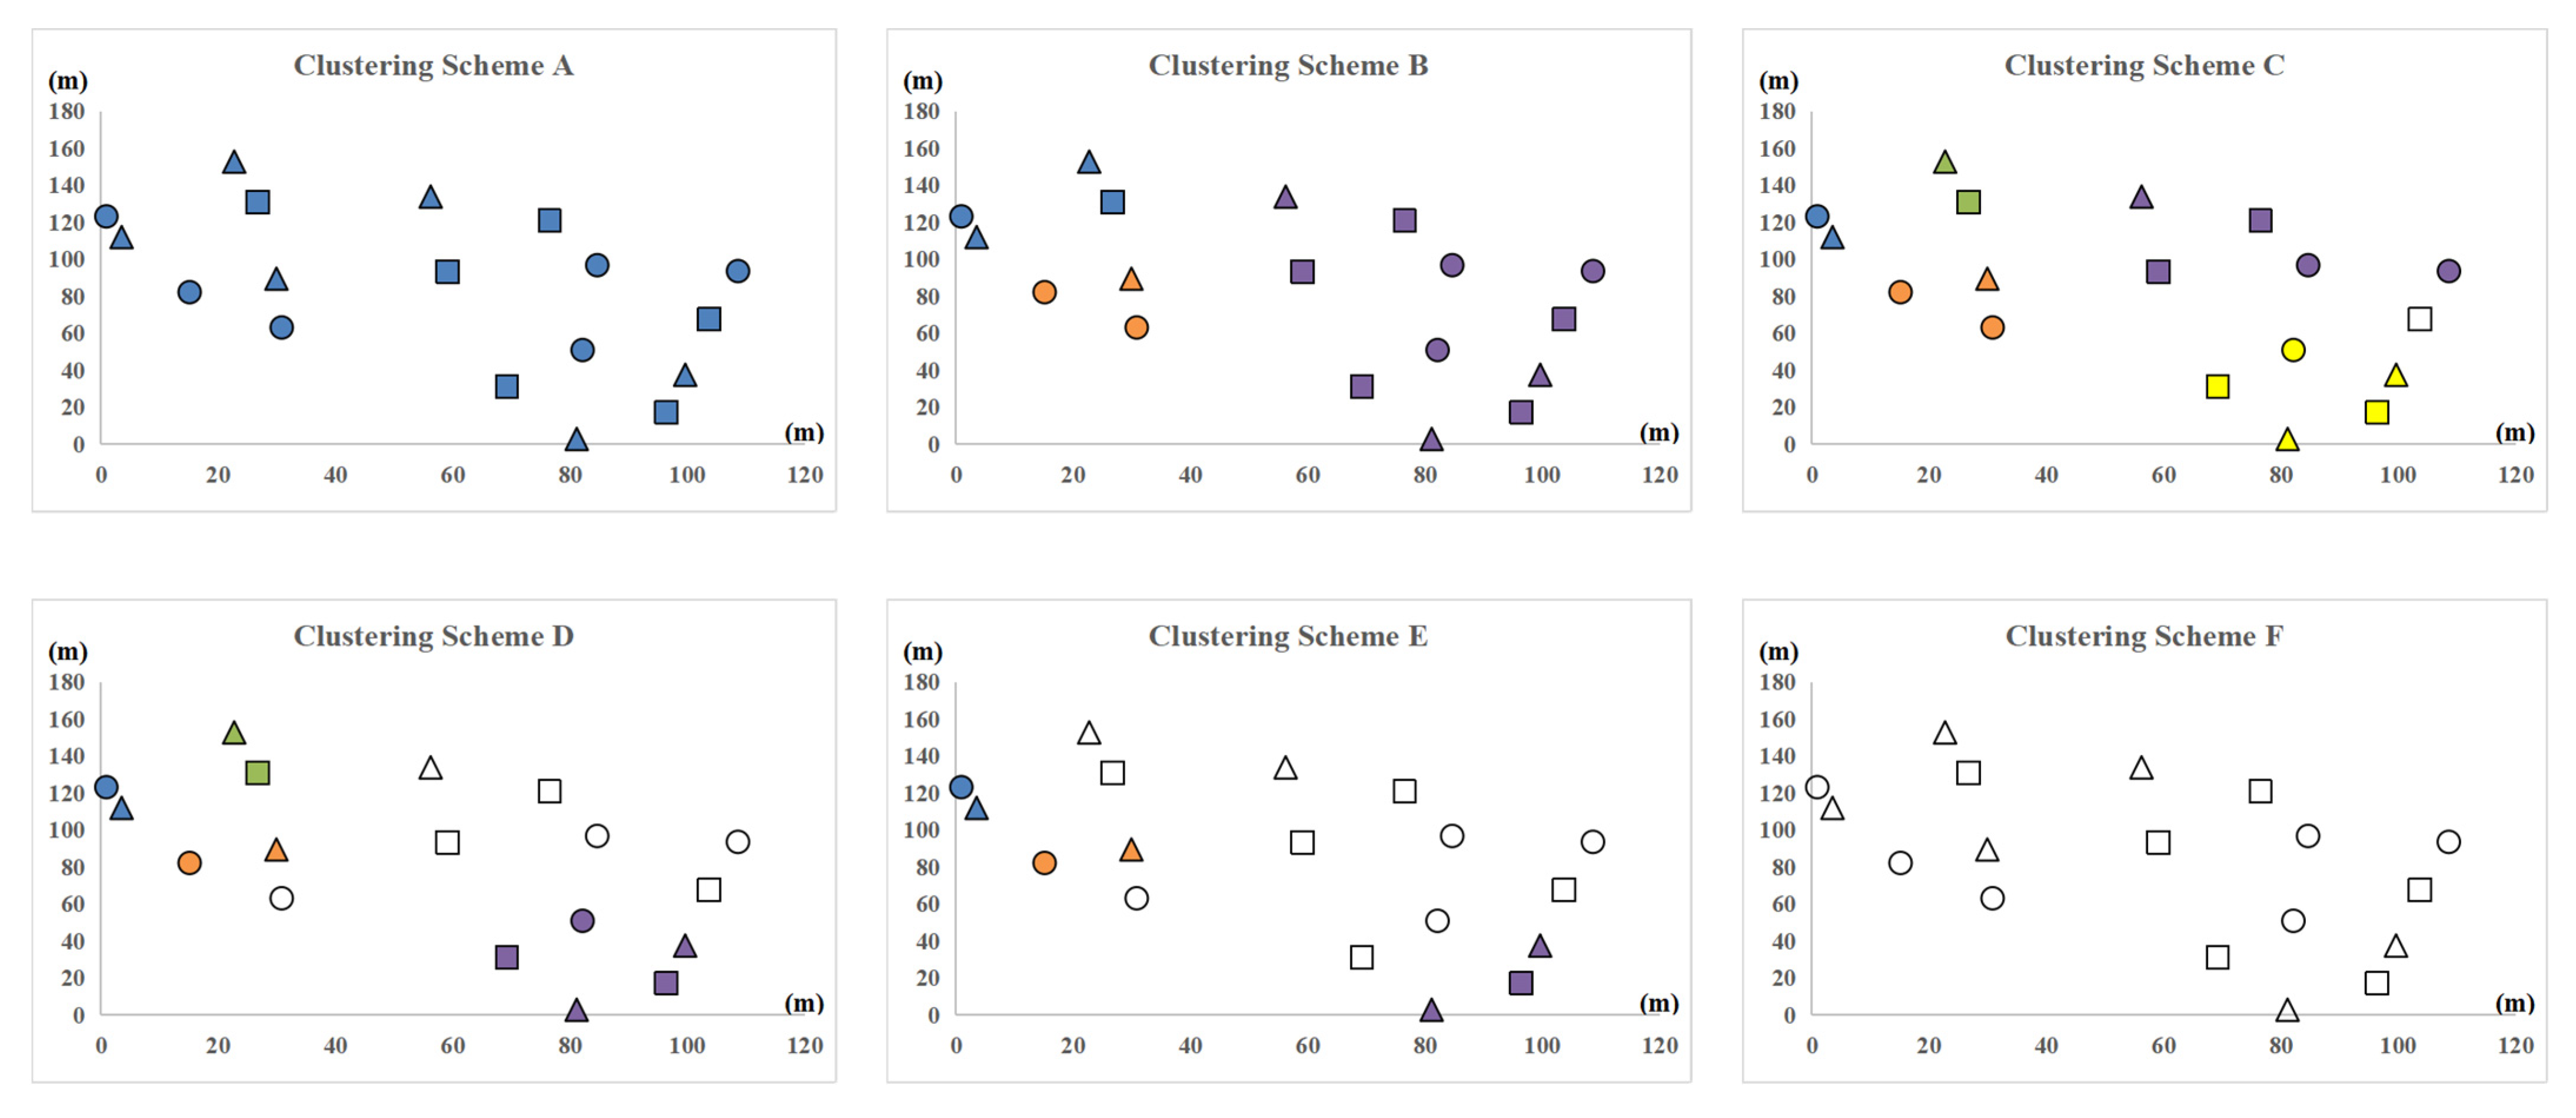
Taking the building spatial layout of a virtual village in Tibet as an example, we assigned the above three types of heating loads randomly to the 18 buildings (assumed to be identical) in the village (Figure 5). The district heating radius for this virtual village is 86.24 m. Each point in Figure 5 represents a building, and different shapes represent different load types. The buildings were then clustered using the DBSCAN density-based clustering method, during which equal-distance adjustments were made within the neighborhood radius range (22–34 m) and the minimum sample number range (1–7). Totally six different building clustering schemes were obtained and are shown in Figure 6. Different clustering schemes were named A, B, …, F in the ascending order of the number of building groups. Different clusters are distinguished by different colors. For example, there are in total three clusters in scheme B, so the three clusters are marked with three different colors. The hollow dots indicate that the single building constitutes a building group, and its heating demand is satisfied by the single-household solar heating system.

3.2. Optimization Results

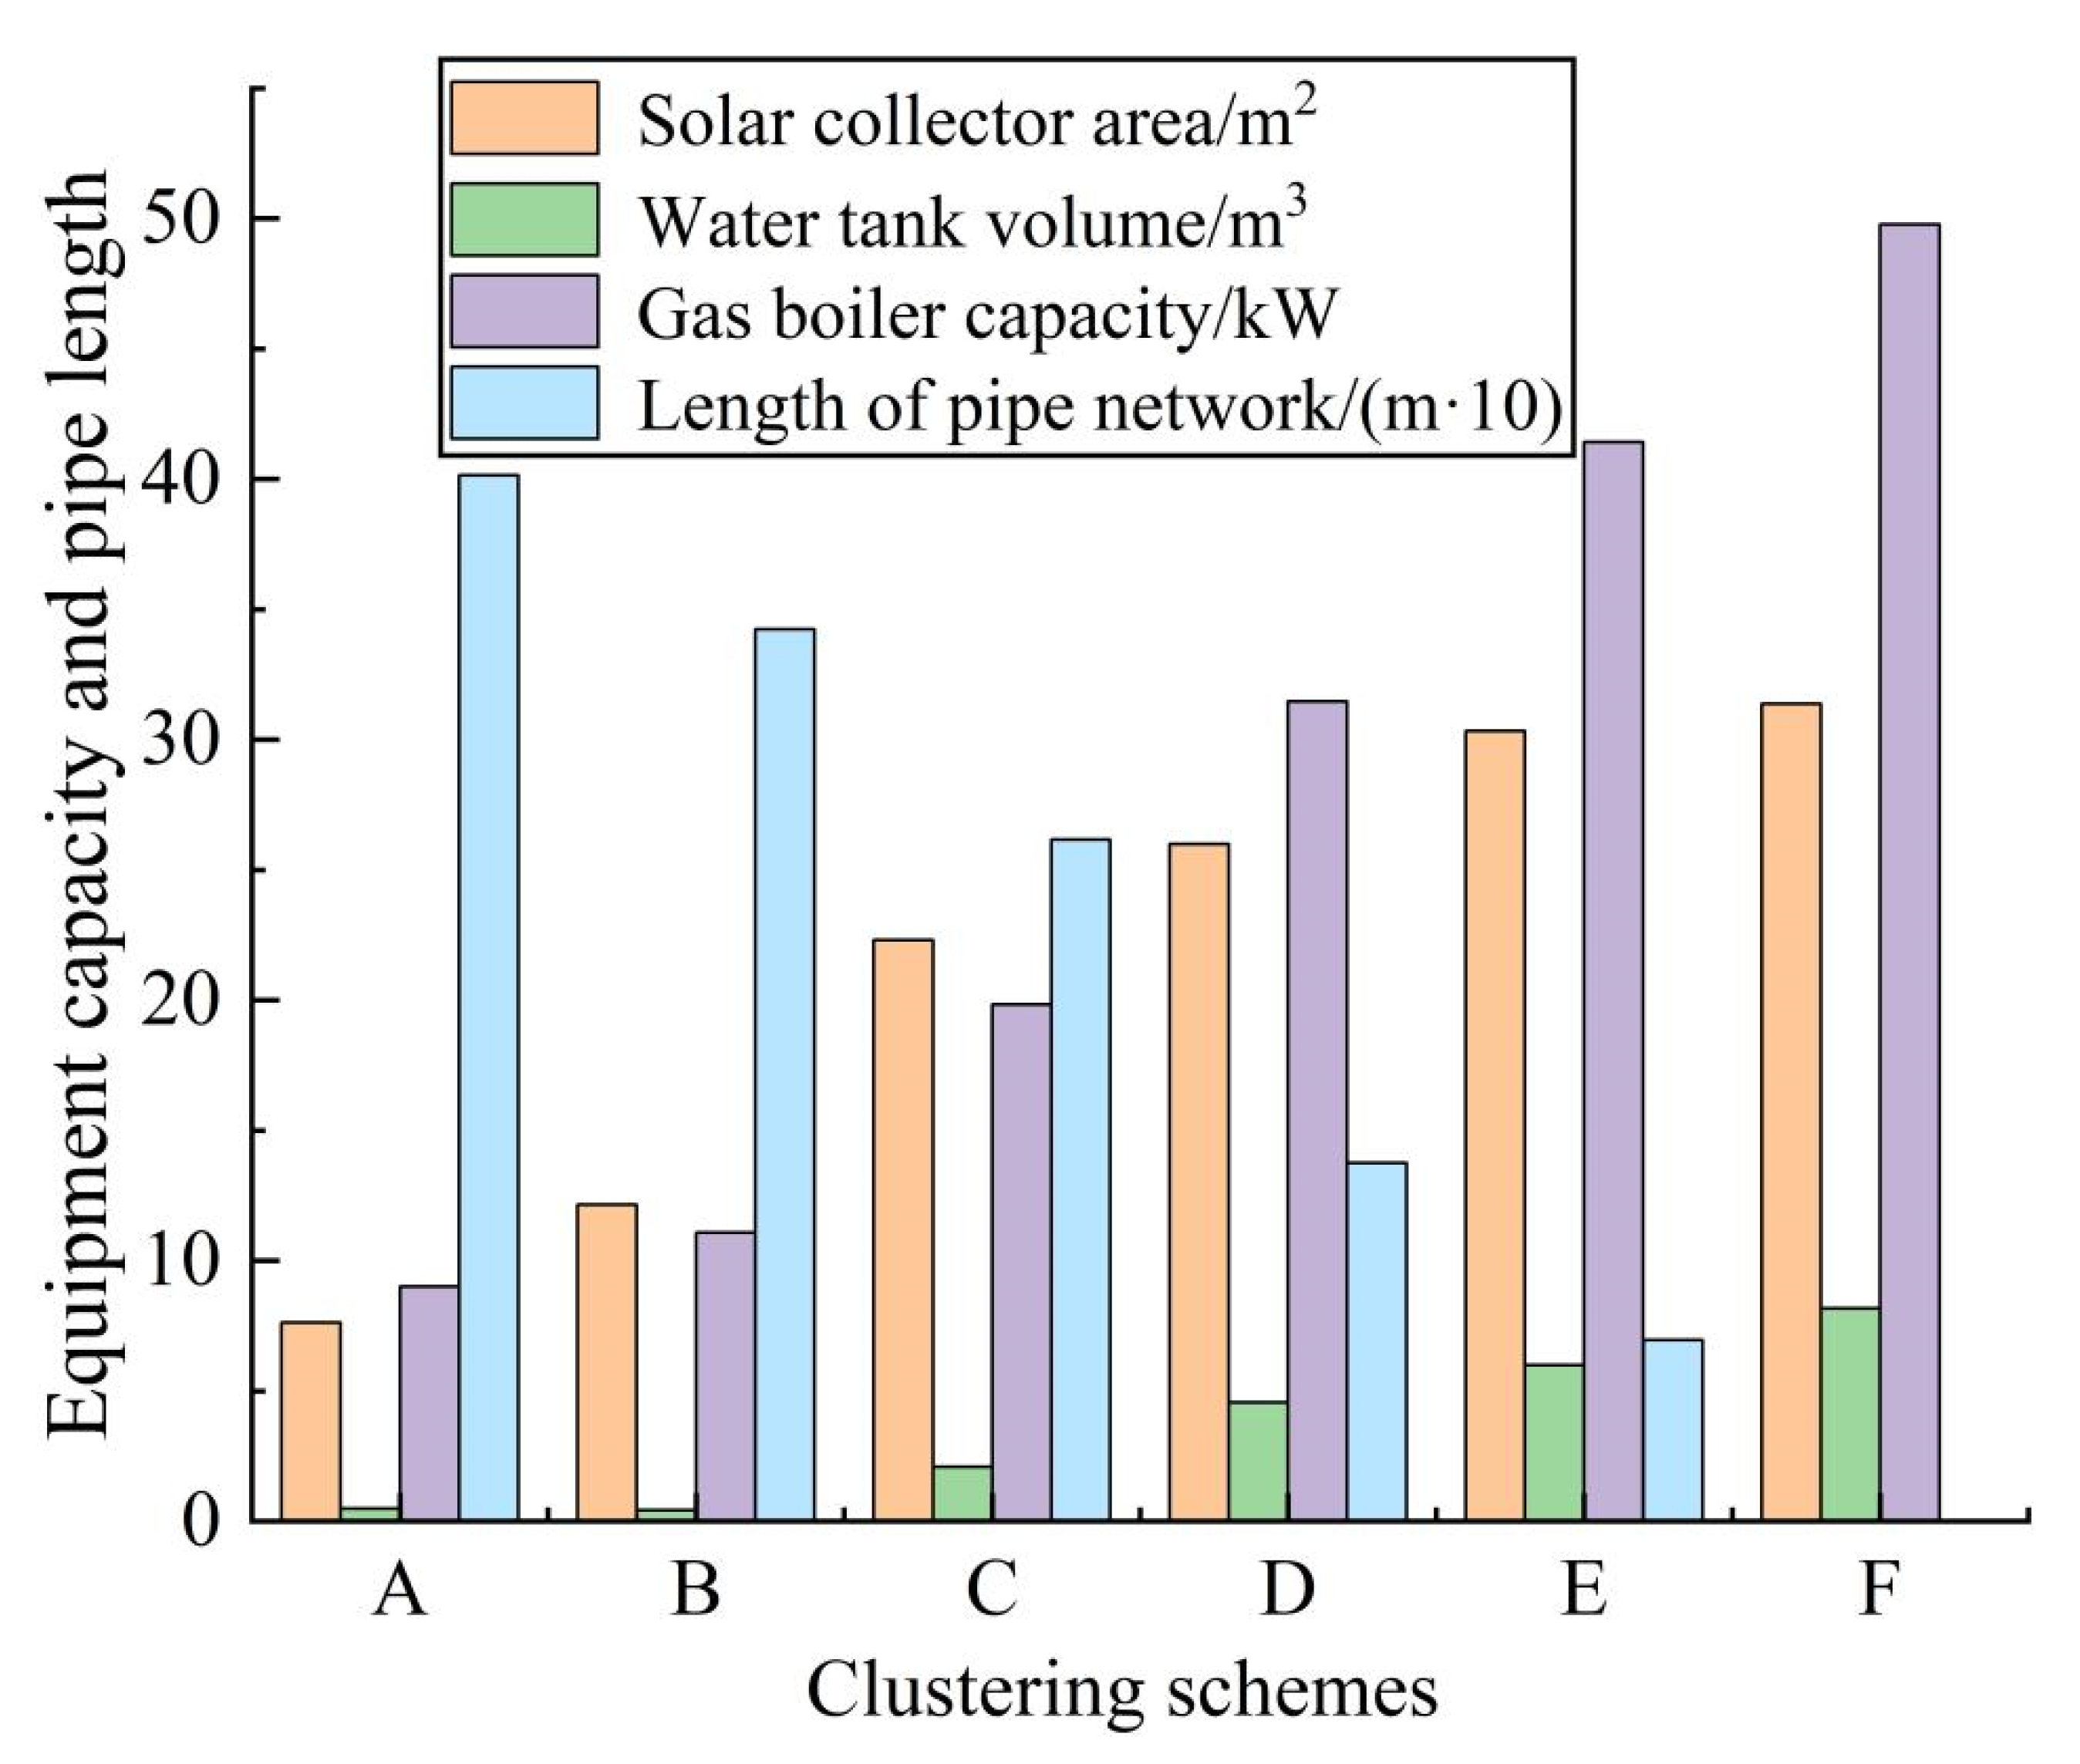
The design optimization of the centralized–decentralized hybrid solar heating system was carried out under 6 building clustering schemes, and the results are shown in Figure 7. As can be seen from Table 7 and Figure 7, with the increase of the number of building groups (i.e., clustering scheme changes from A to F), the total collector area, total tank volume, and gas-fired boiler capacity of the centralized–decentralized hybrid solar heating system show a gradual increasing trend, while the length of the heating pipes show a continuous decreasing trend. When the clustering scheme changes from A to F, more and more buildings start to be heated by single-household solar heating systems, resulting in an increase in the capacity of heat-generating equipment, but the surplus capacity takes a large proportion because the complementing effect between the heating loads of different buildings is not fully utilized. When the number of building groups increases, the building spacing in each building group decreases, so the length of heating pipeline decreases correspondingly.
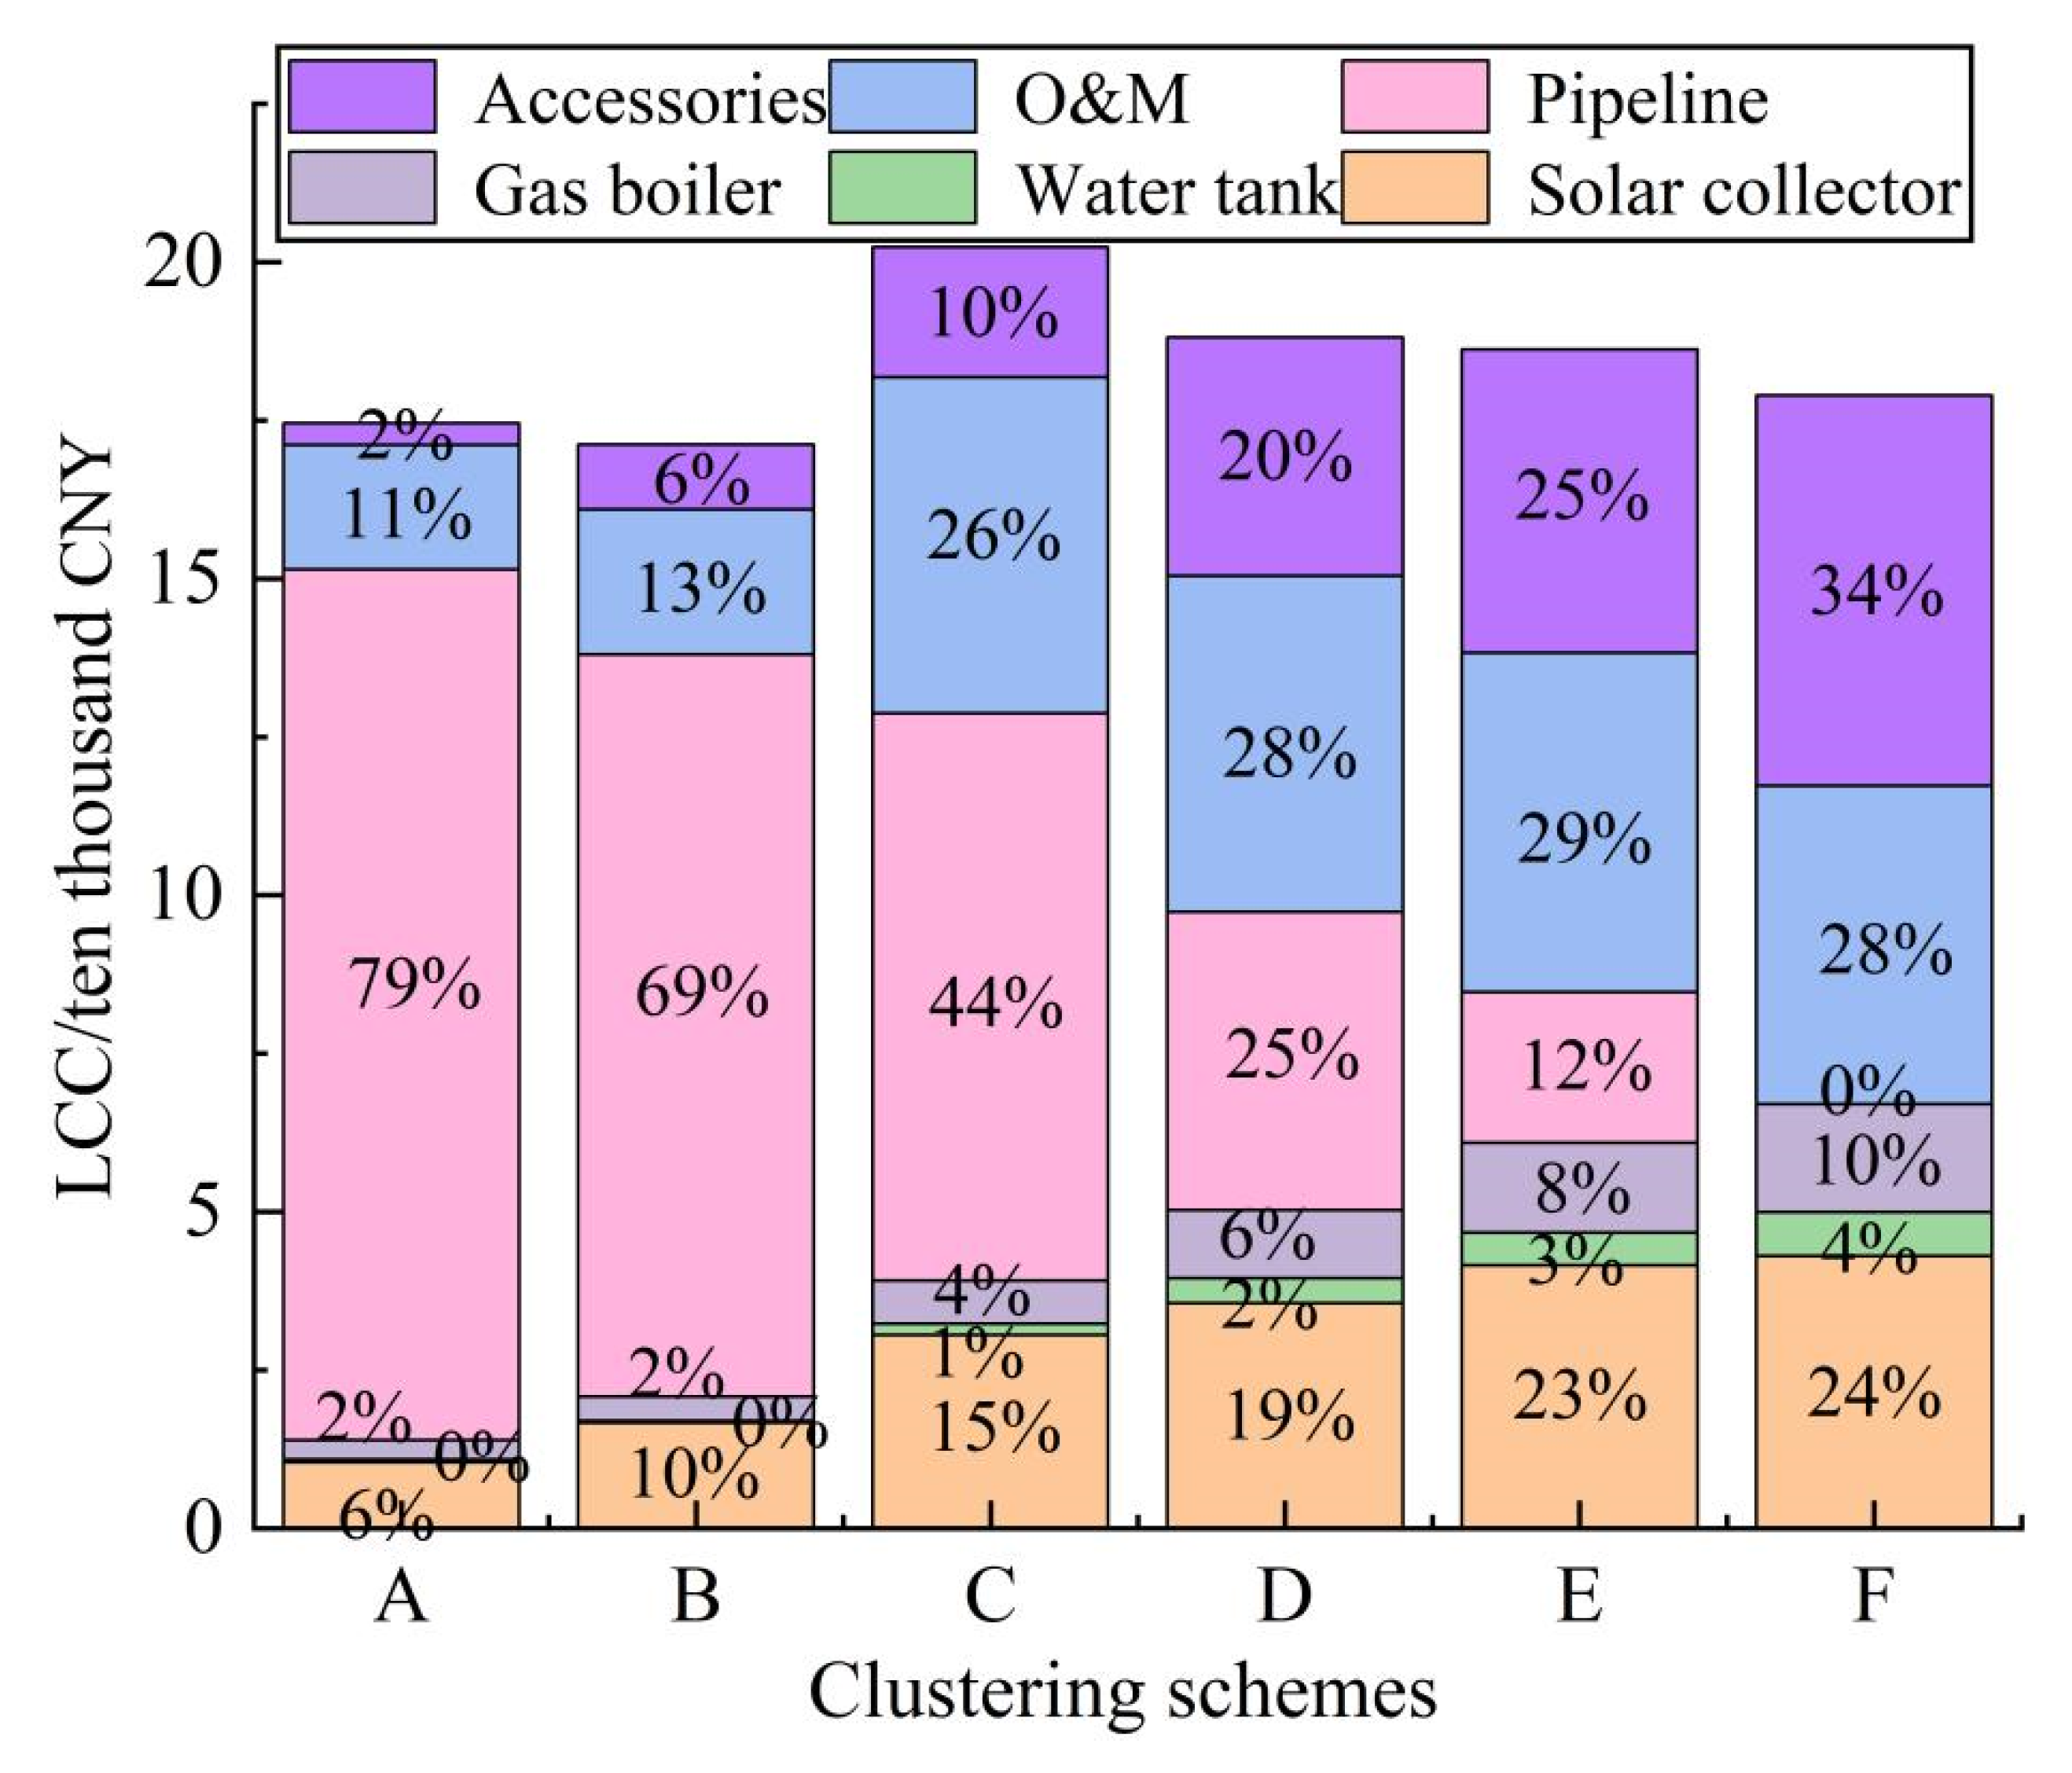
Figure 8 shows the system LCC and its breakdown under different building clustering schemes. It can be seen from Figure 8 that the system LCC decreases first, increases suddenly, and then decreases with the increase in the number of building groups. Under scheme B (the number of building groups is 3), the LCC of the centralized–decentralized hybrid solar heating system is the lowest (171,200 CNY). The design of a district solar heating system based on building clustering is carried out after taking full advantage of the complementary characteristics of heating load between adjacent buildings. Compared with the fully centralized system and fully decentralized system, the centralized–decentralized hybrid solar heating system in the studied case could achieve a life cycle cost (LCC) saving of 4.8% and 2.3%, respectively.
The above variation patterns can be explained as follows: (1) When the clustering scheme changes from A to B, the number of building groups increases from 1 to 3, the scale of building groups and the total length of the heating pipelines decrease, so the pipeline cost and heat transmission loss decrease. (2) When the clustering scheme changes from B to C, the number of building groups increases from 3 to 6 and single-household heating systems begin to appear. As each system is only used to meet the heating demand of a single household, the single-household heating systems will increase the surplus capacity of the system, resulting in a greater increase in the cost of heat-generating equipment and operating costs than the reduction in pipework costs. (3) When the clustering scheme changes from C to F, more and more buildings are heated by single-household heating systems, resulting in an increase in the surplus capacity of heat-generating equipment. However, the pipeline cost decreases more. Therefore, with the increase in the number of building groups, the total system LCC has been basically reduced in sync with the pipeline cost. Compared with single-household solar heating, centralized–decentralized hybrid solar heating based on building clustering can effectively reduce the capacity of other equipment in the system except the heating pipeline, but this will also increase the length of the heating pipeline. Therefore, whether building clustering can reduce the LCC of the heating system in the whole region highly depends on the heating network, which is characterized by the pipeline price and building spacing. Thus, it is necessary to conduct sensitivity analysis from the perspectives of both pipeline price and building spacing.

4. Discussion

In order to gain insights into how the clustering schemes can be appropriately made, sensitivity analysis was carried out as a theoretical analysis of several virtual cases to identify potential patterns in the clustering results related to pipeline price and building spacing. According to the above analysis, the price of heating pipeline will significantly affect the selection of the building clustering scheme, which in turn will affect the design of the solar heating system. In order to investigate the influence of the pipeline price on the design of solar heating system, we compared the system LCC of a typical solar heating system under different pipeline prices (100 CNY/m, 150 CNY/m, 200 CNY/m, 250 CNY/m, and 300 CNY/m) with different building clustering schemes. The results are shown in Figure 9.
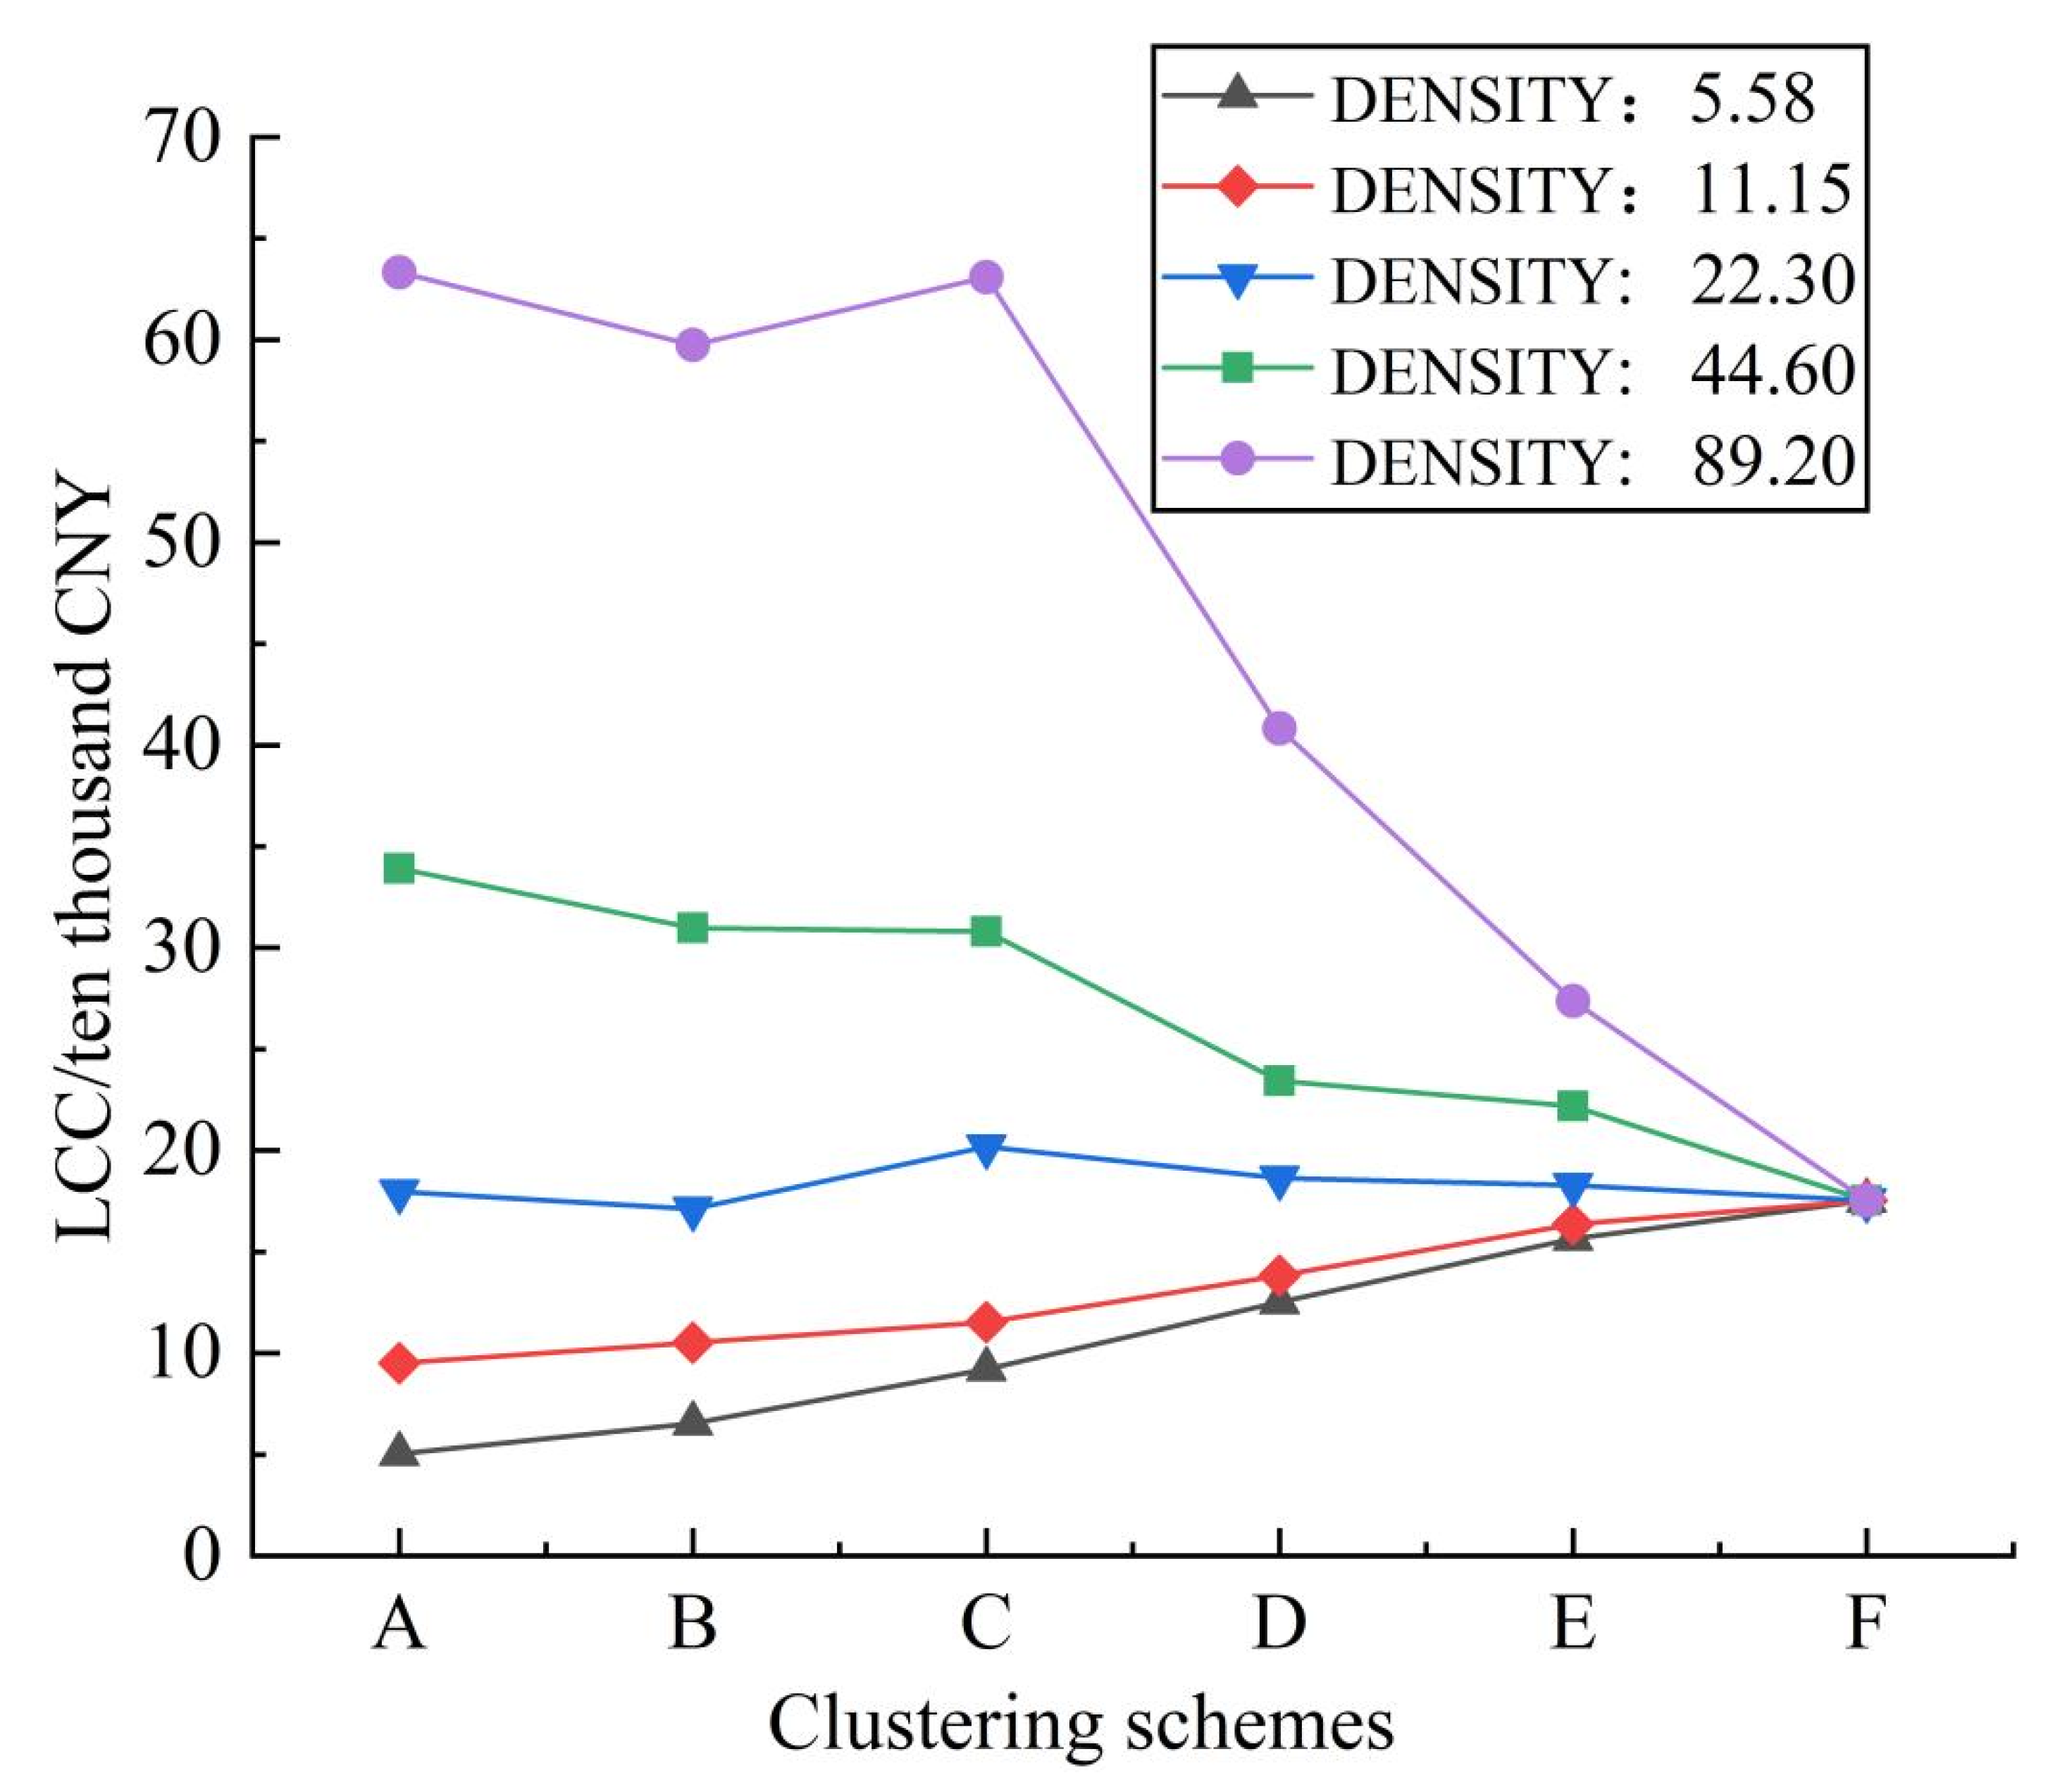
In Figure 9, the vertical axis represents the total LCC of the solar heating systems in the cluster, and the horizontal axis represents different clustering schemes from A to F. Different colors represent the LCC under different pipeline prices. The price of the heating pipeline has a significant impact on the selection of optimal building clustering scheme. Under the clustering scheme F, each building represents a building cluster that has its own solar heating system. As there is no heat transmission between different buildings, there is no need to build heating pipelines. Thus, the system LCC remains unchanged, which is zero, when the heating pipeline price changes. When the clustering scheme changes from A to F under the pipeline price of 200 CNY/m, the total cost of heating system decreases first, increases afterwards, and decreases again. However, the range of variation is not significant, so this price can be used as the price threshold to judge whether the local area is suitable for deploying a centralized–decentralized hybrid solar heating system or not. When the pipeline price is much higher than 200 CNY/m, the optimal building clustering scheme is F. When the pipeline price is much lower than 200 CNY/m, the optimal building clustering scheme is A. When the pipeline price is close to 200 CNY/m, the optimal system design becomes hard to predict. Because all factors, including climate, building layout, and building load in a region may all impact the design results, the determination of price threshold is highly related to the specific case. Thus, it is necessary to conduct research based on the local conditions in order to determine the optimal building clustering scheme and heating system design.
In order to appropriately represent the impact of building spacing on the design result, we assumed that heating radius of the village expands from 21.56 m to 344.96 m, and the building spacing increases proportionally [61]. In order to quantitatively assess the aggregation level of each cluster, a density index [44] is introduced in this study. The density index is calculated by the following equation:
D E N S I T Y = L M S T N
where N is the number of buildings in one cluster and L M S T is the total length of heating pipeline used for transmitting heating to these buildings in the same cluster, m. The building density of the target area is 22.30.
The system LCCs under different building spacings with different building density schemes are shown in Figure 10.
As can be seen from Figure 10, the building density also has a significant impact on the selection of an optimal building clustering scheme. Similar to the analysis about the impact of pipeline price on the system design, there also exists a threshold that can be used to judge whether the centralized–decentralized hybrid solar heating system is necessary. For the specific case in this study, the density of 22.30 can be regarded as the threshold, because there is no obvious fluctuation in the system LCC when building clustering scheme changes. When the building density is less than 22.30, a centralized–decentralized hybrid solar heating system is favorable. When the building density is more than 22.30, fully decentralized solar heating system is favorable. Overall, the above results indicate that centralized–decentralized hybrid solar heating system could achieve the ideal cost-saving effect only when the pipeline price and building density fall into a certain range. Otherwise, either fully centralized heating or fully decentralized heating is the optimal system design.
It is clear from the optimization results that the design of energy systems in rural areas needs to take full account of local energy conditions and tailor energy policies to local conditions. For energy companies, various service packages should be introduced to meet the needs of different rural residents. For the government, a well-directed and preferential subsidy policy [62] should be developed to encourage and stimulate rural residents to participate in renewable energy utilization projects. However, the actual conditions of the target area should be fully considered, e.g., the building layout, energy demands, and natural resources. Moreover, differences in household assets, demographic characteristics, and other livelihood capital may lead to different energy consumption behaviors [63]. Therefore, there is a need to select appropriate technology pathways and support policies to accelerate the diffusion of renewable energy in rural areas.

5. Conclusions

This paper presents a building clustering method combining DBSCAN density clustering and Kruskal algorithm, taking into account the complementary characteristics of thermal loads between buildings, and proposes an optimization model of a centralized–decentralized hybrid solar heating system that is capable of providing the optimal design of solar heating system for each cluster scheme. The following conclusions can be drawn through calculation and analysis:
(1)
As the number of building groups increases, the total pipe length of a centralized–decentralized hybrid solar heating system gradually decreases, while the total collector area, total tank volume, and gas-fired boiler capacity all show a gradual increasing trend. Compared with the fully centralized design and fully decentralized design, the centralized–decentralized hybrid solar heating system in the studied case could achieve an LCC saving of 4.8% and 2.3%, respectively. In the case of relatively dispersed building layouts, a centralized–decentralized hybrid solar heating systems for rural areas is a more suitable option.
(2)
The economic cost of centralized–decentralized hybrid solar heating systems basically varies in sync with the cost of the heating pipeline in the system, but the emergence of single-household solar heating systems may greatly increase the operating cost. Whether building clustering can reduce the economic cost of the heating system in the whole region highly depends on the heating network, which is largely decided by the pipeline price and building spacing.
(3)
Finding the threshold of pipeline price and building density can simplify the procedure to determine the necessity of designing a centralized–decentralized hybrid solar heating system. However, the determination of the threshold values is highly case-specific. In this study, thresholds for pipe prices and building density were found between the upper and lower limits, and using the proposed method, it is possible to design an energy system solution that suits the local building layout.
This study develops a framework to optimally design the district centralized–decentralized hybrid solar heating system based on building clustering, the impact of some important factors (e.g., device prices and building spacing) on the design results are analyzed by conducting sensitivity analysis, and the threshold values of these factors deciding the system configurations are given. In fact, the co-utilization of the same solar heating system will lead to the cost allocation problem in real engineering, which is not considered in this study. Moreover, the social relationship between energy users in different buildings may also significantly impact the heating system design, as some building owners may be reluctant to share the same heating system. In the following study, the social relationship between the owners of the buildings and the cost allocation issue will be fully considered, so as to expand this study.

Author Contributions

All authors contributed significantly to this study. Conceptualization, Y.L.; methodology, D.H. and X.L.; software, D.H.; validation, T.M.; formal analysis, D.H.; investigation, D.H. and T.M.; resources, X.L.; data curation, D.H.; writing—original draft preparation, D.H.; writing—review and editing, X.L.; visualization, D.H.; supervision, X.L.; project administration, X.L.; funding acquisition, X.L. All authors have read and agreed to the published version of the manuscript.

Funding

This research was funded by the National Natural Science Foundation of China, grant number 52008328; and the Shaanxi Provincial Department of Education Key Laboratory Scientific Research Project, China, grant number 19JS041.

Data Availability Statement

All data generated or appeared in this study are available upon request from the corresponding author.

Conflicts of Interest

The authors declare no conflict of interest.

Nomenclature

T S water tank temperature, °C
T c o outlet temperature of collector, °C
T c i inlet temperature of collector, °C
T α ambient temperature, °C
T s u temperature of the water supply out of tank, °C
T r e final return water temperature of primary pipe network, °C
Q S C heat collection capacity of collector, kJ
Q g b heat output from gas boiler, kJ
Q tan k l o s s heat lost to the ambient environment from water tank, kJ
Q p i p e l o s s amount of heat loss from the transmission of pipe network, kJ
Q h heating demand of building group, kJ
Q tan k heat stored by water tank, kJ
A c o total area of all solar collectors, m2
V tan k volume of water tank, m3
P g b rated power of gas-fired boiler, kW
F R dimensionless heat transfer factor of collector
I C solar radiation intensity, W/m2
U L total heat loss coefficient of collector, W/(m2·°C)
U tan k heat loss coefficient of water tank, W/(m3·°C).
L M S T the distance obtained by Kruskal Minimum Spanning Tree, m
Q hgb the annual heat output of gas boiler, kJ
F R U L total heat loss coefficient, W/(m2·°C)
η l o a d the operating load rate of gas boiler, %
E p s the neighborhood radius, m
C i n total initial investment cost, CNY
C o m operation and maintenance costs, CNY
C r c residual value, CNY
C g b equipment cost per input power of gas boiler, CNY /kW
C c o equipment cost per solar collector, CNY /m2
C tan k equipment cost per tank volume, CNY /m3
C p i p e unit price of pipe network, CNY/m
C a n cost of accessories, including piping accessories such as water pumps, valves, etc., CNY
C u h g b unit heat price of gas-fired boiler, CNY/kJ
C E unit electricity price, CNY/kWh
L p u m p cumulative power consumption of pump in a year, kWh
C R F capital payback factor
y service life of the system, year
i annual interest rate, %
r ratio of residual value to original value, %
ε heat transfer efficiency of heat exchanger, %
λ k heat transfer coefficient of pipe at pipe k, W/(m2·°C)
c s specific heat of thermal mass, kJ/(kg·°C)
m s c circulation mass flow of collector, kg/h
N the number of buildings in the same cluster
C a l gas calorific value of natural gas, kJ/m3
ζ the ratio of equipment maintenance cost to equipment purchase cost, %
η g b the heating efficiency of gas boiler, %
M i n p t s minimum number of samples
w ( T ) the minimum edge weight, m
D E N S I T Y the density index
LCClife cycle cost, CNY
DBSCANDensity-based Spatial Clustering of Application with Noise

References

  1. Luo, X.; Liu, Y.; Liu, X. Bi-level multi-objective optimization of design and subsidies for standalone hybrid renewable energy systems: A novel approach based on artificial neural network. J. Build. Eng. 2021, 41, 102744. [Google Scholar] [CrossRef]
  2. Luo, X.; Liu, Y.; Feng, P.; Gao, Y.; Guo, Z. Optimization of a solar-based integrated energy system considering interaction between generation, network, and demand side. Appl. Energy 2021, 294, 116931. [Google Scholar] [CrossRef]
  3. Allegrini, J.; Orehounig, K.; Mavromatidis, G.; Ruesch, F.; Dorer, V.; Evins, R. A review of modelling approaches and tools for the simulation of district-scale energy systems. Renew. Sustain. Energy Rev. 2015, 52, 1391–1404. [Google Scholar] [CrossRef]
  4. Zhou, D.; Ding, H.; Wang, Q.; Su, B. Literature review on renewable energy development and China’s roadmap. Front. Eng. Manag. 2021, 8, 212–222. [Google Scholar] [CrossRef]
  5. Rämä, M.; Mohammadi, S. Comparison of distributed and centralised integration of solar heat in a district heating system. Energy 2017, 137, 649–660. [Google Scholar] [CrossRef]
  6. Morvaj, B.; Evins, R.; Carmeliet, J. Optimising urban energy systems: Simultaneous system sizing, operation and district heating network layout. Energy 2016, 116, 619–636. [Google Scholar] [CrossRef]
  7. Wu, T.; Xu, D.-L.; Yang, J.-B. Decentralised energy and its performance assessment models. Front. Eng. Manag. 2021, 8, 183–198. [Google Scholar] [CrossRef]
  8. Luo, X.; Xia, J.; Liu, Y. Extraction of dynamic operation strategy for standalone solar-based multi-energy systems: A method based on decision tree algorithm. Sustain. Cities Soc. 2021, 70, 102917. [Google Scholar] [CrossRef]
  9. Luo, X.; Liu, Y. A multiple-coalition-based energy trading scheme of hierarchical integrated energy systems. Sustain. Cities Soc. 2021, 64, 102518. [Google Scholar] [CrossRef]
  10. Pajek, L.; Košir, M. Strategy for achieving long-term energy efficiency of European single-family buildings through passive climate adaptation. Appl. Energy 2021, 297, 117116. [Google Scholar] [CrossRef]
  11. de Uribarri, P.M.; Eicker, U.; Robinson, D. Energy performance of decentralized solar thermal feed-in to district heating networks. Energy Procedia 2017, 116, 285–296. [Google Scholar] [CrossRef]
  12. Wang, D.Y.; Xu, W.F. Low carbon city construction and building energy planning. J. HV&AC 2011, 41, 17–19. [Google Scholar]
  13. Jafari-Marandi, R.; Hu, M.; Omitaomu, O.A. A distributed decision framework for building clusters with different heterogeneity settings. Appl. Energy 2016, 165, 393–404. [Google Scholar] [CrossRef]
  14. Xu, L.; Pan, Y.; Lin, M.; Huang, Z. Community load leveling for energy configuration optimization: Methodology and a case study. Sustain. Cities Soc. 2017, 35, 94–106. [Google Scholar] [CrossRef]
  15. Jing, R.; Wang, M.; Zhang, Z.; Wang, X.; Li, N.; Shah, N.; Zhao, Y. Distributed or centralized? Designing district-level urban energy systems by a hierarchical approach considering demand uncertainties. Appl. Energy 2019, 252, 113424. [Google Scholar] [CrossRef]
  16. Luo, X.; Hong, T.; Chen, Y.; Piette, M.A. Electric load shape benchmarking for small- and medium-sized commercial buildings. Appl. Energy 2017, 204, 715–725. [Google Scholar] [CrossRef] [Green Version]
  17. Luo, X.; Liu, Y.; Liu, J.; Liu, X. Optimal design and cost allocation of a distributed energy resource (DER) system with district energy networks: A case study of an isolated island in the South China Sea. Sustain. Cities Soc. 2019, 51, 101726. [Google Scholar] [CrossRef]
  18. Yang, L.; Entchev, E.; Rosato, A.; Sibilio, S. Smart thermal grid with integration of distributed and centralized solar energy systems. Energy 2017, 122, 471–481. [Google Scholar] [CrossRef]
  19. Rehman, H.U.; Hirvonen, J.; Sirén, K. Performance comparison between optimized design of a centralized and semi-decentralized community size solar district heating system. Appl. Energy 2018, 229, 1072–1094. [Google Scholar] [CrossRef]
  20. Lu, Y. Spatial Clustering Detection and Analysis. In International Encyclopedia of Human Geography; Elsevier: Oxford, UK, 2009; Volume 1, pp. 317–324. [Google Scholar]
  21. Miller, H.; Han, J. Geographic Data Mining and Knowledge Discovery, 2nd ed.; CRC: New York, NY, USA, 2009; p. 152. [Google Scholar]
  22. Chawan, P.M.; Bhonde, S.R.; Patil, S. Improvement of K-Means clustering Algorithm. Int. J. Eng. Res. Appl. 2012, 2, 1378–1382. [Google Scholar]
  23. Mahmud, M.S.; Rahman, M.M.; Akhtar, M.N. Improvement of K-means clustering algorithm with better initial centroids based on weighted average. In Proceedings of the 7th International Conference on Electrical and Computer Engineering, Dhaka, Bangladesh, 20–22 December 2012; pp. 647–650. [Google Scholar]
  24. Karypis, G.; Han, E.-H.; Kumar, V. Chameleon: Hierarchical clustering using dynamic modeling. Computer 1999, 32, 68–75. [Google Scholar] [CrossRef] [Green Version]
  25. Shao, X.F.; Cheng, W. Improved CURE algorithm and application of clustering for large-scale data. In Proceedings of the 2011 IEEE International Symposium on IT in Medicine and Education, Guangzhou, China, 9–11 December 2011; pp. 305–308. [Google Scholar]
  26. Yu, M.; Gao, Y.L.; Song, S.Y. The Algorithm of DBSCAN Based on Probability Distribution. In Frontier and Future Development of Information Technology in Medicine and Education; Springer: Berlin/Heidelberg, Germany, 2014; pp. 2785–2792. [Google Scholar]
  27. Lv, Y.; Ma, T.; Tang, M.; Cao, J.; Tian, Y.; Al-Dhelaan, A.; Al-Rodhaan, M. An efficient and scalable density-based clustering algorithm for datasets with complex structures. Neurocomputing 2016, 171, 9–22. [Google Scholar] [CrossRef]
  28. Schikuta, E. Grid-clustering: An efficient hierarchical clustering method for very large data sets. In Proceedings of the 13th international conference on pattern recognition, Vienna, Austria, 25–29 August 1996; Volume 2, pp. 101–105. [Google Scholar] [CrossRef]
  29. Chen, Z.; Liu, X.S.; Zhuang, D.X. A Fast Incremental Clustering Algorithm Based on Grid and Density. Natural Computation. In Proceedings of the Third International Conference on Natural Computation (ICNC 2007), Haikou, China, 24–27 August 2007; Volume 5, pp. 207–211. [Google Scholar]
  30. Chamroukhi, F. Robust EM algorithm for model-based curve clustering. In Proceedings of the 2013 International Joint Conference on Neural Networks (IJCNN), Dallas, TX, USA, 4–9 August 2013; pp. 1–8. [Google Scholar] [CrossRef] [Green Version]
  31. Van Lith, P.; Betlem, B.; Roffel, B. Fuzzy Clustering, Genetic Algorithms and Neuro-Fuzzy Methods Compared for Hybrid Fuzzy-First Principles Modeling. Syst. Anal. Model. Simul. 2002, 42, 597–630. [Google Scholar] [CrossRef] [Green Version]
  32. Unternährer, J.; Moret, S.; Joost, S.; Marechal, F. Spatial clustering for district heating integration in urban energy systems: Application to geothermal energy. Appl. Energy 2017, 190, 749–763. [Google Scholar] [CrossRef] [Green Version]
  33. Fazlollahi, S.; Girardin, L.; Maréchal, F. Clustering Urban Areas for Optimizing the Design and the Operation of District Energy Systems. In Computer Aided Chemical Engineering; Klemeš, J.J., Varbanov, P.S., Liew, P.Y., Eds.; Elsevier: Amsterdam, The Netherlands, 2014; Volume 33, pp. 1291–1296. [Google Scholar] [CrossRef] [Green Version]
  34. Tardioli, G.; Kerrigan, R.; Oates, M.; O’Donnell, J.; Finn, D.P. Identification of representative buildings and building groups in urban datasets using a novel pre-processing, classification, clustering and predictive modelling approach. Build. Environ. 2018, 140, 90–106. [Google Scholar] [CrossRef]
  35. Zahn, C. Graph-Theoretical Methods for Detecting and Describing Gestalt Clusters. IEEE Trans. Comput. 1971, 20, 68–86. [Google Scholar] [CrossRef] [Green Version]
  36. Regnauld, N. Contextual Building Typification in Automated Map Generalization. Algorithmica 2001, 30, 312–333. [Google Scholar] [CrossRef]
  37. Regnauld, N. Spatial structures to support automatic generalization. In Proceedings of the XXII Int. Cartographic Conference, A CoruÒa, Spain, 11–16 July 2005; ISBN 0-958-46093-0. [Google Scholar]
  38. Qi, H.B.; Li, Z.L. An approach to building grouping based on hierarchical constraints. Int. Arch. Photogramm. Remote Sens. Spatial Inf. Sci. 2008, XXXVII. Part B2. [Google Scholar]
  39. Ester, M.; Kriegel, H.-P.; Sander, J.; Xu, X. A density-based algorithm for discovering clusters in large spatial databases with noise. In Proceedings of the Second International Conference on Knowledge Discovery and Data Mining, Port Land, OR, USA, 2–4 August 1996; Simoudis, E., Han, J., Fayyad, U.M., Eds.; AAAI: Menlo Park, CA, USA, 1996; pp. 226–231, KDD-96 Proceedings. AAAI. [Google Scholar]
  40. Duan, L.; Xu, L.; Guo, F.; Lee, J.; Yan, B. A local-density based spatial clustering algorithm with noise. Inf. Syst. 2007, 32, 978–986. [Google Scholar] [CrossRef]
  41. Dharni, C.; Bnasal, M. An improvement of DBSCAN Algorithm to analyze cluster for large datasets. In Proceedings of the 2013 IEEE International Conference in MOOC, Innovation and Technology in Education (MITE), Jaipur, India, 20–22 December 2013; pp. 42–46. [Google Scholar]
  42. Zhou, S.G.; Zhou, A.Y.; Cao, J. A fast density-based clustering algorithm. Comput. Res. Dev. 2000, 37, 1287–1292. (In Chinese) [Google Scholar]
  43. Liu, Q.; Deng, M.; Shi, Y.; Wang, J. A density-based spatial clustering algorithm considering both spatial proximity and attribute similarity. Comput. Geosci. 2012, 46, 296–309. [Google Scholar] [CrossRef]
  44. Wang, W.; Jing, R.; Zhao, Y.; Zhang, C.; Wang, X. A load-complementarity combined flexible clustering approach for large-scale urban energy-water nexus optimization. Appl. Energy 2020, 270, 115163. [Google Scholar] [CrossRef]
  45. Marquant, J.F.; Bollinger, L.A.; Evins, R.; Carmeliet, J. A new combined clustering method to Analyse the potential of district heating networks at large-scale. Energy 2018, 156, 73–83. [Google Scholar] [CrossRef]
  46. Luo, X.; Liu, Y.; Liu, X. Multi-objective optimization and cost-based output pricing of a standalone hybrid energy system integrated with desalination. Eng. Econ. 2020, 66, 51–70. [Google Scholar] [CrossRef]
  47. Luo, X.; Liu, Y.; Liu, J.; Liu, X. Energy scheduling for a three-level integrated energy system based on energy hub models: A hierarchical Stackelberg game approach. Sustain. Cities Soc. 2020, 52, 101814. [Google Scholar] [CrossRef]
  48. Luo, X.; Zhu, Y.; Liu, J.; Liu, Y. Design and analysis of a combined desalination and standalone CCHP (combined cooling heating and power) system integrating solar energy based on a bi-level optimizationmodel. Sustain. Cities Soc. 2018, 43, 166–175. [Google Scholar] [CrossRef]
  49. Zhang, P.F.; Ariaratnam, S.T. Life cycle cost savings analysis on traditional drainage systems from low impact development strategies. Front. Eng. Manag. 2021, 8, 88–97. [Google Scholar] [CrossRef]
  50. Zhu, C.; Liu, Y.; Sun, T.; Zhou, Y. Operation optimization of solar energy and air source heat pump combined heating system. Build. Energy Environ. 2020, 39, 53–57. (In Chinese) [Google Scholar]
  51. Guo, F.; Zhang, J.Y.; Tian, Y.; Yang, X.D. Analysis on size of storage tank in solar space heating system. Acta Energ. Sol. Sin. 2020, 41, 225–232. (In Chinese) [Google Scholar]
  52. Huang, L.X. Objection to the estimated net residual value of fixed assets. Account. Issue 2004, 19, 30–31. (In Chinese) [Google Scholar]
  53. Liu, Y.; Zhou, W.; Luo, X.; Wang, D.; Hu, X.; Hu, L. Design and operation optimization of multi-source complementary heating system based on air source heat pump in Tibetan area of Western Sichuan, China. Energy Build. 2021, 242, 110979. [Google Scholar] [CrossRef]
  54. Huang, J.; Fan, J.; Furbo, S.; Chen, D.; Dai, Y.; Kong, W. Economic analysis and optimization of combined solar district heating technologies and systems. Energy 2019, 186, 115886. [Google Scholar] [CrossRef]
  55. He, Z.N.; Zhu, D.Z. Technical Handbook for Solar Heat Supply& Space Heating; Chemical Industry Press: Qianjiang, China, 2009. (In Chinese) [Google Scholar]
  56. Zhu, Y.H.; Zhuang, D.Z. Application and Study of BP Neural Network and Genetic Algorithm for Optimizational Parameters Based on MATLAB. Appl. Mech. Mater. 2013, 325–326, 1726–1729. [Google Scholar] [CrossRef]
  57. Jin, F. Application of the MATLAB Genetic Algorithm toolbox in function optimization. Fujian Comput. 2009, 7, 23–24. (In Chinese) [Google Scholar]
  58. Luo, X.; Liu, X.; Liu, Y.; Liu, J.; Wang, Y. Benefit-based cost allocation for residentially distributed photovoltaic systems in China: A cooperative game theory approach. Front. Eng. Manag. 2021, 8, 271–283. [Google Scholar] [CrossRef]
  59. JGJ 26-2018; Design Standard for Energy Efficiency of Residential Buildings in Severe Cold and Cold Zones. China Architecture & Building Press: Beijing, China, 2018.
  60. Zhang, Y.; Wu, L.Y. Research on the division of distributing regions of passive solar houses with zero-auxiliary heating source. J. Xi’an Univ. Archit. Technol. 2020, 32, 227–233. (In Chinese) [Google Scholar] [CrossRef]
  61. Liu, X. Energy stations and pipe network collaborative planning of integrated energy system based on load complementary characteristics. Sustain. Energy Grids Netw. 2020, 23, 100374. [Google Scholar] [CrossRef]
  62. Luo, X.; Liu, J.; Liu, Y.; Liu, X. Bi-level optimization of design, operation, and subsidies for standalone solar/diesel multi-generation energy systems. Sustain. Cities Soc. 2019, 48, 101592. [Google Scholar] [CrossRef]
  63. Liu, X.; Liu, X.; Luo, X.; Wang, M.; Fu, H.; Wang, B.; Hu, W. Analysis on the influencing mechanism of informational policy instrument on adopting energy consumption monitoring technology in public buildings. Energy Effic. 2020, 13, 1485–1503. [Google Scholar] [CrossRef]
Figure 1. Methodology overview.
Energies 15 01019 g001
Figure 2. Schematic diagram of the centralized solar heating system in each building group.
Energies 15 01019 g002
Figure 3. System control strategy diagram.
Energies 15 01019 g003
Figure 4. Three typical daily heating loads on 17 January.
Energies 15 01019 g004
Figure 5. Distribution of buildings with different heating loads in the village.
Energies 15 01019 g005
Figure 6. Building groups under different clustering schemes.
Energies 15 01019 g006
Figure 7. Total equipment capacities of the whole village under different clustering schemes.
Energies 15 01019 g007
Figure 8. Variation of LCC under different clustering schemes.
Energies 15 01019 g008
Figure 9. Variation of LCC with different clustering schemes when pipeline price changes.
Energies 15 01019 g009
Figure 10. Variation of LCC with different clustering schemes when building density changes.
Energies 15 01019 g010
Table 1. Parameter settings.
Equipment CapacityMinimumMaximum
Collector area/m2065.88
Tank volume/m3010
Water tank temperature/°C4085 [51]
Table 2. Calculation parameter settings.
Calculation ParametersValue
System service life y / year15
F R ( τ α ) e [50]0.7843
Total heat loss coefficient [50] F R U L / (W/(m2·°C))5.5024
Unit price of collector area [53] C C O / (CNY/m2)800
Unit price of water tank volume [53] C tan k / (CNY/m3)500
Unit power price of gas-fired boiler [54] C g b / (CNY/kW)200
Heat loss coefficient of water tank [50] U tan k / (W/(m3·°C))1.74
Pipe unit price C pipe / (CNY/m)200
Gas price [55] C gas / (CNY/m3)2
calorific value of natural gas [55] C a l gas / (kJ/m3)35,588
Electricity price C E / (CNY/kWh)0.55
Table 3. Setting of design parameters for residential building (type 1).
Time (h)1–88–1212–1414–1818–1919–2020–2222–2323–24
Probability of bedroom personnel being in the room (%)100501000505050100100
Probability of living room personnel being in the room (%)05050100505050500
Bedroom lighting usage (%)0000505050100100
Living room lighting usage (%)000010010010010050
Bedroom equipment usage (%)000070100100100100
Living room equipment usage (%)23232323232310010069
Table 4. Setting of design parameters for residential building (type 2).
Time (h)1–88–1212–1414–1818–1919–2020–2222–2323–24
Probability of bedroom personnel being in the room (%)100000505050100100
Probability of living room personnel being in the room (%)000001001005050
Bedroom lighting usage (%)000005050100100
Living room lighting usage (%)0000010010010050
Bedroom equipment usage (%)0000070100100100
Living room equipment usage (%)23232323232310010069
Table 5. Setting of design parameters for office building (type 3).
Time (h)1–88–1212–1414–1818–1919–2020–2222–2323–24
Probability of office personnel being in the room (%)010010010000000
office lighting usage (%)010010010000000
office equipment usage (%)010010010000000
Table 6. Typical building envelope parameter setting.
EnvelopeExternal WallsRoofInterior WallsExternal
Windows
Heat transfer coefficient K, W/(m2·°C)0.5450.3277.32.88
Table 7. The number of clusters in each clustering scheme.
Clustering SchemesABCDEF
Number of clusters136111418
Publisher’s Note: MDPI stays neutral with regard to jurisdictional claims in published maps and institutional affiliations.