Article

Studies on Methane Gas Hydrate Formation Kinetics Enhanced by Isopentane and Sodium Dodecyl Sulfate Promoters for Seawater Desalination

1
Center of Excellence in Desalination Technology, King Abdulaziz University, P.O. Box 80200, Jeddah 21589, Saudi Arabia
2
Department of Mechanical Engineering, King Abdulaziz University, P.O. Box 80204, Jeddah 21589, Saudi Arabia
3
Department of Chemical and Biomolecular Engineering, National University of Singapore, Engineering Drive 4, Singapore 117585, Singapore
*
Author to whom correspondence should be addressed.
Energies 2022, 15(24), 9652; https://doi.org/10.3390/en15249652
Submission received: 11 November 2022 / Revised: 7 December 2022 / Accepted: 16 December 2022 / Published: 19 December 2022

Abstract

:
Methane hydrate applications in gas storage and desalination have attracted increasing attention in recent years. In the present work, the effect of isopentane (IP), sodium dodecyl sulfate (SDS), and IP/SDS blends as promoters on methane hydrate formation kinetics, in terms of the pressure–temperature (P-T) profile, gas uptake, hydrate induction time (HIT), and water-to-hydrate conversion ratio (WHCR), were studied for distilled water and seawater samples with an IP/water sample ratio of 3:10 (by volume) and an SDS/water sample ratio of 1:1000 (by mass). Each solution was tested in a stirred tank at 600 rpm at a temperature and pressure of 2 °C and 5.2–5.3 MPa. In the case of methane hydrate formation in distilled water, the highest WHCR attained was 9.97% without additives, and 45.71% and 72.28% for SDS and isopentane additives, respectively. However, when using seawater at a salinity of 3.9%, the highest WHCR attained was 2.26% without additives and 9.89% and 18.03% for SDS and IP promoters, respectively, indicating the inhibiting effect of salinity on hydrate formation. However, the HIT was longer for seawater hydrate formation, with an average of 13.1 min compared to 9.90 min for methane hydrate formation. Isopentane enhances the HIT for methane hydrate formation in seawater by 2.23 times compared to SDS. For methane hydrate formation in seawater, the presence of IP shortened the HIT by 15.6 min compared to the seawater sample without promoters. Additionally, a synergistic effect was observed when IP and SDS were combined and used in methane hydrate formation in distilled water and seawater systems. The positive effect of IP on methane hydrate formation is possibly due to the binary hydrate formation mechanism, which improves the hydrate formation thermodynamic and kinetic parameters.

1. Introduction

Gas hydrates, also known as clathrates, are solids with a crystalline ice-like structure made of gas molecules, such as methane, propane, and carbon dioxide as guests and water molecules as hosts. The gas molecules are confined inside cavities created by the hydrogen-bonded water molecules that form a lattice structure in a gas hydrate. A non-stoichiometric crystallization process that results in gas hydrates is controlled by a number of rules, including those relating to thermodynamics, kinetics, mass transport, and heat transfer. Gas hydrates naturally occur in permafrost found in polar locations as well as marine deposits along continental slopes [1,2]. Numerous engineering applications for gas hydrates have been suggested, including gas separation, carbon dioxide sequestration, gas storage and transportation, refrigeration, and desalination. Water molecules are separated from brine solution during the production of gas hydrates, leaving salts behind. Given that one mole of hydrate contains roughly 85% water and 15% guest gas, once the hydrate crystals are melted, the guest gas is liberated and can be used again in the hydrate desalination process [3]. From sustainability point of view, GHD has strong inherent features which may make it a competitive desalination technology. The GHD system components are less susceptible for wear, corrosion and fouling due to the low temperature of operation. Hence, the replacement frequency of components will be minimized. If biodegradable hydrate promoters are used in the GHD process, threats of brines to environment and ecosystems will be avoided [4,5,6]. Gas hydrate desalination (GHD) is a promising new desalination method when it is combined with the regasification of natural liquid gas (NLG) in power plants (where the generated cold energy can be used for the GHD process) [7]. Over the past two decades, a number of gases and liquids have been proposed for GHD [1]. The pressure and temperature of the gas–water system determine when and how quickly gas hydrates develop, and these two thermodynamic parameters are dependent on the kind of gas and the salinity of the water. Although greater pressure levels result in a faster rate of hydrate formation, it is always preferable to carry out the desalination process under moderate pressure to reduce the extra cost of energy and system stiffness [8,9]. In early studies on GHD, water-immiscible hydrate formers such as cyclopentane and cyclohexane were employed for this purpose [2]. Methane and carbon dioxide have been the main subjects of contemporary GHD research due to their importance from economic and environmental standpoints. Additionally, they can form more stable gas hydrates with a structure sI [2].
The GHD process is impeded by the presence of salt ions in the water, which hinders the creation of gas hydrates. Due to its salinity, the phase equilibrium curve for hydrate formation shifts in favor of higher pressure and lower temperature. Two strategies have been put forth to address this problem: using binary hydrate formers and thermodynamic promoters [10,11,12]. Thermodynamic promoters are additives that are used to facilitate hydrate formation under simpler operating conditions (primarily at higher temperatures and lower pressures) in order to reduce operating expenses. In hydrate structure cages, the guest gas fills the smaller cages while the thermodynamic promoter fills the larger cages [1]. Tetrahydrofuran (THF) has a significant impact on the thermodynamics of methane hydrate formation since hydrates can develop at temperatures and pressures that are almost atmospheric [2]. For hydrate formation in salt water, binary hydrate former systems with a primary hydrate guest former, such as methane, and a secondary hydrate guest, such as propane or a water-immiscible hydrocarbon liquid such as cyclopentane, have been used. These systems are considered suitable hydrate formers for GHD since they exhibit a low hydrate formation temperature, quick formation kinetics, and increased salt removal efficiency compared to a single-guest gas system [10]. At pressures up to 46 bar, methane and propane gas mixes were shown to have significantly greater hydrate formation rates [13], although propane might significantly boost hydrate formation [14]. When the methane–propane mixture is employed at a pressure of 50 bar, a greater hydrate formation rate may be attained [15]. Additionally, cyclopentane was employed as both a guest and a co-guest hydrate former, and it formed a hydrate with water when exposed to atmospheric pressure [2].
The GHD is a complex process that should consist of at least four steps, namely, hydrate formation, hydrate separation from hydrate slurry, hydrate washing, and hydrate disassociation. However, the hydrate formation step has drawn most of the research efforts not only since this step is the backbone of the GHD system but also since most of the challenges and barriers of GHD are linked to the control and optimization of thermodynamic and kinetic conditions of hydrate formation [1,2,3]. For practical GHD applications, the hydrate formation process should occur at a rapid hydrate formation rate under low-pressure conditions and should result in a high water-to-hydrate conversion ratio (WHCR). This goal can be achieved through proper selection of thermodynamic and kinetic promoters and additives. Thermodynamic promoters are additives utilized to induce hydrate formation at easier operation conditions, mainly at low pressure and higher temperature. Large molecule hydrocarbons such as cyclopentane and isopentane may form gas hydrates of type sH under ambient conditions. The sH hydrate structure offers small and large cages for small molecule gas such as methane and a large molecule hydrocarbon, such as i-pentane. The role of hydrocarbons in hydrate formation conditions is explained by the heterogeneous nucleation theory. In a binary hydrate system, the hydrocarbon hydrates are formed first at mild thermodynamic conditions. These hydrates act as colloids for initiating heterogeneous nucleation of the small molecule gas hydrates (sI and sII hydrate structures) [16]. In nature, the development of gas hydrates proceeds slowly under particular thermodynamic circumstances. In order to expedite the process for real-world industrial applications such as GHD, kinetic promoters must be applied. In order to increase the mass transfer of the guest gas into the host water, kinetic promoters either increase the guest gas’ solubility in water or increase the area of the gas–water contact. Due to the lower surface tension, the production of micelles, and the formation of hydrates with porous morphology that act as nucleating sites for quicker hydrate growth, surfactants are the most common kinetic promoters employed to increase the solubility of the gas in water [11].
For enhancing the kinetics of hydrate formation, sodium dodecyl sulfate (SDS) has been discovered to be the most efficient surfactant. The impact of SDS on hydrate formation for various guest hydrate formers, pure and saline water host systems, and various applications has been investigated by several researchers [17]. Additionally, a thorough study was undertaken on the impacts of the SDS concentration in the host water. Comprehensive research was also undertaken on the effects of SDS content in the host water solution. It has been discovered that the SDS in water solution has a critical micellar concentration (CMC) of 242 ppm, at which it can significantly affect hydrate formation. Induction time, gas consumption, and the rate of gas hydrate formation have all been examined in relation to SDS concentrations ranging from 242 ppm to 2200 ppm [18,19].
The mechanical stirring of the water increases the area of the gas–water interface, facilitating mass transfer from one side and aiding in the dissipation of heat produced by hydrate formation both inside and outside the reactor. It has been found that a stirring speed of 600 rpm is the highest stirring speed beyond which no further improvement in hydrate formation has been detected. The influence of stirring speed on the hydrate formation process has been recorded for stirring speeds between 100 and 1000 rpm [20].
The goal of the current study was to investigate the variables that can enhance the hydrate formation kinetics during the seawater desalination process. Isopentane (IP), sodium dodecyl sulfate (SDS), and a combination of IP and DS were utilized as promoters for this purpose, and their effects on the performance of methane gas hydrates were examined. To compare the results, deionized water (DIW) and seawater were used as feed solutions. In order to enhance the hydrate formation kinetic parameters, the additives isopentane and SDS were mixed with the solutions.

2. Materials and Methods

2.1. Materials

Methane (CH₄) with a purity of 99.995% was supplied by Abdullah Hashim Industrial Gases and Equipment (AHG), Jeddah, Saudi Arabia, in a pressurized cylinder at a pressure of 10 MPa. Pure water (<1 mg/L) was produced in the laboratory using a reverse osmosis (RO) lab system (Purelab Option SR-7, Elga LabWater VWS (UK) Ltd., High Wycombe, UK). Pretreated seawater (38,000 mg/L) was obtained from the seawater reverse osmosis (SWRO) desalination plant, owned by the Water and Environmental Services Company (WESCO), located on the Red Sea coast in Jeddah. Sigma-Aldrich Company Limited, St. Louis, MO, USA, supplied sodium dodecyl sulfate (SDS) of 92.5–100% purity. Isopentane (IP) of molecular weight (72.15 gm/mol) with 99.98% purity was procured from Thermo Fisher Scientific, Waltham, MA, USA.

2.2. Experimental Setup

Figure 1 displays a schematic representation of the experimental setup. A submerged pressurized reactor, a magnetic stirrer including a hot plate, a gas cylinder, a chiller, and a data acquisition (DAQ) module (NI cDAQ-9174, National Instruments, Austin, TX, USA) make up the system. The stainless-steel pressure cell used in the pressure reactor unit has an interior diameter of 98 mm and a height of 250 mm, giving it an internal volume of 2.05 L. This pressure cell was created in a nearby workshop (Finetools Arabia, Jeddah, Saudi Arabia). Six bolts and nuts are used to secure the reactor lid, which can then be opened to load water samples. Two top-view windows made of acrylic glass enable visual monitoring of the experiments. In addition, two of the four threaded holes drilled in the cover are used for the gas inlet line and gas outlet line, respectively, while the other two are used for thermocouples of the two-rod type to be inserted to measure the temperature of the solution and the gas, respectively.
A high-pressure analog pressure gauge (with a 0–100 bar range) (Parker Hannifin Corp, Cleveland, OH, USA) was installed directly onto the reactor’s gas output line in order to measure pressure using a Rosemount smart pressure transmitter (model 3051, Shakopee, MN, USA). To discharge the gas, a flexible hose was attached to a high-pressure needle valve (Parker Hannifin Corp, Cleveland, OH, USA) located on the gas outlet line.
The gas cylinder and a gas pipeline linking it to the reactor’s gas inlet with pressure valves make up the gas feed unit used in all tests. A thermal basin measuring 0.04 m3 and filled with glycol solution makes up the chiller unit (coolant). To keep the reactor at the required temperature, it is submerged in the thermal basin. To do this, coolant is circulated through a spiral heat exchanger submerged in a cooling circulator basin (Huber KISS K25, Offenburg, Germany). A magnetic stirrer (Fisher Scientific, 2mag MIXcontrol 20, Muenchen, Germany) is put above a holder on which the thermal basin is mounted. A rod-type copper–constantan thermocouple (Omega Engineering Inc., Norwalk, CT, USA) attached to the DAQ system and submerged in the thermal bath during the tests detects the temperature of the thermal basin.

2.3. Methodology

2.3.1. Preparation of Solutions

To prepare each of the solutions used in the tests, the feed water sample was mixed with the desired amount of additive (isopentane, SDS, or their mixture). The test feed sample with isopentane was made by mixing 100 mL of DIW/seawater at 20 °C with 32.3 mL of isopentane at 20 °C. The resulting combination was then immediately poured into the reactor, which had been precooled to 1 °C, and the reactor lid was immediately closed.
A 1000 ppm SDS concentration was achieved by combining 0.10 g of SDS with 100 mL of seawater or DIW to prepare the SDS solution. Using a magnetic stirrer, the resultant SDS solution was blended for an hour before being stored at room temperature. The SDS and isopentane mixture was made by adding 32.3 mL of IP to the previously made SDS solution at 20 °C. Having previously added the finished mixture to the reactor, it was cooled to 20 °C (precooled to 1 °C as before), and the reactor lid was immediately closed. Table 1 lists the elements of all feed solutions and Table 2 summarizes the experimental codes and parameters used in this study.

2.3.2. Experimental Procedure

The reactor was cleaned, rinsed with DIW, and set in the thermal basin at 1 °C before the tests began. In total, 100 cc of the necessary feed solution was poured into the reactor, and the lid was then tightened as described in Section 2.3.1. After allowing adequate time for the reactor and the feed solution temperature to stabilize at 1 °C, the reactor was flushed with the CH₄ gas for 15 s to remove any air that might have remained. The reactor’s outlet needle valve was then shut, and the pressure within was increased to 5–5.5 MPa. The DAQ system was started when the gas cylinder valve was shut, enabling the temperature and pressure values to be recorded at 2-s intervals. The thermal basin of the reactor was maintained at 1 °C during the experimental period, which is below the hydrate stability temperature, sustaining the subcooling condition. All hydrate formation test trials were conducted with a magnetic bar spinning at 600 rpm in a stirred reactor. In the first 15 min, as the gas initially cooled, a decrease in pressure was seen inside the reactor. However, as some of the gas was trapped in the developed hydrate structures, causing its depletion, the pressure also decreased during hydrate development. Throughout the experiment, hydrate formation was verified by observing the magnetic bar’s movement and physically analyzing the reactor’s interior components through its glass windows. The magnetic bar eventually stopped moving as the hydrate formed due to the increasing resistance within the solution. Once the temperature and pressure inside the reactor stabilized and there was no further pressure decrease, the experiment was over. In order to validate the existence of at least one temperature spike and a subsequent pressure drop, the temperature and pressure patterns against time were drawn.

2.3.3. Calculation of Kinetic Parameters of Hydrate Formation

The total number of moles of gas consumed for hydrate formation up to a specific elapsed period is the primary kinetic parameter characterizing hydrate formation. This metric can be used to determine the water-to-hydrate conversion ratio (WHCR) and the rate of hydrate formation at any given moment. The general equation of the gas state and the law of conservation of mass can be used to calculate the total moles of the gas used. According to Babu et al. [21], it may be assumed that the total amount of gas consumed up to a particular time ( Δ n h ( t ) ) will be equal to the difference between the amount of gas present in the reactor at the beginning of the experiment and the amount of gas present in the reactor at a specified time.
Δ n h ( t ) =   V R   (   P zRT   ) 0   V R   (   P zRT   ) t  
where VR is the volume of the reactor, P and T are the pressure and temperature of the reactor at the given time, t. R is the universal gas constant, and z is the compressibility factor calculated by Pitzer’s correlations [22].
The mass of water converted to hydrate, Δ m w h ( t ) ,   is calculated based on the cumulative moles of gas consumed for hydrate formation, the hydration number, Nh, and the mass molecular weight of water, Mw, using the following equation [21]:
Δ m w h ( t ) = Δ n h ( t ) ·   N h ·   M w
The hydration number is the number of water molecules required to form the hydrate structure, and it depends on the molecule size of the gas and the type of hydrate structure. Each gas has its own characteristic hydration number. The hydration number adopted for methane is 6.1 [23].
The WHCR is the ratio of the mass of water converted to hydrate, ( Δ n h ( t ) ), to the mass of water sample initially loaded in the reactor, Δ m w l ( 0 ) , and was calculated as follows:
WHCR = Δ m w h ( t ) Δ m w l ( 0 ) ·   100   %

3. Results

The purpose of the study was to ascertain how the input temperature and pressure (P-T) were affected by the promoters employed (IP, SDS, or IP + SDS), the gas type (methane), and the water type (deionized water or seawater). Gas consumption, water intake, water recovery, and the volume of water transformed to gas hydrate were computed based on P-T measurements, and the constant parameters values (volume, gas constant, and mass). The experimental results of each P-T profile were used to calculate the induction time, gas uptake (mole), and total gas consumption (mmol/mol).
Isopentane, C5H12 (IP) is a large molecule hydrocarbon which may form gas hydrates of type H. The specific gravity of IP is only 0.6 at 20 °C, and IP is insoluble in water. Consequently, IP will form a layer on the water surface and hinder methane-water interface. The volume of IP was decided based on two criteria, namely, the thickness of the IP layer formed above the water surface in the rector, and the recommended ratio of similar immiscible hydrocarbons, such as cyclopentane, to water as reported in literature. Based on the reactor geometry, the thickness of the IP layer is 4.1 mm. At a stirring rate of 600 rpm, the magnetic bar can create a vortex flow enough for ensuring mixing of IP with water and direct gas-water interface as verified by visual observation of stirring in an open beaker. Zhong et al. [24] selected a volume ratio of cyclopentane to water at 1: 10 to study the effects of CP on methane hydrate formation. However, Zheng et al. [25] adopted a higher volume ratio of cyclopentane to water of around 3.2: 10 when studying the effect of CP for CO2 hydrate formation. Studies on binary cyclopentane-methane hydrate formation showed that the higher the ratio of cyclopentane (CP) to water the faster the hydrate formation rate [26]. Accordingly, in this study a volume ratio of cyclopentane to water was selected at 32.3:100.

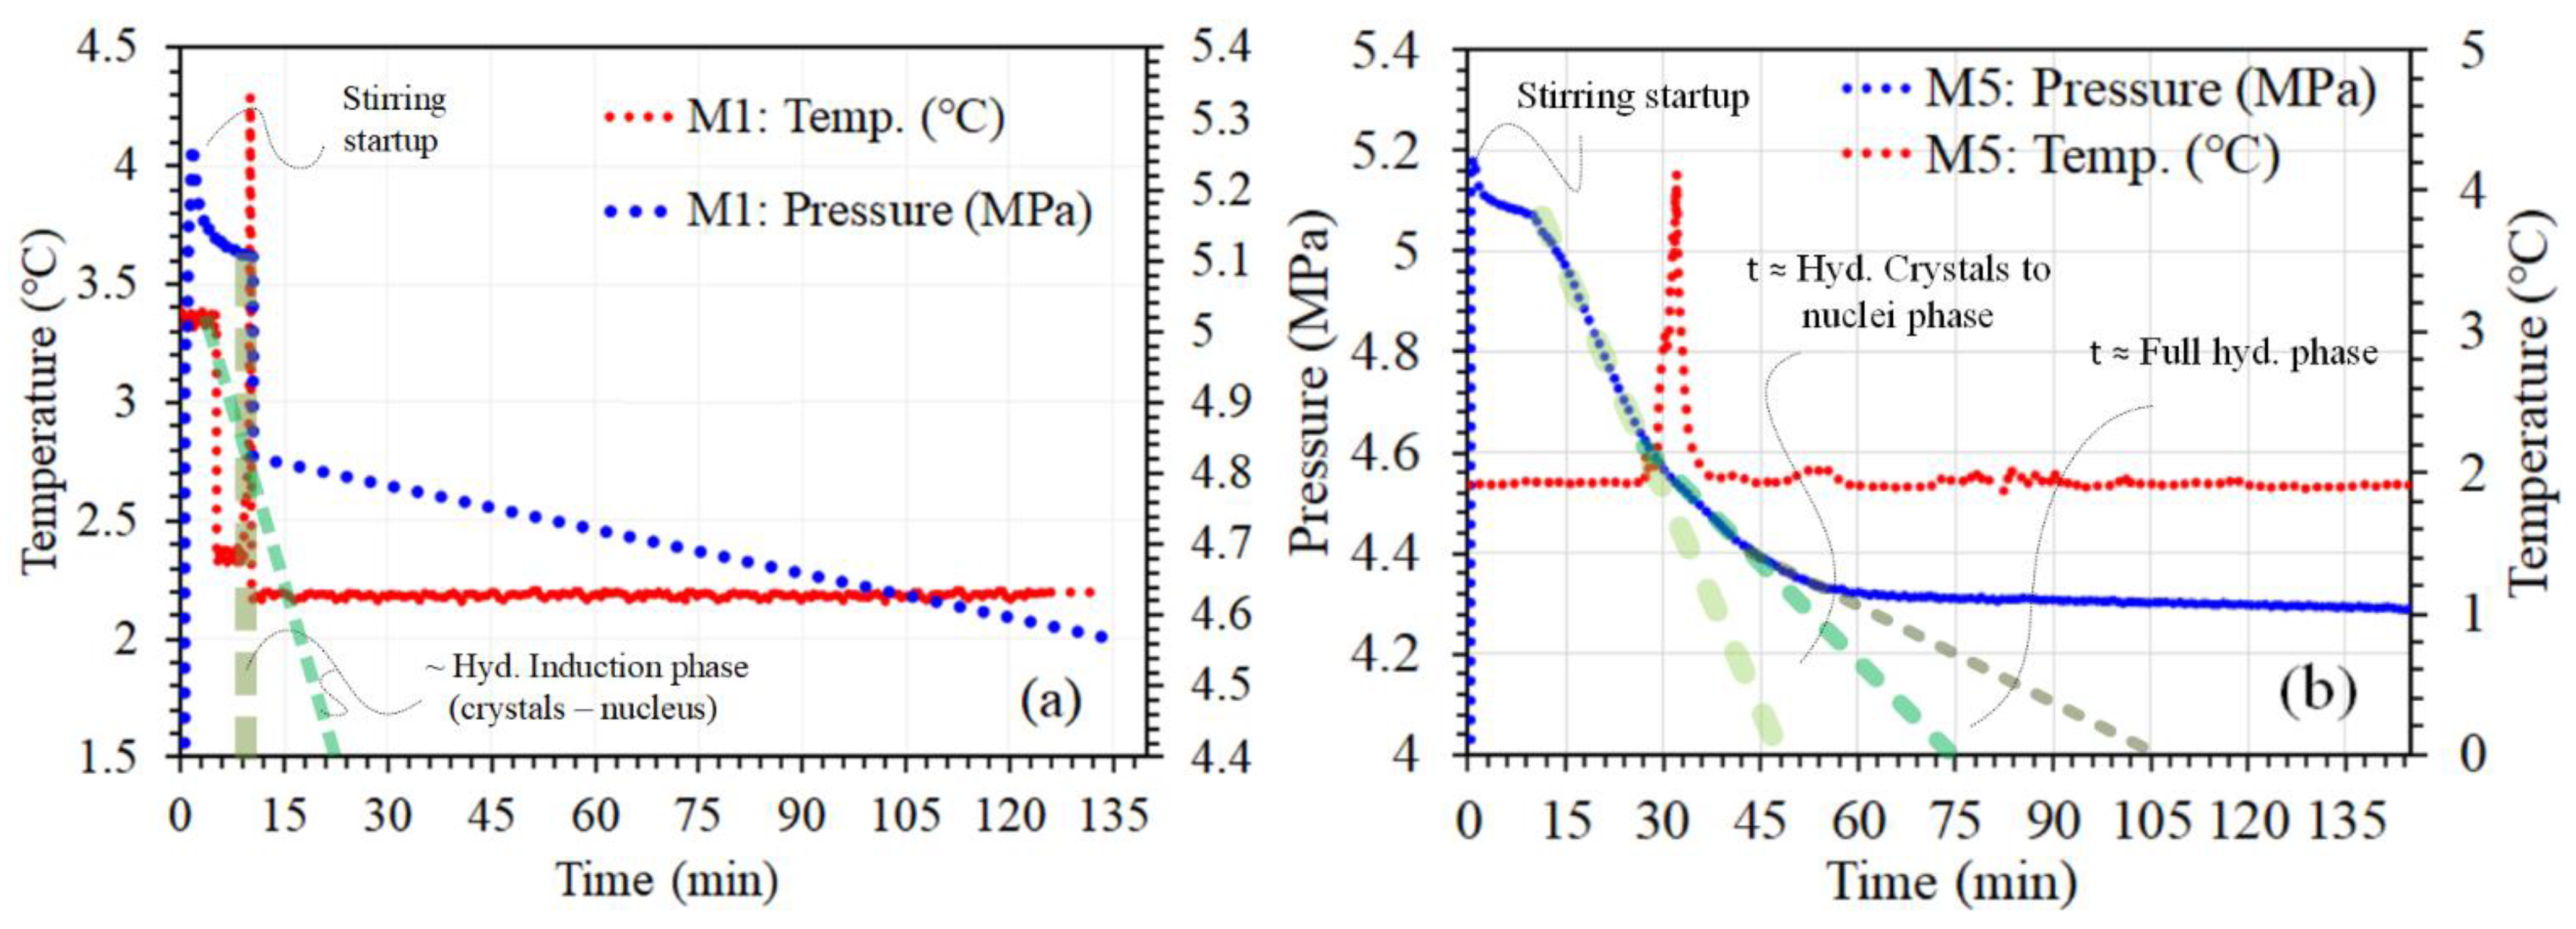
3.1. Comparison of P-T Profile Kinetics of CH₄ Gas Hydrate and Their Importance for Desalination

Each of the M1–M8 experimental trials has shown that the formation of gas hydrate is completely reliant on the time-dependent kinetics of CH₄ absorption, which relates to a particular point on the pressure–temperature (P–T) profile curves and was consistent with the typical P–T curve behavior as described in detail by Lekvam and Bishnoi [27] and Iqbal et al. [28]. Figure 2, Figure 3 and Figure 4 depict the development of time-dependent CH₄ gas absorption in the reactor at a number of designated points on the P–T profile for two different liquid feed solutions with and without the promoters. Each time, the reactor was loaded with fresh liquid feed and afterward filled with CH₄ feed gas at initial pressure > 5.2 MPa to compensate for the differences between the gas feed temperature (which was 27 °C ± 2 °C) and the reactor temperature (2 °C ± 0.5 °C) at the time of pressurizing the reactor. This was carried out in order to minimize the errors of CH₄ absorption in the feed solution in each experimental trial. However, after pressurizing the reactor to the initial pressure, the gas’s temperature gradually decreased upto the reactor’s temperature-equilibrium conditions between the reactor walls, liquid and the gas.
In contrast to Figure 2b, Figure 2a demonstrates that after stirring, the temperature of the system’s components reached 2 ± 0.1 °C and the pressure drop was ~0.05 MPa. All of the experimental trials showed that the hydrate system quickly reached H-Lw equilibrium conditions due to appropriate agitation in the hydrate reactor, and the CH₄ gas started to diffuse in the liquid components, probably forming macroscopic or microscopic crystals that are not visible but presumably appear as a foggy type of emulsion [28]. These macroscopic crystals’ induction occurred at t ≈ 9.9 min. Furthermore, the P–T profile curve demonstrates that the solubility of CH₄ under H-Lw equilibrium increases with rising subcooling temperature at constant feed pressure, but slightly reduces with the rising pressure during hydration formation. Ou et al. [29] also reported that temperature increases have a greater impact on the pressure’s effect on CH₄ solubility in water at H-Lw equilibrium.
However, due to the pressure being applied, the constant temperature, and the stirring force, it is possible to hypothesize that the methane hydrogen molecules assist in the creation of a structure similar to fog. This structure is most likely what is triggering the growth of hydrate nucleation. Even though there is no tool for measuring the size of a cloudy emulsion, the CH₄ molecules in DIW have an impact on the structure. However, we recently reported on the presence of a hazy emulsion between DIW and CH₄ molecules at the beginning of hydrate production [28]. Nevertheless, sufficient constant stirring also increases the subcooling temperature, which leads to CH₄ solubility with DIW and, consequently, induces the formation of methane hydrate at the gas–liquid interface. The hydrate nucleation phase was most likely finished at time t ≈ 25.5 min, at pressure 4.82 ± 0.02 MPa and temperature 3.25 ± 0.1 °C. However, near t ≈ 39 ± 1 min, the complete hydrate was created.
However, Figure 2b shows substantially different kinetic activity of temperature vs. pressure when compared to Figure 2a. Th P-T profile shows that delayed solubility starts in the seawater at the beginning of the experiment, even though the hydrate system reaches H-Lw equilibrium conditions. Thus far, the P-T profile has demonstrated greater gas absorption, but hydrate formation may be delayed, and it appears that salts cause hydrate formation. The P–T (hydrate response) curve shows that the solubility of methane increases with temperature and pressure and decreases with salinity, but the influence of pressure is less significant than that of temperature. Lekvam and Ruoff [30], Zetsepina and Buffet [31], Zetsepina and Buffet [32], Servio and Peter Englezos [33], and others have found that the presence or absence of the hydrate phase in seawater has a significant effect on how soluble the methane gas is. Additionally, it was noted in their experimental work that when the hydrate was present, the solubility of the gas reduced dramatically with decreasing temperature. The hydrate can crystallize out of the aqueous solution immediately without the help of any free gas due to the quick decline in solubility [30,31].
Figure 3 (M2 to M7) compares the temperature and pressure kinetic data for the compositions CH4/DIW/IP (a), CH4/SW/IP (b), CH4/DIW/SDS (c), and CH4/SW/SDS (d). Figure 3a demonstrates how isopentane affects the P-T profiles. As expected, the temperature scattering level increases and the pressure decreases rapidly with agitation as the methane dissolves in the solution. After that, however, the temperature increases gradually over time. The rate of temperature change can be presented by the slope of tangent line to the temperature curve at any point. At the early stage of hydrate growth phase, the slope of the curve tangents is steep. However, the slope of curve tangents decreases when approaching the peak. Hydrate formation is a time-dependent microscopic and stochastic crystallization process. Therefore, induction time and hydrate nucleation rate follow a probability distribution at the given P–T conditions [34]. However, since hydrate formation is an exothermic reaction, associated with heat release, the P-T profiles over time describe nicely the stages of hydrate formation and can be used to calculate the relevant important hydrate formation parameters such as hydrate nucleation rate and water to hydrate conversion ratio. For instance, a rapid temperature rise should indicate the occurrence of a rapid hydrate crystal development and nucleation. However, it is shown in Figure 3a that a sizable portion of the hazy hydrate crystals start to form as a result of a simultaneous decrease in pressure and rise in temperature after t ≈ 9.9 min. At the onset of induction time at t ≈ 20 min, a sharp reduction in pressure, concomitant with a steep increase in temperature can be observed. The reduction in pressure indicates the phase change of methane from the gas phase into solid clathrates and subsequent quick growth of methane hydrate nuclei. A temperature increase denotes a loss of heat, since hydrate production is exothermic [28].
The effect of IP on the production of CH₄/seawater hydrates is also depicted in Figure 3b. In contrast to Figure 3a, Figure 3b shows delayed CH₄ gas mixing, which is visible in the P-T profile curves for the seawater/IP solution. However, after t ≈ 49 min, a simultaneous decrease in pressure and temperature was observed, which most likely indicates the formation of hydrate crystals and subsequent nucleation. Figure 3a shows numerous temperature spikes at t ≈ 80 min, which would mean that less gas was consumed during the full growth of the hydrate formation. The increase in solution salinity during complete hydrate formation stage is the reason for occurrence of multiple temperature spikes in the temperature profile. During the hydrate growth stage, the two-phase water-gas system evolved into a three-phase system (gas, water, and hydrate phases) but has not reached an equilibrium state yet. The salinity of the brine is increasing due to the salt exclusion from hydrates. At the same time hydrate dissociation occurred synchronously with temperature increase [35]. This instable state explains the occurrence of multiple temperature spikes with low peaks before reaching equilibrium state.
Figure 3c,d depict the P–T profiles for M3 and M7 hydrate formation trails using SDS as a promoter with DIW and seawater, respectively. In comparison to Figure 3a,b,d, the DIW- SDS aqueous solution displays high rates of temperature increase in the first t ≈ 15 min resulting from the heat release, which is due to hydrate crystal formation in the DWI-SDS foggier-type emulsion, and at t ≈ 25 min, a clear increase in nucleation growth is evident by the steep decrease in pressure. The rates of hydrate crystal production and nucleation growth are, however, slightly slower in the seawater/SDS aqueous solution. The mechanism and kinetics of gas hydrate formation in water solutions of NaCl, SDS and a mixed additive of NaCl and SDS has been studied for different hydrate formers. While it was accepted that NaCl acts as a thermodynamic inhibitor, and SDS acts as a promoters of gas hydrate formation, an agreement on the combined effect of mixed NaCl + SDS solutions has not been reached yet. A study on methane hydrate formation without stirring using solutions of mixed NaCl (3 wt%) and SDS (0.1 wt%) found that the SDS micellization was diminished in NaCl solution, hence the promoting effect of SDS on hydrate formation is reduced [36]. While another study on propane/NaCl/SDS solution system showed a decreased induction time of hydrate formation in comparison with that for the SDS solution alone and hence, it was assumed that NaCl can increase the solubility of mine gas due to the presence of SDS micelles [37]. However, Ren et. al. found that methane hydrate formation was inhibited by the addition of 0.03 wt% SDS when the NaCl was higher than 0.58 wt% [38]. It is hypothesized that the engagement of salt ions weakens the affinity of the surfactant, and that the H–H lattice energy is likely less favorable for the formation of hydrate crystals and growth of nucleation, compared to that of CH₄/DIW/SDS hydrate [30,31,32,33].
Additionally, Figure 3a,c show that the effective time of the hydrate growth stage is prolonged upto t ≈ 35–45 min for DIW/SDS solution and t ≈ 55 min for SW/SDS solution. Both hydrate growth periods are higher than the corresponding periods observed in the case of SDS-free DIW and SW samples which were found at t ≈ 55–60 min (Figure 2a), and t ≈ 65–70 min (Figure 2b), respectively. The longer hydrate growth periods in SDS-containing solutions can be explained by the mechanisms of SDS effect on hydrate growth promotion. SDS reduces the interfacial tension between hydrate and liquid leading to formation of hydrophobic micro-domains near the hydrate surface that increase methane concentration. The adhesion forces among hydrate molecules are also reduced due to low surface energy caused by SDS allowing for increasing the total surface area of hydrate particles and the gas-liquid interfacial area [39,40].
Figure 4a,b show comparisons of using CH₄ gas hydrate for seawater purification with SDS/IP blend promoters. In order to further explain the P–T profile, studies were performed on the kinetics of the formation of methane hydrate from both microscopic and macroscopic perspectives. These findings suggest that during the early stages of methane processing, dissolved methane tends to inhabit the large cages over the small cages, specifically in cases of promoters blended with seawater [30,31,32,33]. The beginning of hydrate development is the next phase. After the induction time, hydrate crystals begin to develop in the form of a microscopic hazy emulsion, and as a result of the application of a proper stirring force, once they reach a critical size, the hazy emulsion transforms into the nuclei phase. Then, the area around these primary nuclei experiences quick hydrate development due to the combination of the IP/SDS promoters used in this study. As a result, at the start of hydrate growth, the slope of methane conversion to hydrate increases sharply (nucleation point; Figure 4a,b) [30]. When applying a stronger driving power than was used in this study, this slope is predicted to rise [30,33]. In previous studies, there was a noticeable rise in complete hydrate growth at the nucleation location, which led scientists to believe that large cages were predominately occupied [41,42,43,44,45]. However, in our study, in this area, the hydrate crystal-to-nuclei development phase is still shorter than that shown in Figure 4a.

3.2. CH₄ Gas Uptake (Moles) and Consumption (mol/mol) in Two Different Kinds of Water with and without Promoters

The liquid and gas were then subcooled to their equilibrium points, which are around 2–3 °C, and the kinetics of CH₄ gas consumption using two different promoters with two different types of water are demonstrated in Figure 5a,b. Technically, due to the application of an appropriate amount of agitation (600 rpm), the CH₄ gas diffuses into the liquid phase due to the considerable shear stress force in the liquid components. Therefore, the degree of gas diffusion into liquid components is quite significant. Figure 5a shows that the generated hydrate took up more gas when two distinct promoters and their blends were present. In Figure 5a, the hydrate composition of DIW/SDS (M3) shows a bigger impact than the liquid feed system M1–M4 (Figure 5a). As we have demonstrated, the CH₄ hydrate contained both DIW and SDS, indicating the efficient mass transfer of methane, which was probably related to SDS’s affinity for having lower surface tension in DIW. Additionally, in just t ≈ 20 min, the gas uptake increased to ≈ 0.49 moles thanks to the early and significant stirring force. Moreover, according to one theory, due to the constructive agitation in the hydrate system, the reduced efficiency of the SDS foam in the DIW system caused the increased gas uptake in the M3 liquid system, which is why gas absorption exhibited a rather considerable degree of gas uptake.
Nevertheless, the degrees of gas uptake in the M1, M2, and M3 systems were >6.25 times lower than in the M3 liquid feed system. Figure 5a, however, shows that the M2 hydrate system absorbed more gas than the M1 and M4 hydrate systems, but less than the M3 hydrate systems. It is likely that during initial agitation, the IP formed a thin hydrophobic barrier around the water molecules, which prevented the diffusion of CH₄ molecules into the liquid phase. The IP in seawater (Figure 5b), however, exhibited the opposite behavior from that of DIW. It is possible that the IP formed a temperate isomerization with the salt ions within the time period, which might have reduced the surface tension of water. As a result of this, the methane uptake data shows a notable linear mass transfer of methane gas to the liquid phase. Gas hydrate formation process consists of three distinct stages: dissolution stage, nucleation stage, and hydrate growth stage. Gas is consumed during the dissolution stage and nucleation stage due to gas solubility, and hydrate nuclei formation at slow rate. However, during the hydrate growth stage gas consumption is high and continues to grow linearly at constant rate until it finally stops when equilibrium state is reached, or the growth is limited by heat and mass transfer conditions. The linear trend of gas consumption for M6 (Figure 5b) represents the growth hydrate stage. Similar findings were also derived in a study by Chanakro et al. (2020) [46]. However, the gas intake of the seawater/IP system was initially much lower than that of the M1, M3, M5, M7, and M8 systems. Nevertheless, according to numerous studies, certain surfactants can exhibit significant degrees of gas uptake, which leads to shorter induction times of hydrate crystals and nucleation formation, and speeds up hydrate growth [16,47,48,49,50,51]. SDS has been reported to be one of the most efficient surfactant promoters for enhancing methane storage density, as well as quickening the growth rate of methane hydrates [19].
However, despite having a similar number of promoters, the seawater (SW) liquid composition system had a minimum methane gas uptake rate of five times lower, and a maximum gas uptake rate of >four times lower, than the liquid composition system shown in Figure 5a. Similar trends of methane gas consumption (mol/mol) can also be observed in Figure 6. Furthermore, when methane is dissolved in seawater, as expected, the temperature scattering level increases as the pressure decreases (see Figure 2, Figure 3 and Figure 4). However, the pressure reduction process then becomes linear over a certain period. The pressure profile (Figure 2, Figure 3 and Figure 4) reflects the gas consumption during hydrate formation. The steep decrease in pressure reflects the hydrate growth stage which has a linear trend. When comparing the samples in Figure 5a and Figure 6 of the DIW liquid composition hydrate systems, we can see that the concentration of dissolved methane directly correlates with the number of salt ions, or the quantity of brine, present in the water. As a result, an increase in salt ions, or brine level, typically causes a decrease in the overall methane gas uptake and total gas consumption as mentioned above. This suggests that rather than CH4 gas being absorbed as a result of the salinity change, from water with a lower density to water with a higher density, in seawater, the water produces (some) hydrates instead.
Nevertheless, the IP, SDS, and IP + SDS liquid systems form an sH hydrate structure, wherein methane molecules fill the remaining small and medium cages and IP can only occupy the large cages [12]. As a result, the greater availability of hydrate cages in the sH hydrate structure for methane capture is associated with the higher methane gas uptake in the water sample with isopentane.
Additionally, the density of the Red Sea seawater is higher than that of pure water by around 4%, and its salinity exceeds 38,000 ppm. As a result, at high pressures (>5 MPa) and low temperatures (>2 °C), the partial pressure of the CH₄ gas decreases due to the rapid drop in temperature, and the results in Figure 5b and Figure 6 support this interpretation. However, in contrast to pure water, the salts in brine water facilitate the production of hydrates, or alternatively, hydrates could form but with relatively less gas uptake and mol/mol consumption, as can be seen in Figure 5b and Figure 6. Additionally, unlike seawater, wherein the polarity differences between gas and water are often extremely obvious, natural gas is frequently not prevented from dissolving in pure water. However, due to the ideal H-H lattice force between pure water and CH₄ molecules, CH₄ gas was able to transit or migrate in the water and form a somewhat stable hydrate structure. This may be due to the stirring and subcooling forces applied.

3.3. Effects of Promoters and Their Blends on CH4 Hydrate Induction Time for Desalination

The primary issues with hydrate-based desalination have been established as the shorter induction time and lower hydrate stability at the lowest driving force. In order to solve these problems, our hydrate-based desalination study was focused on choosing a safe promoter and a sustainable driving force in terms of pressure, temperature, and stirring mode. This section examines the significance of the promoters and the induction time kinetics of methane gas clathrate hydrate stability for desalination applications at low pressure and temperature, and with moderate stirring driving forces.
Table 2 shows a comparison summary of hydrate formation induction time using DIW and seawater with and without promoters. For the feed samples of DIW water and seawater, the three average values of the methane gas hydrate induction time are shown in Table 2. These times range from 9.9 ¯   to   9.4 ¯   min for the hydrate component systems M1–M4, with values of 28.2 ¯ min to 12.6 ¯ min. We saw a significant reduction in the induction time values for all of the DIW samples when isopentane and SDS were introduced as additives. However, substantial induction time variations emerged for seawater samples. The higher variety in induction time for the methane/seawater hydrate demonstrates that salts pose a barrier to hydrate formation [34,35]. Additionally, it has been shown that even at 600 rpm, the higher saturation of salt ions in seawater prevents the mass transfer between salts and CH₄ molecules. Furthermore, monovalent and divalent salt ions also cause a reduction in the H–H lattice force between gas and water. Compared to methane/pure water hydrate formation, the hydrate formation here started very quickly, within 10 min, perhaps due to the nominal agitation force and adequate subcooling applied (chiller temperature ≈ 1 °C). Although the application of methane hydrate technology in the desalination process is a strong contender, whether with pure water or seawater, the lengthy induction period of gas hydrate formation could represent a substantial obstacle. However, when considering a shorter induction period with promoter additions in the seawater, seawater samples showed a substantially greater improvement in hydrate production. The results indicate that the presence of IP in saltwater significantly shortened the induction time for hydrate formation. The hydrophobic element shows that IP is a very important promoter in hydrate desalination applications. Furthermore, it is reasonable to assume that the hydrocarbon solute (IP) in seawater underwent an isomerization process at high pressure (5.2 MPa), which might have converted the salt ions into an ionic liquid in the presence of the required stirring and subcooling driving forces [24]. As a result, isomeric salt ions with IP probably increase the solubility of methane in water, and may hasten the development of hydrates. The results of experiment M6 also show that saltwater can produce methane hydrates within 12 min.
All experiments were carried out at a pressure of 5.2–5.3 MPa for methane hydrate formation, with a reactor temperature of 2 °C and stirring speed of 600 rpm
In contrast, compared to IP, the SDS exhibited an almost two-fold higher induction time in the formation of methane/seawater hydrates, and the water in aqueous solutions is likely essential for the aggregation of hydrotropes around salt ions, which will probably speed up the interaction between CH₄ and water. Nevertheless, compared to the seawater sample without any additives, the induction time for seawater samples was increased by 55.3% with isopentane addition and by 11.7% with SDS addition.

3.4. Comparison of Water Recovery from Two Different CH₄ Gas Hydrates

Figure 7a,b show comparisons for various promoter compositions, volumes of water to hydrate (mL), and degrees of water recovery (%) for DIW and seawater CH₄ hydrates. The results show that the water volume and recovery from CH₄ hydrates are relatively good when IP is present in both feed waters, which suggests that IP has a positive effect on hydrate kinetics, and that hydrate-based technology has the potential to be used for desalination. When employing DIW, isopentane (M2) outperforms SDS additives (M6) in terms of H₂O volume converted to hydrate at both measured pressure levels (i.e., 0.8 and 0.6 MPa). However, due to the salt content in saltwater, the volumes of water converted to hydrate were low. For distilled water and seawater, the isopentane additive (M2 and M6) enhanced the rate of water recovery, and the final gas consumption followed a similar pattern, also manifesting an increase in the hydrate creation rate. Additionally, CH₄ gas is consumed continuously to create more hydrates until reaching a plateau, indicating that no more gas can be used to create hydrates with the available free water in all test conditions. Nevertheless, the hydrate formation in DIW and seawater—i.e., ≈14 mL of DIW (M1) converted to CH₄ hydrate with ~14% water recovery (M5), with a volume of hydrate derived from seawater of ≈ 2.9 mL and a recovery of ≈ 2.9%—showed the lowest water recovery percentage due to the relatively low influence of mass transfer on hydrate development. However, the current studies show that the promoters provided a greater surface adsorption and mass transfer ability in the two different water systems, resulting in a hydrate promotion capacity.

4. Conclusions

In this work, isopentane and SDS were used as promoters to evaluate the hydrate formation parameters of methane hydrates in freshwater and seawater. The outcomes demonstrate that isopentane is superior to SDS since it increases the amount of water converted to hydrate, as well as the water recovery rate. Additionally, both the promoters alone, and a mixture of them, demonstrated greater gas consumption degrees and quicker induction times. Future research should examine the effects of including additional components, such as the possibility of improving the dissipation of exothermic heat from the hydrate reactor and the gas phase–liquid phase mass transfer mechanism, and lowering the thermal resistance by changing the architecture of the reactor tank in the hydrate formation process.

Author Contributions

Conceptualization, O.B., I.A., M.A., and P.L.; data curation, A.M.W.; formal analysis, I.A.; funding acquisition, O.B.; investigation, A.M.W.; methodology, O.B., I.A., M.A., A.S., and P.L.; project administration, O.B.; Resources, H.A. and A.S.; software, H.A.; supervision, O.B. and M.A.; writing—original draft, I.A. and A.M.W.; writing—review and editing, O.B. and M.A. All authors have read and agreed to the published version of the manuscript.

Funding

This project was funded by the National Plan for Science, Technology and Innovation (MAARIFAH), King Abdulaziz City for Science and Technology, the Kingdom of Saudi Arabia, award number (11-WAT2007-03). The authors also wish to thank the Science and Technology Unit, King Abdulaziz University, for technical support.

Data Availability Statement

Not applicable.

Conflicts of Interest

The authors declare no conflict of interest. The funders had no role in the design of the study; in the collection, analyses, or interpretation of data; in the writing of the manuscript, or in the decision to publish the results.

References

  1. Hassanpouryouzband, A.; Joonaki, E.; Farahani, M.V.; Takeya, S.; Ruppel, C.; Yang, J.; English, N.J.; Schicks, J.M.; Edlmann, K.; Mehrabian, H.; et al. Gas hydrates in sustainable chemistry. Chem. Soc. Rev. 2020, 49, 5225–5309. [Google Scholar] [CrossRef] [PubMed]
  2. Babu, P.; Nambiar, A.; He, T.; Karimi, I.A.; Lee, J.D.; Englezos, P.; Linga, P. A Review of Clathrate Hydrate Based Desalination To Strengthen Energy–Water Nexus. ACS Sustain. Chem. Eng. 2018, 6, 8093–8107. [Google Scholar] [CrossRef]
  3. Schicks, J.M. Gas hydrates in nature and in the laboratory: Necessary requirements for formation and properties of the resulting hydrate phase. ChemTexts 2022, 8, 13. [Google Scholar] [CrossRef]
  4. Lal, B.; Nallakukkala, S. Gas Hydrate in Water Treatment: Technological, Economic, and Industrial Aspects; John Wiley & Sons: Hoboken, NJ, USA, 2022. [Google Scholar]
  5. Xia, Z.; Zhao, Q.; Chen, Z.; Li, X.; Zhang, Y.; Xu, C.; Yan, K. Review of methods and applications for promoting gas hydrate formation process. J. Nat. Gas Sci. Eng. 2022, 101, 104528. [Google Scholar] [CrossRef]
  6. Zhang, Y.-T.; Chen, F.-L.; Yu, S.-J.; Wang, F. Biopromoters for Gas Hydrate Formation: A Mini Review of Current Status. Front. Chem. 2020, 8, 514. [Google Scholar] [CrossRef] [PubMed]
  7. Chong, Z.R.; He, T.; Babu, P.; Zheng, J.-N.; Linga, P. Economic evaluation of energy efficient hydrate based desalination utilizing cold energy from liquefied natural gas (LNG). Desalination 2019, 463, 69–80. [Google Scholar] [CrossRef]
  8. Zhang, P.; Wu, Q.; Mu, C. Influence of temperature on methane hydrate formation. Sci. Rep. 2017, 7, 7904. [Google Scholar] [CrossRef] [Green Version]
  9. Sloan, E.D. Fundamental principles and applications of natural gas hydrates. Nature 2003, 426, 353–359. [Google Scholar] [CrossRef]
  10. Pandey, J.S.; Daas, Y.J.; von Solms, N. Insights into Kinetics of Methane Hydrate Formation in the Presence of Surfactants. Processes 2019, 7, 598. [Google Scholar] [CrossRef] [Green Version]
  11. Kumar, A.; Bhattacharjee, G.; Kulkarni, B.D.; Kumar, R. Role of Surfactants in Promoting Gas Hydrate Formation. Ind. Eng. Chem. Res. 2015, 54, 12217–12232. [Google Scholar] [CrossRef]
  12. Lv, X.; Jing, S.; Zhao, D.; Lu, D.; Liu, Y.; Ma, Q.; Song, S.; Zhou, S. Study on the kinetic characteristics of gas hydrate in the dioctyl sodium sulfosuccinate system. RSC Adv. 2021, 11, 39108–39117. [Google Scholar] [CrossRef] [PubMed]
  13. Martinez, C.; Sandoval, J.F.; Ortiz, N.; Ovalle, S.; Beltran, J.G. Mechanisms, Growth Rates and Morphologies of Gas Hydrates of Carbon Dioxide, Methane and Their Mixtures. Methane 2022, 1, 2. [Google Scholar] [CrossRef]
  14. Chernov, A.A.; Pil’Nik, A.A.; Elistratov, D.S.; Mezentsev, I.V.; Meleshkin, A.V.; Bartashevich, M.; Vlasenko, M. New hydrate formation methods in a liquid-gas medium. Sci. Rep. 2017, 7, 40809. [Google Scholar] [CrossRef] [Green Version]
  15. de Deugd, R.M.; Jager, M.D.; Arons, J.D.S. Mixed hydrates of methane and water-soluble hydrocarbons modeling of empirical results. AIChE J. 2001, 47, 693–704. [Google Scholar] [CrossRef]
  16. Ganji, H.; Manteghian, M.; Zadeh, K.S.; Omidkhah, M.; Mofrad, H.R. Effect of different surfactants on methane hydrate formation rate, stability and storage capacity. Fuel 2007, 86, 434–441. [Google Scholar] [CrossRef]
  17. Khurana, M.; Yin, Z.; Linga, P. A Review of Clathrate Hydrate Nucleation. ACS Sustain. Chem. Eng. 2017, 5, 11176–11203. [Google Scholar] [CrossRef]
  18. Lin, W.; Chen, G.-J.; Sun, C.-Y.; Guo, X.-Q.; Wu, Z.-K.; Liang, M.-Y.; Chen, L.-T.; Yang, L.-Y. Effect of surfactant on the formation and dissociation kinetic behavior of methane hydrate. Chem. Eng. Sci. 2004, 59, 4449–4455. [Google Scholar] [CrossRef]
  19. Zhang, J.; Lee, S.; Lee, J. Does SDS micellize under methane hydrate-forming conditions below the normal Krafft point? J. Colloid Interface Sci. 2007, 315, 313–318. [Google Scholar] [CrossRef]
  20. Gootam, D.; Gaikwad, N.; Kumar, R.; Kaisare, N. Modeling Growth Kinetics of Methane Hydrate in Stirred Tank Batch Reactors. ACS Eng. Au 2021, 1, 148–159. [Google Scholar] [CrossRef]
  21. Babu, P.; Kumar, R.; Linga, P. Medium pressure hydrate based gas separation (HBGS) process for pre-combustion capture of carbon dioxide employing a novel fixed bed reactor. Int. J. Greenh. Gas Control 2013, 17, 206–214. [Google Scholar] [CrossRef]
  22. Smith, J.; Van Ness, H.; Abbot, M. Introduction to Chemical Engineering Thermodynamics, 6th ed.; McGraw Hill: New York, NY, USA, 2001. [Google Scholar]
  23. Ripmeester, J.A. Hydrate Research-From Correlations to a Knowledge-based Discipline: The Importance of Structure. Ann. N. Y. Acad. Sci. 2006, 912, 1–16. [Google Scholar] [CrossRef]
  24. Zhong, D.-L.; Ding, K.; Yan, J.; Yang, C.; Sun, D.-J. Influence of Cyclopentane and SDS on Methane Separation from Coal Mine Gas by Hydrate Crystallization. Energy Fuels 2013, 27, 7252–7258. [Google Scholar] [CrossRef]
  25. Zheng, J.; Zhang, B.-Y.; Wu, Q.; Linga, P. Kinetic Evaluation of Cyclopentane as a Promoter for CO2 Capture via a Clathrate Process Employing Different Contact Modes. ACS Sustain. Chem. Eng. 2018, 6, 11913–11921. [Google Scholar] [CrossRef]
  26. Lv, Q.N.; Song, Y.C.; Li, X.S. Kinetic Study on the Process of Cyclopentane plus Methane Hydrate Formation in NaCl Solution. Energy Fuels 2016, 30, 1310–1316. [Google Scholar]
  27. Lekvama, K.; Bishnoit, P.R. Dissolution of methane in water at low temperatures and intermediate pressures. Fluid Phase Equilibria 1997, 131, 297–309. [Google Scholar] [CrossRef]
  28. Ahmed, I.; Bamaga, O.; Albeirutty, M.H.; Abulkhair, H.; Alsaiari, A.; Organji, H.; Linga, P. Significance of Low Stirring Modes on the Kinetics of Methane Hydrate Formation. Energy Fuels 2022, 36, 7676–7686. [Google Scholar] [CrossRef]
  29. Oua, W.; Lu, W.; Ninga, F.; Wu, X. Measurement of methane solubility in pure water in equilibrium with hydrate by using high–pressure optical capillary cell. Mar. Chem. 2019, 212, 74–82. [Google Scholar] [CrossRef]
  30. Lekvama, K.; Ruoff, P. A reaction kinetic mechanism for methane hydrate formation in liquid water. J. Am. Chem. Soc. 1993, 115, 8565–8569. [Google Scholar] [CrossRef]
  31. Zatsepina, O.Y.; Buffett, B.A. Phase equilibrium of gas hydrate: Implications for the formation of hydrate in the deep seafloor. Geophys. Res. Lett. 1997, 24, 567–1570. [Google Scholar] [CrossRef]
  32. Zatsepina, O.Y.; Buffett, B.A. Thermodynamic conditions for the stability of gas hydrate in the seafloor. J. Geophys. Res. Earth Surf. 1998, 103, 24127–24139. [Google Scholar] [CrossRef]
  33. Servio, P.; Englezos, P. Measurement of Dissolved Methane in Water in Equilibrium with Its Hydrate. J. Chem. Eng. Data 2001, 47, 87–90. [Google Scholar] [CrossRef]
  34. Gambelli, A.; Tinivella, U.; Giovannetti, R.; Castellani, B.; Giustiniani, M.; Rossi, A.; Zannotti, M.; Rossi, F. Observation of the Main Natural Parameters Influencing the Formation of Gas Hydrates. Energies 2021, 14, 1803. [Google Scholar] [CrossRef]
  35. You, K.; Kneafsey, T.J.; Flemings, P.B.; Polito, P.; Bryant, S.L. Salinity-buffered methane hydrate formation and dissociation in gas-rich systems. J. Geophys. Res. Solid Earth 2015, 120, 643–661. [Google Scholar] [CrossRef]
  36. Nesterov, A.N.; Reshetnikov, A.M. Combined effect of NaCl and sodium dodecyl sulfate on the mechanism and kinetics of methane hydrate formation in an unstirred system. J. Nat. Gas Sci. Eng. 2022, 99, 104424. [Google Scholar] [CrossRef]
  37. Zhang, Q.; Wu, Q.; Zhang, H. Effect of propane and NaCl-SDS solution on nucleation process of mine gas hydrate. J. Chem. 2017, 2017, 1059109. [Google Scholar] [CrossRef] [Green Version]
  38. Ren, Z.; Liu, D.; Liu, Z.; Pan, Z. Influence of sodium chloride on the kinetics of methane hydrate formation in the presence of surfactant. J. Nat. Gas Sci. Eng. 2020, 83, 103622. [Google Scholar] [CrossRef]
  39. Zhang, J.S.; Lee, A.S.; Lee, J.W. Kinetics of Methane Hydrate Formation from SDS Solution. Ind. Eng. Chem. Res. 2007, 46, 6353–6359. [Google Scholar] [CrossRef]
  40. Lo, C.; Zhang, J.S.; Couzis, A.; Somasundaran, P.; Lee, J.W. Adsorption of Cationic and Anionic Surfactants on Cyclopentane Hydrates. J. Phys. Chem. C 2010, 114, 13385–13389. [Google Scholar] [CrossRef]
  41. Muller-Bongartz, B.; Wildeman, T.R.; Sloan, E.D., Jr. A hypothesis for hydrate nucleation phenomena. In Proceedings of the Second International Offshore and Polar Engineering Conference, San Francisco, CA, USA, 14–19 June 1992. ISOPE-I-92-089. [Google Scholar]
  42. Sloan, E.D.; Fleyfel, F. A molecular mechanism for gas hydrate nucleation from ice. AIChE J. 1991, 37, 1281–1292. [Google Scholar] [CrossRef]
  43. Natarajan, V.; Bishnoi, P.; Kalogerakis, N. Induction phenomena in gas hydrate nucleation. Chem. Eng. Sci. 1994, 49, 2075–2087. [Google Scholar] [CrossRef]
  44. Ke, W.; Svartaas, T.M.; Chen, D. A review of gas hydrate nucleation theories and growth models. J. Nat. Gas Sci. Eng. 2018, 61, 169–196. [Google Scholar] [CrossRef]
  45. Zhong, Y.; Rogers, R. Surfactant effects on gas hydrate formation. Chem. Eng. Sci. 2000, 55, 4175–4187. [Google Scholar] [CrossRef]
  46. Chanakro, W.; Jaikwang, C.; Inkong, K.; Kulprathipanja, S.; Rangsunvigit, P. Comparative Study of Tetra-N-Butyl Ammonium Bromide and Cyclopentane on the Methane Hydrate Formation and Dissociation. Energies 2020, 13, 6518. [Google Scholar] [CrossRef]
  47. Kutergin, O.B.; Mel’nikov, V.P.; Nesterov, A.N. Influence of surfactants on the mechanism and kinetics of the formation of gas hydrates. Dokl. Akad. Nauk SSSR 1992, 323, 549. [Google Scholar]
  48. Karaaslan, U.; Parlktuna, M. Surfactants as hydrate promoters? Energy Fuels 2000, 14, 1103. [Google Scholar] [CrossRef]
  49. Daimaru, T.; Yamasaki, A.; Yanagisawa, Y. Effect of surfactant carbon chain length on hydrate formation kinetics. J. Pet. Sci. Eng. 2007, 56, 89–96. [Google Scholar] [CrossRef]
  50. Link, D.D.; Ladner, E.P.; Elsen, H.A.; Taylor, C.E. Formation and dissociation studies for optimizing the uptake of methane by methane hydrates. Fluid Phase Equilibria 2003, 211, 1–10. [Google Scholar] [CrossRef]
  51. Di Profio, P.; Arca, S.; Germani, R.; Savelli, G. Novel Nanostructured Media for Gas Storage and Transport: Clathrate Hydrates of Methane and Hydrogen. J. Fuel Cell Sci. Technol. 2006, 4, 49–55. [Google Scholar] [CrossRef]
Figure 1. Experimental layout of submerged cooled clathrate hydrate reactor: (1) hydrate reactor; (2) reactor lid (2b: gas feed; 2c: reactor pressure transmitter; 2d/2e: gas and liquid thermocouple; 2f/2g: watch glass for camera and LED); (3) submerged chilling bath; (4) stirring plate (4a: rpm controller; 4b: heating controller); (5) magnetic bar; (6) chiller (6a/6b: coolant pump in/out; 6c: coolant thermocouple); (7) high-pressure gas cylinder (7a: cylinder pressure valve; 7b: cylinder pressure gauge; 7c feed pressure gauge, 7d: feed pressure valve; 7e: feed pressure valve controller; (8) reactor pressure relief valve; (9)–(10) data acquisition system.
Energies 15 09652 g001
Figure 2. Temperature and pressure profile kinetic measurement of CH₄ gas absorption in pure water (a) and in seawater (b).
Energies 15 09652 g002
Figure 3. Comparison of temperature and pressure profile kinetic measurement of CH₄/DIW/IP (a) vs. CH₄/SW/IP (b) and CH₄/DIW/ SDS (c) vs. CH₄/SW/SDS (d).
Energies 15 09652 g003
Figure 4. Comparison of temperature and pressure profile kinetic measurement of CH₄/DIW/IP + SDS (a) vs. CH₄/seawater/IP + SDS (b).
Energies 15 09652 g004
Figure 5. Comparison of CH₄ gas uptake (moles) in two different types of water ((a) DIW; (b) Seawater) with and without promoters.
Energies 15 09652 g005
Figure 6. Total CH₄ gas consumption in two different liquids (DIW and seawater) with and without promoters.
Energies 15 09652 g006
Figure 7. Water recovery from two different liquids (a) DIW; (b) Seawater with and without promoters.
Energies 15 09652 g007
Table 1. Parameters of the solutions used in the study.
Additives or PromotersComponents of Deionized Water (DIW) SolutionComponents of Seawater (SW) Solution
DIWPromotersSeawaterPromoters
IP100 mL32.3 mL100 mL32.3 mL
SDS100 mL0.10 g100 mL0.10 g
IP + SDS100 mL32.3 mL + 0.10 g 100 mL32.3 mL + 0.10 g
Codes of CH₄ hydrate formation experiments and corresponding liquid feed composition
M1M2M3M4M5M6M7M8
DIWDIW/IPDIW/SDSDIW/IP + SDSSWSW/IPSW/SDSSW/IP + SDS
Parameters for CH₄ Hydrate Formation
Gas pressures (MPa)5.2 to 5.3 ± 0.1
Temperature (°C)2 ± 0.5
Stirring (rpm)600
Hydrate formation duration (min)150–400
Table 2. Influence of promoters and their blends on the gas hydrate induction times (HITs) of pure water and seawater.
Exp.Liquid Feed ComponentsTrial 1Trial 2Trial 3Average HIT
Code(mL)(min)
M1DW11.58.59.7 9.9 ¯
M2DW + A1128.57.7 9.4 ¯
M3DW + A210.39.28.7 9.6 ¯
M4DW + A31198.2 9.4 ¯
M5SW30.428.226 28.2 ¯
M6SW + A1111413 12.6 ¯
M7SW + A226.72325 24.9 ¯
M8SW + A318.216.514.5 16.4 ¯
DW and SW—Distilled water and seawater samples, respectively. A1—Isopentane (IP)–C₅H₁₂: 32.30 g added to 100 g of feed water (23 wt.% of feed water). A2—Sodium dodecyl sulfate (SDS): 0.10 g added to 100 g of feed water (0.1 wt.% of feed water). A3—IP and SDS mixture: A1 + A2 (32.3 g IP + 0.10 g SDS added to 100 g of feed water).
Publisher’s Note: MDPI stays neutral with regard to jurisdictional claims in published maps and institutional affiliations.

