
Influence of Rock Properties on Structural Failure Probability—Caprock Shale Examples from the Horda Platform, Offshore Norway


Abstract
1. Introduction
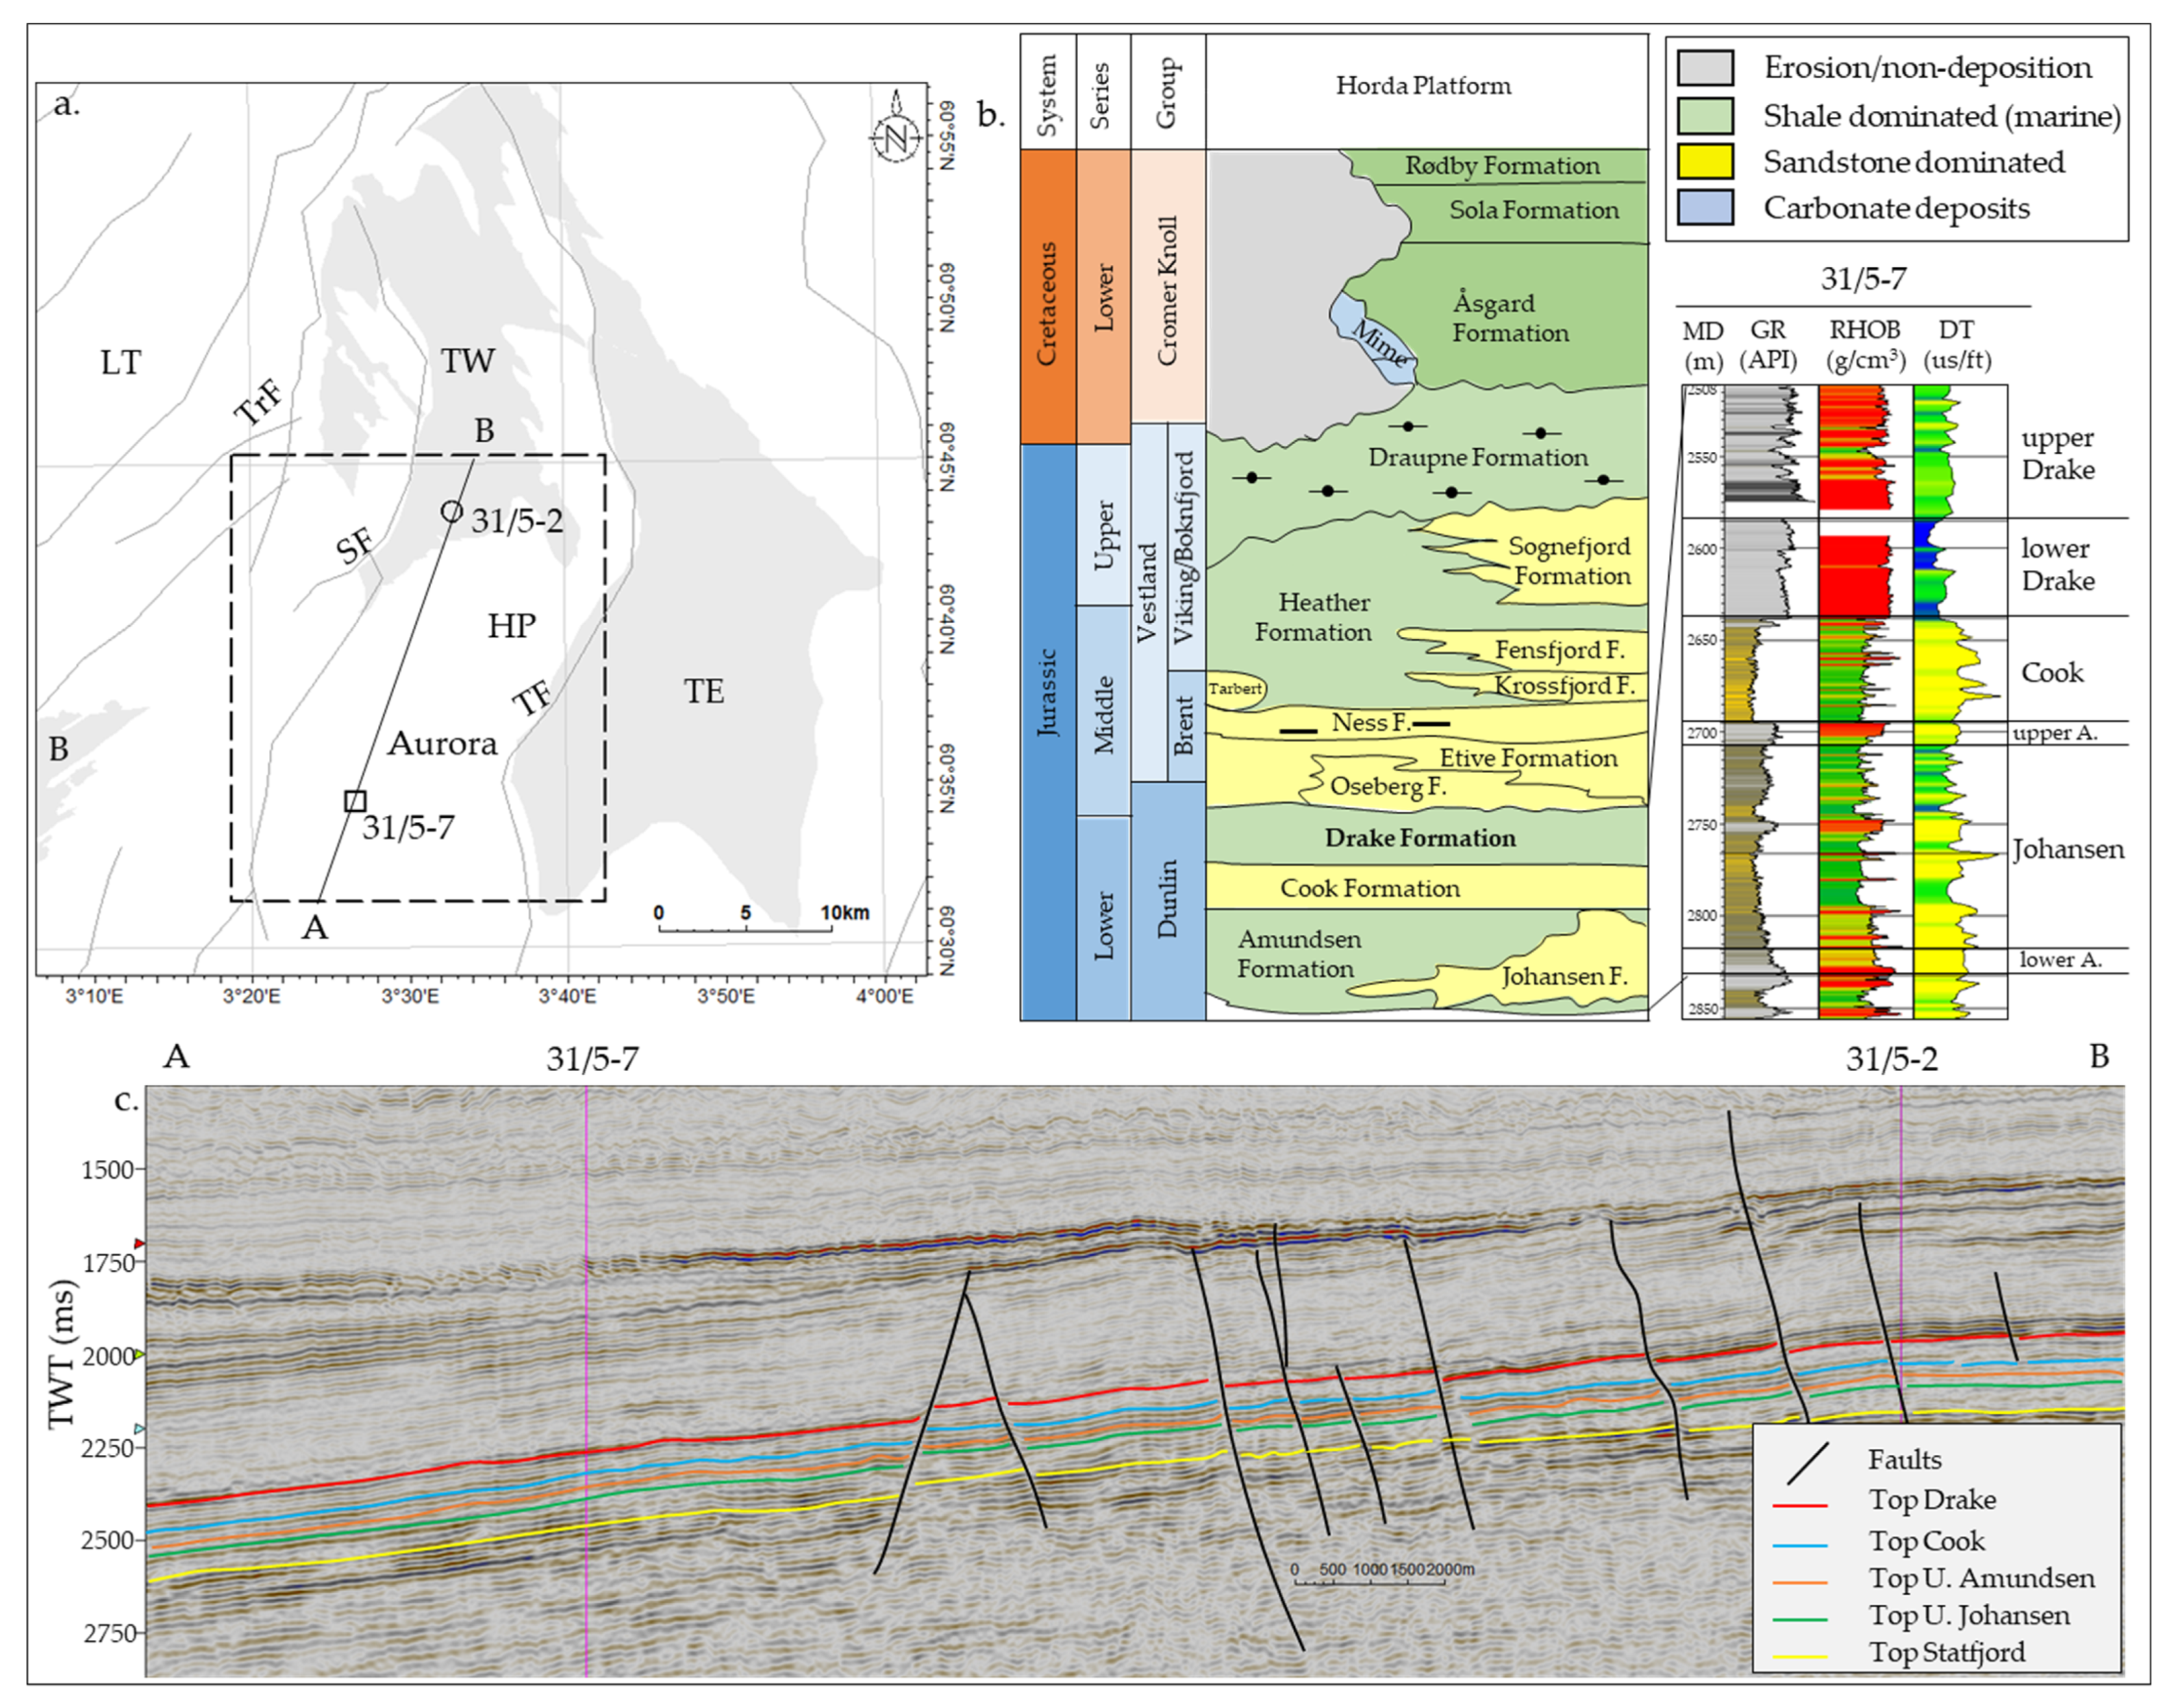
2. Study Area
3. Materials and Methods
3.1. Model Parameters
3.1.1. In Situ Stress-State Condition
3.1.2. Rock Strength Properties
3.1.3. Horizontal Stress Path
3.2. Model Definition
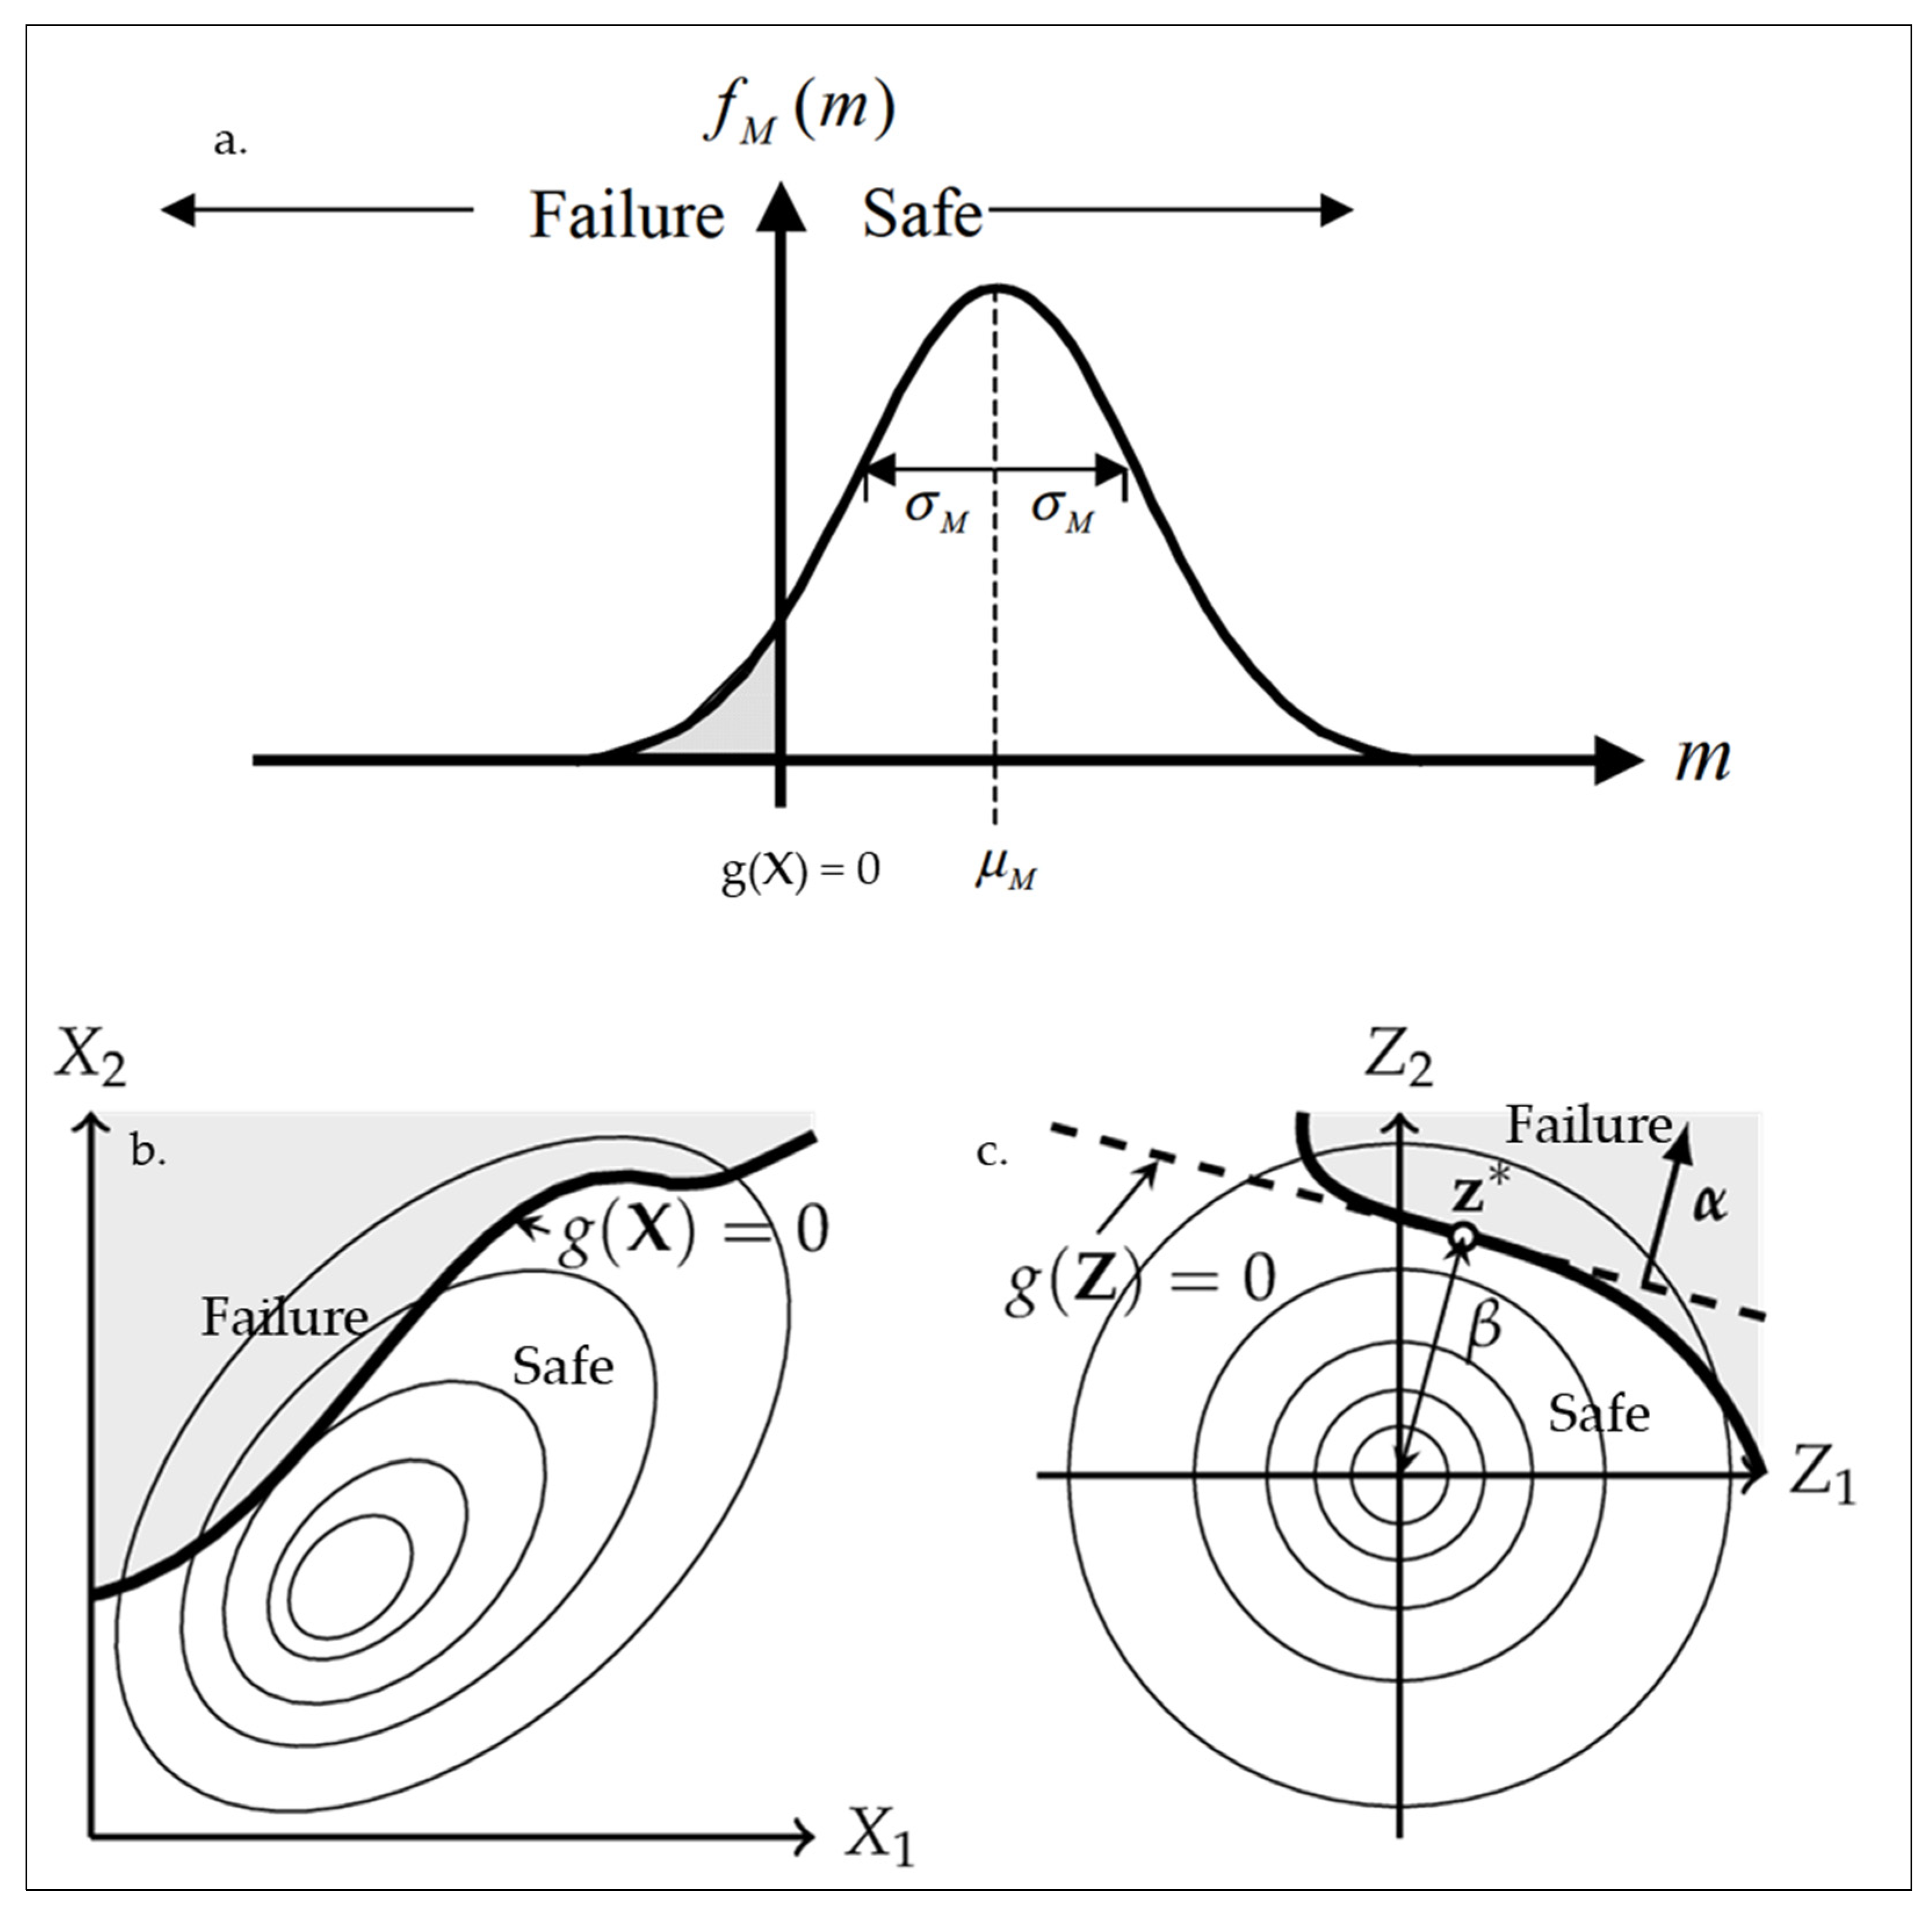
3.2.1. Reliability Analysis and Limit-State Function
3.2.2. Reliability Method
3.3. Modeling Scenarios and Input Parameters
3.4. Parameter Sensitivity
4. Results
4.1. Tensile Failure
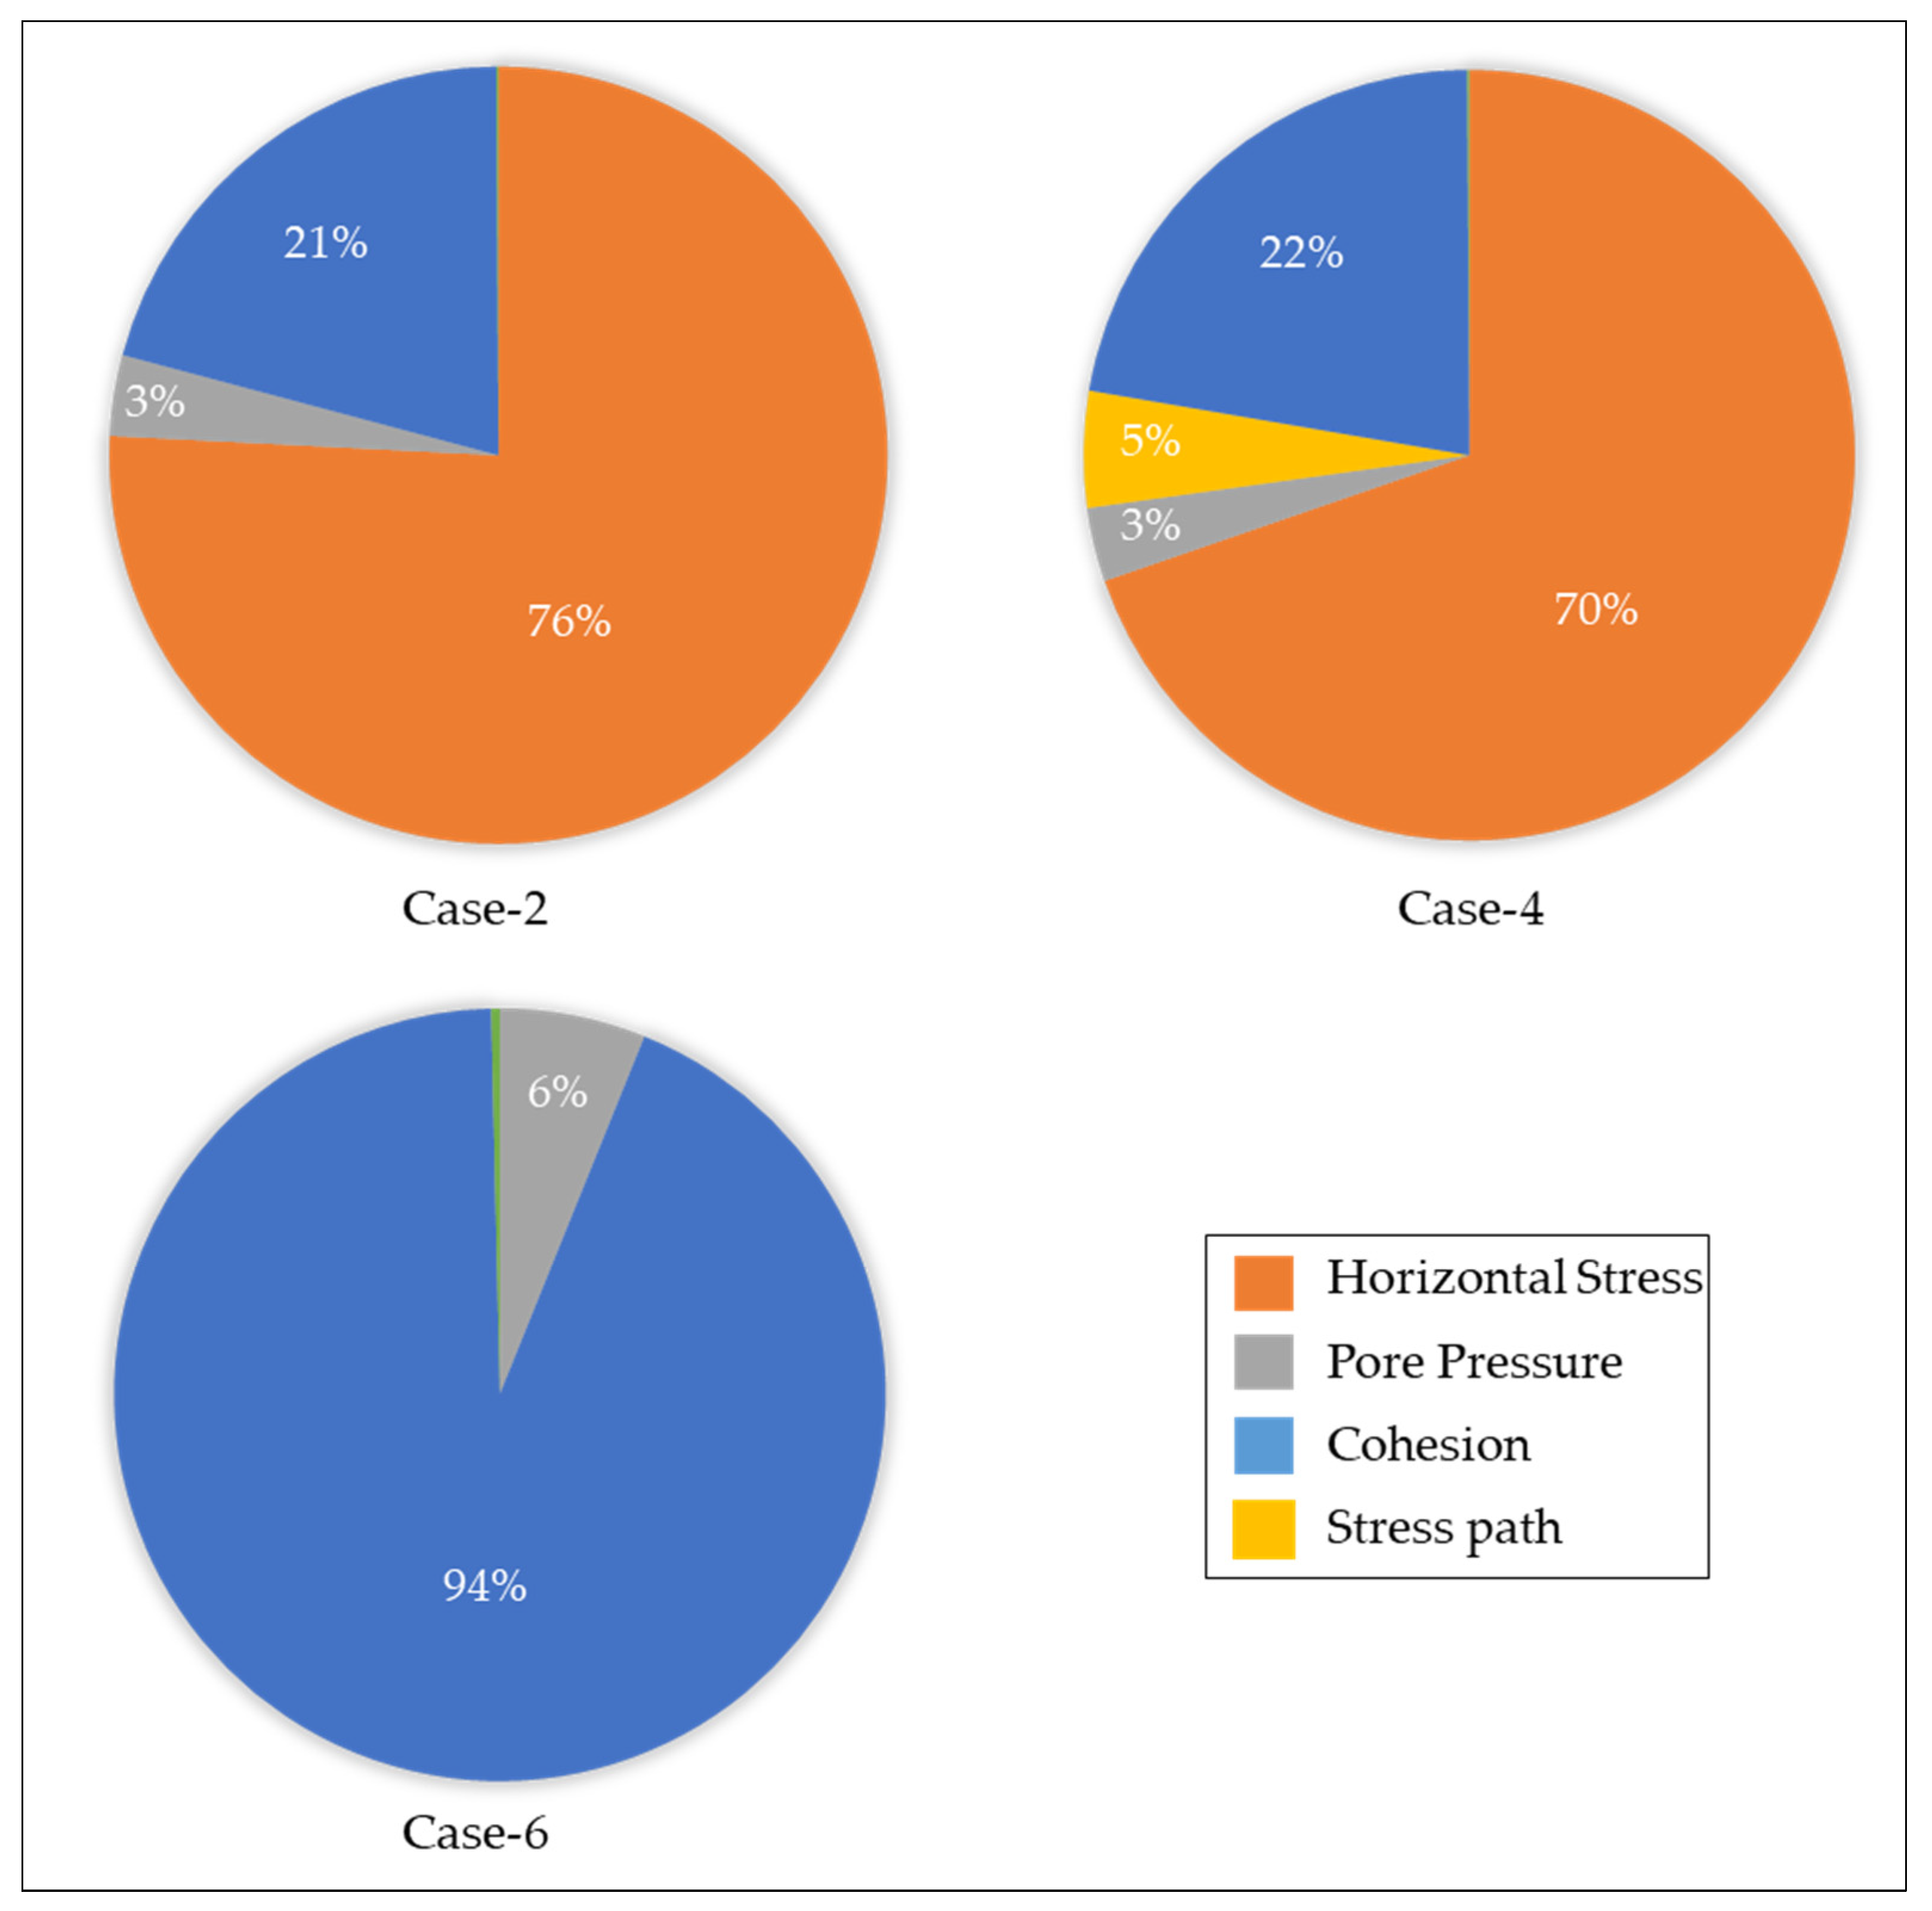
4.2. Probabilistic Sensitivity
5. Discussion
5.1. Effect of Caprock Properties
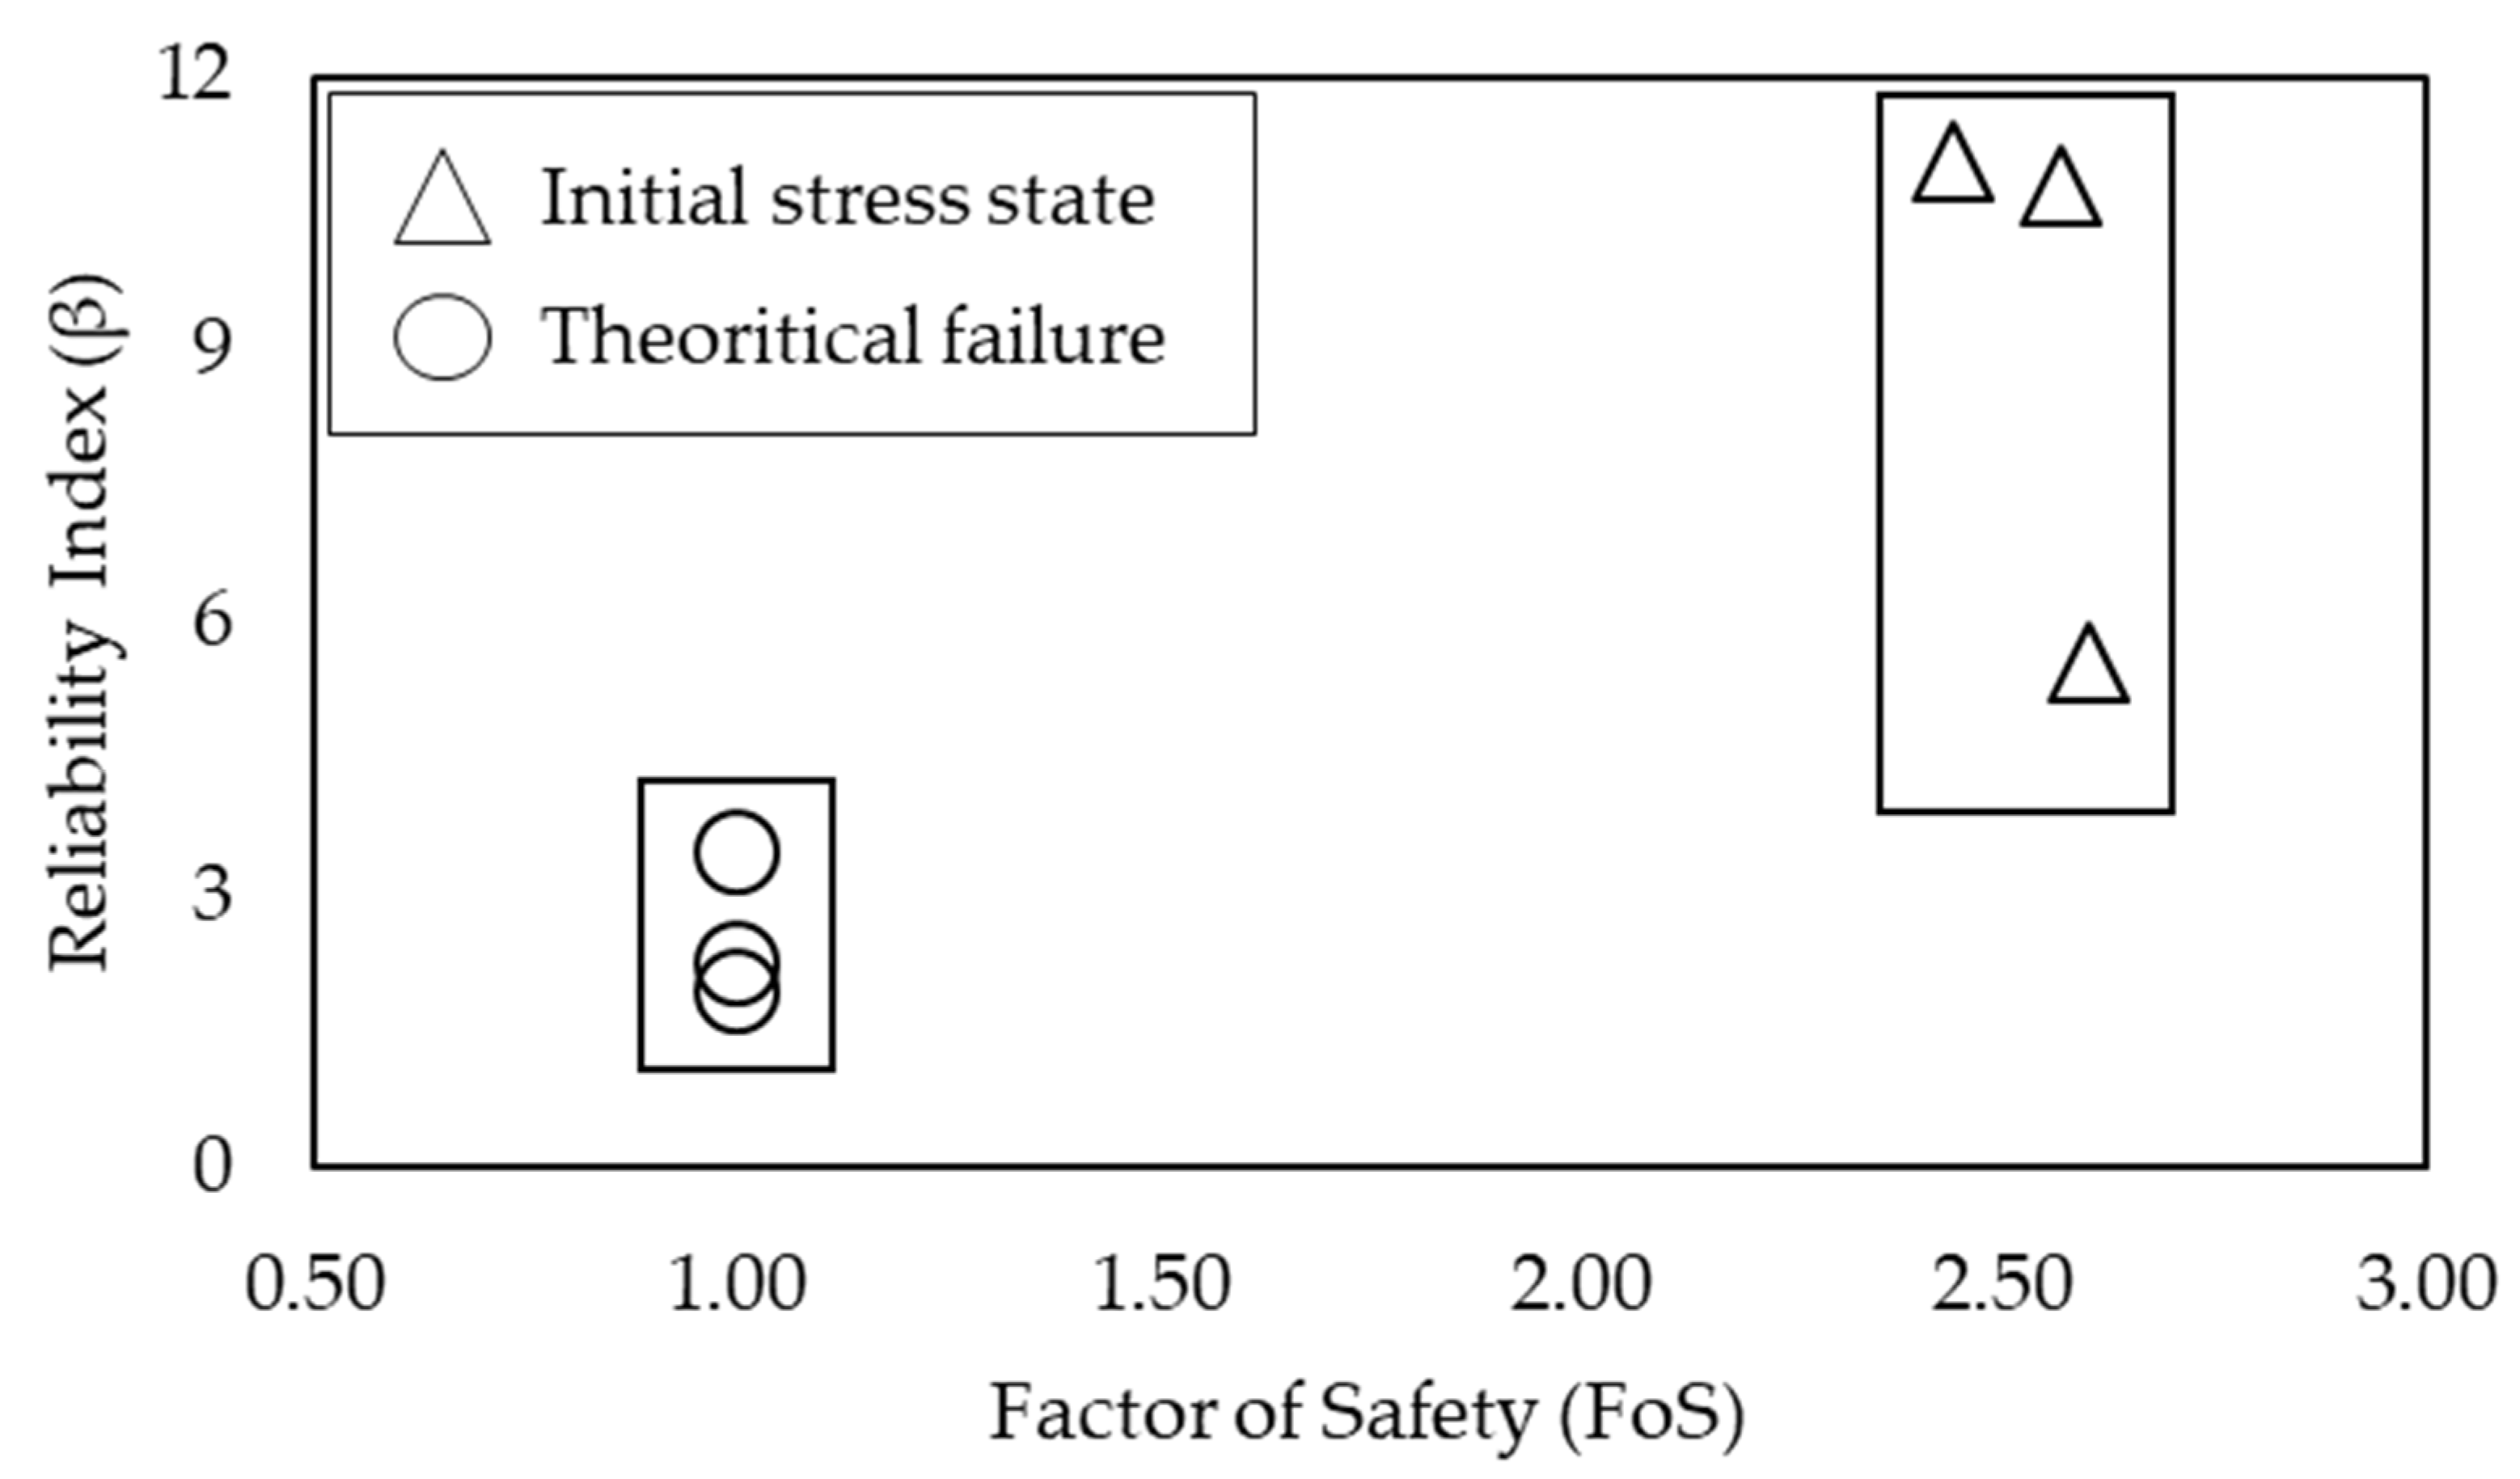
5.2. Initial Safety Chart
6. Conclusions
- ▪
- The Drake caprock shale failure chance is zero in both the in situ stress-state condition and after-injection scenarios. However, this method indicated a qualitative assessment and requires further investigation to quantify the results.
- ▪
- Horizontal stress and cohesion are the most influential input parameters when estimating probabilistic failure.
- ▪
- Shallow caprock shale units are more affected by the principal stresses, while the rock strength properties influence the deep caprock shale units while estimating the failure probability.
- ▪
- A subsurface structural reliability safety chart is proposed to evaluate the safe and unsatisfactory caprock shales. However, as the failure probability values are formation-specific, a standard universal chart might be impractical and requires further investigation.
- ▪
- Tensile failure estimation should be carried out if the injected pore pressure and horizontal stress have a similar range.
Author Contributions
Funding
Data Availability Statement
Acknowledgments
Conflicts of Interest
References
- Chiaramonte, L.; Johnson, S.; White, J.A. Preliminary geomechanical analysis of CO2 injection at Snøhvit, Norway. In 45th US Rock Mechanics/Geomechanics Symposium; American Rock Mechanics Association: San Francisco, CA, USA, 2011. [Google Scholar]
- Mathieson, A.; Midgley, J.; Dodds, K.; Wright, I.; Ringrose, P.; Saoul, N. CO2 sequestration monitoring and verification technologies applied at Krechba, Algeria. Lead Edge 2010, 29, 216–222. [Google Scholar] [CrossRef]
- Baklid, A.; Korbol, R.; Owren, G. Sleipner Vest CO2 Disposal, CO2 Injection into A Shallow Underground Aquifer. In SPE Annual Technical Conference and Exhibition; Society of Petroleum Engineers: Denver, CO, USA, 1996. [Google Scholar] [CrossRef]
- Martens, S.; Kempka, T.; Liebscher, A.; Lüth, S.; Möller, F.; Myrttinen, A.; Norden, B.; Schmidt-Hattenberger, C.; Zimmer, M.; Kühn, M.; et al. Europe’s longest-operating on-shore CO2 storage site at Ketzin, Germany: A progress report after three years of injection. Environ. Earth Sci. 2012, 67, 323–334. [Google Scholar] [CrossRef]
- Hortle, A.; Xu, J.; Dance, T. Integrating hydrodynamic analysis of flow systems and induced-pressure decline at the Otway CO2 storage site to improve reservoir history matching. Mar. Pet. Geol. 2013, 45, 159–170. [Google Scholar] [CrossRef]
- Ingram, G.M.; Urai, J.L.; Naylor, M.A. Sealing processes and top seal assessment. In Norwegian Petroleum Society Special Publications; Elsevier: Amsterdam, The Netherlands, 1997; Volume 7, pp. 165–174. [Google Scholar]
- Hart, B.S.; Macquaker, J.H.S.; Taylor, K.G. Mudstone (“shale”) depositional and diagenetic processes: Implications for seismic analyses of source-rock reservoirs. Interpretation 2013, 1, B7–B26. [Google Scholar] [CrossRef]
- Fawad, M.; Mondol, N.H.; Jahren, J.; Bjørlykke, K. Mechanical compaction and ultrasonic velocity of sands with different texture and mineralogical composition. Geophys. Prospect. 2011, 59, 697–720. [Google Scholar] [CrossRef]
- Mondol, N.H.; Bjørlykke, K.; Jahren, J. Experimental compaction of clays: Relationship between permeability and petrophysical properties in mudstones. Pet. Geosci. 2008, 14, 319–337. [Google Scholar] [CrossRef]
- Storvoll, V.; Bjørlykke, K.; Mondol, N.H. Velocity-depth trends in Mesozoic and Cenozoic sediments from the Norwegian Shelf. Am. Assoc. Pet. Geol. Bull. 2005, 89, 359–381. [Google Scholar] [CrossRef]
- Bjørlykke, K. Mudrocks, Shales, Silica Deposits and Evaporites. In Petroleum Geoscience; Springer: Berlin/Heidelberg, Germany, 2015; pp. 217–229. [Google Scholar]
- Bjørlykke, K. Compaction of sedimentary rocks: Shales, sandstones and carbonates. In Petroleum Geoscience; Springer: Berlin/Heidelberg, Germany, 2015; pp. 351–360. [Google Scholar]
- Rahman, M.J.; Fawad, M.; Choi, J.C.; Mondol, N.H. Effect of overburden spatial variability on field-scale geomechanical modeling of potential CO2 storage site Smeaheia, offshore Norway. J. Nat. Gas Sci. Eng. 2022, 99, 104453. [Google Scholar] [CrossRef]
- Addis, M.A. The stress-depletion response of reservoirs. In SPE Annual Technical Conference and Exhibition; Society of Petroleum Engineers: San Antonio, TX, USA, 1997. [Google Scholar]
- Grasso, J.-R. Mechanics of seismic instabilities induced by the recovery of hydrocarbons. Pure Appl. Geophys. 1992, 139, 507–534. [Google Scholar] [CrossRef]
- Hillis, R.R. Coupled changes in pore pressure and stress in oil fields and sedimentary basins. Pet. Geosci. 2001, 7, 419–425. [Google Scholar] [CrossRef]
- Segall, P. Earthquakes triggered by fluid extraction. Geology 1989, 17, 942–946. [Google Scholar] [CrossRef]
- Duncan, J.M. Factors of safety and reliability in geotechnical engineering. J. Geotech. Geoenviron. Eng. 2000, 126, 307–316. [Google Scholar] [CrossRef]
- Choi, S.-K.; Canfield, R.A.; Grandhi, R.V. Reliability-Based Structural Design; Springer: London, UK, 2007. [Google Scholar] [CrossRef]
- Shittu, A.A.; Kolios, A.; Mehmanparast, A. A systematic review of structural reliability methods for deformation and fatigue analysis of offshore jacket structures. Metals 2020, 11, 50. [Google Scholar] [CrossRef]
- Christian, J.T. Geotechnical engineering reliability: How well do we know what we are doing? J. Geotech. Geoenviron. Eng. 2004, 130, 985–1003. [Google Scholar] [CrossRef]
- Nadim, F. Tools and strategies for dealing with uncertainty in geotechnics. In Probabilistic Methods in Geotechnical Engineering; Springer: Vienna, Austria, 2007; pp. 71–95. [Google Scholar]
- Melchers, R.E.; Beck, A.T. Structural Reliability Analysis and Prediction, 3rd ed.; Wiley: Hoboken, NJ, USA, 2018. [Google Scholar]
- Cornell, C.A. A probability-based structural code. J. Proc. 1969, 66, 974–985. [Google Scholar]
- Hasofer, A.M.; Lind, N.C. Exact and invariant second-moment code format. J. Eng. Mech. Div. 1974, 100, 111–121. [Google Scholar] [CrossRef]
- Nie, J.; Ellingwood, B.R. Directional methods for structural reliability analysis. Struct. Saf. 2000, 22, 233–249. [Google Scholar] [CrossRef]
- Jimenez-Rodriguez, R.; Sitar, N.; Chacón, J. System reliability approach to rock slope stability. Int. J. Rock Mech. Min. Sci. 2006, 43, 847–859. [Google Scholar] [CrossRef]
- Cho, S.E. First-order reliability analysis of slope considering multiple failure modes. Eng. Geol. 2013, 154, 98–105. [Google Scholar] [CrossRef]
- U.S. Army Corps of Engineers. Engineering and Design Introduction to Probability and Reliability Methods for Use in Geotechnical Engineering; U.S. Army Corps of Engineers: Washington, DC, USA, 1997.
- Jiang, S.-H.; Li, D.-Q.; Cao, Z.-J.; Zhou, C.-B.; Phoon, K.-K. Efficient system reliability analysis of slope stability in spatially variable soils using Monte Carlo simulation. J. Geotech. Geoenviron. Eng. 2015, 141, 4014096. [Google Scholar] [CrossRef]
- Nomikos, P.P.; Sofianos, A.I. An analytical probability distribution for the factor of safety in underground rock mechanics. Int. J. Rock Mech. Min. Sci. 2011, 48, 597–605. [Google Scholar] [CrossRef]
- Hurtado, J.E.; Alvarez, D.A. Neural-network-based reliability analysis: A comparative study. Comput. Methods Appl. Mech. Eng. 2001, 191, 113–132. [Google Scholar] [CrossRef]
- Chojaczyk, A.A.; Teixeira, A.P.; Neves, L.C.; Cardoso, J.B.; Soares, C.G. Review and application of Artificial Neural Networks models in reliability analysis of steel structures. Struct. Saf. 2015, 52, 78–89. [Google Scholar] [CrossRef]
- Afshari, S.S.; Enayatollahi, F.; Xu, X.; Liang, X. Machine learning-based methods in structural reliability analysis: A review. Reliab Eng. Syst. Saf. 2022, 219, 108223. [Google Scholar] [CrossRef]
- Cardoso, J.B.; de Almeida, J.R.; Dias, J.M.; Coelho, P.G. Structural reliability analysis using Monte Carlo simulation and neural networks. Adv. Eng. Softw. 2008, 39, 505–513. [Google Scholar] [CrossRef]
- Bai, Y.; Jin, W.-L. Basics of Structural Reliability; Butterworth-Heinemann: Oxford, UK, 2016; pp. 581–602, Chapter 31. [Google Scholar] [CrossRef]
- Jiang, Z.; Hu, W.; Dong, W.; Gao, Z.; Ren, Z. Structural reliability analysis of wind turbines: A review. Energies 2017, 10, 2099. [Google Scholar] [CrossRef]
- Pereira, F.L.G.; Roehl, D.; Laquini, J.P.; Oliveira, M.F.F.; Costa, A.M. Fault reactivation case study for probabilistic assessment of carbon dioxide sequestration. Int. J. Rock Mech. Min. Sci. 2014, 71, 310–319. [Google Scholar] [CrossRef]
- Rahman, M.J.; Choi, J.C.; Fawad, M.; Mondol, N.H. Probabilistic analysis of Vette fault stability in potential CO2 storage site Smeaheia, offshore Norway. Int. J. Greenh Gas. Control 2021, 108, 103315. [Google Scholar] [CrossRef]
- Rahman, M.J.; Choi, J.C.; Fawad, M.; Mondol, N.H. Probabilistic Analysis of Draupne Shale Caprock Reliability of the Alpha Prospect—A Potential CO2 Storage Site in the Smeaheia Area, Northern North Sea. In TCCS–11. CO2 Capture, Transport and Storage. Trondheim 22nd–23rd June 2021 Short Papers from the 11th International Trondheim CCS Conference; SINTEF Academic Press: Throndheim, Norway, 2021. [Google Scholar]
- Færseth, R.B. Interaction of Permo-Triassic and Jurassic extensional fault-blocks during the development of the northern North Sea. J. Geol. Soc. Lond. 1996, 153, 931–944. [Google Scholar] [CrossRef]
- Steel, R.; Ryseth, A. The Triassic—Early Jurassic succession in the northern North Sea: Megasequence stratigraphy and intra-Triassic tectonics. Geol. Soc. Lond. Spec. Publ. 1990, 55, 139–168. [Google Scholar] [CrossRef]
- Whipp, P.S.; Jackson, C.L.; Gawthorpe, R.L.; Dreyer, T.; Quinn, D. Normal fault array evolution above a reactivated rift fabric; a subsurface example from the northern Horda Platform, Norwegian North Sea. Basin Res. 2014, 26, 523–549. [Google Scholar] [CrossRef]
- Stewart, D.J.; Schwander, M.; Bolle, L. Jurassic depositional systems of the Horda Platform, Norwegian North Sea: Practical consequences of applying sequence stratigraphic models. Nor. Pet. Soc. Spec. Publ. 1995, 5, 291–323. [Google Scholar]
- Steel, R.J. Triassic–Jurassic megasequence stratigraphy in the Northern North Sea: Rift to post-rift evolution. Geol. Soc. Lond. Pet. Geol. Conf. Ser. 1993, 4, 299–315. [Google Scholar] [CrossRef]
- Vollset, J.; Doré, A.G. A Revised Triassic and Jurassic Lithostratigraphic Nomenclature for the Norwegian North Sea; NPD Bulletin no. 3; Oljedirektoratet (Norwegian Petroleum Directorate): Stavanger, Norway, 1984; p. 62. [Google Scholar]
- NPD. NPD FactPages 2022. Available online: https://npdfactpages.npd.no/factpages/Default.aspx?culture=en (accessed on 31 October 2022).
- Gassnova. Geological Storage of CO2 from Mongstad. Interim Report Johansen Formation. 2012. Report No. TL02-GTL-Z-RA-0001, Rev. 03, Pages. 379. Available online: https://ccsnorway.com/app/uploads/sites/6/2019/09/tl02-gtl-z-ra-0001_johansen_interim_report_final_050312_final_liten.pdf (accessed on 31 October 2022).
- Fawad, M.; Rahman, M.J.; Mondol, N.H. Seismic-derived geomechanical properties of potential CO2 storage reservoir and caprock in Smeaheia area, northern North Sea—Submitted for review. Lead. Edge 2021, 40, 254–260. [Google Scholar] [CrossRef]
- Horsrud, P.; Sønstebø, E.F.; Bøe, R. Mechanical and petrophysical properties of North Sea shales. Int. J. Rock Mech. Min. Sci. 1998, 35, 1009–1020. [Google Scholar] [CrossRef]
- Hettema, M.H.H.; Schutjens, P.; Verboom, B.J.M.; Gussinklo, H.J. Production-induced compaction of a sandstone reservoir: The strong influence of stress path. SPE Reserv. Eval. Eng. 2000, 3, 342–347. [Google Scholar] [CrossRef]
- Bjørnarå, T.I. Model Development for Efficient Simulation of CO2 Storage. Ph.D. Thesis, 2018; p. 238. Available online: https://hdl.handle.net/1956/17695 (accessed on 31 October 2022).
- Ditlevsen, O.; Madsen, H.O. Structural Reliability Methods; John Wiley and Sons: NewYork, NY, USA, 2007. [Google Scholar]
- Faber, M.H. Basics of Structural Reliability; Swiss Federal Institute of Technology ETH: Zürich, Switzerland, 2009. [Google Scholar]
- Madsen, H.O.; Krenk, S.; Lind, N.C. Methods of Structural Safety; Courier Corporation: Chelmsford, MA, USA, 2006. [Google Scholar]
- Thoft-Christensen, P.; Baker, M.J. Reliability of structural systems. In Structure, Reliable, Theory and Its Application; Springer: Berlin/Heidelberg, Germany, 1982; pp. 113–127. [Google Scholar]
- Hackl, J. PyRe Documentation 2018. Available online: http://github.com/hackl/pyre (accessed on 31 March 2022).
- Skurtveit, E.; Grande, L.; Ogebule, O.Y.; Gabrielsen, R.H.; Faleide, J.I.; Mondol, N.H.; Maurer, R.; Horsrud, P. Mechanical testing and sealing capacity of the Upper Jurassic Draupne Formation, North Sea. In 49th US Rock Mechanics/Geomechanics Symposium; OnePetro: San Francisco, CA, USA, 2015. [Google Scholar]
- Gutierrez, M.; Øino, L.E.; Nygaard, R. Stress-dependent permeability of a de-mineralised fracture in shale. Mar. Pet. Geol. 2000, 17, 895–907. [Google Scholar] [CrossRef]
- Campolongo, F.; Kleijnen, J.P.C.; Andres, T. Screening Methods; Wiley Series in Probability & Statistics; John Wiley & Sons: Chichester, UK, 2000; pp. 65–80. [Google Scholar]
- Rohmer, J.; Seyedi, D.M. Coupled large scale hydromechanical modelling for caprock failure risk assessment of CO2 storage in deep saline aquifers. Oil Gas Sci. Technol.-Rev. Institut Français Du Pétrole 2010, 65, 503–517. [Google Scholar] [CrossRef]
- NESUS Theoretical Manual; Version 9.6 ed.; Southwest Research Institute: San Antorio, TX, USA, 2011.
- Easley, S.K.; Pal, S.; Tomaszewski, P.R.; Petrella, A.J.; Rullkoetter, P.J.; Laz, P.J. Finite element-based probabilistic analysis tool for orthopaedic applications. Comput. Methods Programs Biomed. 2007, 85, 32–40. [Google Scholar] [CrossRef]
- Rahman, M.J.; Fawad, M.; Mondol, N.H. Organic-rich shale caprock properties of potential CO2 storage sites in the northern North Sea, offshore Norway. Mar. Pet. Geol. 2020, 122, 104665. [Google Scholar] [CrossRef]
- Rahman, M.J.; Fawad, M.; Jahren, J.; Mondol, N.H. Influence of Depositional and Diagenetic Processes on Caprock Properties of CO2 Storage Sites in the Northern North Sea, Offshore Norway. Geosciences 2022, 12, 181. [Google Scholar] [CrossRef]
- Rahman, M.J.; Fawad, M.; Jahren, J.; Mondol, N.H. Top seal assessment of Drake Formation shales for CO2 storage in the Horda Platform area, offshore Norway. Int. J. Gren. Gas. Cont. 2022, 119, 103700. [Google Scholar] [CrossRef]
- Juang, C.H.; Zhang, J.; Shen, M.; Hu, J. Probabilistic methods for unified treatment of geotechnical and geological uncertainties in a geotechnical analysis. Eng. Geol. 2019, 249, 148–161. [Google Scholar] [CrossRef]


| Unit | Assumptions | |
|---|---|---|
| Case-1 | Upper Drake | Initial stress-state condition |
| Case-2 | Lower Drake | |
| Case-3 | Upper Drake | After the CO2 injection scenario |
| Case-4 | Lower Drake | |
| Case-5 | Upper Drake | Theoretical shear failure due to decreasing σ3 |
| Case-6 | Lower Drake |
| Parameters | Average | Unit | Standard Deviation | Random Distribution | Sources |
|---|---|---|---|---|---|
| Initial vertical stress (σv) | 50.50 | MPa | 3.21 | Normal | [48] |
| Initial horizontal stress (σh1–4) | 36.50 | MPa | 1.33 | Normal | [48] |
| Initial horizontal stress (σh5) | 20.53 | MPa | 0.00 | Normal | [48] |
| Initial horizontal stress (σh6) | 21.84 | MPa | 0.00 | Normal | [48] |
| Initial pore pressure (Pp1,2,5,6) | 25.70 | MPa | 0.28 | Normal | [48] |
| Injected pore pressure (Pp3,4) | 28.90 | MPa | 0.28 | Normal | [48] |
| Horizontal stress path (γh) | 0.60 | - | 0.11 | Normal | Inversion cube |
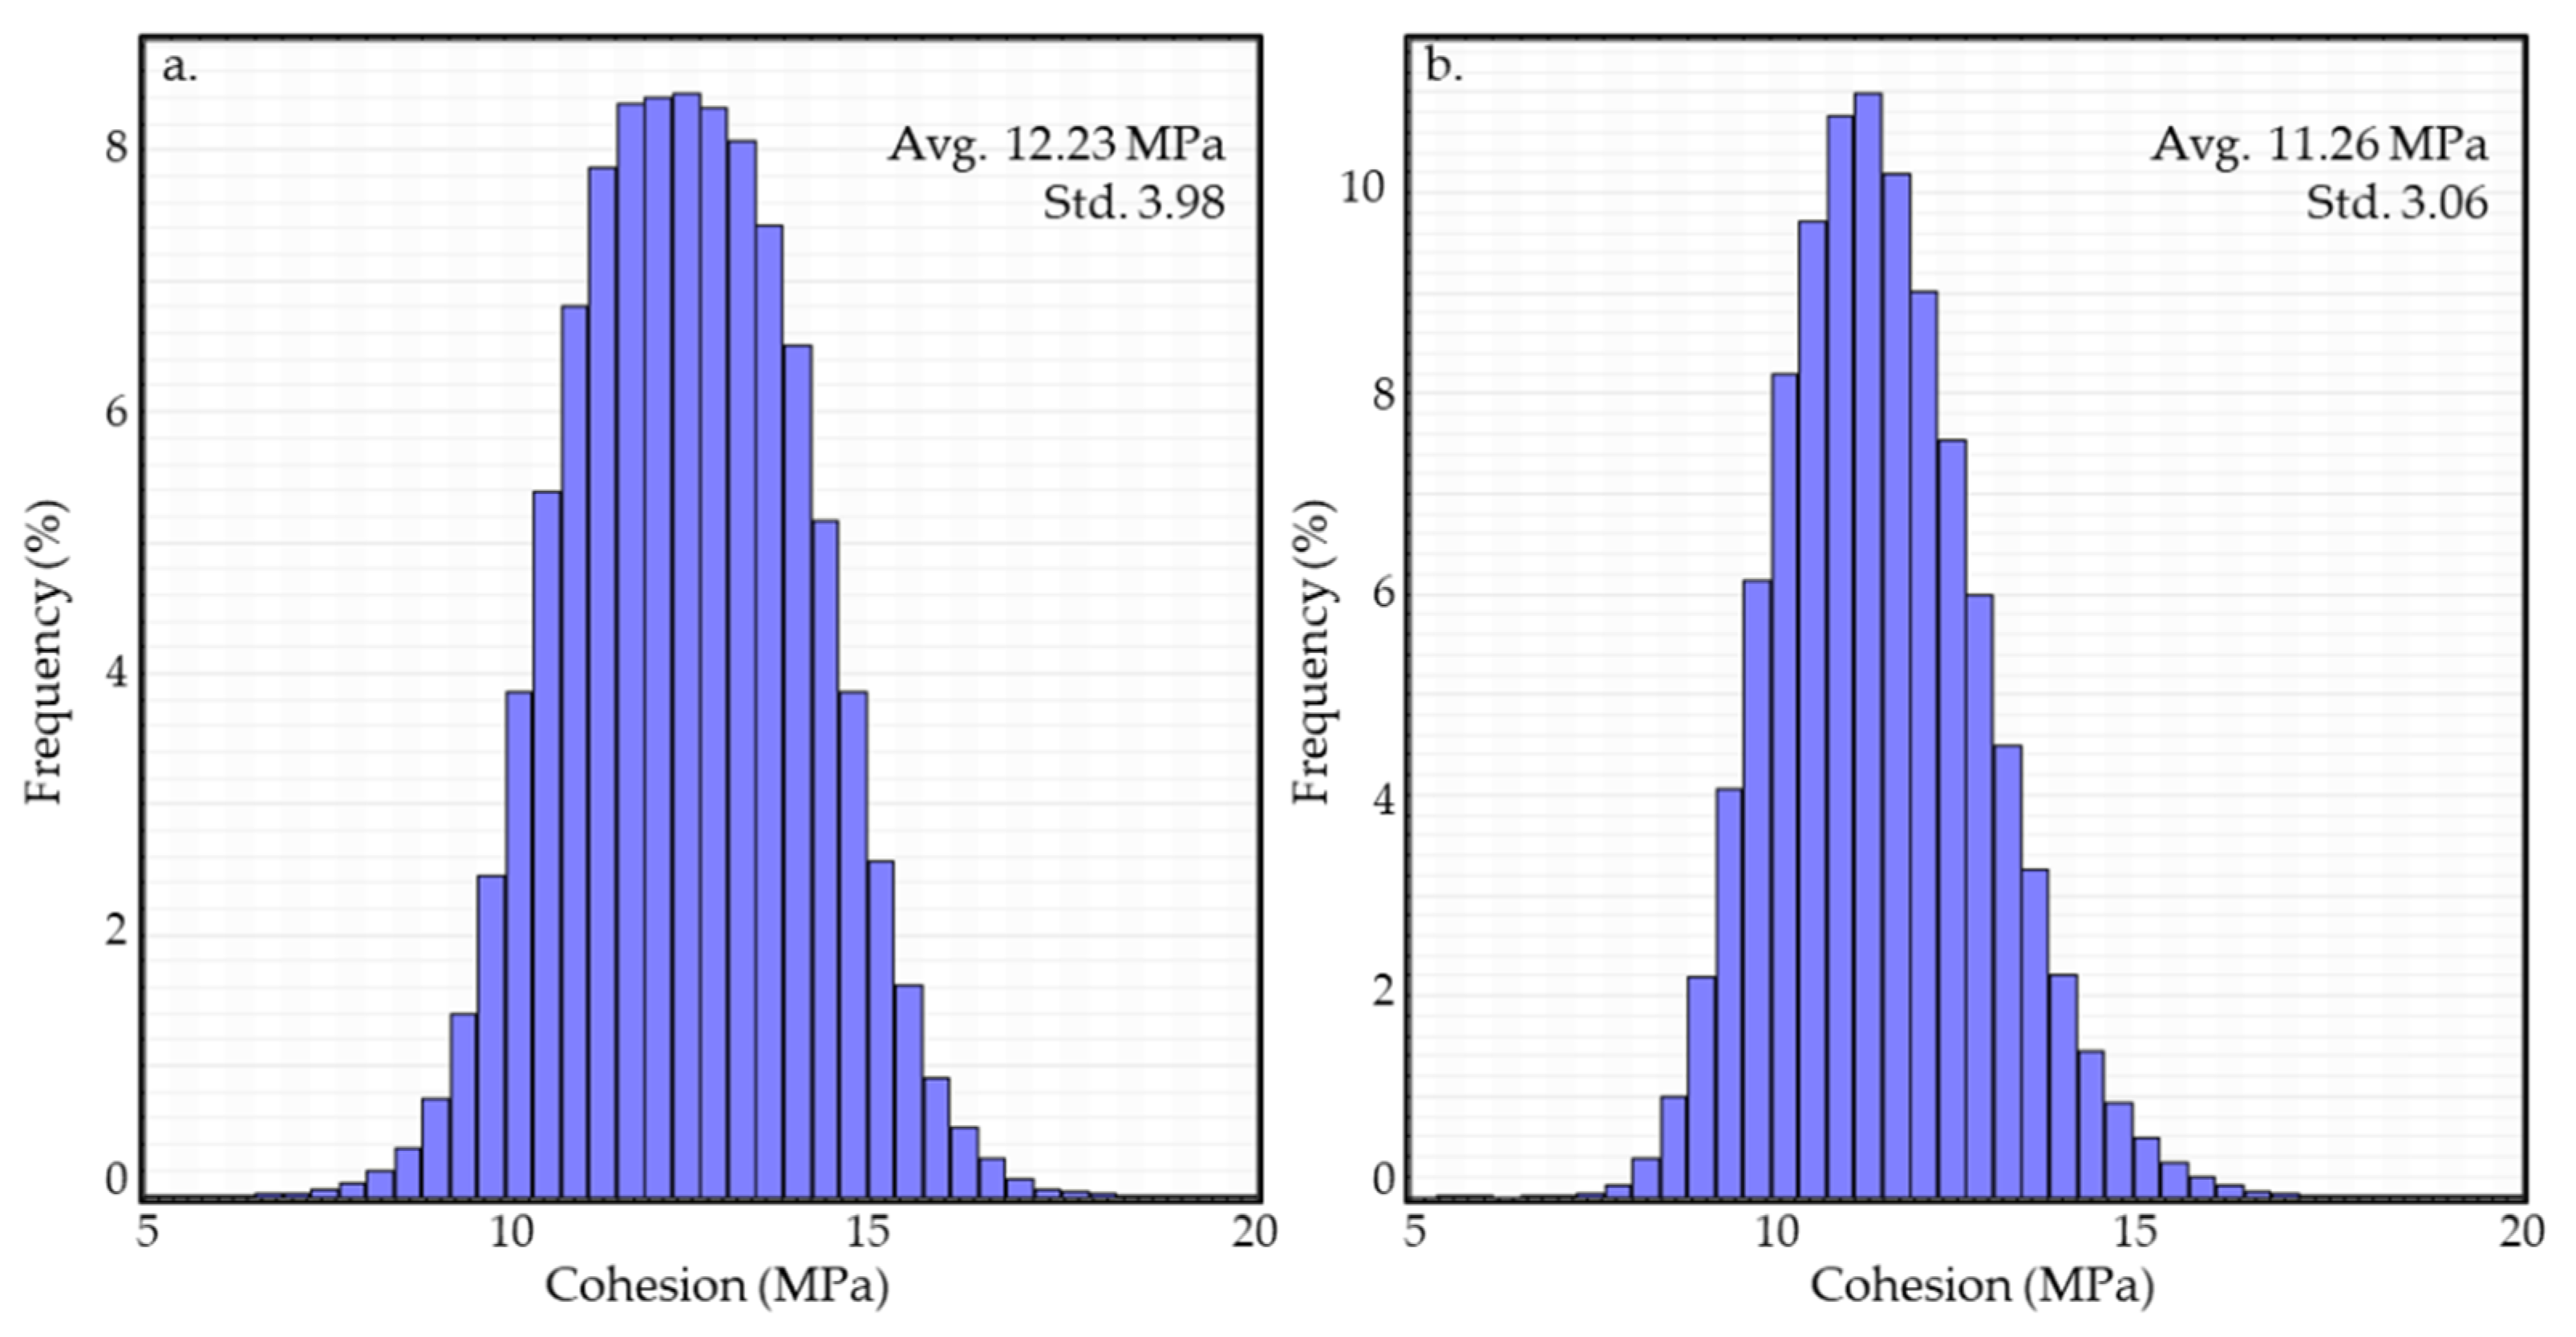
| Cohesion, upper Drake (S01,3,5) | 12.23 | MPa | 3.98 | Normal | Inversion cube |
| Cohesion, lower Drake (S02,4,6) | 11.26 | MPa | 3.06 | Normal | Inversion cube |
| Friction angle (ϕ1–6) | 21.63 | Degree | 2.33 | Normal | [58,59] |
| Model Scenarios | Factor of Safety | Probability of Failure | Reliability Index |
|---|---|---|---|
| Case-1 (UD) | 2.57 | 0.00 | 10.80 |
| Case-2 (LD) | 2.44 | 0.00 | 11.08 |
| Case-3 (UD) | 2.40 | 0.00 | 9.72 |
| Case-4 (LD) | 2.27 | 0.00 | 10.00 |
| Case-5 (UD) | 1.00 | 1.10 × 10⁻² | 2.29 |
| Case-6 (LD) | 1.00 | 2.52 × 10⁻⁴ | 3.48 |
| Model Scenarios | Tensile Stress Cut-Off | Probability of Failure | Reliability Index |
|---|---|---|---|
| Case-5 (UD) | 0 | 9.99 × 10⁻¹ | −3.89 |
| 6.115 | 2.39 × 10⁻¹ | 0.71 | |
| Case-6 (LD) | 0 | 9.98 × 10⁻¹ | −2.9 |
| 5.13 | 1.70 × 10⁻¹ | 0.95 |
| Expected Performance Level | Probability of Unsatisfactory Performance | Reliability Index (β) | Proposed Safety Boundary |
|---|---|---|---|
| High | 0.0000003 | 5.0 | |
| Good | 0.00003 | 4.0 | Safe |
| Above average | 0.001 | 3.0 | Boundary |
| Below average | 0.006 | 2.5 | |
| Poor | 0.023 | 2.0 | |
| Unsatisfactory | 0.17 | 1.5 | Unsatisfactory |
| Hazardous | 0.16 | 1.0 |
Publisher’s Note: MDPI stays neutral with regard to jurisdictional claims in published maps and institutional affiliations. |
© 2022 by the authors. Licensee MDPI, Basel, Switzerland. This article is an open access article distributed under the terms and conditions of the Creative Commons Attribution (CC BY) license (https://creativecommons.org/licenses/by/4.0/).
Share and Cite
Rahman, M.J.; Fawad, M.; Mondol, N.H. Influence of Rock Properties on Structural Failure Probability—Caprock Shale Examples from the Horda Platform, Offshore Norway. Energies 2022, 15, 9598. https://doi.org/10.3390/en15249598
Rahman MJ, Fawad M, Mondol NH. Influence of Rock Properties on Structural Failure Probability—Caprock Shale Examples from the Horda Platform, Offshore Norway. Energies. 2022; 15(24):9598. https://doi.org/10.3390/en15249598
Chicago/Turabian StyleRahman, Md Jamilur, Manzar Fawad, and Nazmul Haque Mondol. 2022. "Influence of Rock Properties on Structural Failure Probability—Caprock Shale Examples from the Horda Platform, Offshore Norway" Energies 15, no. 24: 9598. https://doi.org/10.3390/en15249598
APA StyleRahman, M. J., Fawad, M., & Mondol, N. H. (2022). Influence of Rock Properties on Structural Failure Probability—Caprock Shale Examples from the Horda Platform, Offshore Norway. Energies, 15(24), 9598. https://doi.org/10.3390/en15249598