
Design and Analysis of an Offshore Wind Power to Ammonia Production System in Nova Scotia

 ,
,  ,
, 
 and
and 
Abstract
1. Introduction
2. Literature Review
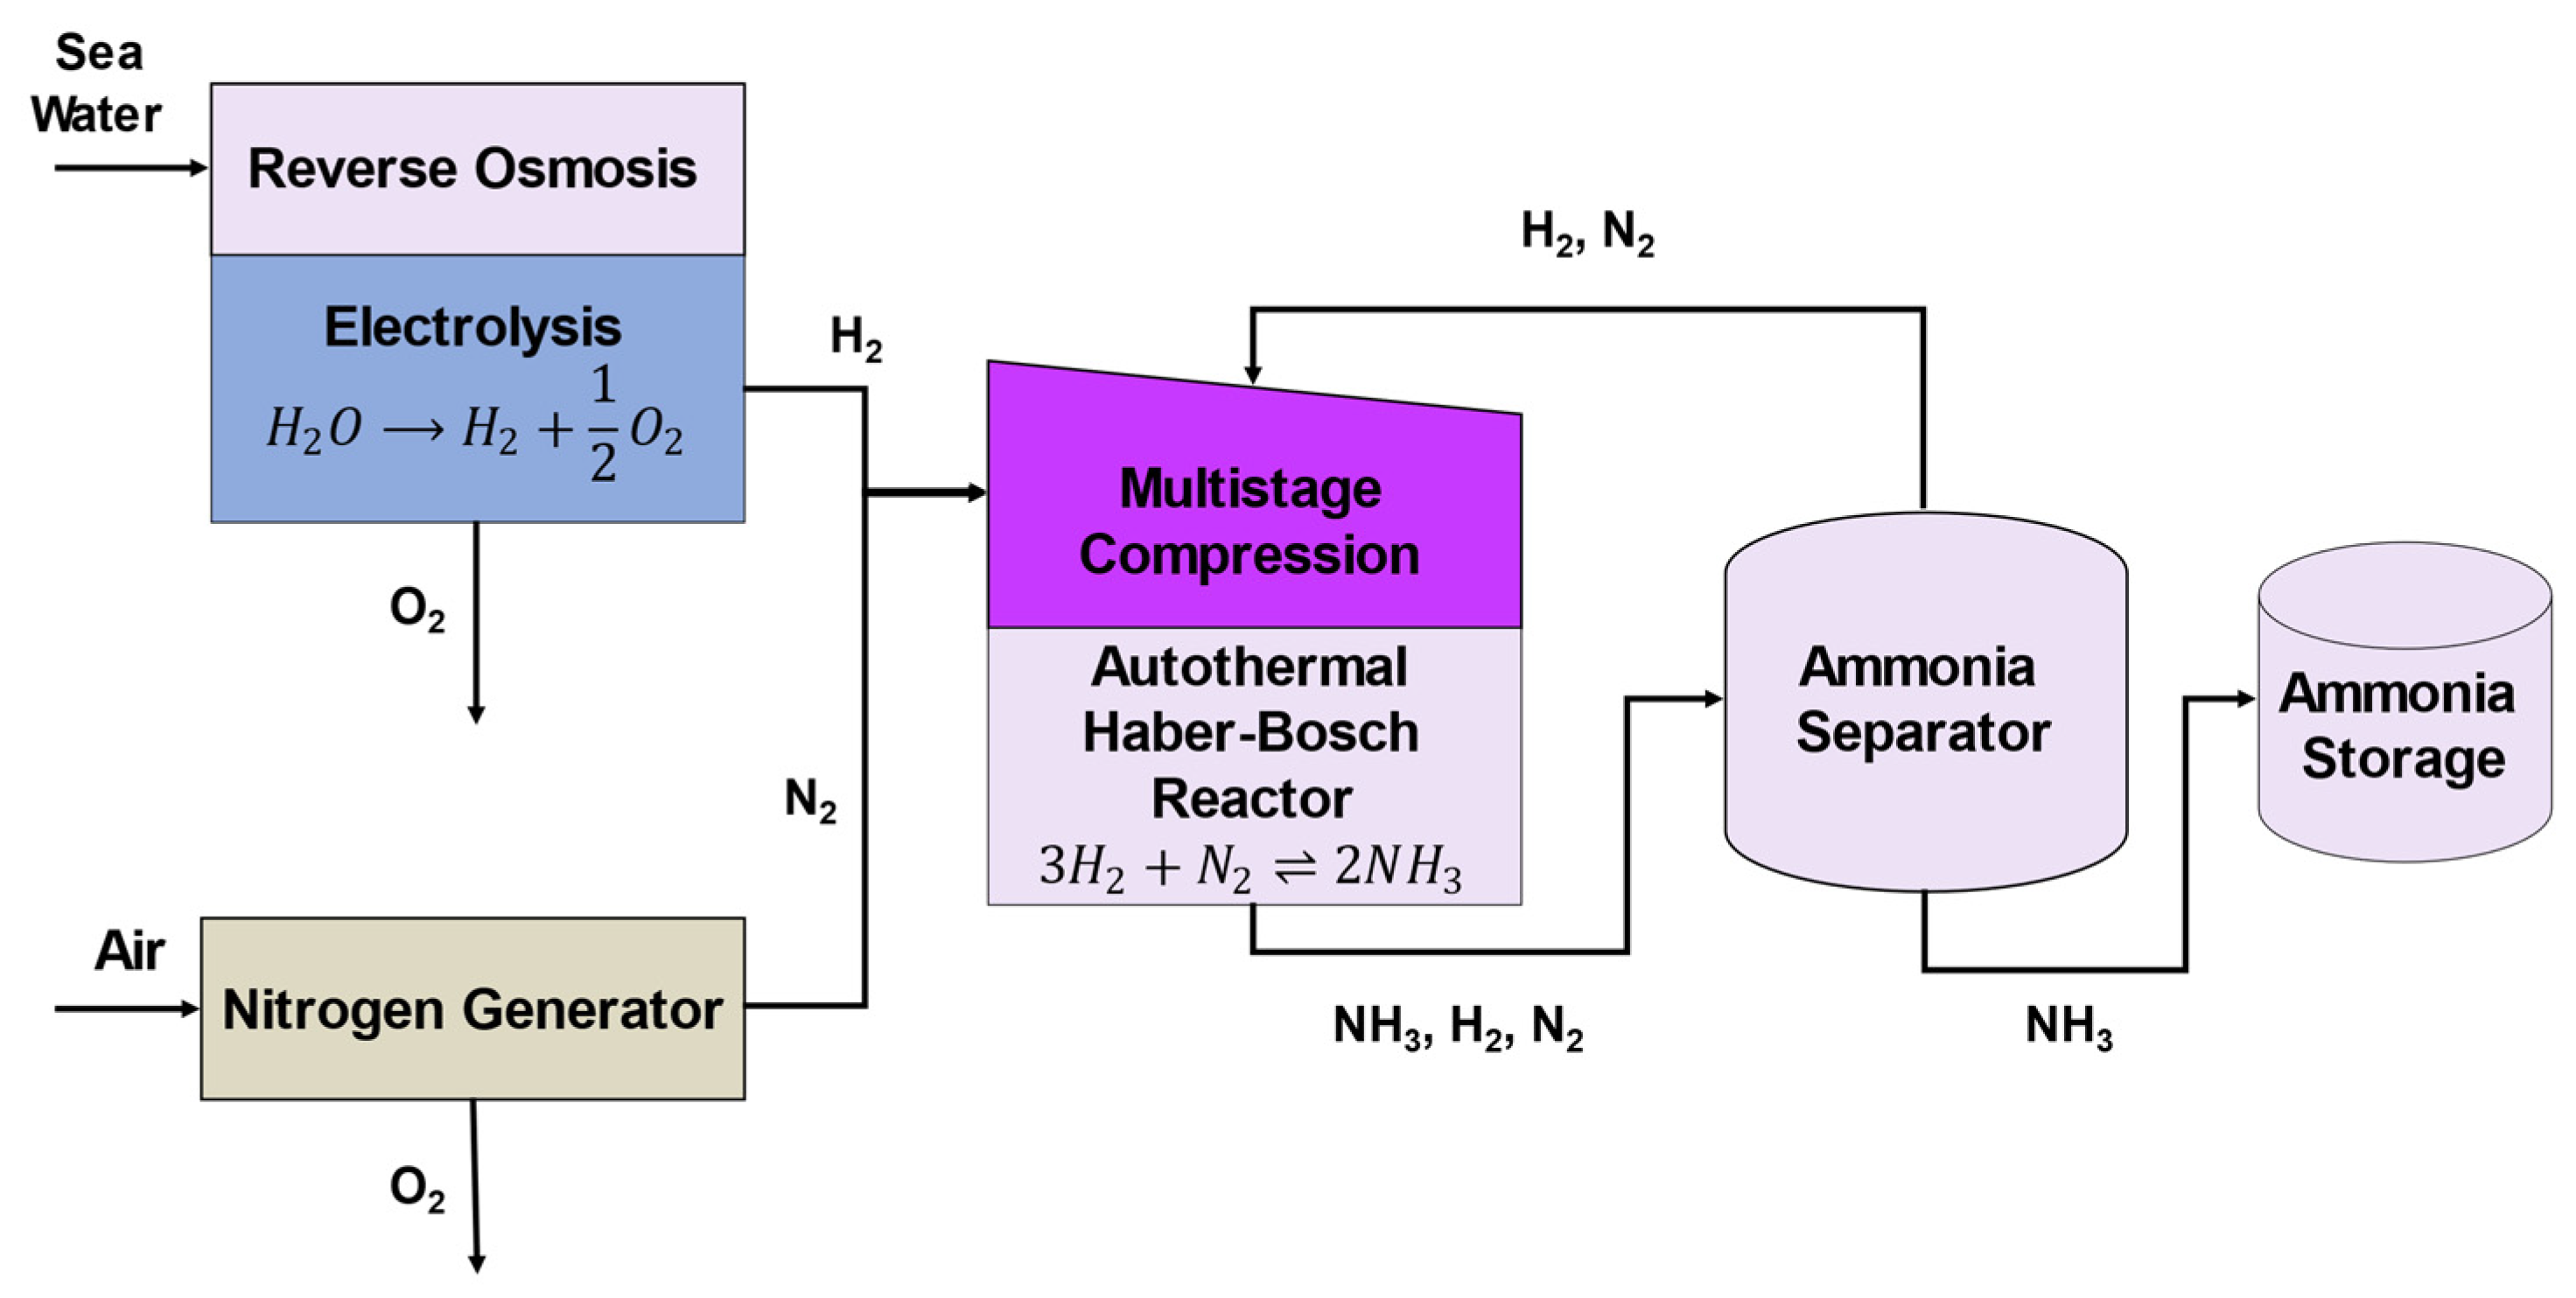
3. P2A System Design: Component Sizes and Operation Strategies
3.1. Electricity Input
3.2. P2A Components
3.2.1. RO and Electrolyzer
3.2.2. Nitrogen Generation
3.2.3. Multi-Stage Compression
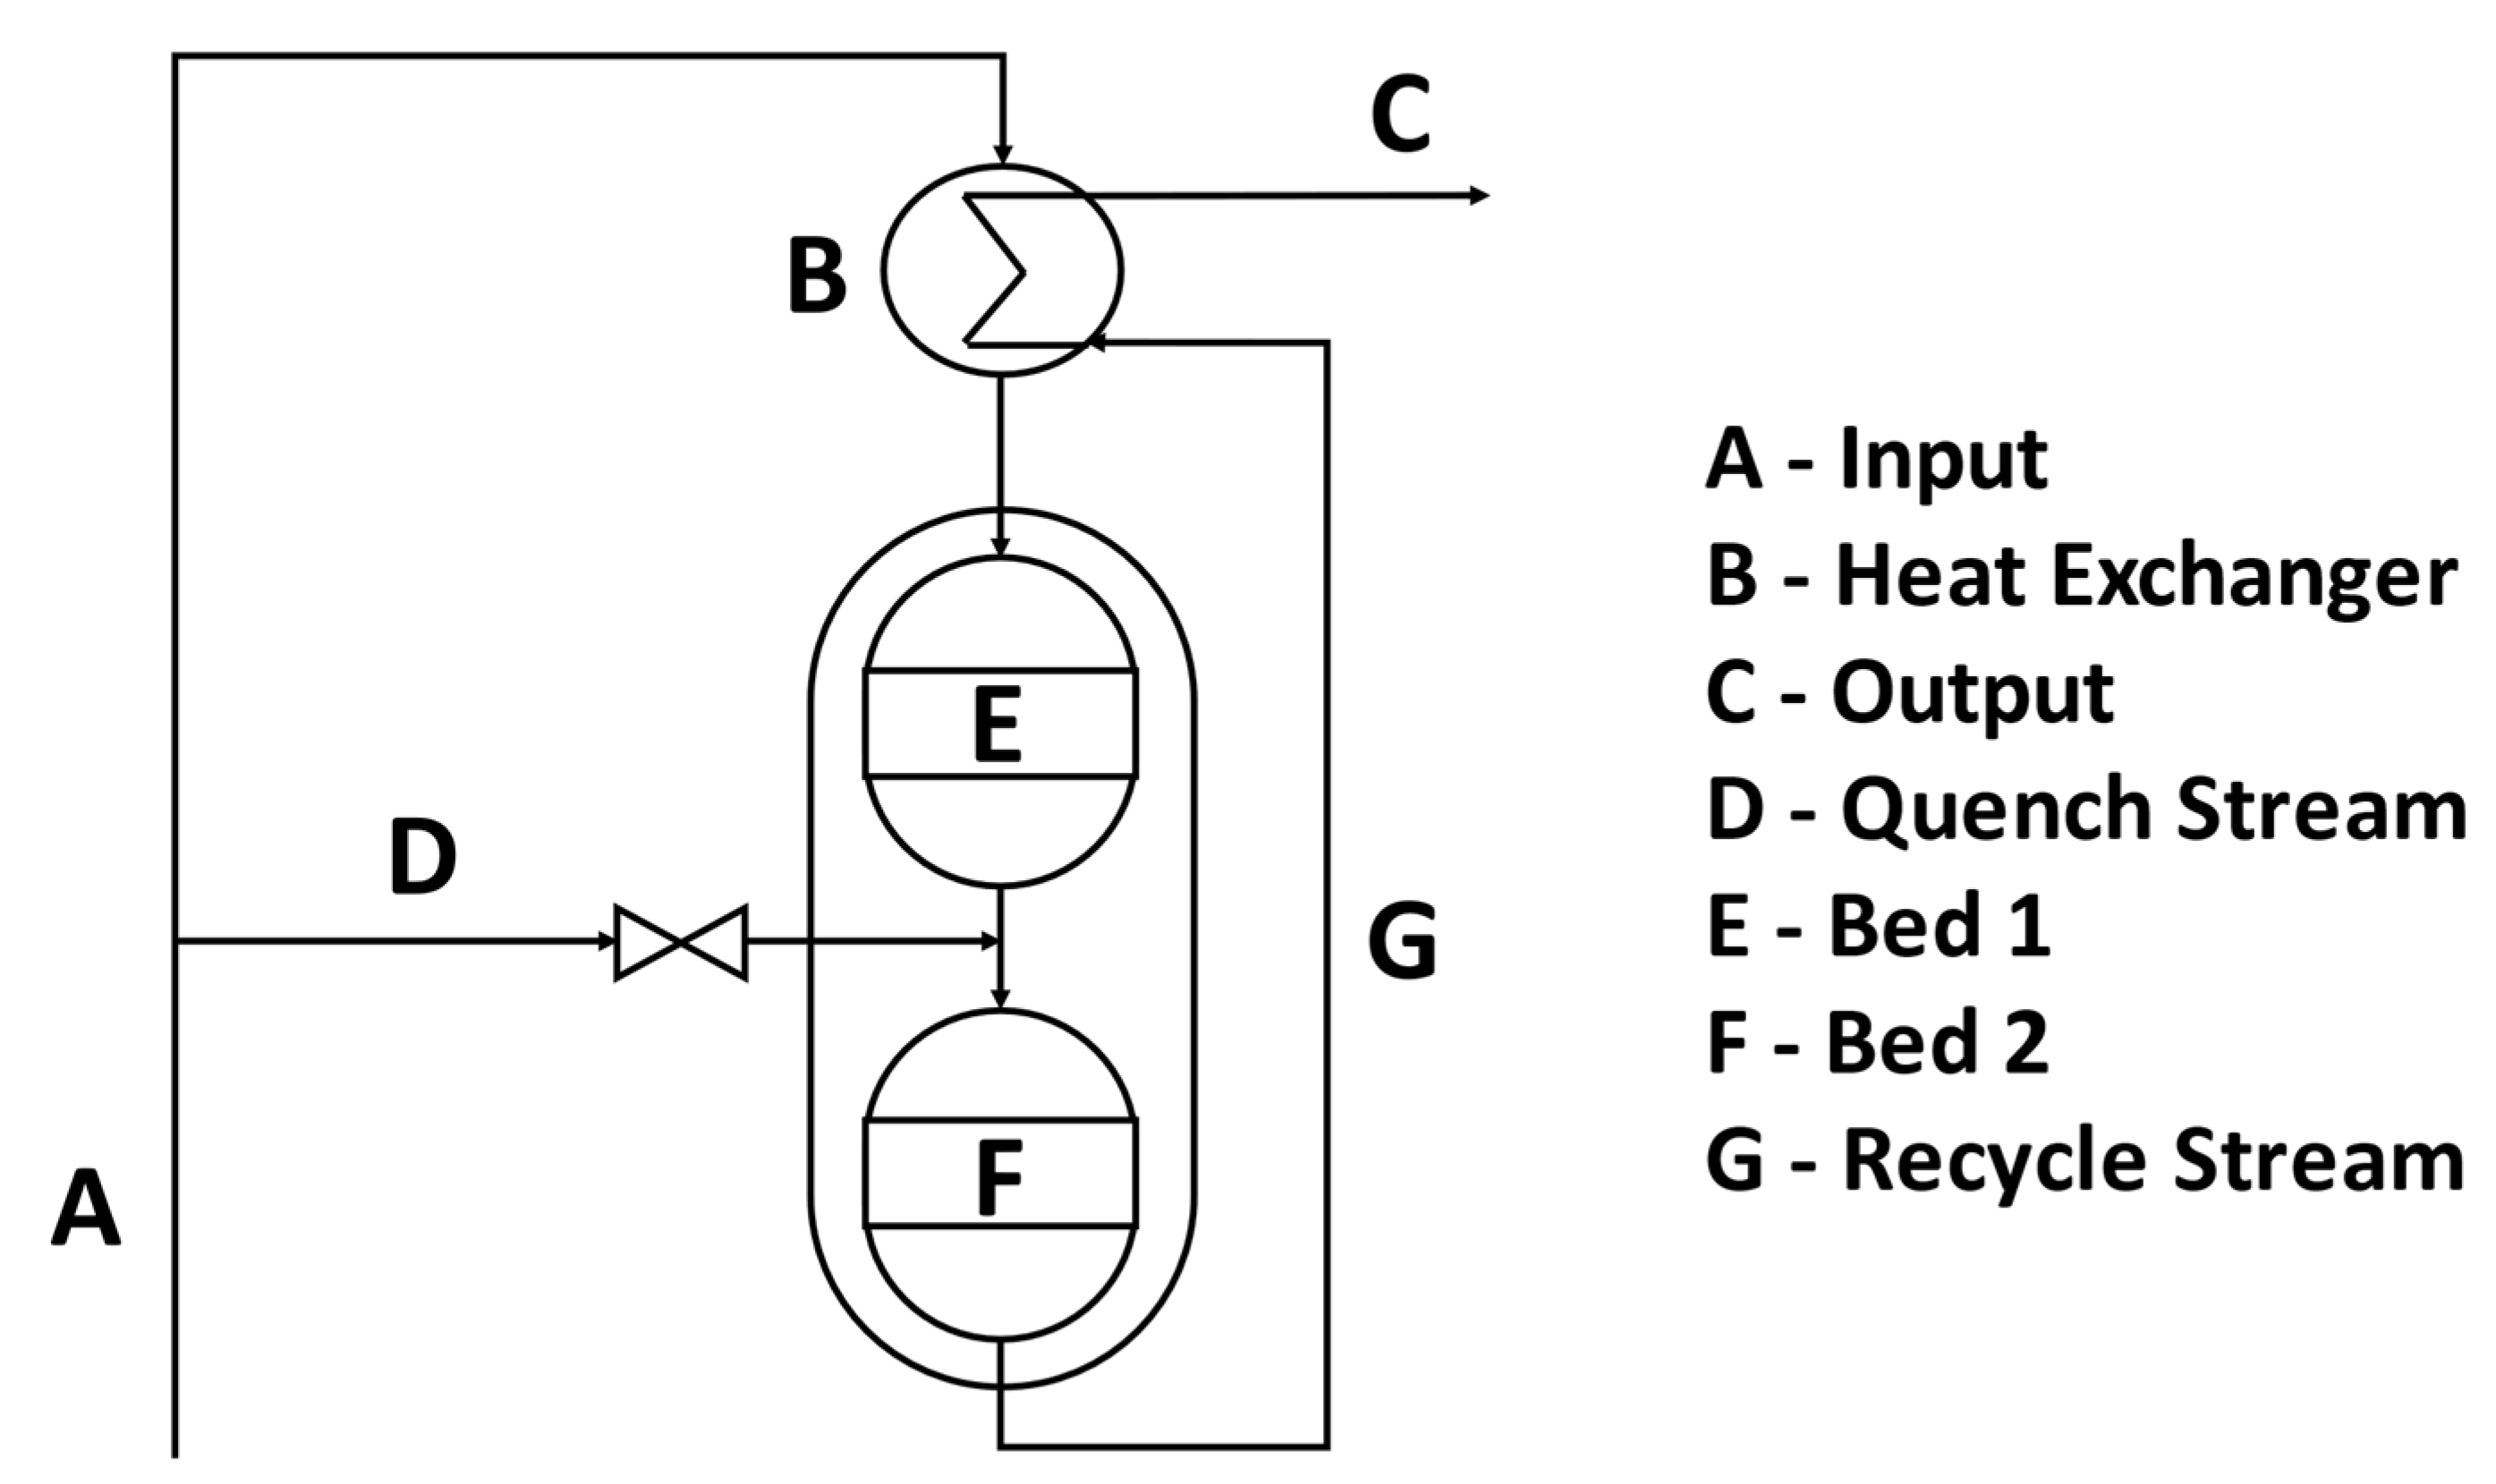
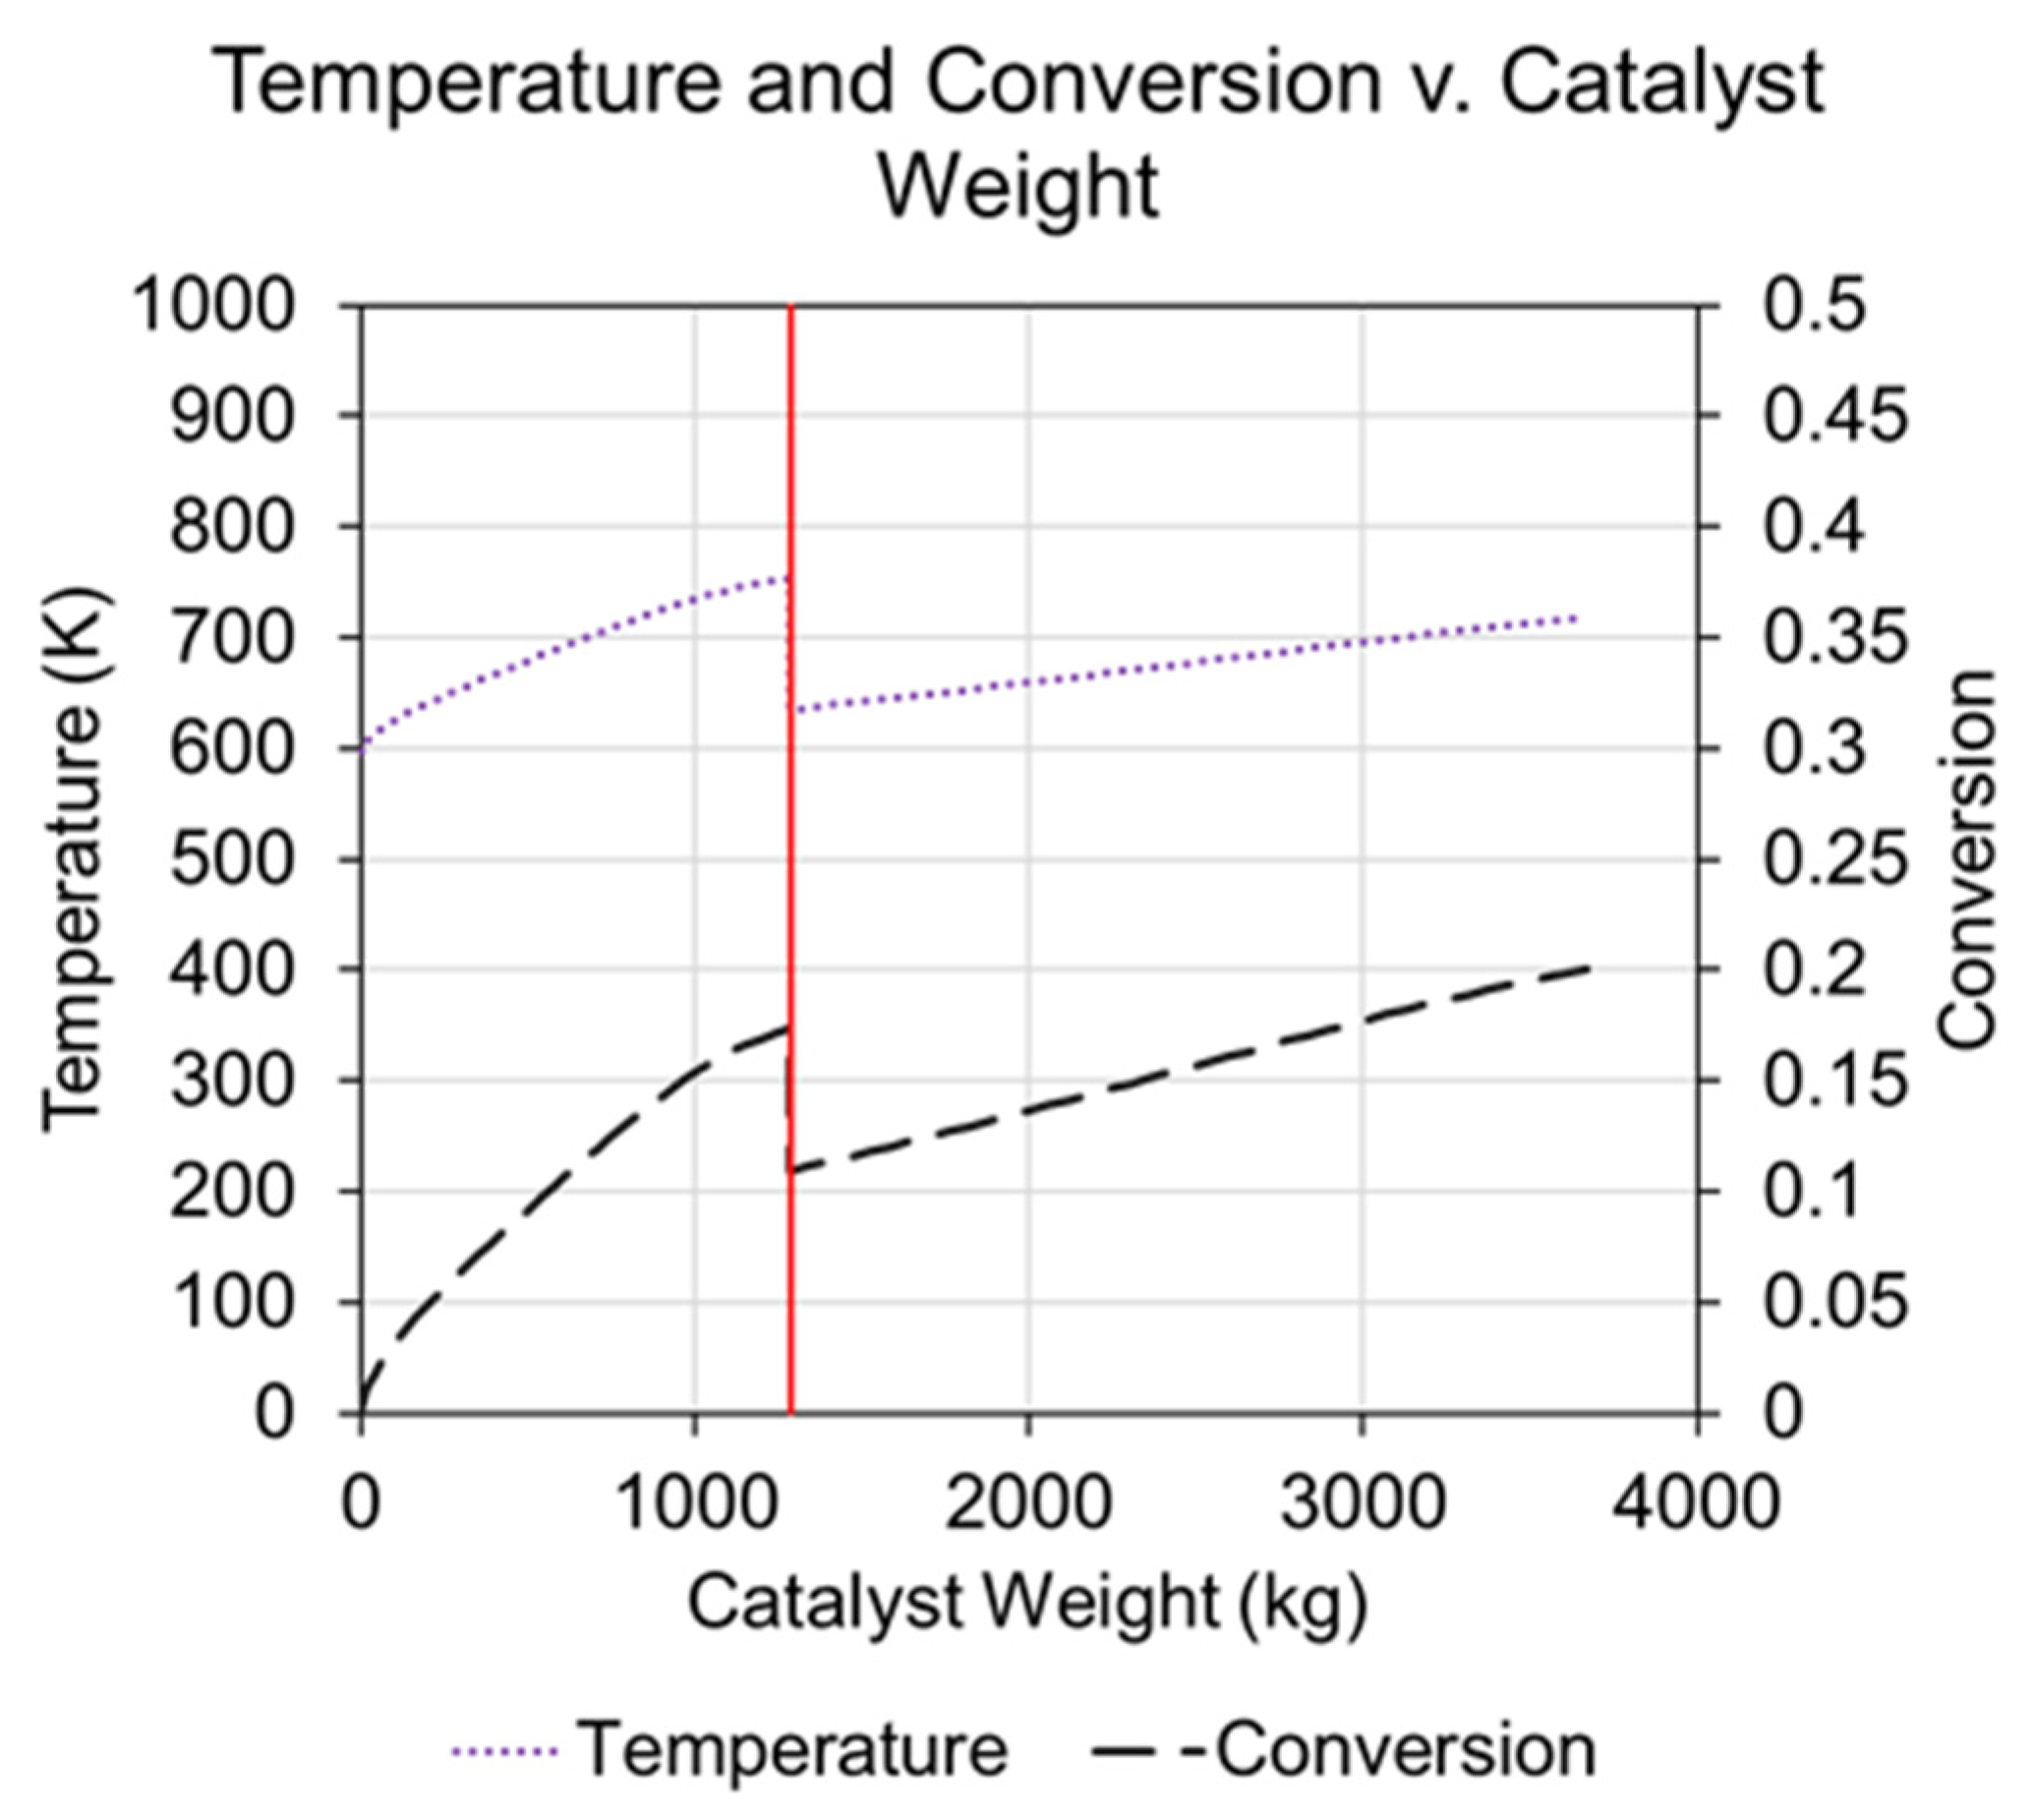
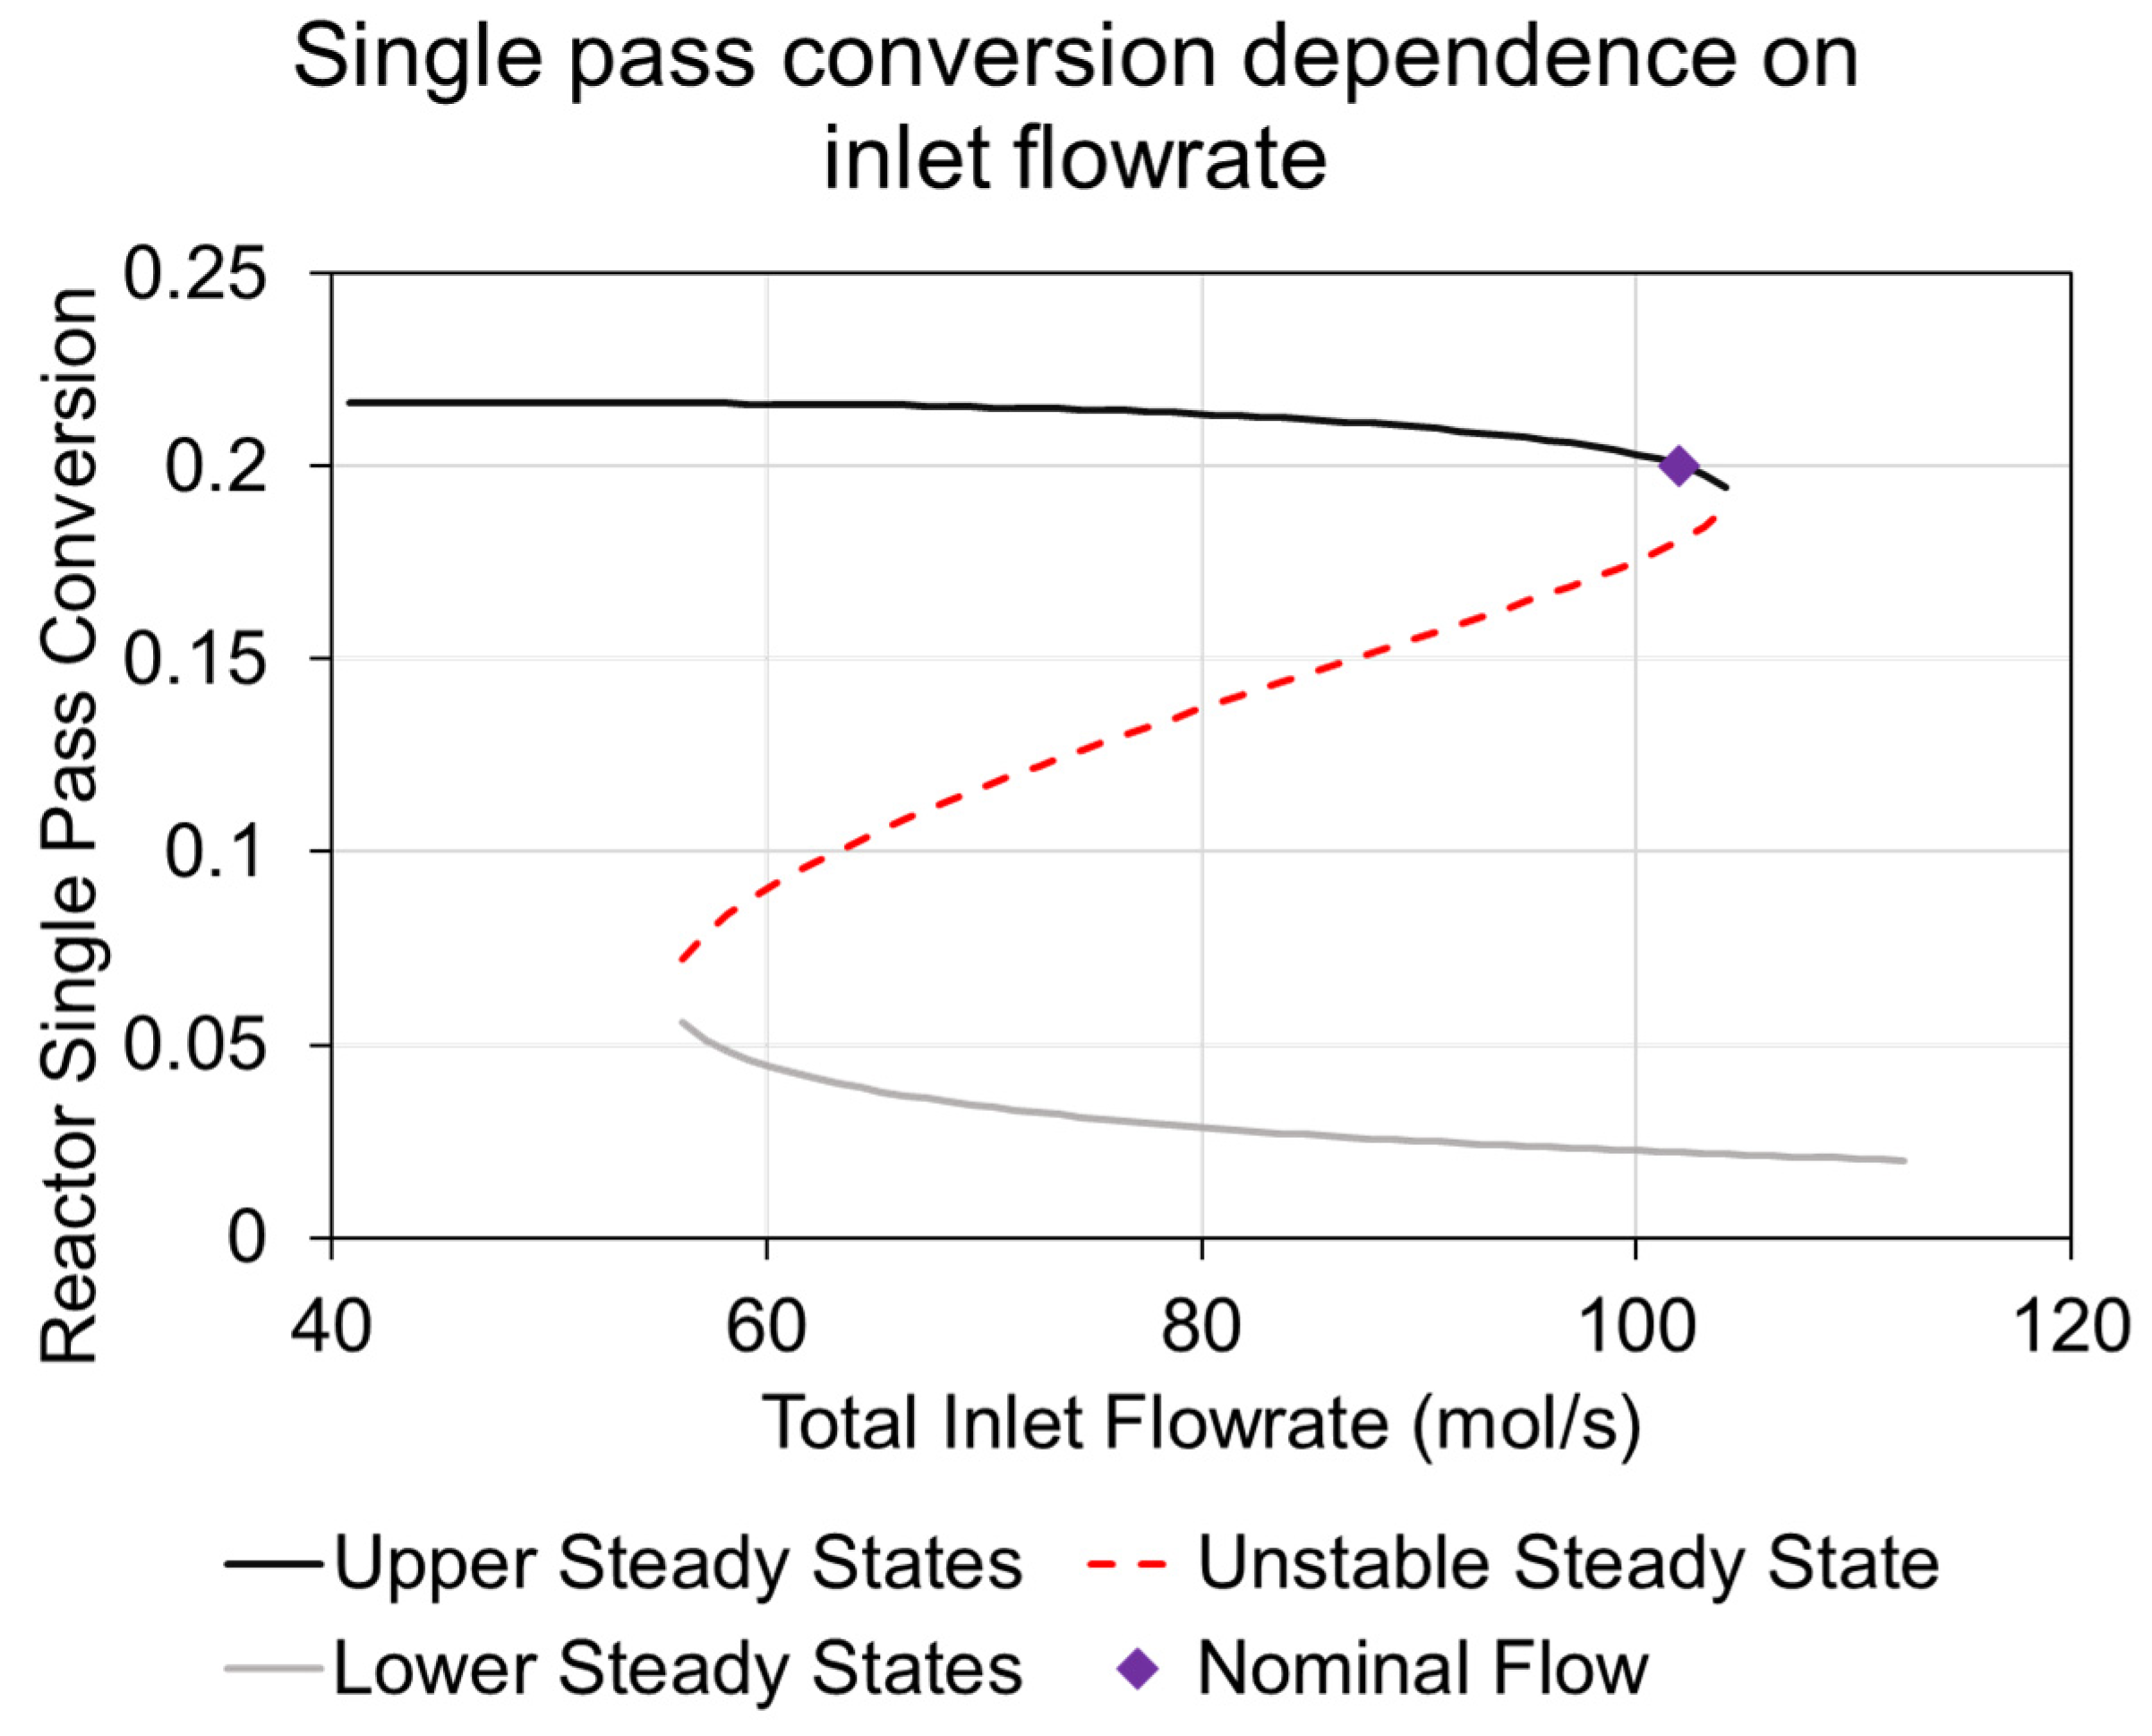
3.2.4. Ammonia Reactor
3.2.5. Ammonia Separation and Storage
3.2.6. Other Miscellaneous Items
3.3. System Operation Strategy
3.4. Energy Consumption
3.5. Methodology for Economic Calculations
3.5.1. Cost Estimation
3.5.2. Levelized Cost
4. Results and Discussions
4.1. Wind Power Generation
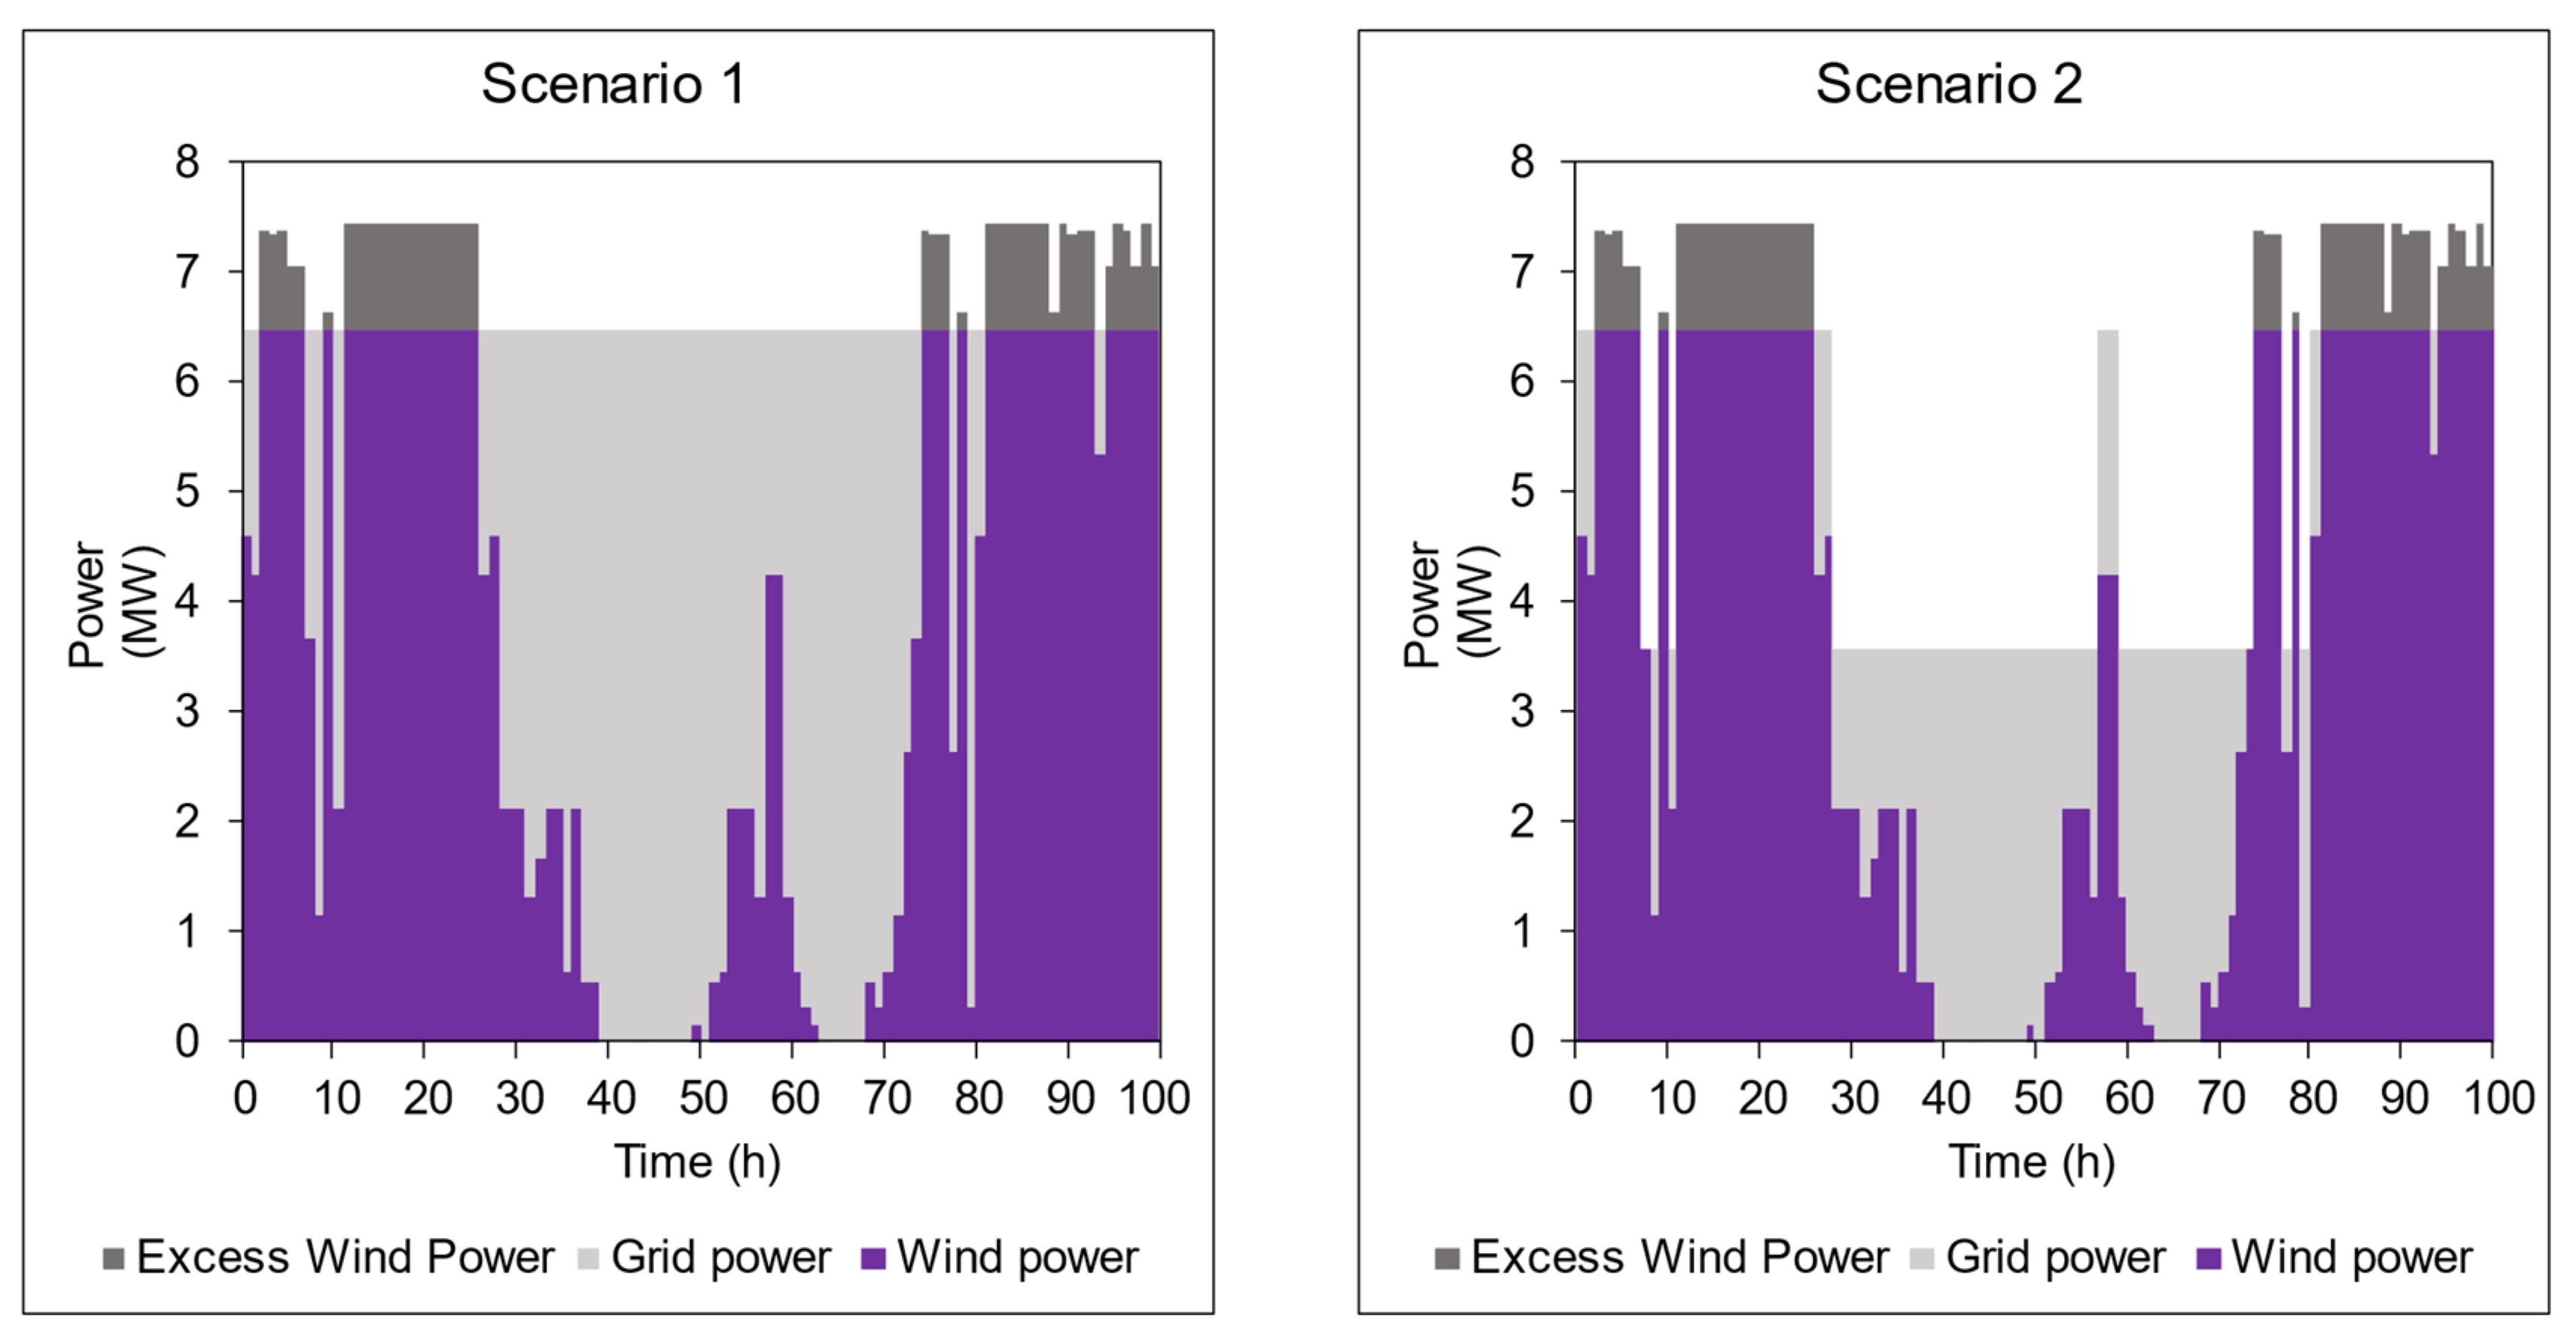
4.2. Grid Connection Scenarios
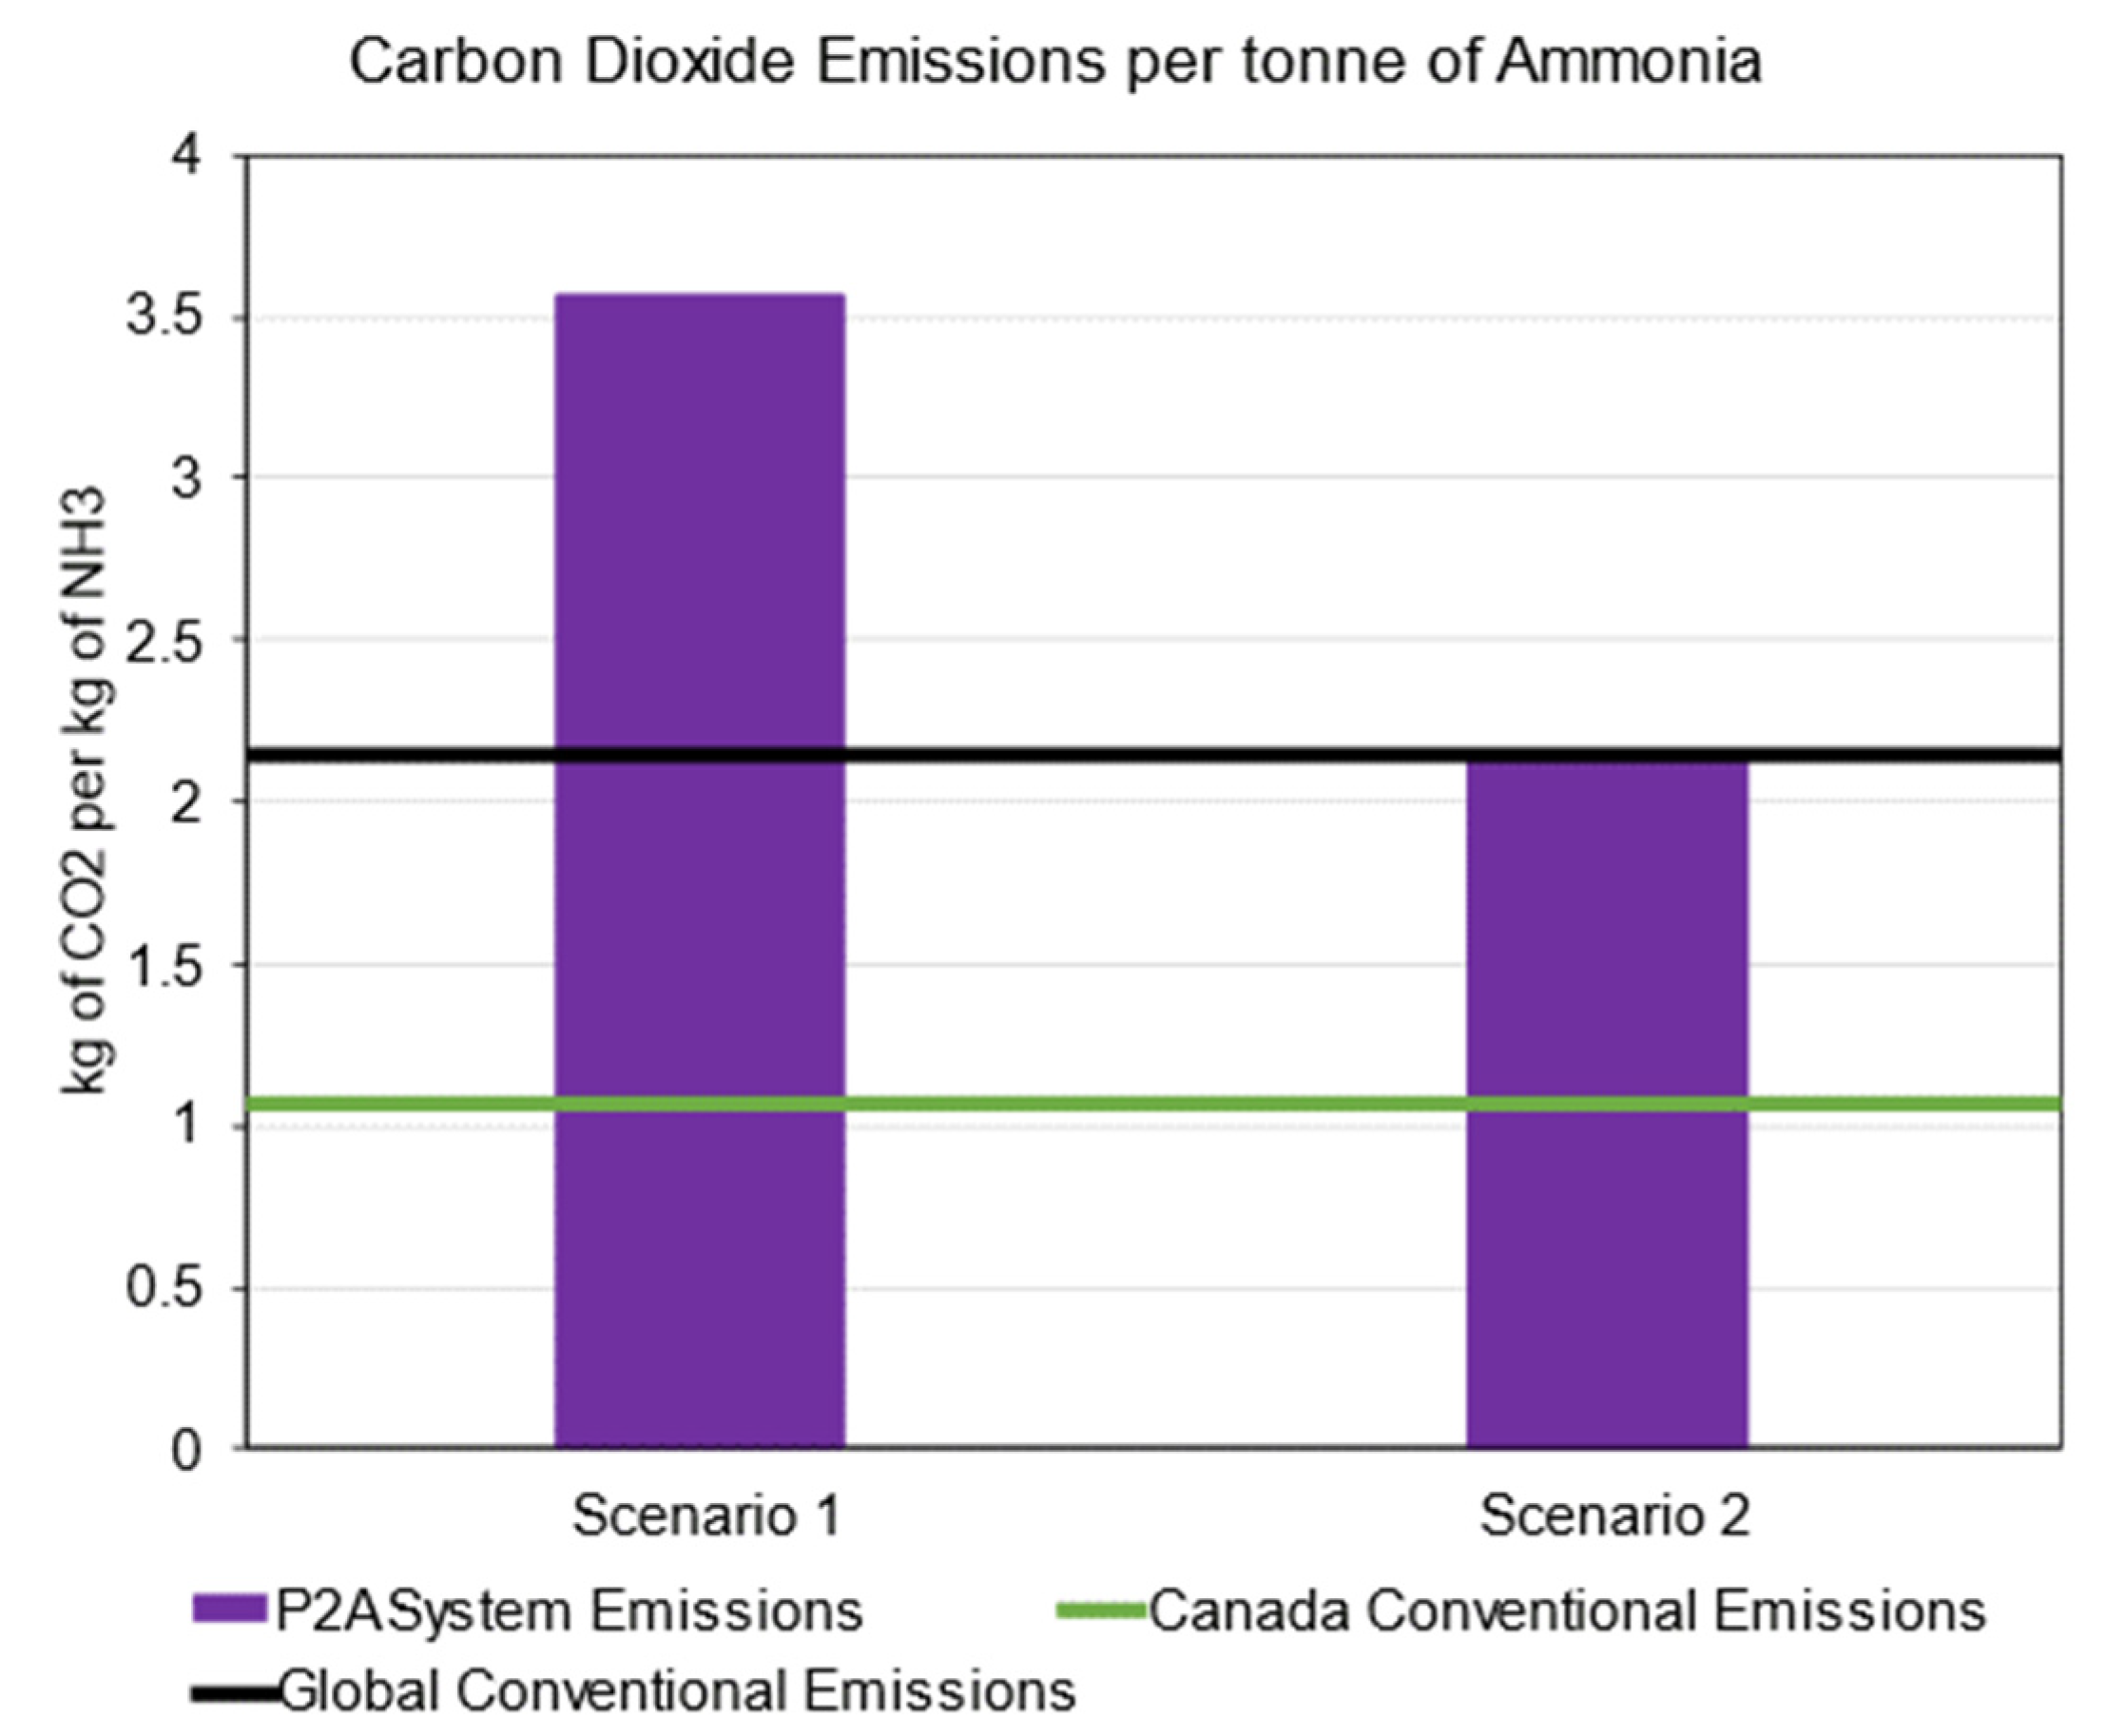
4.3. Emissions
4.4. Economics
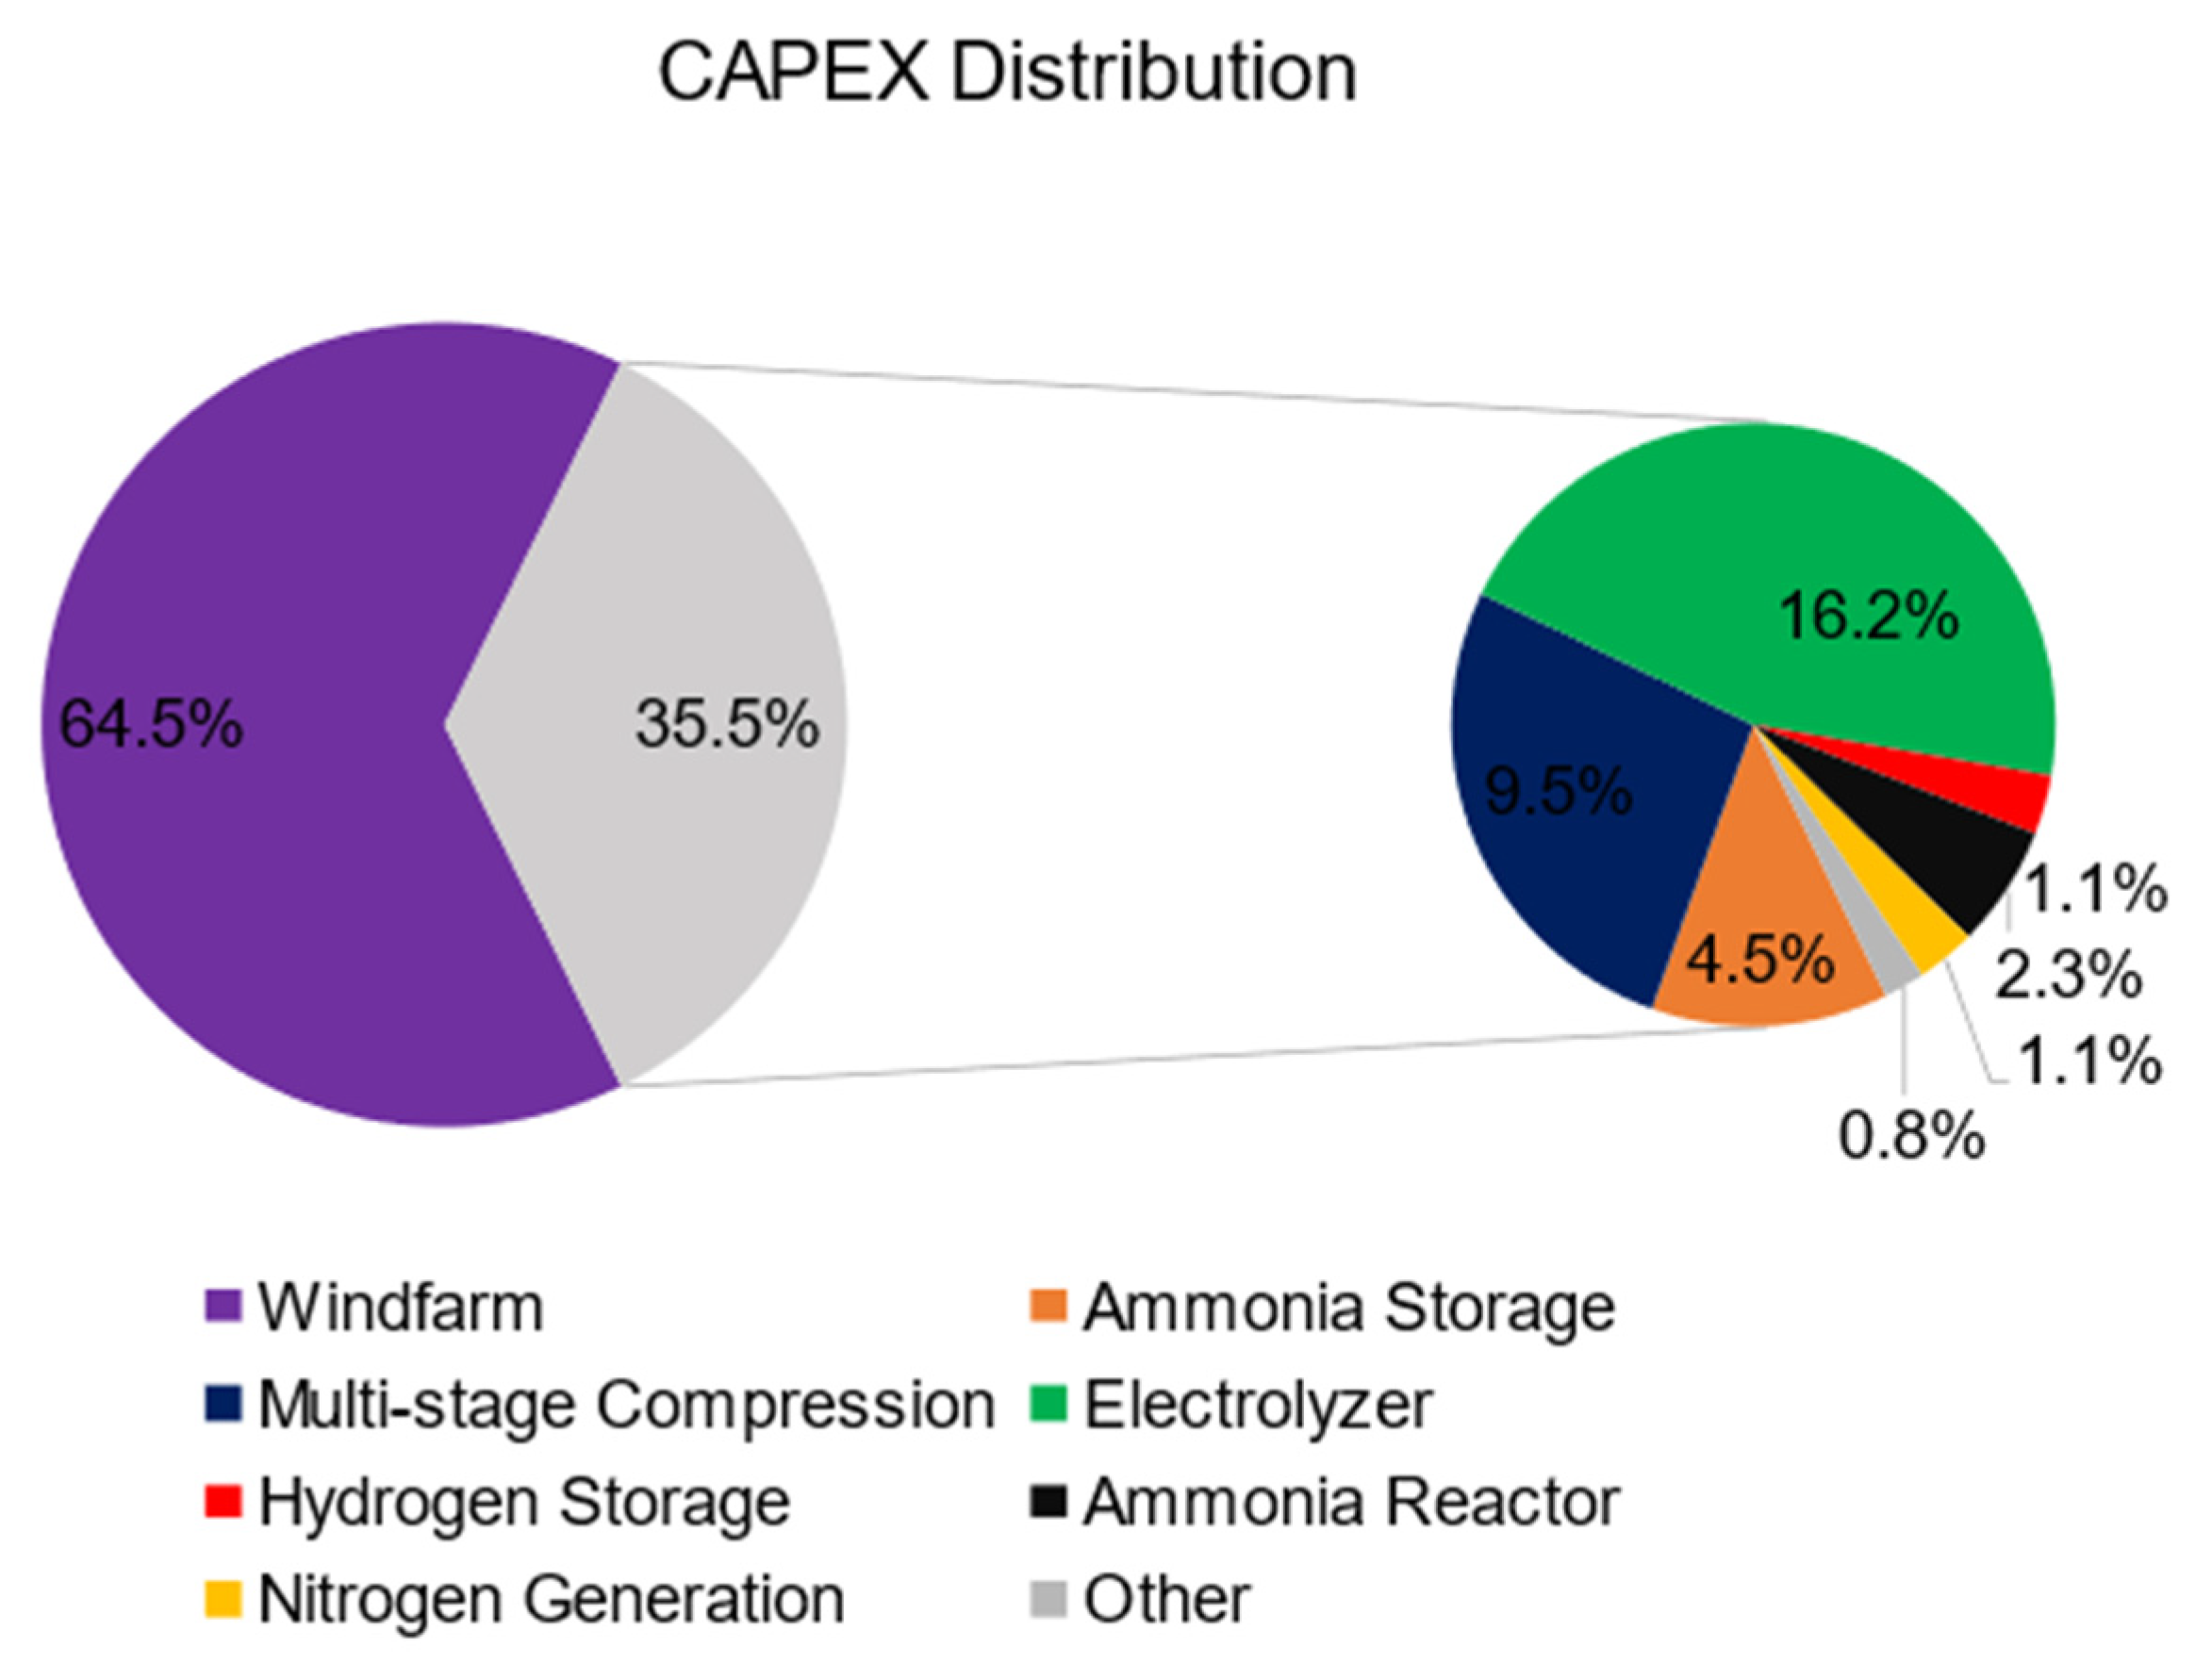
4.4.1. Capital Costs
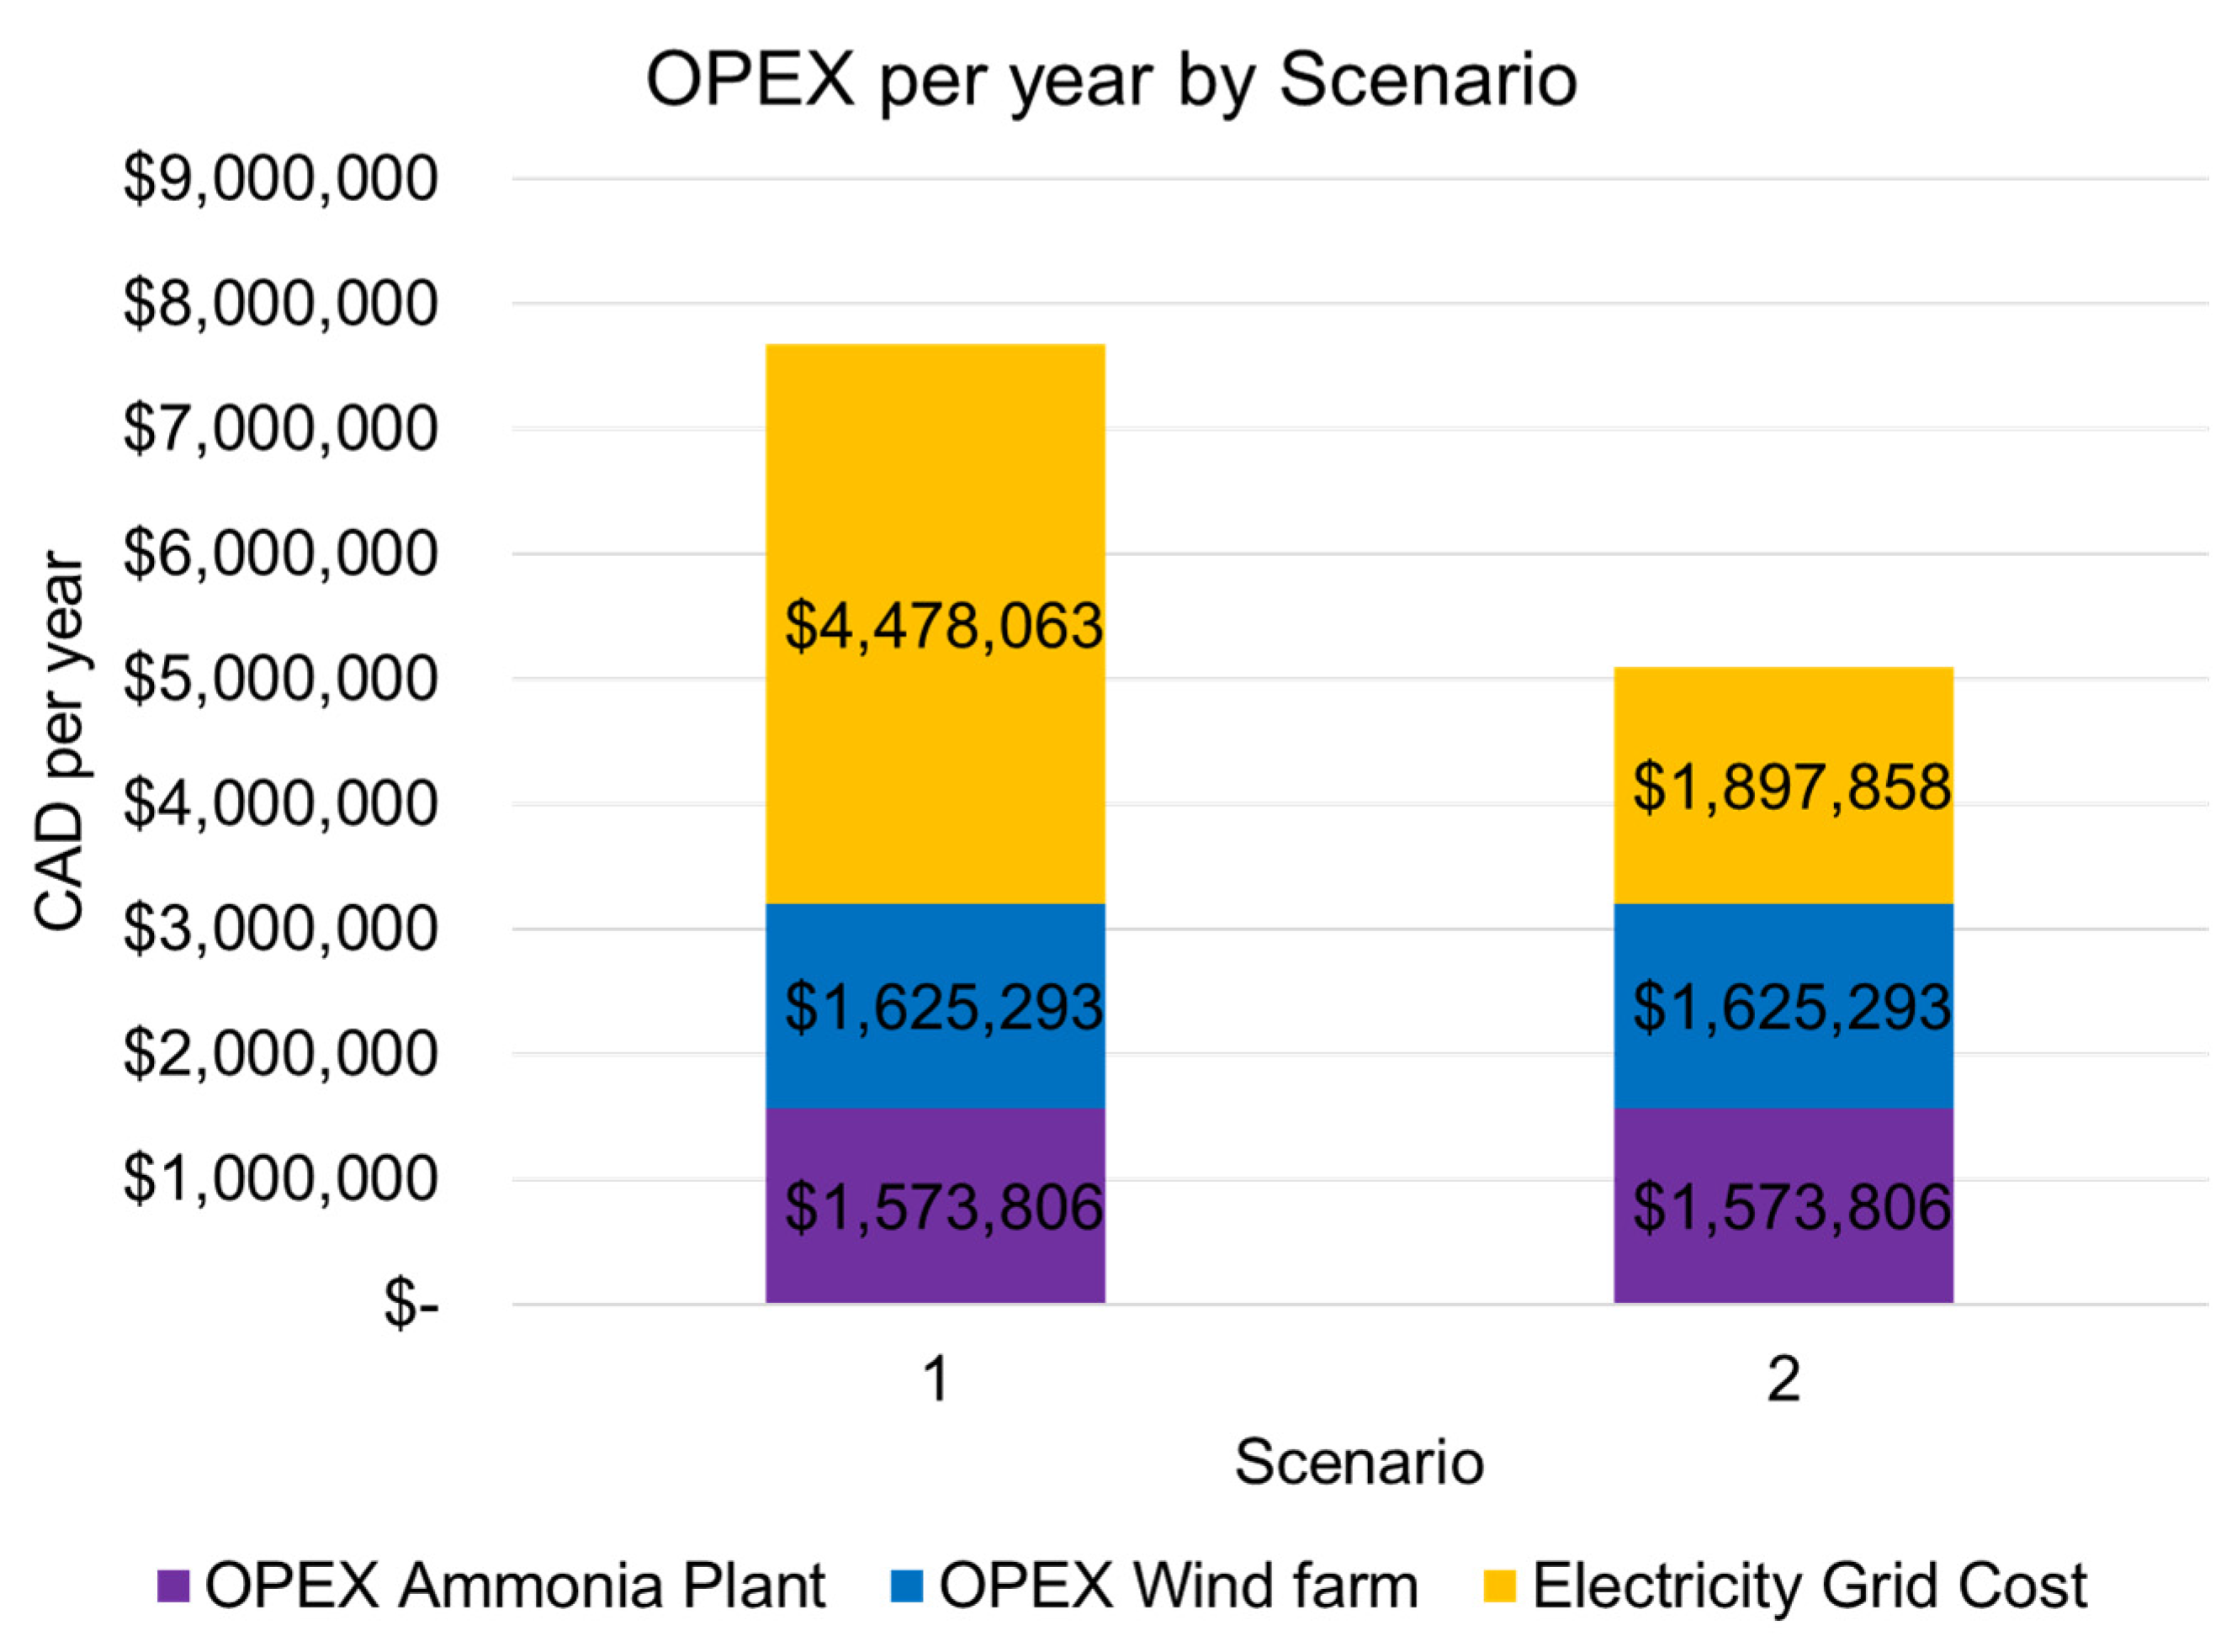
4.4.2. Operational Costs
4.4.3. Levelized Cost of Ammonia
5. Conclusions and Recommendations
Supplementary Materials
Author Contributions
Funding
Data Availability Statement
Acknowledgments
Conflicts of Interest
Nomenclature
| Variable | Description |
| Specific heat capacity, J mol−1 K−1 | |
| Activation energy, J mol−1 | |
| Fugacity, atm | |
| Molar flow rate, mol s−1 | |
| Fugacity equilibrium constant, atm−1 | |
| Arrhenius pre-exponential factor, atm0.5 s−1 | |
| Reaction rate constant, atm0.5 s−1 | |
| Catalyst mass, kg | |
| Pressure, bar or atm | |
| Catalyst mass-based rate of reaction, mol s−1 kg−1 | |
| Temperature, °C or K | |
| Reactor Volume, m3 | |
| Mole fraction in the gas phase | |
| Heat of reaction, J mol−1 |
References
- Ghavam, S.; Vahdati, M.; Wilson, I.A.G.; Styring, P. Sustainable Ammonia Production Processes. Front. Energy Res. 2021, 9, 580808. [Google Scholar] [CrossRef]
- Ammonia: Zero-Carbon Fertiliser, Fuel and Energy Store; Royal Society: London, UK, 2020; ISBN 978-1-78252-448-9.
- Iqbal Cheema, I.; Krewer, U. Operating envelope of Haber–Bosch process design for power-to-ammonia. RSC Adv. 2018, 8, 34926–34936. [Google Scholar] [CrossRef]
- Humphreys, J.; Lan, R.; Tao, S. Development and Recent Progress on Ammonia Synthesis Catalysts for Haber–Bosch Process. Adv. Energy Sustain. Res. 2021, 2, 2000043. [Google Scholar] [CrossRef]
- Smith, C.; Hill, A.K.; Torrente-Murciano, L. Current and future role of Haber–Bosch ammonia in a carbon-free energy landscape. Energy Environ. Sci. 2020, 13, 331–344. [Google Scholar] [CrossRef]
- Yüzbaşıoğlu, A.E.; Tatarhan, A.H.; Gezerman, A.O. Decarbonization in ammonia production, new technological methods in industrial scale ammonia production and critical evaluations. Heliyon 2021, 7, e08257. [Google Scholar] [CrossRef]
- EverWind Secures Offtake from Key German Partner|Uniper. Available online: https://www.uniper.energy/news/everwind-secures-offtake-from-key-german-partner-uniper-for-canadas-first-green-hydrogen-hub-in-nova-scotia (accessed on 15 November 2022).
- Lan, R.; Tao, S. Ammonia as a Suitable Fuel for Fuel Cells. Front. Energy Res. 2014, 2, 35. [Google Scholar] [CrossRef]
- Salmon, N.; Bañares-Alcántara, R. Green ammonia as a spatial energy vector: A review. Sustain. Energy Fuels 2021, 5, 2814–2839. [Google Scholar] [CrossRef]
- Cunanan, C.; Tran, M.-K.; Lee, Y.; Kwok, S.; Leung, V.; Fowler, M. A Review of Heavy-Duty Vehicle Powertrain Technologies: Diesel Engine Vehicles, Battery Electric Vehicles, and Hydrogen Fuel Cell Electric Vehicles. Clean Technol. 2021, 3, 474–489. [Google Scholar] [CrossRef]
- Kakoulaki, G.; Kougias, I.; Taylor, N.; Dolci, F.; Moya, J.; Jäger-Waldau, A. Green hydrogen in Europe—A regional assessment: Substituting existing production with electrolysis powered by renewables. Energy Convers. Manag. 2021, 228, 113649. [Google Scholar] [CrossRef]
- Jain, M.; Muthalathu, R.; Wu, X.-Y. Electrified ammonia production as a commodity and energy storage medium to connect the food, energy, and trade sectors. iScience 2022, 25, 104724. [Google Scholar] [CrossRef]
- Dong, C.; Huang, G.; Cheng, G. Offshore wind can power Canada. Energy 2021, 236, 121422. [Google Scholar] [CrossRef]
- Canada, N.R. Offshore Renewable Energy Regulations Initiative. Available online: https://www.nrcan.gc.ca/transparency/acts-and-regulations/forward-regulatory-plan/offshore-renewable-energy-regulations-initiative/23042 (accessed on 14 September 2022).
- Wang, H.; Daoutidis, P.; Zhang, Q. Harnessing the Wind Power of the Ocean with Green Offshore Ammonia. ACS Sustain. Chem. Eng. 2021, 9, 14605–14617. [Google Scholar] [CrossRef]
- Morgan, E.R.; Manwell, J.F.; McGowan, J.G. Sustainable Ammonia Production from U.S. Offshore Wind Farms: A Techno-Economic Review. ACS Sustain. Chem. Eng. 2017, 5, 9554–9567. [Google Scholar] [CrossRef]
- Salmon, N.; Bañares-Alcántara, R. A global, spatially granular techno-economic analysis of offshore green ammonia production. J. Clean. Prod. 2022, 367, 133045. [Google Scholar] [CrossRef]
- Lu, H.; Lin, B.-L.; Campbell, D.E.; Wang, Y.; Duan, W.; Han, T.; Wang, J.; Ren, H. Australia-Japan telecoupling of wind power-based green ammonia for passenger transportation: Efficiency, impacts, and sustainability. Renew. Sustain. Energy Rev. 2022, 168, 112884. [Google Scholar] [CrossRef]
- Verleysen, K.; Coppitters, D.; Parente, A.; De Paepe, W.; Contino, F. How can power-to-ammonia be robust? Optimization of an ammonia synthesis plant powered by a wind turbine considering operational uncertainties. Fuel 2020, 266, 117049. [Google Scholar] [CrossRef]
- Fasihi, M.; Weiss, R.; Savolainen, J.; Breyer, C. Global potential of green ammonia based on hybrid PV-wind power plants. Appl. Energy 2021, 294, 116170. [Google Scholar] [CrossRef]
- Pawar, N.D.; Heinrichs, H.U.; Winkler, C.; Heuser, P.-M.; Ryberg, S.D.; Robinius, M.; Stolten, D. Potential of green ammonia production in India. Int. J. Hydrogen Energy 2021, 46, 27247–27267. [Google Scholar] [CrossRef]
- Ozturk, M.; Dincer, I. An integrated system for ammonia production from renewable hydrogen: A case study. Int. J. Hydrogen Energy 2021, 46, 5918–5925. [Google Scholar] [CrossRef]
- Armijo, J.; Philibert, C. Flexible production of green hydrogen and ammonia from variable solar and wind energy: Case study of Chile and Argentina. Int. J. Hydrogen Energy 2020, 45, 1541–1558. [Google Scholar] [CrossRef]
- Palys, M.J.; Wang, H.; Zhang, Q.; Daoutidis, P. Renewable ammonia for sustainable energy and agriculture: Vision and systems engineering opportunities. Curr. Opin. Chem. Eng. 2021, 31, 100667. [Google Scholar] [CrossRef]
- Zhang, H.; Wang, L.; Van herle, J.; Maréchal, F.; Desideri, U. Techno-economic comparison of green ammonia production processes. Appl. Energy 2020, 259, 114135. [Google Scholar] [CrossRef]
- Ausfelder, F.; van de Beek, F.; Bhardwaj, R.; Graf, F.; Meinke-Hubeny, F.; Lodewijks, P.; Müller, S.A.; Rijkers, M.; Perez Sanchez, D.; Ruf, J. Infrastructure Challenges Caused by Industrial Transformation to Achieve Greenhouse Gas Neutrality. Ammonia Production in the Antwerp-Rotterdam-Rhine-Ruhr Area. Chem. Ing. Tech. 2021, 93, 373–389. [Google Scholar] [CrossRef]
- Khademi, M.H.; Lotfi-Varnoosfaderani, M. Sustainable ammonia production from steam reforming of biomass-derived glycerol in a heat-integrated intensified process: Modeling and feasibility study. J. Clean. Prod. 2021, 324, 129241. [Google Scholar] [CrossRef]
- Chisalita, D.-A.; Petrescu, L.; Cormos, C.-C. Environmental evaluation of european ammonia production considering various hydrogen supply chains. Renew. Sustain. Energy Rev. 2020, 130, 109964. [Google Scholar] [CrossRef]
- Hourly Data Report for 2020—Climate—Environment and Climate Change Canada. Available online: https://climate.weather.gc.ca/climate_data/hourly_data_e.html?hlyRange=2017-10-29%7C2022-03-15&dlyRange=2017-10-29%7C2022-03-15&mlyRange=%7C&StationID=54639&Prov=NS&urlExtension=_e.html&searchType=stnName&optLimit=yearRange&StartYear=1840&EndYear=2022&selRowPerPage=25&Line=2&searchMethod=contains&Month=1&Day=1&txtStationName=sable+island&timeframe=1&Year=2021 (accessed on 16 March 2022).
- Stehly, T.; Beiter, P.; Duffy, P. 2019 Cost of Wind Energy Review. National Renewable Energy Laboratory. 2020. Available online: https://www.nrel.gov/docs/fy21osti/78471.pdf (accessed on 6 February 2022).
- Data Show Big Gains for Offshore Wind. Available online: https://www.nrel.gov/news/program/2020/2019-offshore-wind-data.html (accessed on 14 September 2022).
- JSW J82—Manufacturers and turbines—Online access—The Wind Power. Available online: https://www.thewindpower.net/turbine_en_678_jsw_j82.php (accessed on 7 April 2022).
- PEM Electrolyser. Available online: https://nelhydrogen.com/product/m-series-3/ (accessed on 14 December 2021).
- Green Hydrogen Cost Reduction: Scaling Up Electrolysers to Meet the 1.5C Climate Goal; International Renewable Energy Agency: Abu Dhabi, United Arab Emirates, 2020; p. 106.
- SWRO-7GPM-10KGPD-45KTDS-CNT Containerized Seawater Reverse Osmosis Desalination System, 10085 GPD/38 M3/day. Available online: https://www.ForeverPurePlace.com/product-p/swro-7gpm-10kgpd-45ktds-cnt.htm (accessed on 14 December 2021).
- Bartels, C.R.; Andes, K. Consideration of energy savings in SWRO. Desalination Water Treat. 2013, 51, 717–725. [Google Scholar] [CrossRef]
- 10,000 GPD (6.9gpm) Commercial Reverse Osmosis Water System. Available online: https://www.raindanceh2ostore.com/store/p401/10000GPD_Commercial_Reverse_Osmosis_System.html (accessed on 12 April 2022).
- EPRO Industrial|Commercial Reverse Osmosis System 10,000 GPD EPRO 10,000. Available online: https://www.cleanwaterstore.com/epro-industrial/commercial-reverse-osmosis-system-10000-gpd-epro-10000.html (accessed on 12 April 2022).
- Industrial Reverse Osmosis System 10,000 gpd. Available online: https://www.filterwater.com/p-441-industrial-reverse-osmosis-system-10000-gpd.aspx (accessed on 12 April 2022).
- Ulrich, G.D.; Vasudevan, P.T. Chemical Engineering Process Design and Economics: A Practical Guide, 2nd ed.; Process Publishing: Durham, UK, 2004; ISBN 0-9708768-2-3. [Google Scholar]
- Ivanova, S.; Lewis, R. Producing Nitrogen via Pressure Swing Adsorption. Chem. Eng. Prog. 2012, 108, 38–42. [Google Scholar]
- Sánchez, A.; Martín, M. Scale up and scale down issues of renewable ammonia plants: Towards modular design. Sustain. Prod. Consum. 2018, 16, 176–192. [Google Scholar] [CrossRef]
- Towler, G.P.; Sinnott, R.K. Chemical Engineering Design: Principles, Practice, and Economics of Plant and Process Design, 2nd ed.; Butterworth-Heinemann: Boston, MA, USA, 2013; ISBN 978-0-08-096659-5. [Google Scholar]
- Brown, D.E.; Edmonds, T.; Joyner, R.W.; McCarroll, J.J.; Tennison, S.R. The Genesis and Development of the Commercial BP Doubly Promoted Catalyst for Ammonia Synthesis. Catal. Lett. 2014, 144, 545–552. [Google Scholar] [CrossRef]
- Rouwenhorst, K.H.R.; Van der Ham, A.G.J.; Lefferts, L. Beyond Haber-Bosch: The renaissance of the Claude process. Int. J. Hydrogen Energy 2021, 46, 21566–21579. [Google Scholar] [CrossRef]
- Liu, H. Ammonia Synthesis Catalysts: Innovation and Practice; Chemical Industry Press: Beijing, China; World Scientific: Hackensack, NJ, USA, 2013; ISBN 978-981-4355-77-3. [Google Scholar]
- Panahandeh, M.R.; Fathikaljahi, J.; Taheri, M. Steady-State Modeling and Simulation of an Axial-Radial Ammonia Synthesis Reactor. Chem. Eng. Technol. 2003, 26, 666–671. [Google Scholar] [CrossRef]
- Lloyd, L. Ammonia and Methanol Synthesis. In Handbook of Industrial Catalysts; Fundamental and Applied Catalysis; Springer US: Boston, MA, USA, 2011; pp. 397–437. ISBN 978-0-387-24682-6. [Google Scholar]
- Dashti, A.; Khorsand, K.; Marvast, M.A.; Kakavand, M. Modeling and Simulation of Ammonia Synthesis Reactor. Pet. Coal 2006, 48, 15–23. [Google Scholar]
- Dyson, D.C.; Simon, J.M. Kinetic Expression with Diffusion Correction for Ammonia Synthesis on Industrial Catalyst. Ind. Eng. Chem. Fund. 1968, 7, 605–610. [Google Scholar] [CrossRef]
- Gillespie, L.J.; Beattie, J.A. The Thermodynamic Treatment of Chemical Equilibria in Systems Composed of Real Gases. I. An Approximate Equation for the Mass Action Function Applied to the Existing Data on the Haber Equilibrium. Phys. Rev. 1930, 36, 743–753. [Google Scholar] [CrossRef]
- Containerized PEM Electrolyser. Available online: https://nelhydrogen.com/product/m-series-containerized/ (accessed on 23 November 2021).
- Lüdtke, K.H. Process Centrifugal Compressors; Springer: Berlin/Heidelberg, Gemany, 2004; ISBN 978-3-642-07330-4. [Google Scholar]
- Railway Safety Act: Anhydrous Ammonia Bulk Storage Regulations; Canada; 2015; p. 9. Available online: https://laws-lois.justice.gc.ca/eng/regulations/C.R.C.,_c._1146/ (accessed on 13 December 2021).
- Flojet Versijet High Pressure Pump, 12V, 6GPM, 50 psi—AERO Specialties. Available online: https://www.aerospecialties.com/aviation-ground-support-equipment-gse-products/parts-spares-and-supplies/potable-water-carts-parts-spares-and-supplies/pumpsengines-potable-water-carts-parts-spares-and-supplies/flojet-pump-50psi/ (accessed on 14 December 2021).
- 2000 Gallon Vertical Liquid Storage Tank 2000VT|Tank Depot. Available online: https://www.tank-depot.com/productdetails.aspx?part=CRMI-2000VT (accessed on 12 April 2022).
- Battery Energy Storage 6 Sites, 13 MW (53MWh). Available online: https://www.stantec.com/en/projects/canada-projects/b/battery-energy-storage-6-sites (accessed on 8 April 2022).
- Gordonnat, J.; Hunt, J. Subsea cable key challenges of an intercontinental power link: Case study of Australia–Singapore interconnector. Energy Transit 2020, 4, 169–188. [Google Scholar] [CrossRef]
- Morgan, E.R. Techno-Economic Feasibility Study of Ammonia Plants Powered by Offshore Wind. Ph.D. Thesis, University of Massachusetts Amherst, Amherst, MA, USA. Available online: https://www.proquest.com/docview/1323774328/abstract/F1615FD50DD44C5FPQ/1 (accessed on 1 November 2021).
- Plant Cost Index Archives. Chemical Engineering. Available online: https://www.chemengonline.com/site/plant-cost-index/ (accessed on 9 September 2022).
- CER—Nova Scotia. Available online: https://www.cer-rec.gc.ca/en/data-analysis/energy-commodities/electricity/report/canadian-residential-electricity-bill/nova-scotia.html (accessed on 2 November 2022).
- Levelized Cost of Energy (LCOE). US Department of Energy|Office of Indian Energy. Available online: https://www.energy.gov/sites/prod/files/2015/08/f25/LCOE.pdf (accessed on 10 September 2022).
- Pakenham, B.; Ermakova, A.; Mehmanparast, A. A Review of Life Extension Strategies for Offshore Wind Farms Using Techno-Economic Assessments. Energies 2021, 14, 1936. [Google Scholar] [CrossRef]
- Emission Factors and Reference Values. 8 June 2022. Available online: https://www.canada.ca/en/environment-climate-change/services/climate-change/pricing-pollution-how-it-will-work/output-based-pricing-system/federal-greenhouse-gas-offset-system/emission-factors-reference-values.html (accessed on 10 September 2022).
- Canadian Ammonia Producers Benchmarking Energy Efficiency and Carbon Dioxide Emissions; Natural Resources Canada: Ottawa, ON, Canada, 2008; Available online: https://publications.gc.ca/collections/collection_2009/nrcan/M144-155-2007E.pdf (accessed on 10 April 2022).


| Item | Value | Source |
|---|---|---|
| α in kinetic equation | 0.5 | Liu et al. [46] |
| Activation Energy of reverse reaction “E” (kJmol−1) | 1.59 × 10² | |
| Pre-exponent factor “k0” (MPa0.5s−1) | 4.973 × 10¹² |
| Item | Value | Source |
|---|---|---|
| with T (K) and P(atm) | Gillespie et al. [51] | |
| with T (K) and P(MPa) | Liu et al. [46] | |
| with T (K) and P(MPa) | If T > 500 K If T < 500 K | Liu et al. [46] |
| Dyson et al. [50] | ||
| Dyson et al. [50] | ||
| Dyson et al. [50] | ||
| Pananandeh [47] |
| Item | Notes | Cost Estimate ($CAD) | Source |
|---|---|---|---|
| Water Pumps | 4 pumps. 6 gallons per minute. | $2000 | [55] |
| Water Tank | Plastic. 2000 gallon tank. | $2000 | [56] |
| Cooling system between compressors (HX02) | Double pipe. Area of 1.72 m2 | $19,518 | [40] |
| Heat Exchanger recycling heat in reactor (HX03) | Double pipe. Area of 41.5 m2 | $78,071 | [40] |
| Cooling system at output of reactor (HX04) | Double pipe. Area of 11.7 m2, | $32,529 | [40] |
| Device | Energy Usage (GJ Tonne−1 NH3) | Reference | Fraction of Total Energy Usage (%) |
|---|---|---|---|
| Reactor Feed Compressors | 3.24 | Aspen Plus Simulation | 8.65 |
| Hydrogen Generation (electrolysis) | 32.97 | Vendor (Nel) | 88.07 |
| Nitrogen Compressor | 0.18 | Aspen Plus Simulation | 0.47 |
| PSA | 0.92 | Rouwenhorst et al. [45] | 2.45 |
| Reverse Osmosis | 0.02 | Bartels and Andes [36] | 0.05 |
| Undersea Cable (100 km) | 0.12 | Gordonnat and Hunt [58] | 0.31 |
| Total | 37.4 | 100 |
| Item | Capital Costs ($CAD) | Source Used |
|---|---|---|
| Windfarm | $46,569,844 | [30] |
| Ammonia Storage | $2,000,000 | [40] |
| Multi-stage Compression | $4,200,000 | [40] |
| Electrolyzer | $7,168,000 | [34] |
| Hydrogen Storage | $500,000 | [40] |
| Ammonia Reactor | $1,026,000 | [40,45] |
| Nitrogen Generation | $500,000 | [42] |
| Other (Water tank, heat exchangers) | $344,056 | [40,55,56] |
| Subtotal | $62,307,900 | |
| Working Capital (15% of ammonia plant cost) | $2,360,708 | [43] |
| Contingency and Fee (18% of ammonia plant cost) | $2,832,851 | [40] |
| Greenfield Fee (30% of ammonia plant cost) | $4,721,417 | [40] |
| Total | $72,222,876 |
| Scenario 1 | Scenario 2 | |
|---|---|---|
| Average Production Rate (tonnes NH3 day−1) | 15 | 10.6 |
| Average Wind Energy Usage (MWh tonne−1 NH3) | 5.12 | 7.23 |
| Average Grid Energy Usage (MWh tonne−1 NH3) | 5.24 | 3.13 |
| LCOA (CAD tonne−1 NH3) | 2323 | 2613 |
Publisher’s Note: MDPI stays neutral with regard to jurisdictional claims in published maps and institutional affiliations. |
© 2022 by the authors. Licensee MDPI, Basel, Switzerland. This article is an open access article distributed under the terms and conditions of the Creative Commons Attribution (CC BY) license (https://creativecommons.org/licenses/by/4.0/).
Share and Cite
Cunanan, C.J.; Elorza Casas, C.A.; Yorke, M.; Fowler, M.; Wu, X.-Y. Design and Analysis of an Offshore Wind Power to Ammonia Production System in Nova Scotia. Energies 2022, 15, 9558. https://doi.org/10.3390/en15249558
Cunanan CJ, Elorza Casas CA, Yorke M, Fowler M, Wu X-Y. Design and Analysis of an Offshore Wind Power to Ammonia Production System in Nova Scotia. Energies. 2022; 15(24):9558. https://doi.org/10.3390/en15249558
Chicago/Turabian StyleCunanan, Carlo James, Carlos Andrés Elorza Casas, Mitchell Yorke, Michael Fowler, and Xiao-Yu Wu. 2022. "Design and Analysis of an Offshore Wind Power to Ammonia Production System in Nova Scotia" Energies 15, no. 24: 9558. https://doi.org/10.3390/en15249558
APA StyleCunanan, C. J., Elorza Casas, C. A., Yorke, M., Fowler, M., & Wu, X.-Y. (2022). Design and Analysis of an Offshore Wind Power to Ammonia Production System in Nova Scotia. Energies, 15(24), 9558. https://doi.org/10.3390/en15249558