Article

Exergoeconomic Analysis of a Variable Area Solar Ejector Refrigeration System under Hot Climatic Conditions

1
Mechanical Engineering Department, Jordan University of Science and Technology, Ar Ramtha 3030, Jordan
2
Institute for Energy Engineering, Technische Universitat Berlin, Marchstr. 18, 10587 Berlin, Germany
*
Author to whom correspondence should be addressed.
Energies 2022, 15(24), 9540; https://doi.org/10.3390/en15249540
Submission received: 30 September 2022 / Revised: 25 November 2022 / Accepted: 6 December 2022 / Published: 15 December 2022

Abstract

:
The present study investigates low-grade heat utilization in ejector refrigeration systems under hot climatic conditions. A variable area ejector is used to maximize the harvested heat from the generator of the solar system at peak times. Exergy, economic, and exergoeconomic analyses are conducted to evaluate the performance of the system. A thermodynamic model of the system has been developed using Ebsilon Professional software. Available experimental and theoretical data validate the results. The effects of properties of the working fluids, ejector geometry, and operation conditions are also evaluated. It was found that the coefficient of performance of the system reached 0.45 at a generator pressure of 3 bars. Furthermore, it was noticed that the overall exergy efficiency could be increased for a fixed generator temperature while increasing the ejector area ratio. A value of 21% exergetic efficiency was calculated for the system. The exergoeconomic analysis of the system demonstrated that heat exchangers are required to be improved thermodynamically at the expense of the capital investment cost.

1. Introduction

Recent years have been plagued by environmental disasters that can be directly credited to global warming effects. Many nations worldwide are making tremendous efforts toward greener and more efficient energy sources. One of the promising avenues is solar energy. Solar energy is abundant and reliable, hence its popularity [1,2]. In countries located in arid climates, it has been found that one of the highest energy consumers is the residential air conditioning demand. In such areas, there is a high potential to utilize solar energy, leading to high energy savings. Research studies have been conducted to analyze the use of solar energy for refrigeration purposes [3,4]. Ejector refrigeration machines have a long history of application [5,6,7].
Africa, Asia, and several parts of other continents are characterized by hot and dry climatic conditions. The average daytime temperature is usually above 30 °C, which increases the need for air conditioning [8]. The ejector refrigeration systems (ERS) could be implemented in the air conditioning application. This would be advantageous because not only would it reduce reliance on the national grid, but it would also help with environmental concerns [9]. An ejector is also called a “jet compressor”. Ejector refrigeration systems beyond the thermally-driven refrigeration systems, i.e., that utilize low-grade heat and are attractive when driven by solar energy. [10]. They can be incorporated into various system configurations and combined with power cycles [11]. Ejectors are reliable because they have no moving parts. They also have relatively low capital costs and operating and maintenance expenses. Ejector refrigeration systems have much lower performance when compared to vapor-compressor systems because of their thermodynamic cycles [12].
Ejectors can be grouped based on their nozzle position, design, and number of phases. The constant pressure mixing (CPM) ejectors are more applicable than constant area mixing ejectors due to their ability to work against higher back pressures and their superior performance [13]. Constant area mixing (CAM) corresponds to higher mass flow rates. A recent paper discusses combining CPM and CAM ejectors to create a constant rate of momentum change. The constant rate of momentum-change (CRMC) configuration type uses a variable area section to optimize the flow passage area, reducing the chances of thermodynamic shocks and improving ejector performance. The geometry of the nozzle can affect how the ejector operates [14,15]. The nozzle geometry can be convergent, which means that the ejector can work at subsonic conditions and achieve the maximum sonic velocity at the exit of the suction. The flow through the ejector can reach supersonic speeds [16].
Ejectors are influenced by back pressure during sub-critical mode. As the pressure in the mixing chamber rises, a shockwave enters the process, interacting with the mixing and raising the pressure even higher. When the vacuum is turned off, the primary flow in the suction chamber reverses. The flow through an ejector can be either one or two phases [17]. Two-phase ejectors can be classified by flow type: condensing ejectors, where the primary flow condenses in the ejector, and two-phase ejectors, where the flow is two-phase at the outlet [18].
The performance of the variable geometry ejector can be predicted by two 1-D mathematical models. The so-called Huang’s model is a model that is used because it considers the ejector’s critical point of operation. This model is applicable for variable geometry ejectors [19,20]. Another model, Chen’s model, is used as a comparison tool to study ejector operation in either the subcritical or critical. In both cases, there is some hypothetical effective throat at which the speed of the secondary flow reaches its maximum value. Just after this section of the throat, the mixing process of the primary and secondary streams begins at a uniform pressure [21].
A study of a solar ejector refrigeration system (SERS) was carried out for the Mediterranean Sea region, and the authors found that the overall efficiency had a lower performance at the solar radiation peak [22]. As the flow increases, the ejector will be choked, and the harvested heat in the generator will not be fully utilized. The thermal efficiency of the SERS is decreased as the solar radiation approaches its maximum value. The ejector flow caused a stoppage, which prevented the generator from using all the solar heat it could [23]. Recent research innovations have helped improve system performance, including the use of special refrigerants, the use of renewable energy, and reduced mechanical pump work [24].
Exergy and exergoeconomic analyses were carried out to study the performance of the ejector refrigeration system. An exergoeconomic analysis was conducted for series and combined double effect ejector systems to evaluate the effect of key operating conditions on the investment and product costs. It was found that the implementation of ejector to the other thermodynamic cycles has an economic advantage over the double effect system [25,26,27]. An exergy study of the Kalina power-cooling cycle with an ejector was conducted to optimize the system using exergy and pinch analyses [28]. The frictional losses on the ejector’s wall were investigated by developing a two-dimensional model for the ejector. MATLAB software [29] was used to solve the exergy, energy, and exergoeconomic equations of the model, and a multi-objective optimization was carried out [30,31].
So-called 4E analysis was conducted for an integrated process with capturing carbon dioxide and storage, in combination with organic Rankine and absorption refrigeration cycles [32]. Furthermore, an experimental analysis of a solar-assisted heat pump with energy, exergy, economic and exergoeconomic analysis was carried out [33].
In addition, it should be mentioned that hot climatic conditions significantly influence the exergetic and economic characteristics of any heat-driven refrigeration system [34].
Considering the above literature, although ejector refrigeration systems have been around for some time, many improvements to the original design have been researched. The operating principle of the ejector refrigeration systems states that the ejector’s ability to expel refrigerant is limited, and a maximum flow rate is permitted, especially when the heat source is dynamic (as in a solar-driven system). The present work addresses a solar-driven ejector refrigeration system with an adjustable area ratio to cope with the variation in the generator operating conditions. The ejector as a component has been modeled in MATLAB, and simulations of the system in EbsilonProfessional. The energy, exergy, economic, exergoeconomic analyses, and a sensitivity analysis of the system were carried out to find the optimum operating conditions. The aim is to determine the optimal combination of the variable ejector dimensions. Attention has been given to applying solar ejector refrigeration systems under hot climatic conditions.

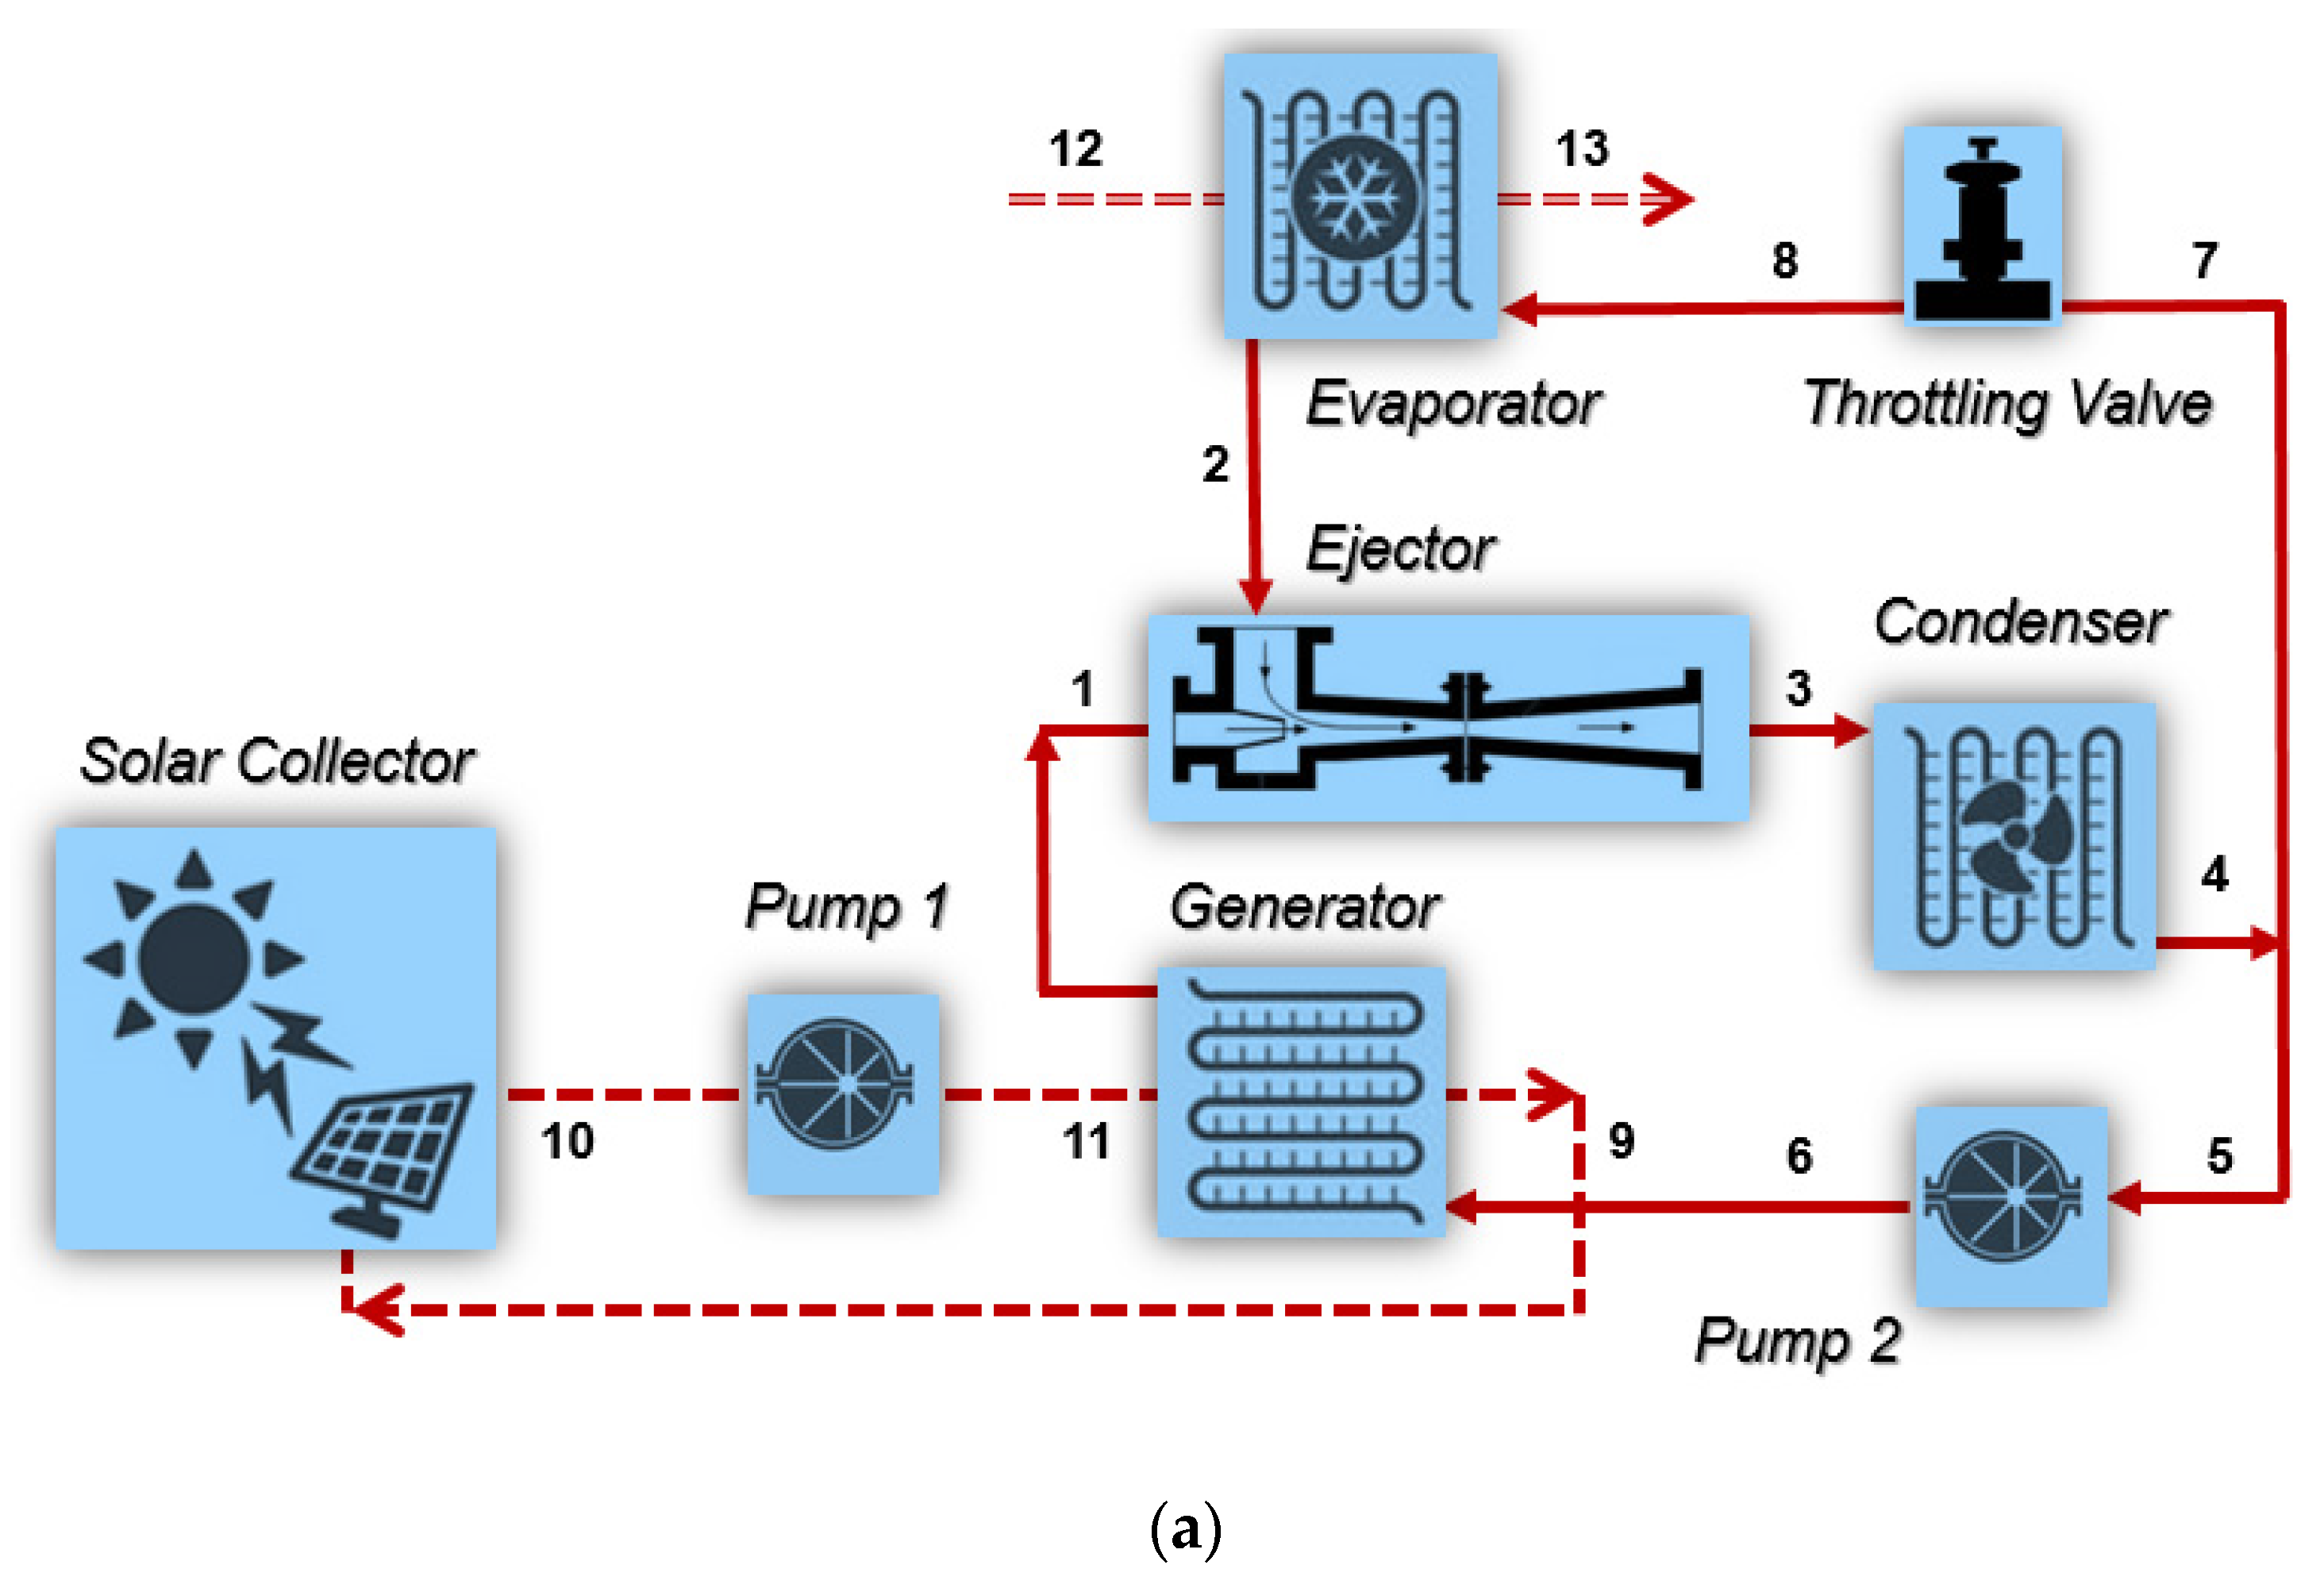
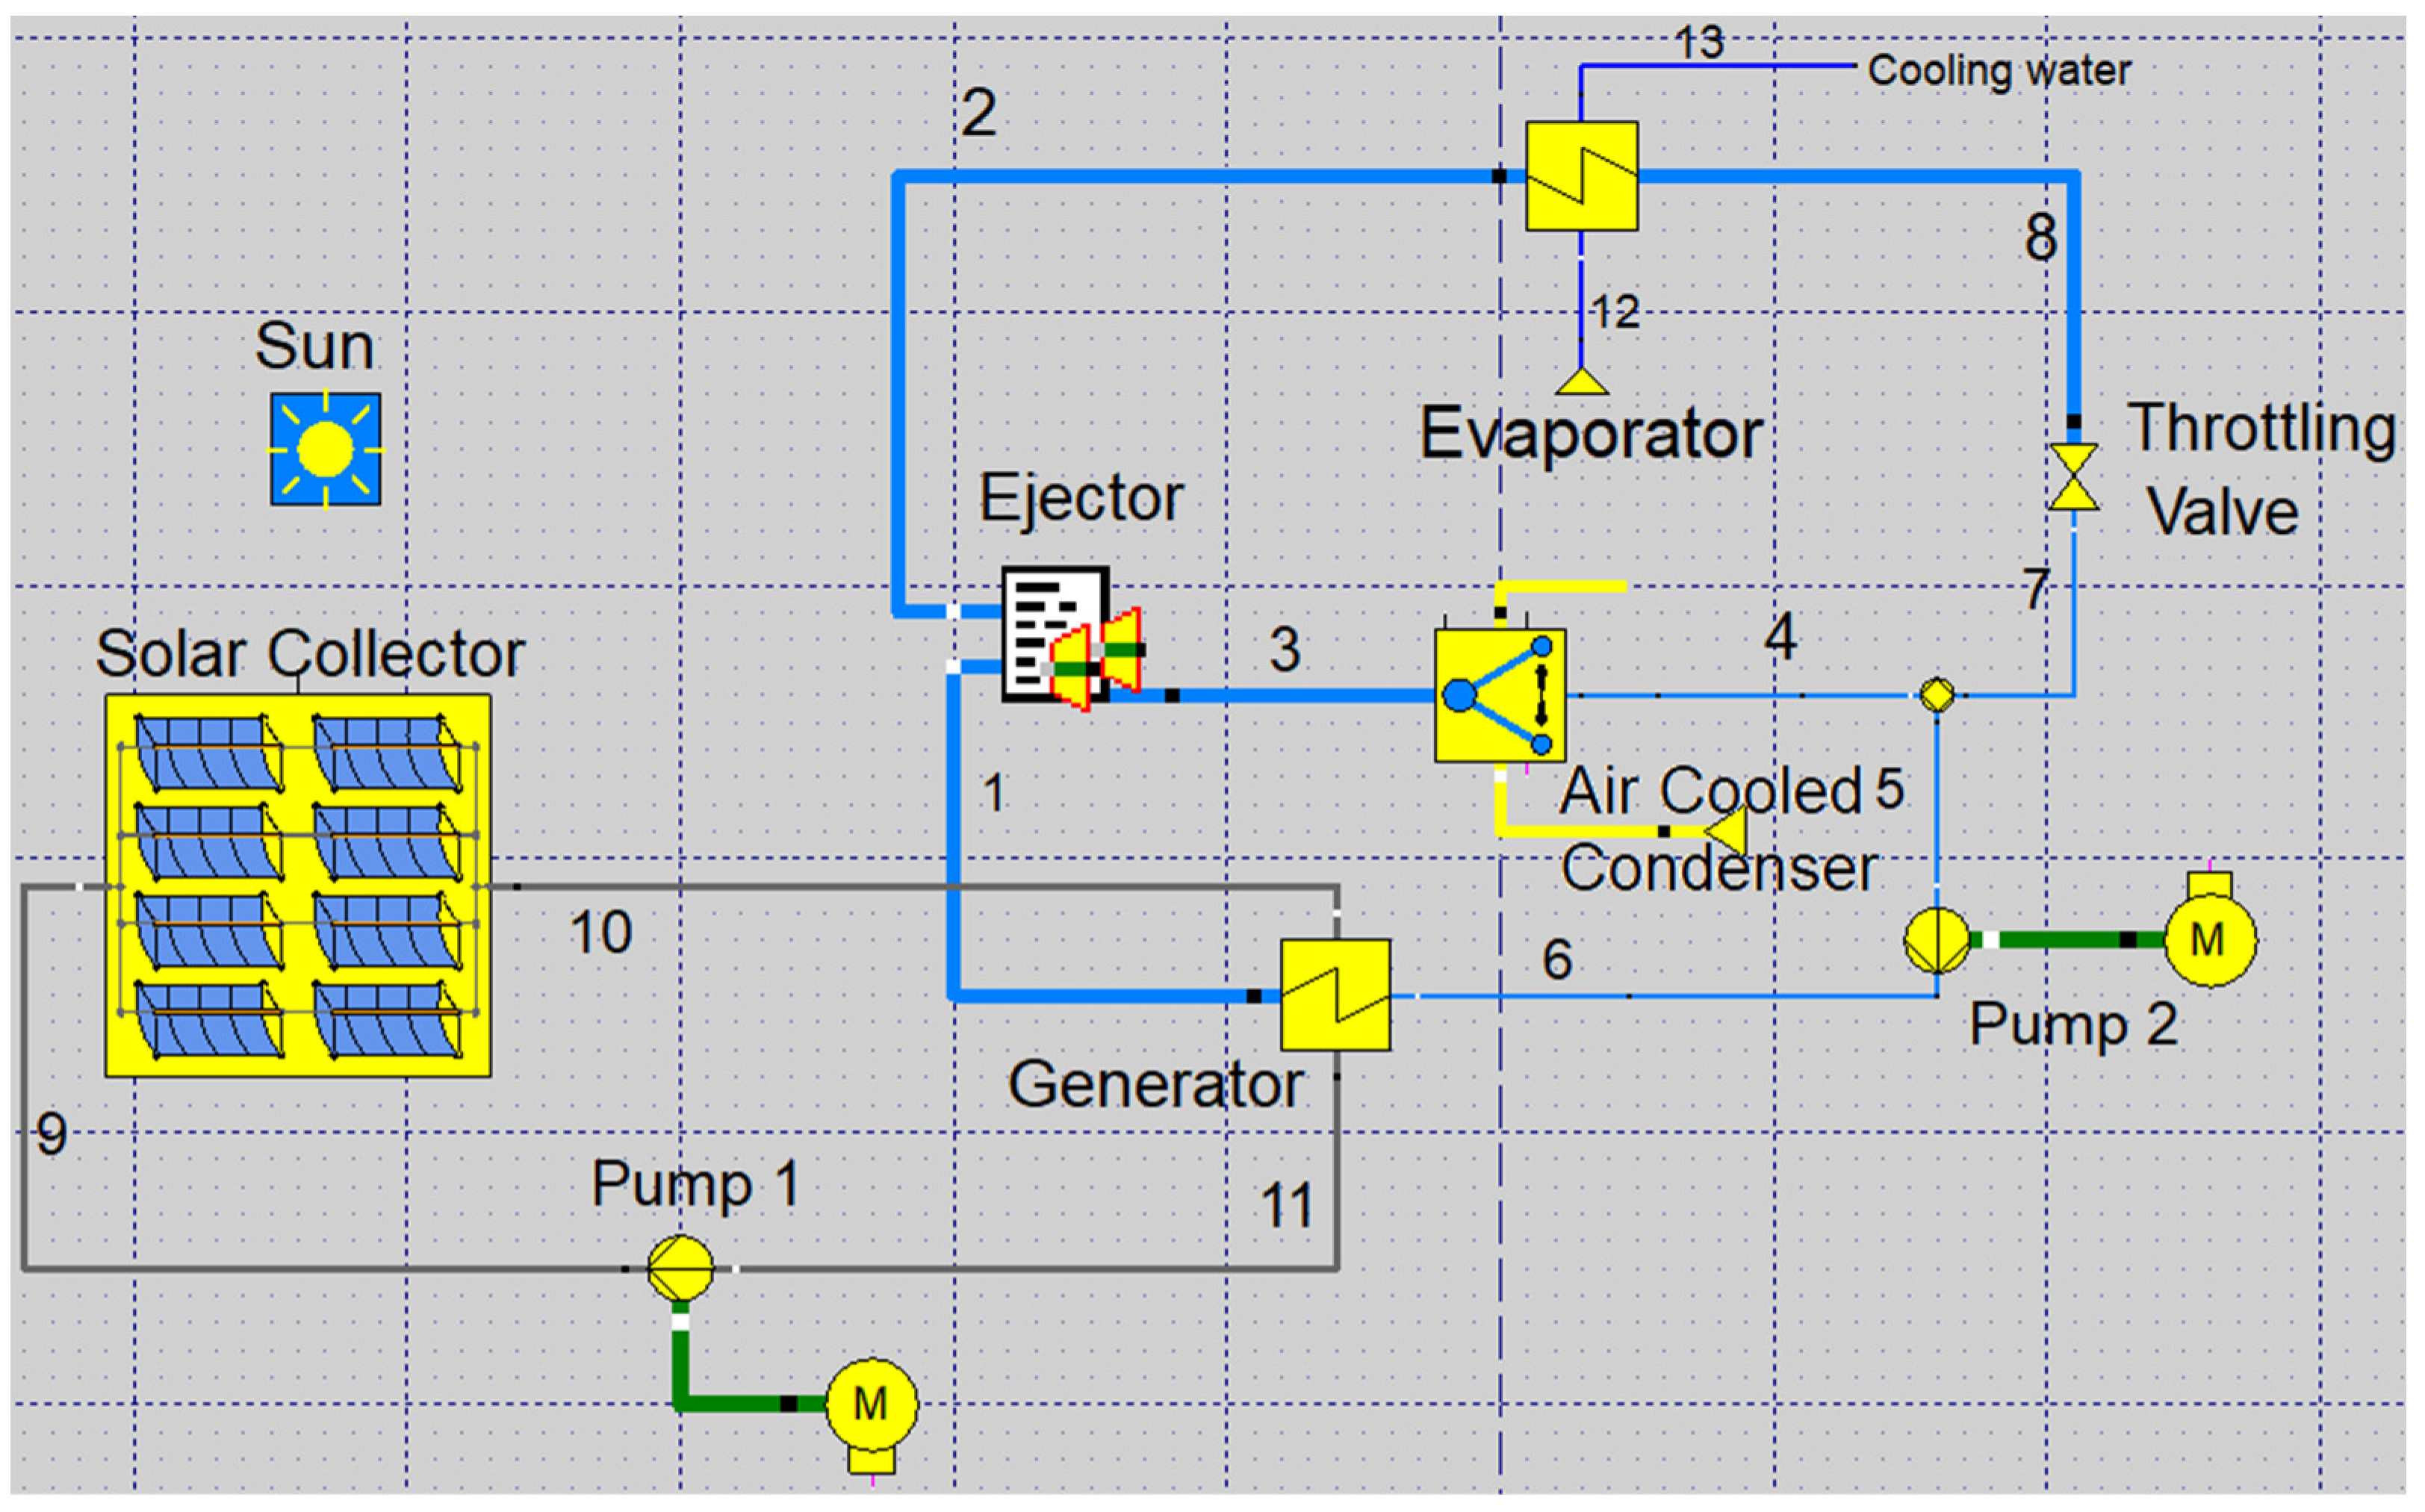
2. Materials and Methods

An ejector refrigeration system consists of a generator, evaporator, condenser, throttling valve, pump, and ejector. The schematic of the evaluated system is shown in Figure 1a. The saturated vapor from the generator (state 1) is the primary stream at a low velocity; it enters the converging-diverging nozzle, where it is accelerated. At the exit from the ejector (state 3), the supersonic accelerated refrigerant flow exits at low pressure while creating a suction effect, and the secondary stream (low-pressure refrigerant from the evaporator) is entrained (state 2). In the critical operation mode of the ejector, a shear layer is formed due to the gradient of velocity between the secondary and primary flows. The secondary stream is accelerated to sonic speed. The mixing process begins when the flow is obstructed. The interactions of the primary and secondary streams with the ejector wall add to the mixing process complexity. After the mixing process, a shock wave could form, either in the constant area chamber or at the diffuser inlet. The operational conditions determine the location of the shock wave. Normal shock causes the flow velocity to change from supersonic to subsonic, resulting in a significant increase in pressure. Finally, in the diffuser section of the ejector, the mixed flow stream pressure rises and exits at the condensation pressure.
After the condenser (state 4), the refrigerant splits into two parts. The evaporation of the refrigerant provides the target refrigeration effect (process 8-2) and leaves the evaporator as a saturated vapor.
In the present study, we perform the simulation based on an ejector with variable area ratios. In Figure 1b, a schematic diagram of the variable area ejector is presented. The variable area ejector consists of five parts: primary nozzle, suction chamber, mixing chamber, diffuser, and a spindle, which is driven by a motor. With its movement, the effective flow area of the primary nozzle changes accordingly. By this, the primary flow rate of the ejector can be adjusted, which in turn leads to a variation in the secondary flow rate. This model will accommodate the variation in the solar radiation during the day and allows the harvesting of more energy and increases the performance of the system. Figure 2 represents a screenshot of the proposed system in the Ebsilon Professional software.
The selection of an appropriate refrigerant is a critical issue for ejector refrigeration systems. The ecological properties of the refrigerant (i.e., ozone depletion potential (ODP), and global warming potential (GWP)) should also be taken into account. In addition, it is preferable if the fluid is non-corrosive, has low toxicity, is non-explosive, chemically stable, inexpensive, and commercially available.
In the present design, the refrigerant R141b has been chosen. R141b is a pure hydrofluorocarbon (HFC) working fluid with no chlorine atoms, i.e., ODP = 0 and GWP is negligibly small. It is considered an appropriate refrigerant for ejector refrigeration systems due to its high performance in terms of coefficient of performance (COP) and entrainment ratio compared with other refrigerants [35,36].

3. System Modeling and Evaluation

For the simulation, the following has been assumed: steady state condition; 0.01 bar pressure drop in pipes with negligible heat losses in the generator and evaporator; the cooling air temperature of the condenser is 5 °C higher than the ambient temperature; the refrigerant at the evaporator exit is saturated vapor. In addition, an adiabatic ejector is assumed with a 1D steady flow. The changes in kinetic energy at the inlet and exit of the ejector are neglected, and ejector efficiencies are used to calculate the losses in the ejector sections. A constant pressure mixing process is assumed in the mixing chamber. The thermodynamic properties are calculated using Ebsilon Professional.

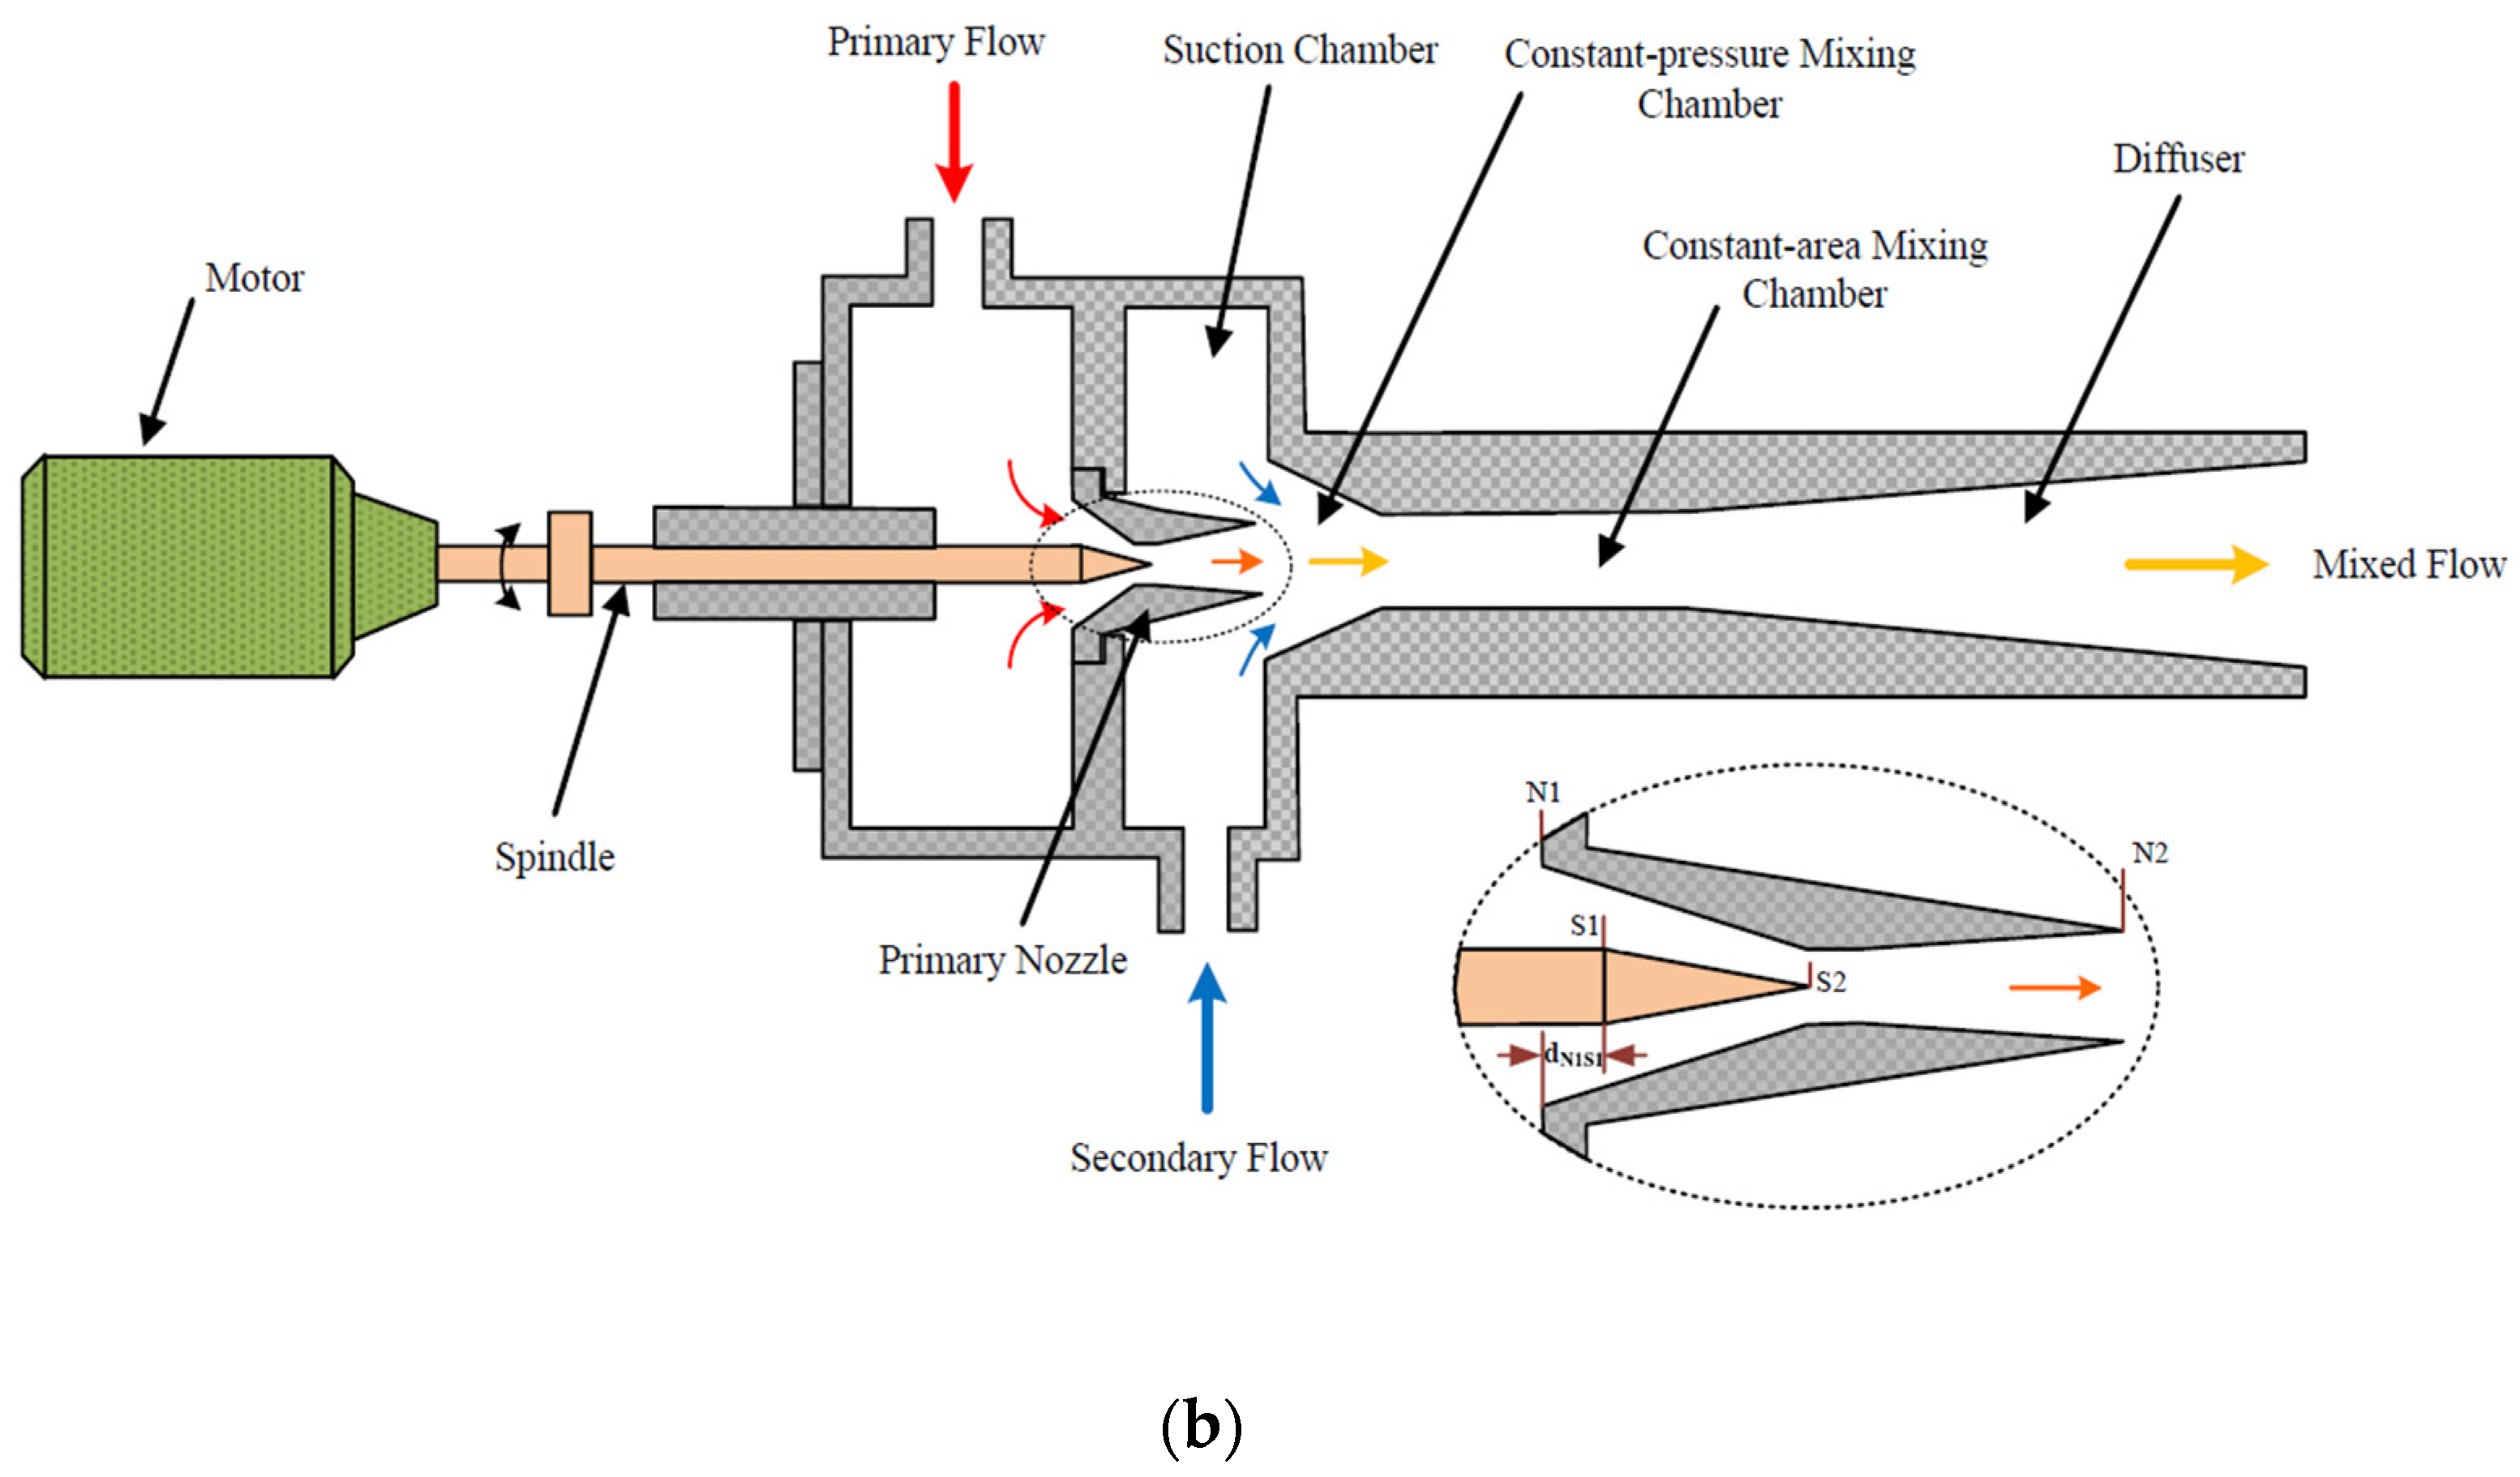
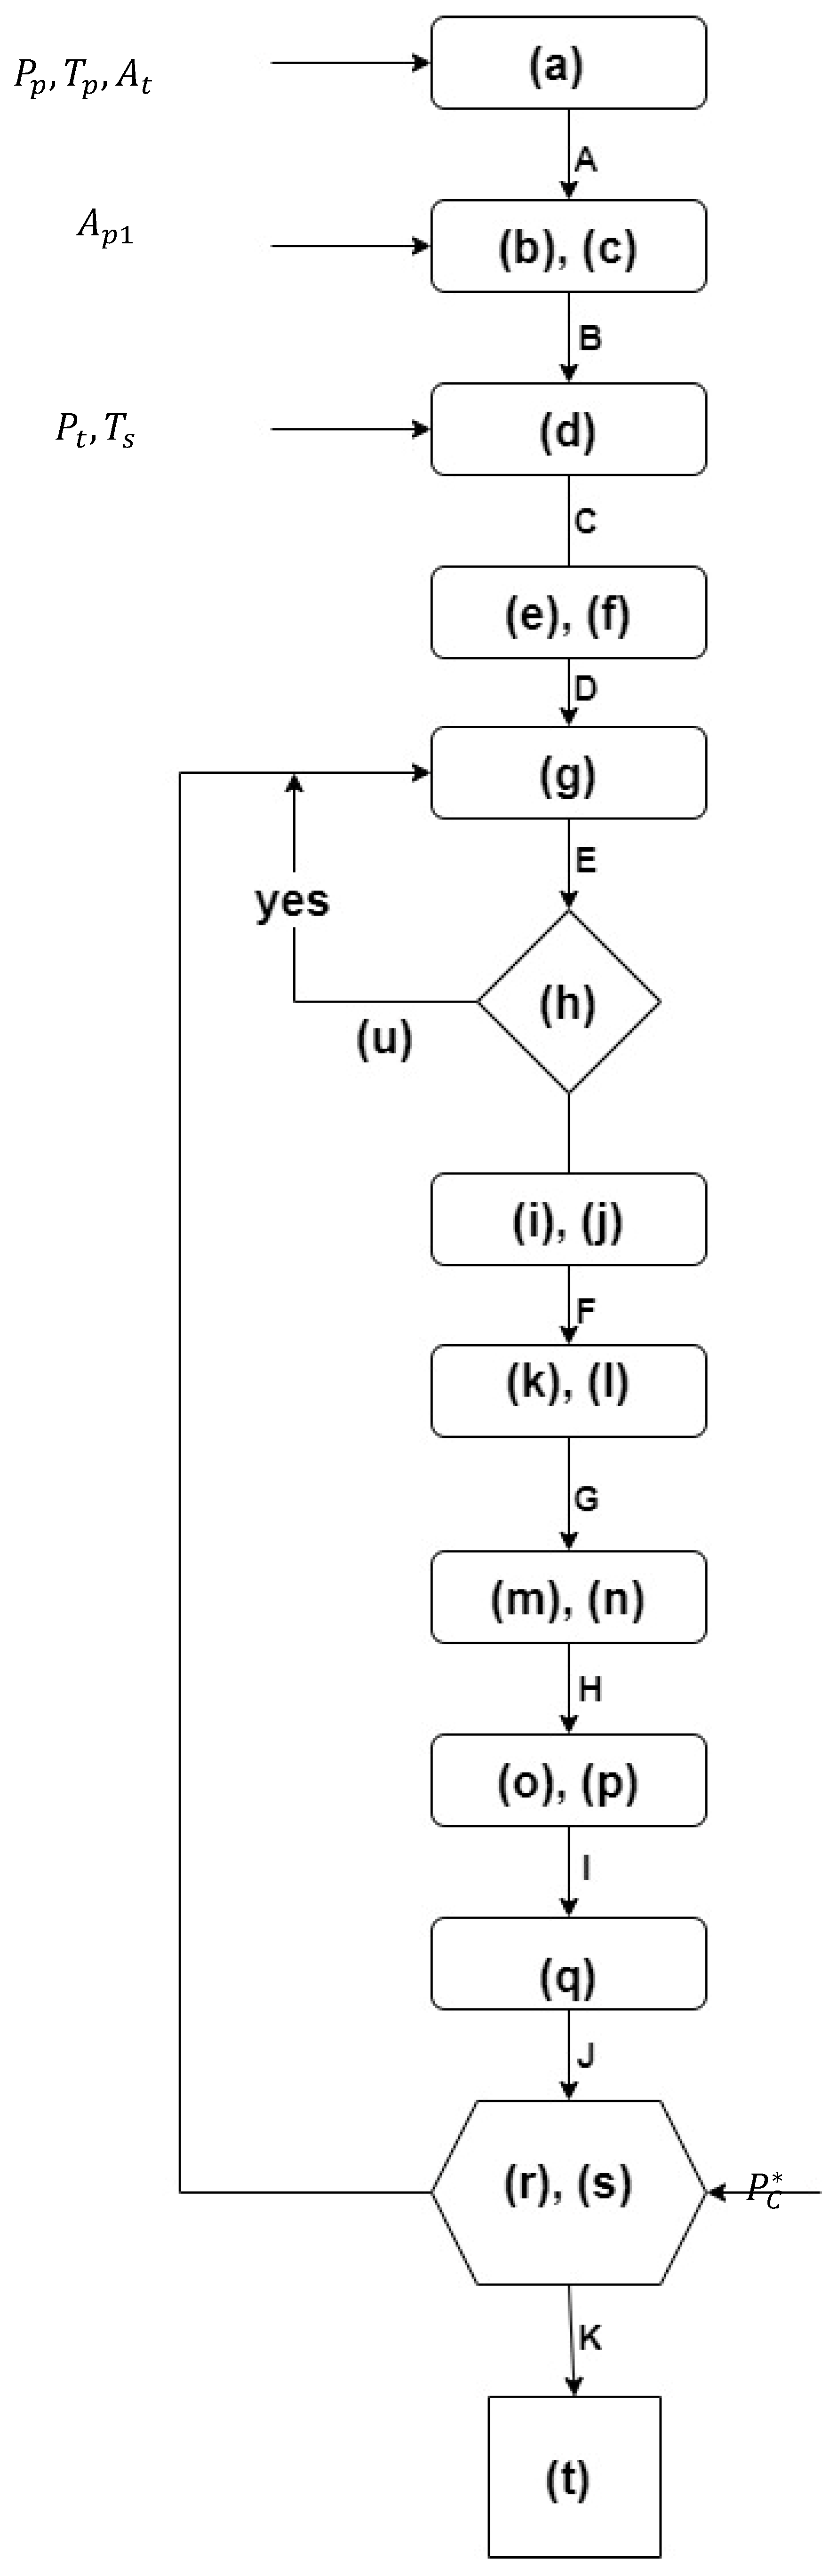
3.1. Ejector Modelling

An ejector 1D mathematical model is used to evaluate and predict its performance. The used governing equations are mass, momentum, and energy for a compressible flow. The Mach number and pressure at the exit of the primary nozzle are then calculated assuming isentropic flow using the isentropic flow equations. Then, assuming that the secondary flow is choked, the pressure of the secondary flow at that section. The energy balance is applied to the mixing process to estimate the mixing temperature, which is then used to find the mixing Mach number.
M m = V m γ R g T m
where, vm is the mixed-flow speed, Rg is the ideal gas constant, γ is the gas specific ratios, Tm is the mixed flow temperature.
The pressure and the Mach number at the diffuser exit are calculated after determining the mixing Mach number at the constant pressure mixing process. The pressure at the exit can be calculated as
P c P 2 = ( 1 + γ 1 2 M 2 2 ) γ γ     1
where Pc is the pressure of the constant mixing process, P2 is the pressure at the diffuser exit.
Figure 3 depicts a flowchart of the process calculation and the equations used in the energy analysis are presented in the Supplementary Materials.
The ejector efficiency definition used is based on ASHRAE, which relates the actual recovered energy of compression to the theoretical maximum energy available in the motive stream.
η e j e c t o r = ( m ˙ g + m e ˙ ) ( h c , i n h e , o u t ) m ˙ g ( h g , o u t h e , o u t )
where m ˙ g is the mass flow rate in the generator,   m e ˙ is the mass flow rate at the evaporator, he,in is the enthalpy at the inlet of the condenser, he,out is the enthalpy at the exit of the evaporator, hg,out is the enthalpy at the generator exit. The ejector specifications are presented in Table 1.

3.2. System Performance

The entrainment ratio, ω , the compression ratio, Rc, and the COP are parameters that describe the ejector refrigeration system
ω = m s m p
where ms is the secondary mass flow rate and mp is the primary mass flow rate.
R c = p c p e
COP = Q ˙ e Q ˙ g + W p ˙
where Q ˙ e is the evaporator cooling capacity, Q ˙ g is the generator heat load, and W p is the pump work.

3.3. Exergy Analysis

Exergy analysis provides a more accurate and robust analysis of the thermodynamic system compared to energy analysis. The total exergy of the system consists of chemical, physical, potential, and kinetic exergy. Only physical exergy will be considered in this study.
The exergy analysis has been conducted using the “fuel ( E ˙ F )/product ( E ˙ P )” approach [37]:
  • For the entire system
E ˙ F , t o t = E ˙ P , t o t + E ˙ D , t o t + E ˙ L , t o t
The subscripts F, P, D, and L indicate fuel, product, destruction, and losses, respectively.
  • On the kth component level
E ˙ F , k = E ˙ P , k + E ˙ D , k
The evaluation is based on:
  • Exergetic efficiency of the entire system
ε k = E ˙ P , k E ˙ F , k
  • Exergetic efficiency of the kth component
ε t o t = E ˙ P , t o t E ˙ F , t o t
  • The exergy destruction ratio
y D , k * = E ˙ D , k E ˙ D , t o t

3.4. Economic Analysis

The total revenue requirement (TRR) method is used to examine the economic analysis of the system. To perform the TRR, the system’s total capital investment (TCI) must first be estimated based on the cost of each purchased item (PEC), after which the parameters for the detailed cost calculation’s economic, financial, operating, and market inputs are determined. Finally, the succession of expenses will be levelized into a constant number with a comparable financial value (annuity). Estimating the PEC of each component with a precise method is the most important and difficult portion of the economic analysis; this is particularly tough for new and unproven technologies. The range of cost estimation errors is typically between 10% and 30%. Given that the suggested system is innovative, the cost estimation may be less accurate than expected. To estimate system costs and further support system performance evaluation, the TRR approach is still a viable alternative as the foundation for the exergoeconomic study.
The TRR consists of carrying charges (CCL) and the expenses of the fuel (FCL) and operation and maintenance (OMCL)costs:
T R R L = C C L + F C L + O M C L
The CCL is the capital investment (including total capital recovery, preferred stock, return on investment, income taxes, and insurance). This means that it is the value of the total capital investment cost (TCI), which is composed of the fixed capital investment (FCI) and the interest accrued:
T C I = F C I + i n t e r e s t
The FCI is obtained by adding the bare module cost (BMC) to the service facilities and contingencies funds. The FCI represents the total system cost at time = 0; that is before construction. The indirect system costs include construction costs, contingencies, administrative fees, and engineering.
To calculate the TCI, we need to estimate the purchase equipment cost (PEC) using the following approach:
C P E , r e f = C P E , k n o w n ( X n e w X k n o w n ) α
where C P E , r e f is the approximate equipment costs with the size X n e w , C P E , k n o w n is the known equipment costs with the corresponding size X k n o w n , and α is the size exponent.
The third step is to adjust the estimated equipment cost to the reference year. The reference year is 2019:
C P E , r e f = C P E , o l d ( C E P C I r e f C E P C I o l d )
where ref is the year, the equipment is to be purchased and old is the year the cost of the equipment is known.
After calculating the current equipment purchase cost, the equipment’s nature and characteristics must be considered in the form of factors. Material and pressure correction factors (MPF) are defined for unique materials, high pressure, designs, and materials.
The final step is the module factor (MF) cost. This accounts for labor, piping, instrumentation, and everything necessary at the installation stage. The bare module cost (BMC) can be calculated using:
B M C = C P E , r e f , n e w ( M P F + M F 1 )
The total direct costs are the sum of BMC, while the indirect costs are calculated as a percentage of the total direct costs.
The constant escalation levelization factor (CELF) and the capital recovery factor (CRF) are calculated as
C R F = i e f f ( 1 + i e f f ) n ( 1 + i e f f ) n 1
where i e f f is the effective interest rate, and n is the economic lifetime.
FCL and OMCL are determined as
F C L = F C 0 × C E L F = F C 0 × k F C ( 1 k F C n ) 1 k F C × C R F
With k F C = 1   +   r F C 1   +   i e f f and k O M C = 1   +   r O M C 1   +   i e f f where rFC is the average inflation rate of fuel and rOMC is the operation and maintenance cost. FC0 is the fuel cost in the first year of operation.

3.5. Exergoeconomic Analysis

This combined exergy and economic analysis provides more comprehensive information that is unavailable through a conventional energy, exergy, and economic analysis. Exergoeconomic analysis is based on cost balances on the component level [37], i.e.,
C ˙ P , k = C ˙ F , k + Z ˙ k
c p E ˙ P , k = c F E ˙ F , k + Z ˙ k
where the average cost of fuel c F = C ˙ F , k E ˙ F , k and product c p = C ˙ P , k E ˙ P , k within a component; and the exergy destruction cost rates within the component C ˙ D , k = c F E ˙ D , k , and the entire system C ˙ D , t o t = c F t o t E ˙ D , k .
Exergoeconomic factor f k is used in the optimization procedure to make decisions of either investing in a more efficient components to reduce the exergy destruction or to sacrifice efficiency to decrease the costs associated with the carrying charges:
f k = Z ˙ k Z ˙ k + C ˙ D , k

4. Results and Discussion

The mathematical model has been solved by EBSILON Professional Software, and the system key properties and parameters are calculated. The simulation results of the proposed system are reported in Table 2.
The mathematical model has been validated by already published data in the literature [38]. Comparisons between the obtained results and those published in the literature for evaporator temperatures of 12 °C are presented in Table 3. The depicted good agreement between the obtained results and the data published in the literature gives confidence in the present model and its results.

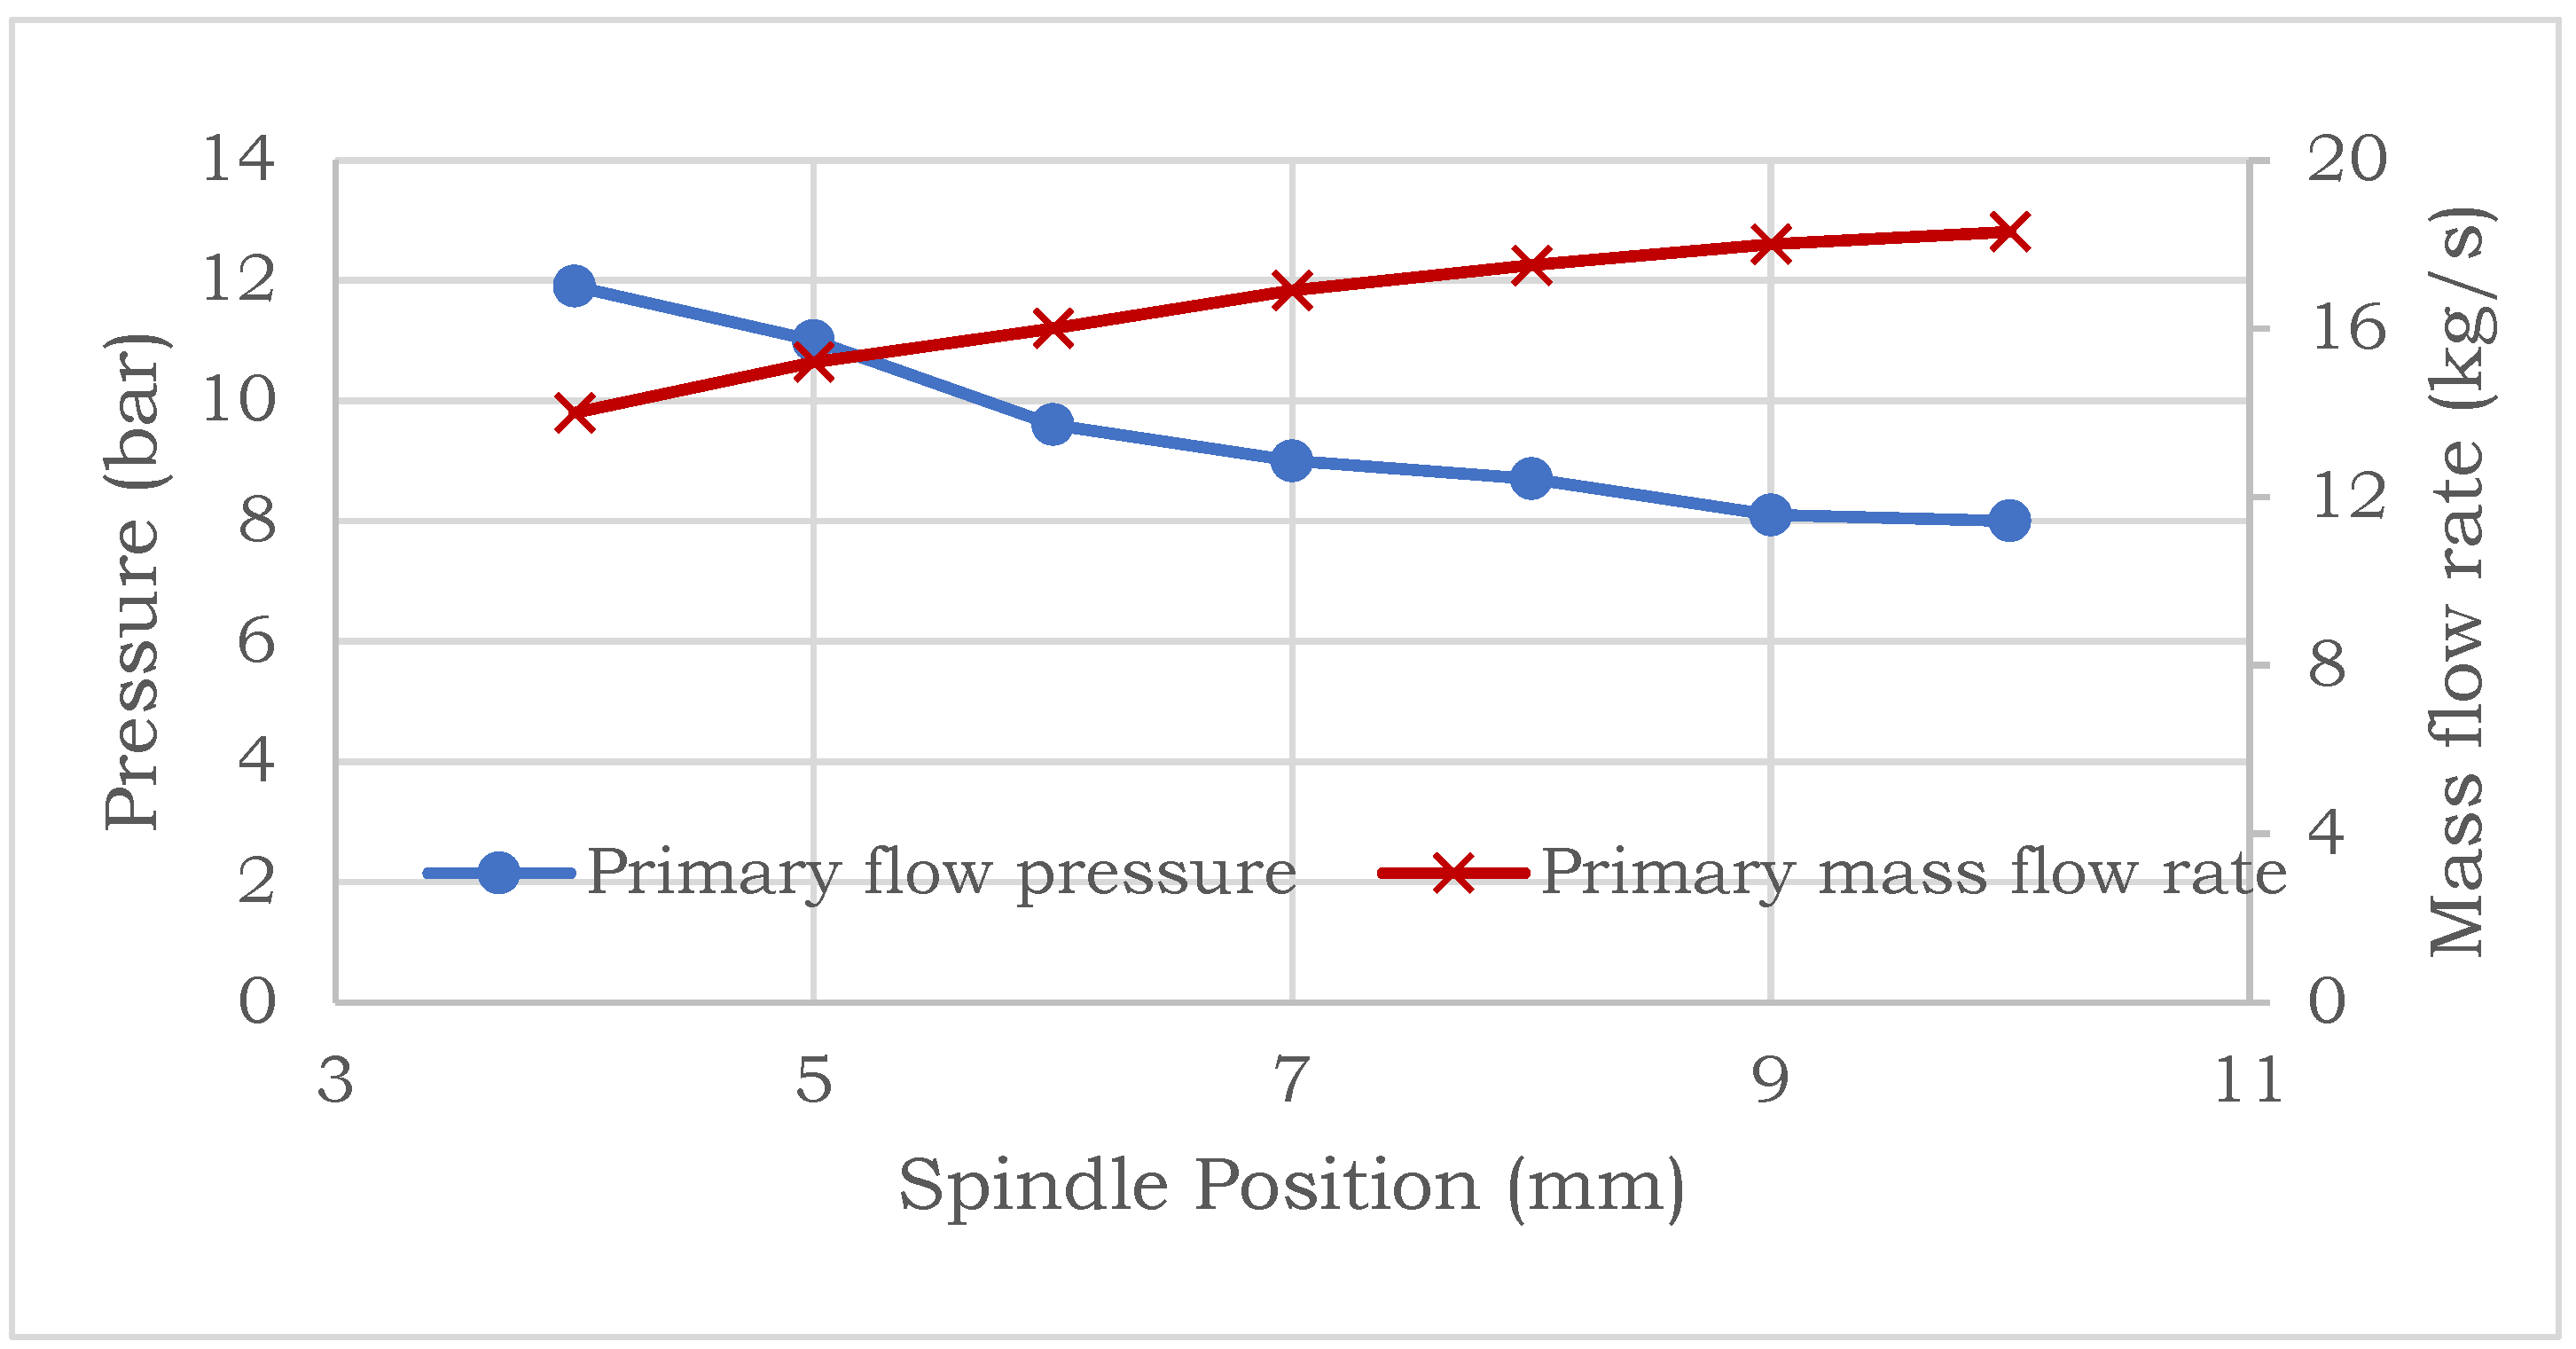
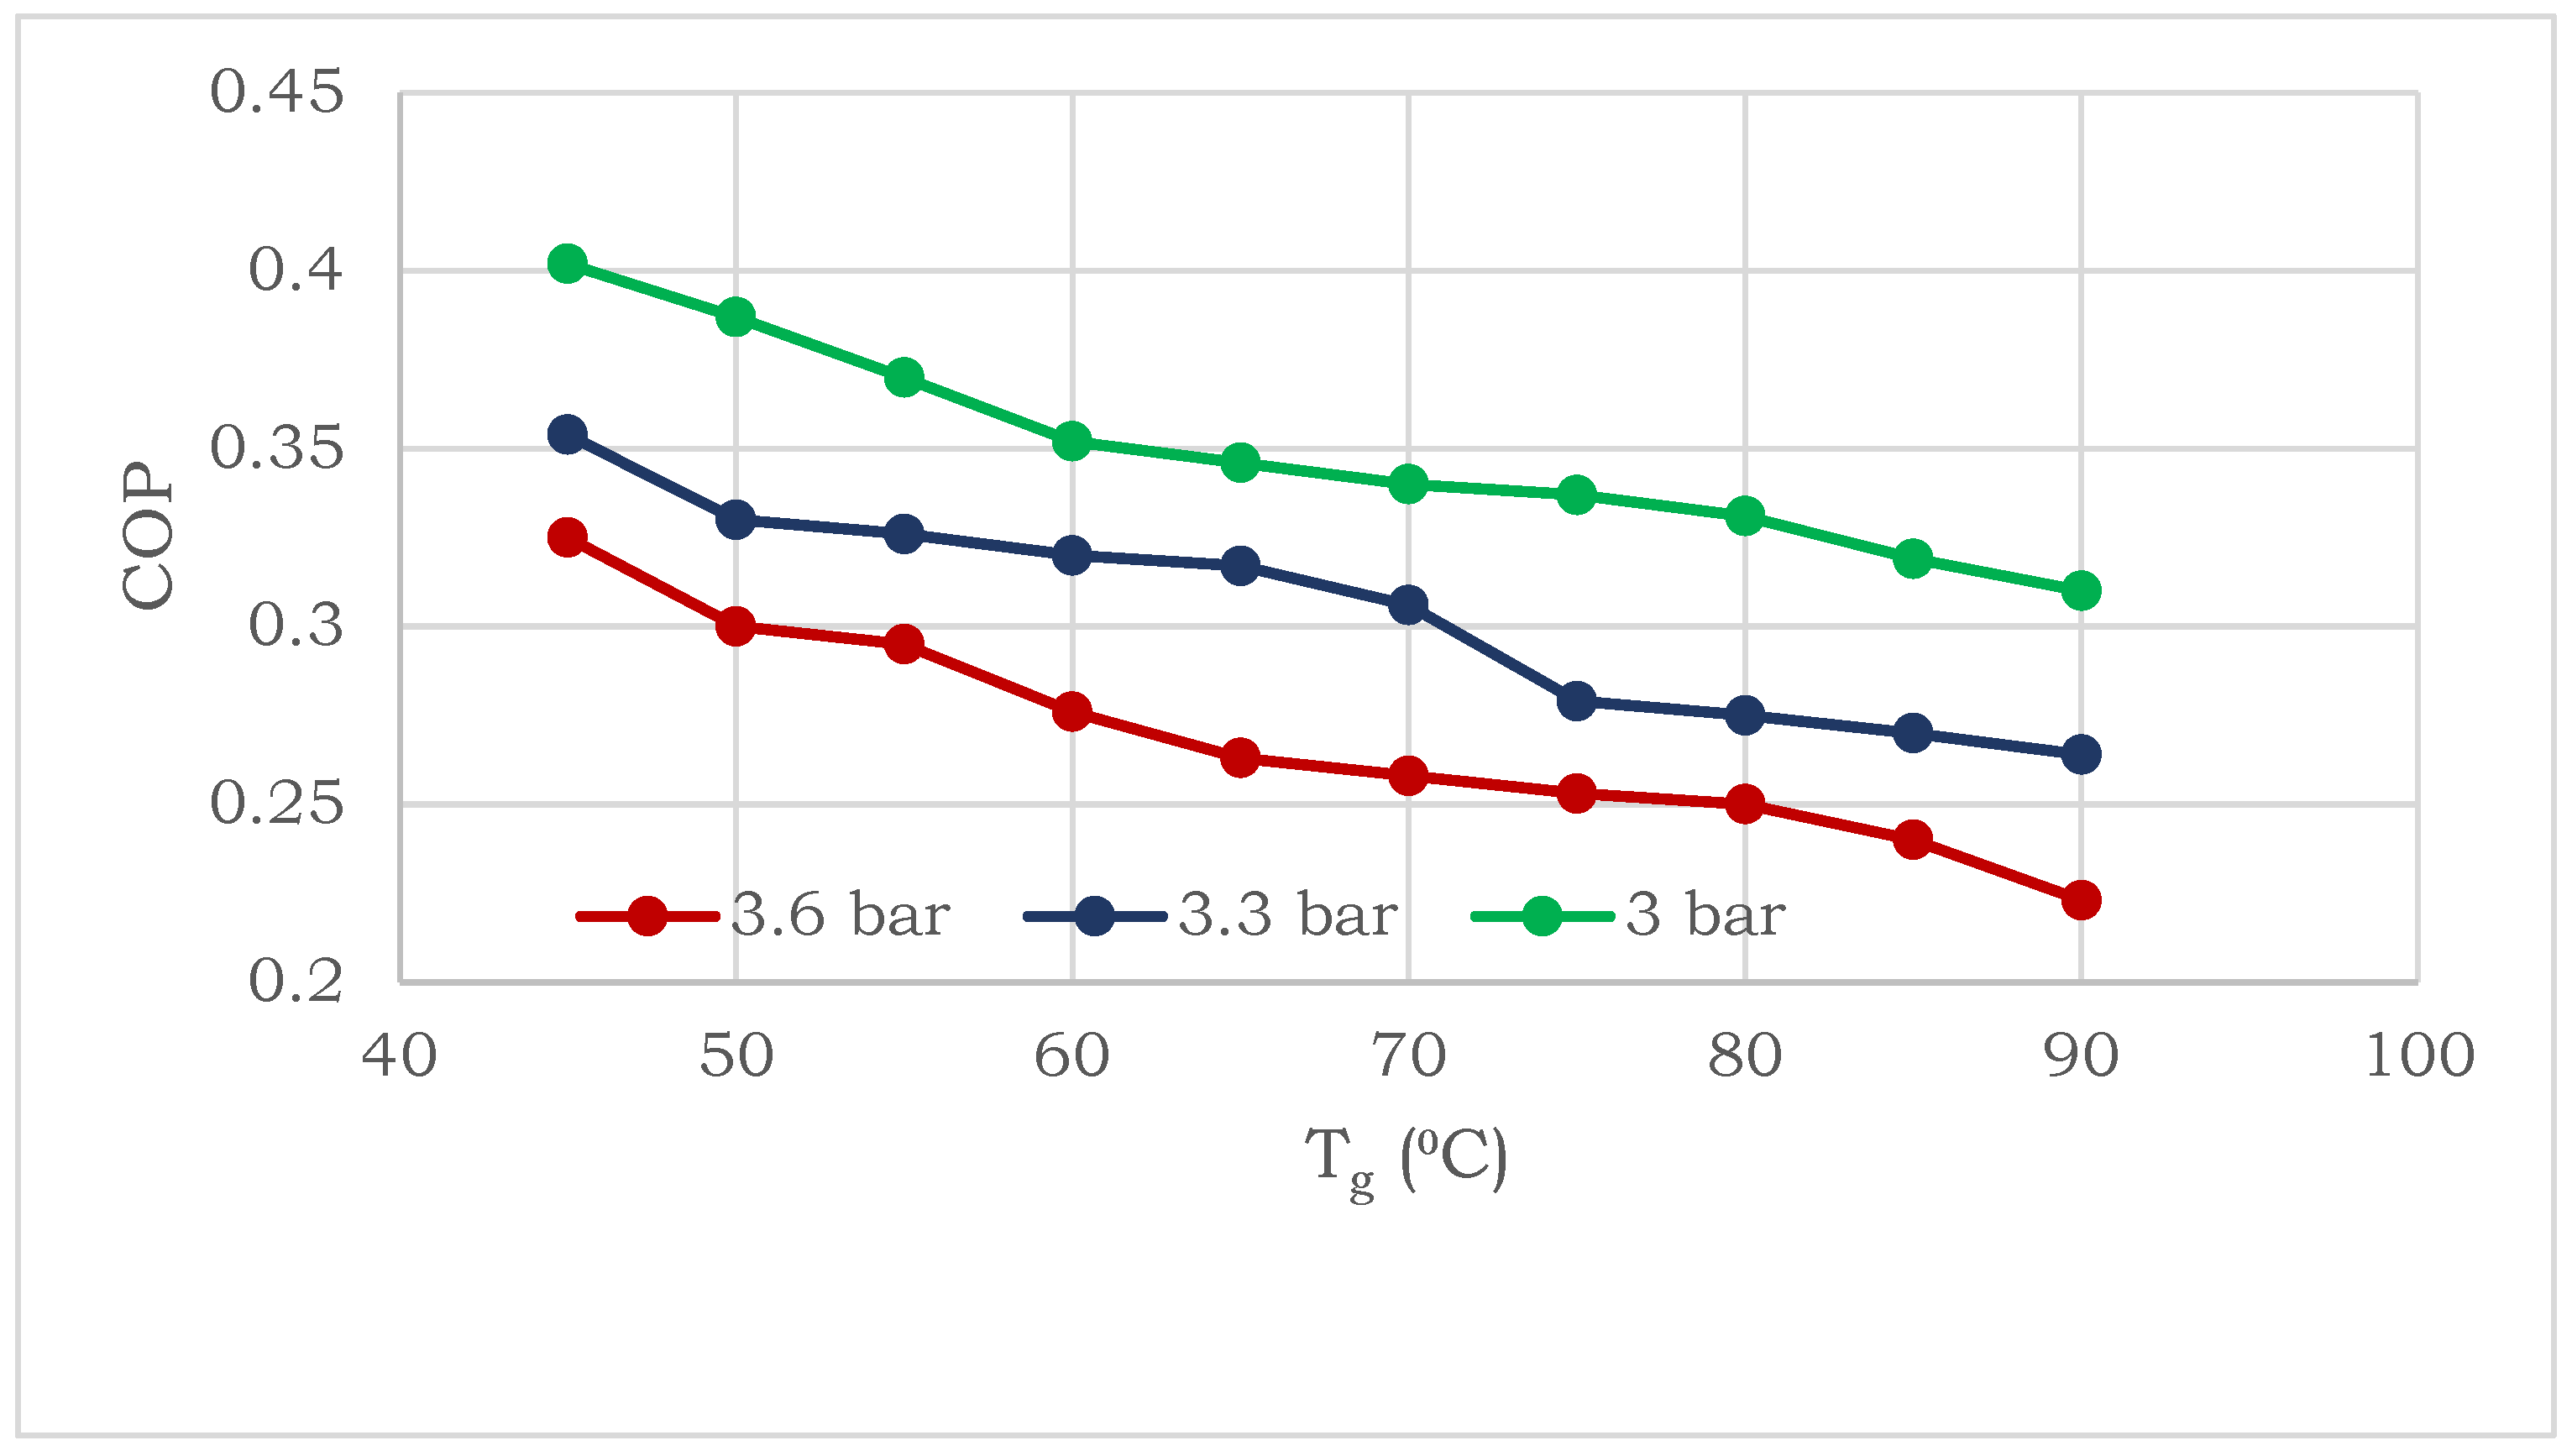
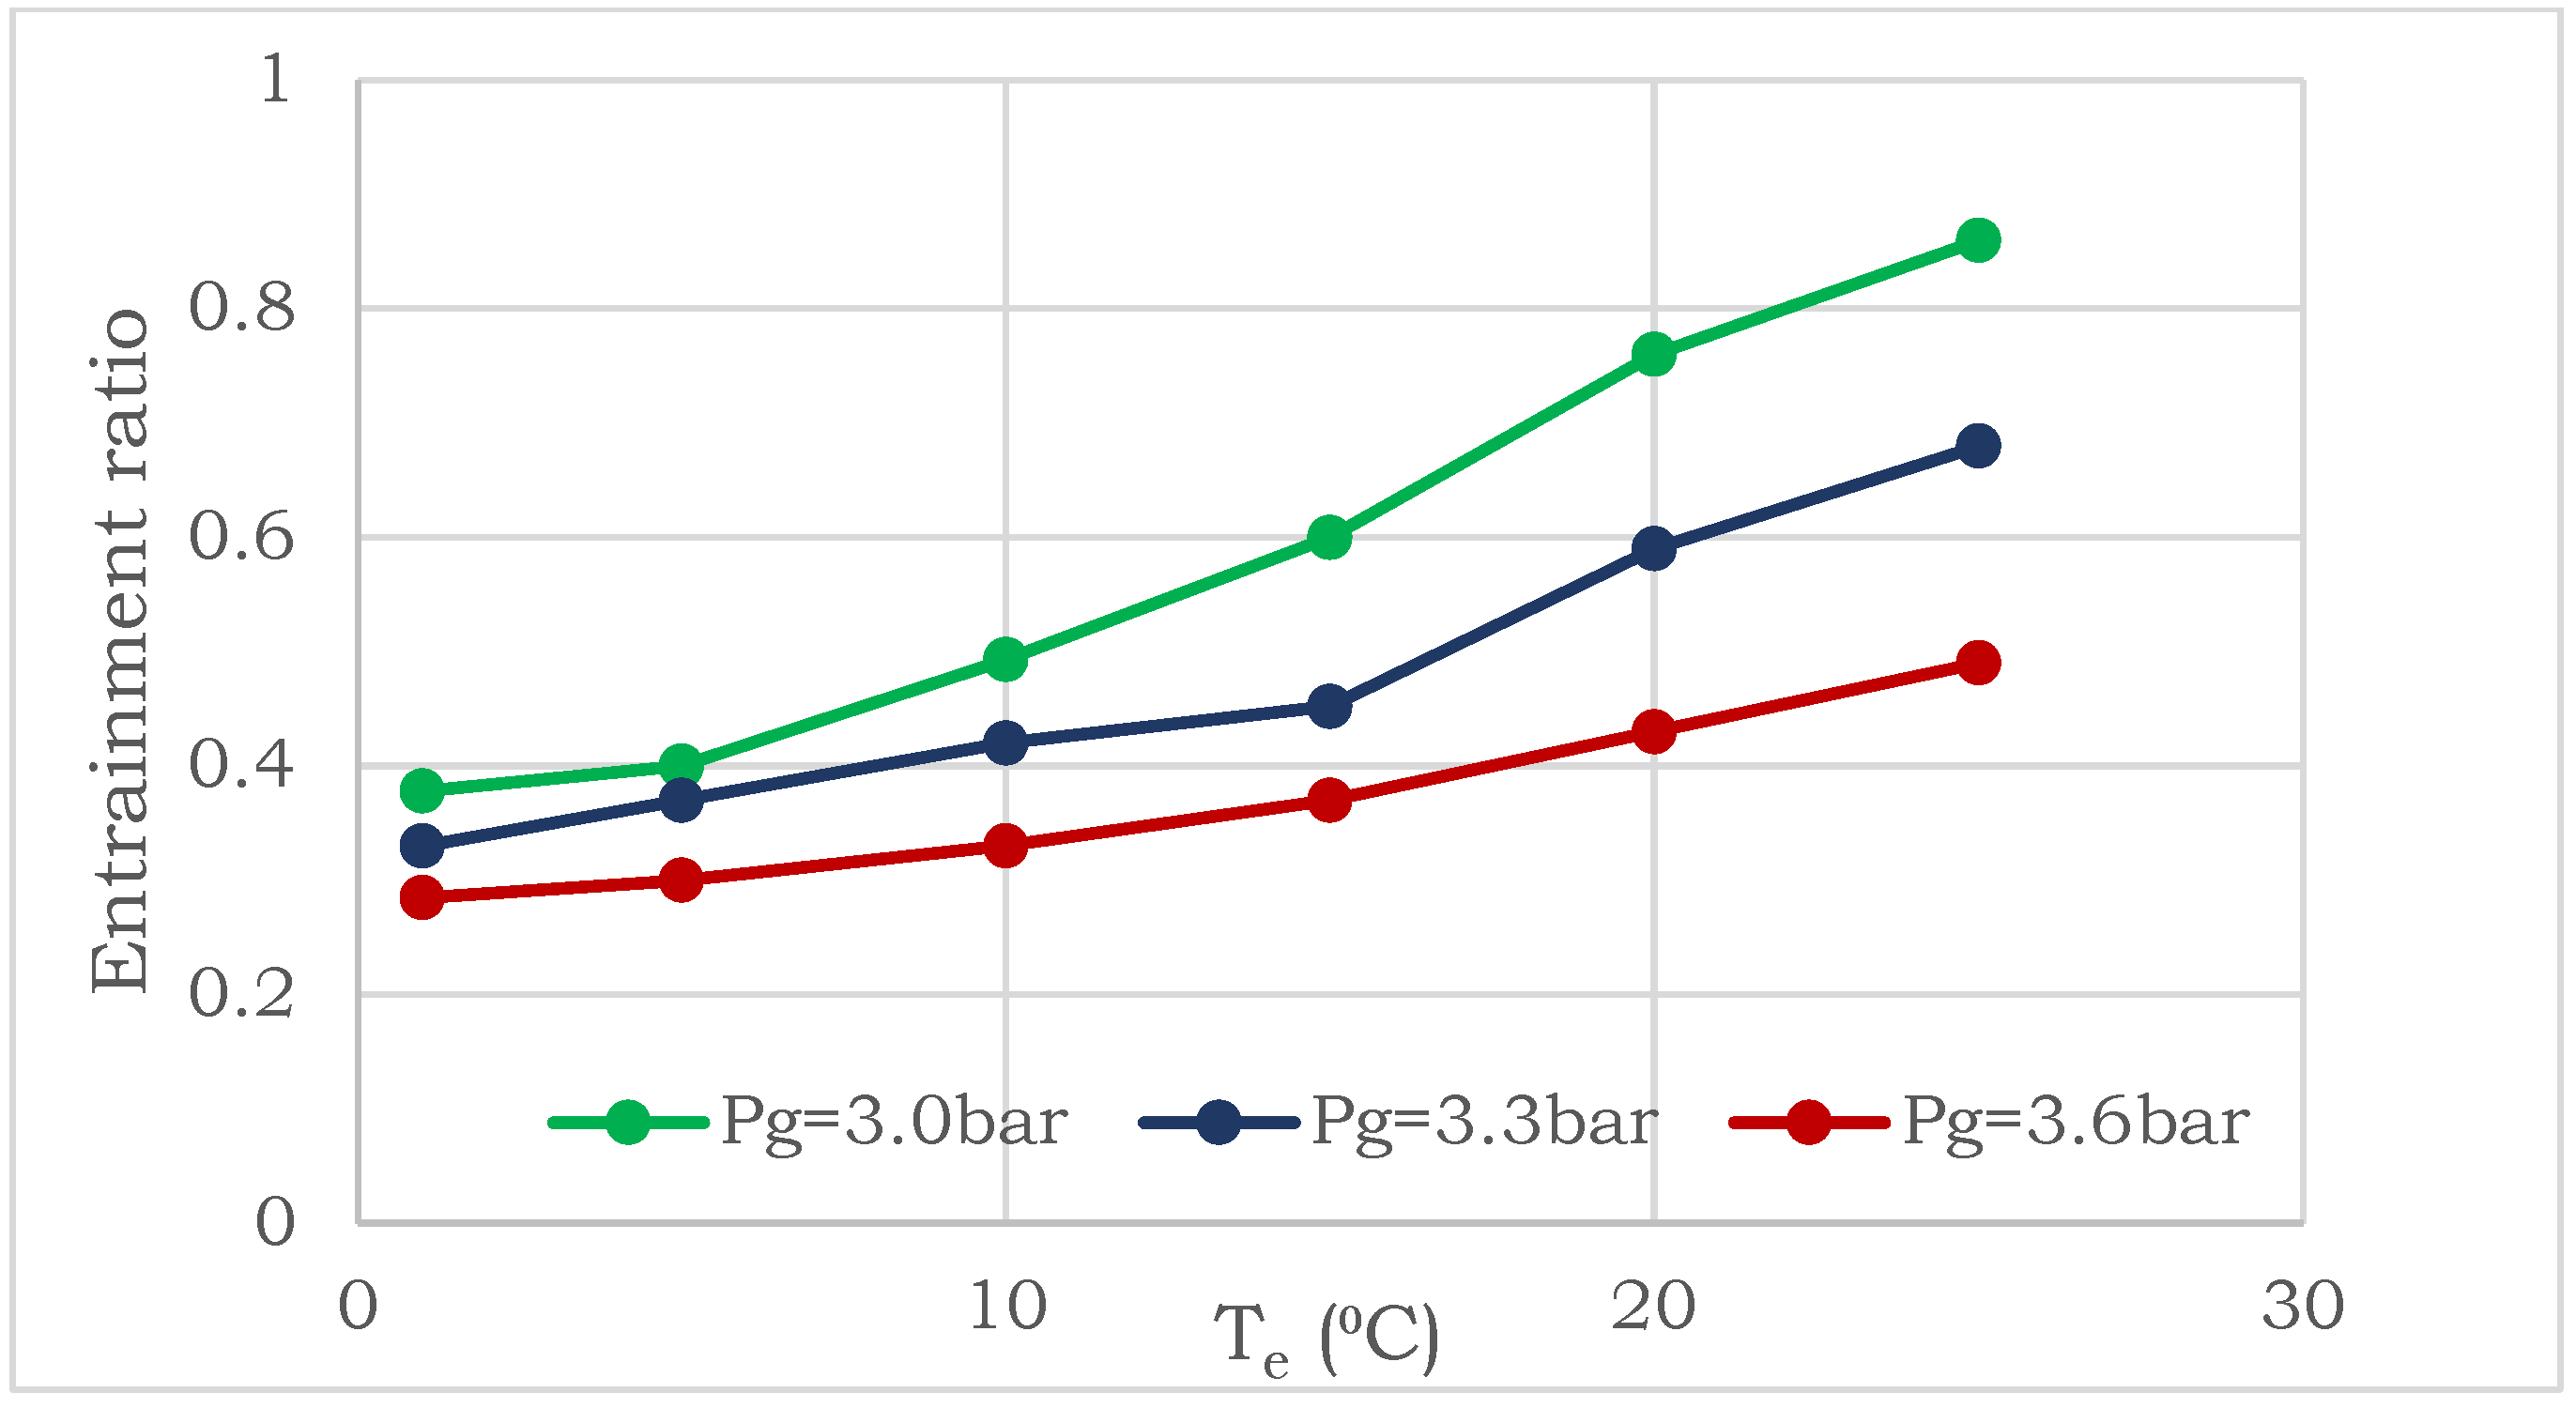
4.1. Sensitivity Energy Analysis

Various area ratios were studied to define the optimum temperature in the generator. The temperature and pressure at the ejector inlet nozzle have high values and produce a suction effect causing more secondary refrigerant flow to be entrained as the generator temperature is increased. This is accompanied by an increase in COP, reaching a maximum value of 0.209 at the optimum generator temperature of 73 °C. When the generator temperature continues to rise, the COP begins to fall because there is no corresponding increase in primary mass flow due to choking conditions in critical operating mode at the ejector nozzle. As a result, a constant refrigerant mass flow prevails, which keeps the cooling capacity constant with increasing the heat input. Thus, the COP decreases. The driving pressure difference between the evaporator and the nozzle exit increases as Tg increases, which increases both COP and entrainment ratio. As Tg rises, so does the critical back pressure. This increase causes the thermodynamic shock wave to move to the mixing chamber, preventing clogging of the secondary flow. As the back pressure increases, the flow through the nozzle becomes slower, and the secondary stream stops because the ejector stops working properly, and the direction of the primary flow will be reversed back to the evaporator. At the downstream of the diffuser section, a thermodynamic shock wave occurs, and thus the secondary pressure rises, and as the evaporator pressure rises, so does the critical back pressure. Figure 4 depicts the effect of evaporator temperature on the performance in Tg = 73 °C and Ta = 38 °C operating conditions. The system COP and driving pressure difference increase rapidly as Te increases.
The ejector’s area ratio rises as the generator temperature increases, as shown in Figure 5. This is because as the generator temperature rises, so does the generator pressure, resulting in enhanced ejector entrainment at constant condenser and evaporator temperatures. More secondary flow can be entrained into the ejector once the area ratio is increased. The area ratio increases can be doubled for every 50 °C increase in the generator temperature.
The optimum Tg for a given area ratio can be estimated if the temperature and pressure of the condenser and evaporator are known. To ensure that the ejector operates under critical choking conditions, the condenser temperature, Tc, is set to 38 °C. Since the ejector back pressure is equal to the pressure of condensation, the condenser temperature affects the ejector’s mode of operation. As the generator temperature approaches its optimum value, the system COP will be maximum COP. As the spindle position changes during time, the primary pressure and mass flow rate change accordingly, as shown in Figure 6. The refrigerant mass flow rate increases with the increase in the spindle movement, allowing more refrigerant to pass at reduced pressure. This will lead to an increase in the COP.
The primary operating parameters selected for this analysis are the generator pressure, and evaporator and generator temperatures. Figure 7 shows the relationship between the generator temperature and the entrainment ratio. It is noted that as the generator temperature increases, the entrainment ratio increases as well. The reason for this increase is due to the increase in the primary flow temperature, which increases its energy and leads to an increase in the flow speed in the suction chamber, and more secondary flow is entrained.
Figure 8 depicts the COP values in relation to generator temperature at various generator pressures. The heat delivered from the solar field causes the generator temperature to rise and the COP to decrease. As Tg increases, the entrainment ratio will increase, and because of the increased rate of heat addition, the COP decreases.
As can be seen from Figure 9, the entrainment ratio increases as the temperature of the evaporator increases. The entrained flow’s kinetic energy increases, which lead to an increase in the suction efficiency of the ejector. At a predetermined generator pressure, the primary flow rate is choked.
Figure 10 shows that as the evaporator temperature rises, so does the COP of the ejector cooling cycle. It is also clear that the range of the COP increases as the generator pressure decreases.

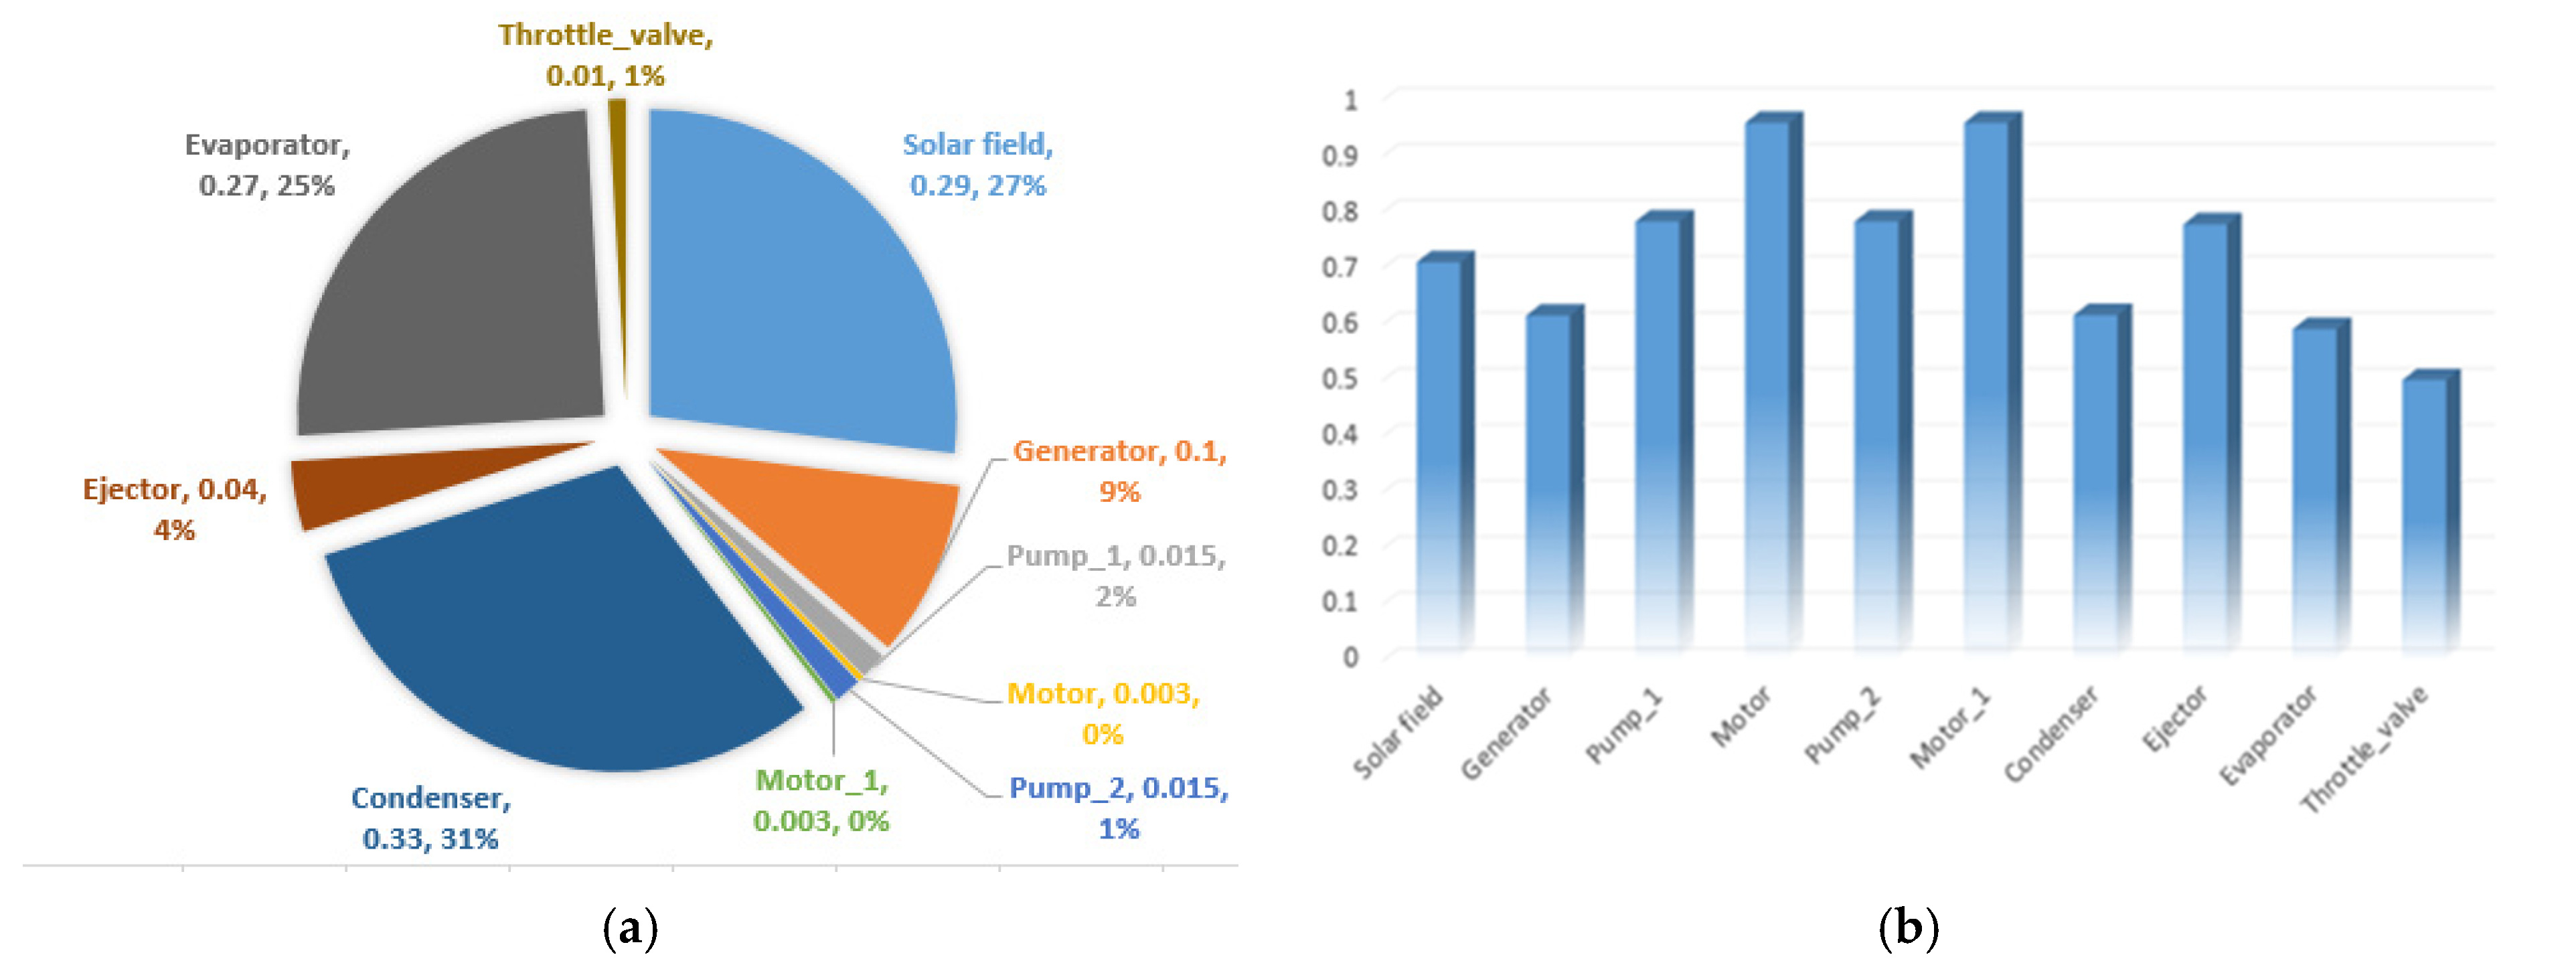
4.2. Exergy Analysis

The data of the specific physical exergies (Table 2) were used to calculate the value of the exergy destruction within system components via applying the exergy balances (Equation (8)). These data and corresponding exergy destruction ratios (Equation (10)) are shown in Figure 11a as well as the exergy efficiencies (Equation (9)) are shown in Figure 11b. The definitions of the fuel and product for the solar collectors can be found in [39,40], and for the ejector in [40].
The results demonstrate that the highest exergy destruction and associated low exergetic efficiencies are associated with the heat exchangers.
The effect of the autonomous variable geometry ejector on the system performance as the generator temperature changes is reported in Figure 12. The higher the temperature within the generator, the higher the performance of the entire system is observed.
From Figure 12 it can be noticed that the overall exergy efficiency can be increased for a fixed generator temperature. Up to a certain point, increasing the ejector area ratio increases efficiency before drastically decreasing again. The significant reduction can be attributed to flow breakdown, as a mixture of primary and secondary streams would be very turbulent at larger area openings. To improve system performance, an ejector refrigeration system can be automated so that the nozzle opening can be regulated using a temperature sensor connected to the generator.
Figure 13 shows the variation in the system’s exergetic efficiency as a function of the ejector area ratio for different generator temperatures. It can be seen that the highest exergetic efficiency could be obtained at the optimum value of the generator temperature. Yet, the maximum efficiencies are observed at an area ratio of 0.75.

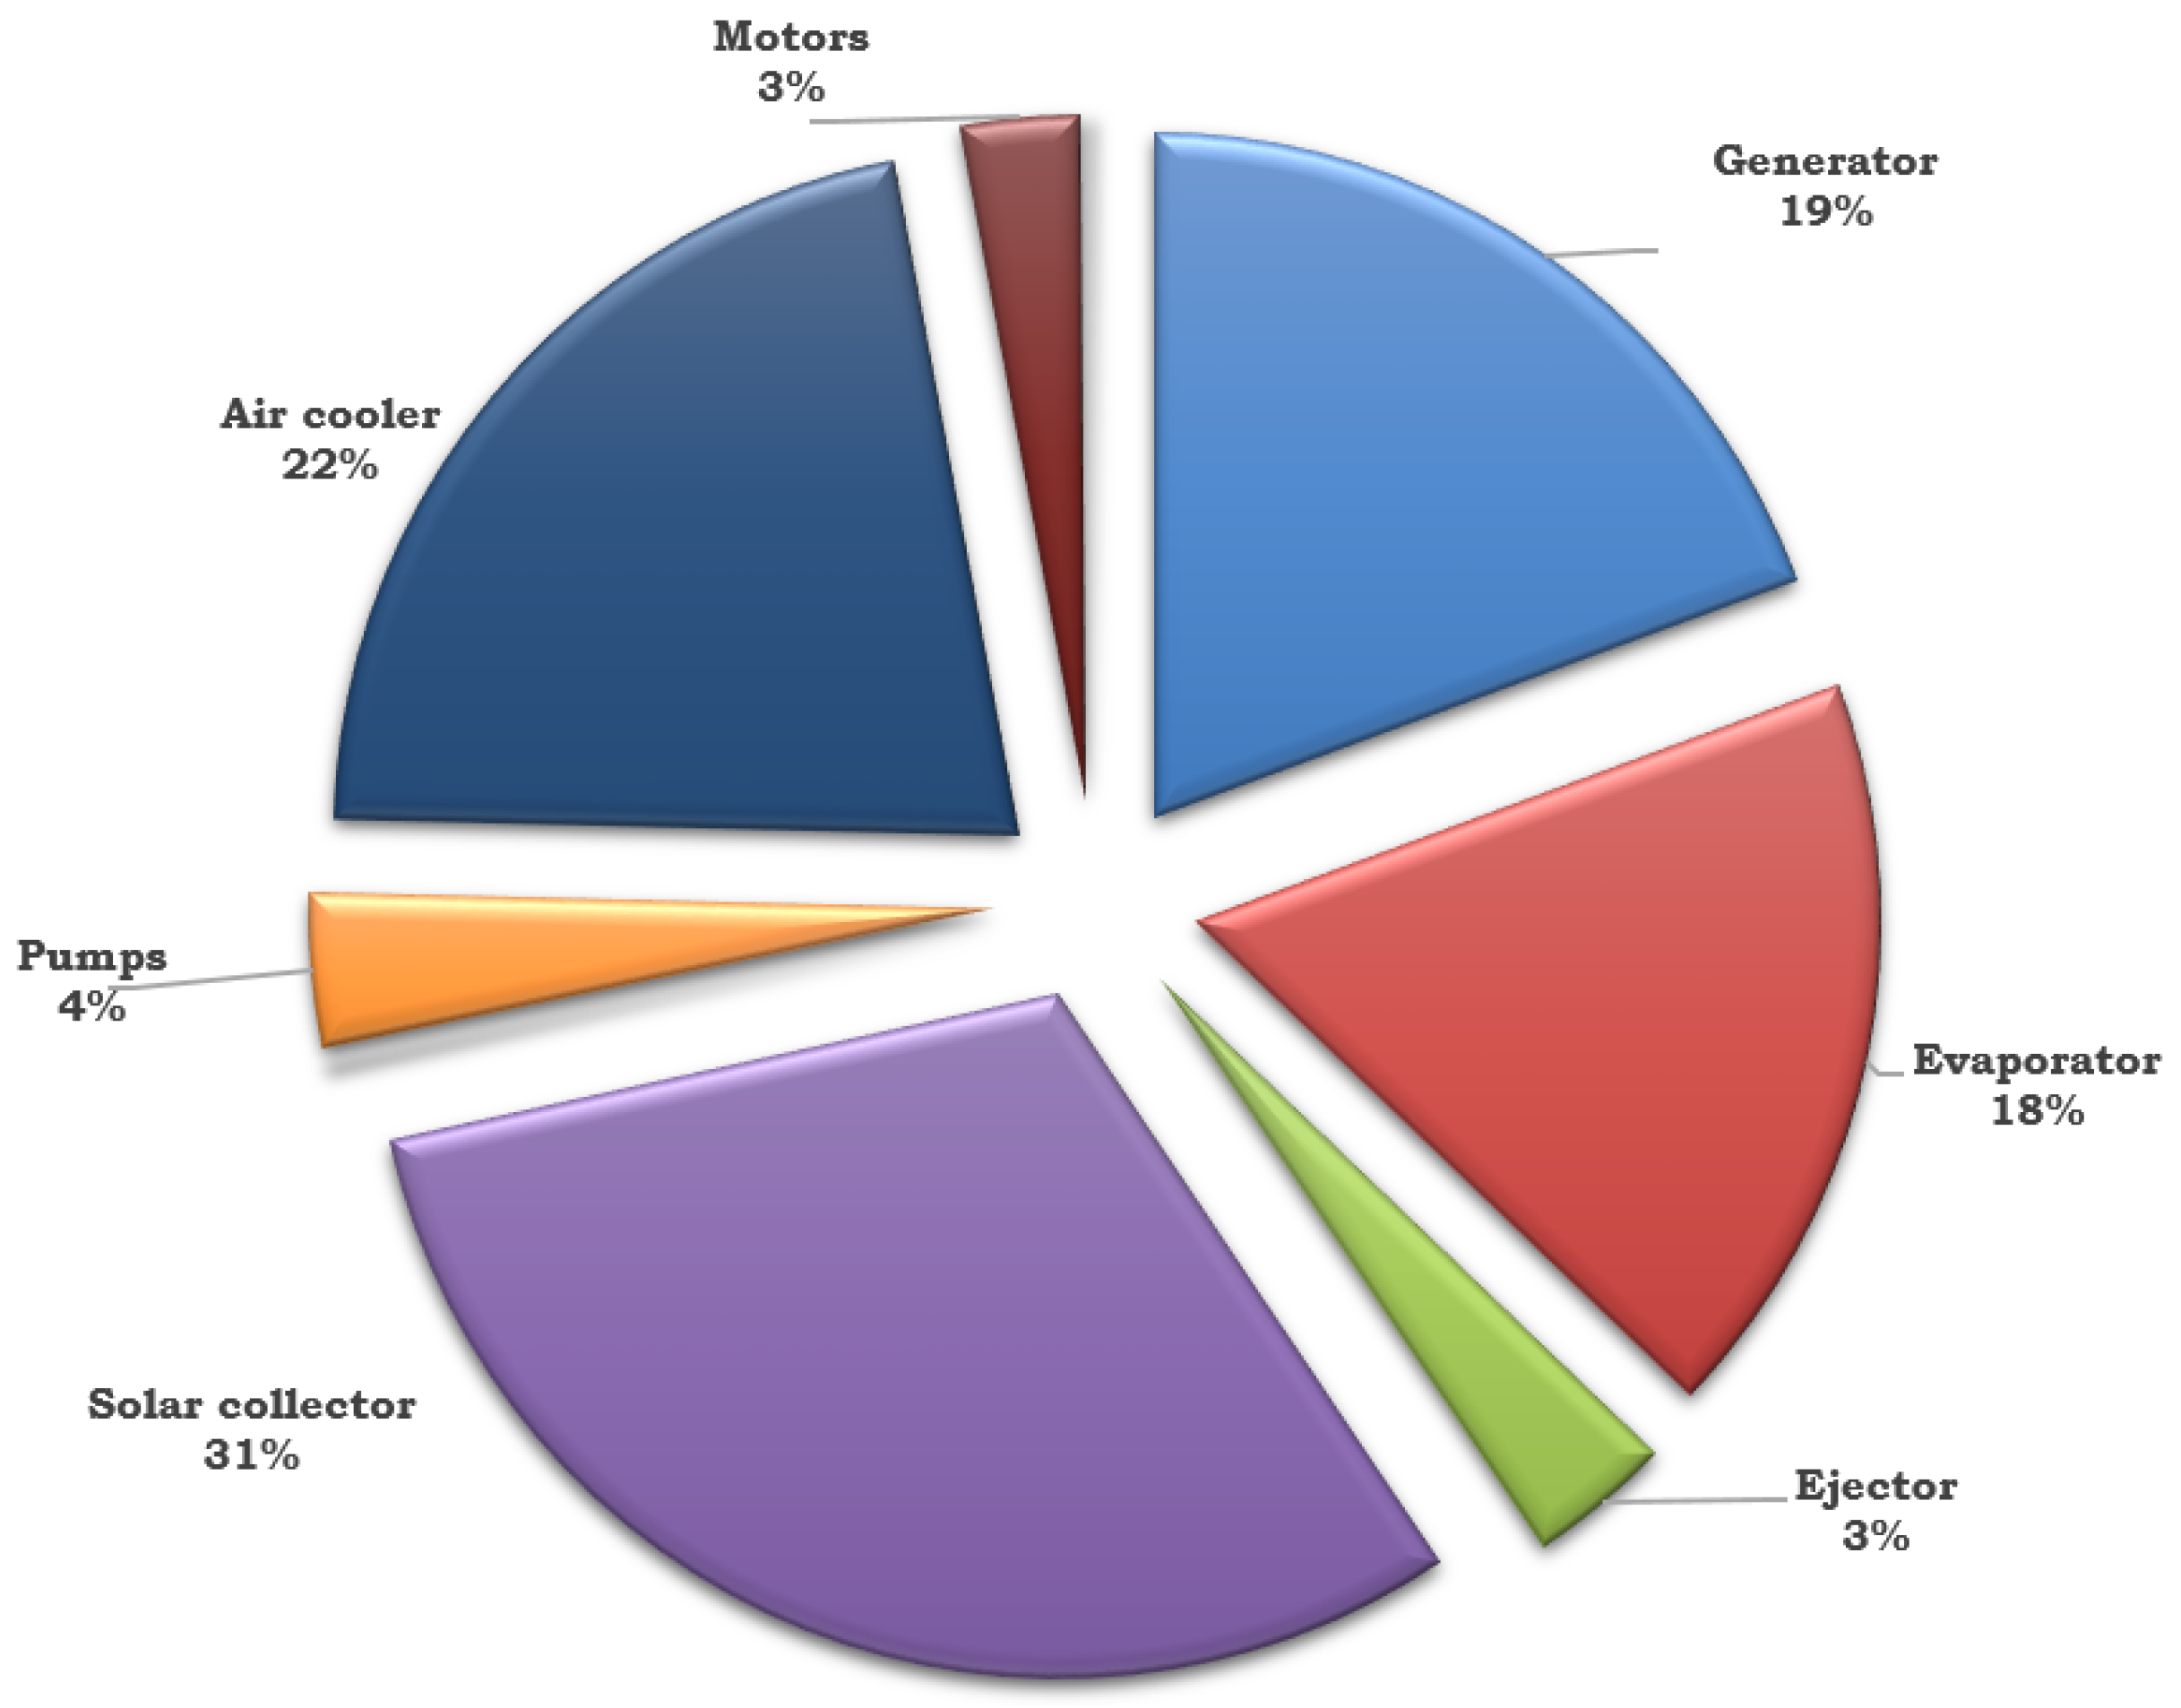
4.3. Economic Analysis

For conducting the economic analysis, the following parameters were assumed:
Parameters assumed for the economic analysis are plant life ( n )-15 years; effective interest rate ( i e f f )-10%; average general inflation rate for fuel (rFC) is zero because of solar energy; average general inflation rate for OMC (rOMC) 2.5%, and total annual operation time −7500 hr./a. The calculated levelized total capital investment is 2251.34 $/h, and the levelized cost of the product is 0.009 $/kWh. Figure 14 shows the distribution of the total capital investment. The evaporator, generator, air cooler, and solar system accounted for 90% of the system cost, whereas the ejector, pumps, and motors accounted for 10%.

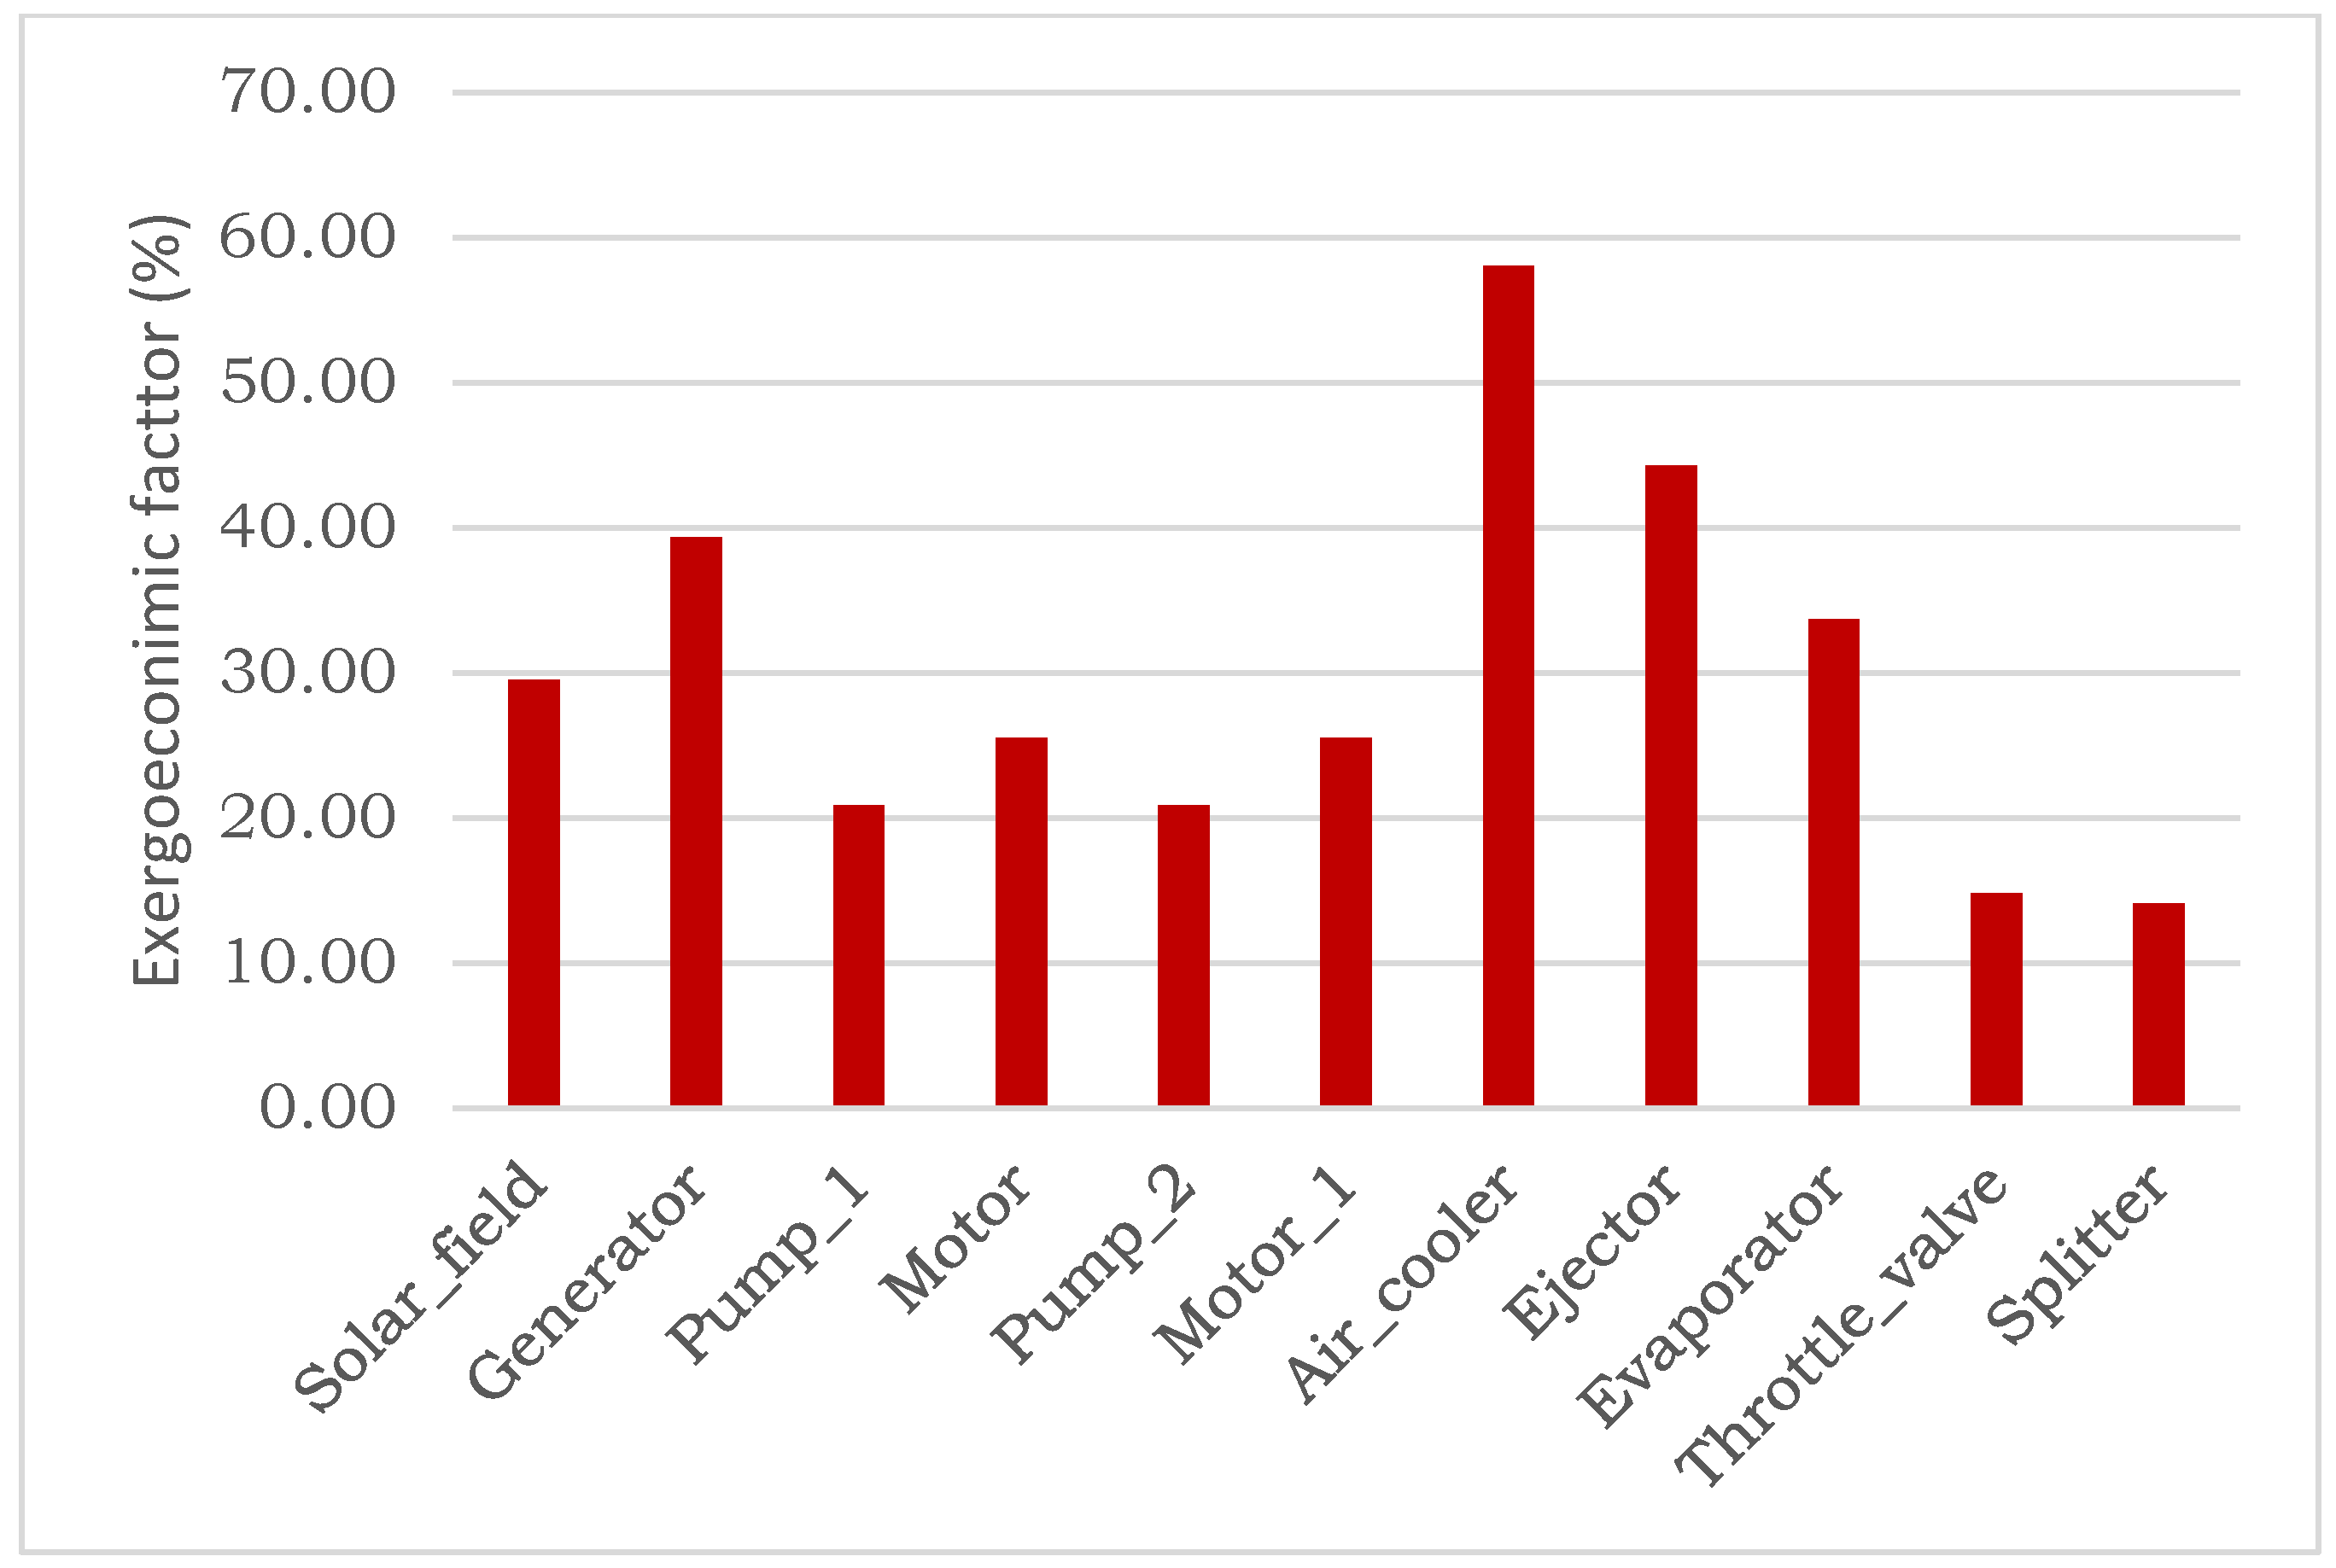
4.4. Exergoeconomic Analysis

The main results obtained from the exergoeconomic analysis are reported in Figure 15 and Figure 16. The values Zk and CD,k for each system component and corresponding exergoeconomic factors (fk) demonstrate that the heat exchangers require improvement thermodynamically with the expenses of the capital investment cost, i.e., the values of Zk should be increased and CD,k decreased.

5. Conclusions

The ejector refrigeration cycle is subjected to thermodynamic modeling, simulation, energy, exergy, economic and exergoeconomic analyses, in addition to various sensitivity studies in order to provide useful information on design specifications. The entrainment ratio, spindle position, and COP were used for the system performance analysis, while the effect of the area ratio on system performance was investigated. The COP and entrainment ratio are two complex functions of inlet temperature, back pressure, and flow path geometry. It is also worth noting that different spindle positions can yield higher COP values due to differences in operating conditions. This demonstrates the advantage of using variable geometry over fixed geometry. It is especially important in the study case because solar energy is a volatile and unpredictable source. As a result, the variable geometry design can maintain COP and cooling capacities even when the generator temperature varies. It was found that the system’s coefficient of performance increased with the decrease in the generator pressure and increase in the evaporator temperature. It reached a value of 0.45 at a generator pressure of 3 bars and an evaporator temperature of 20 °C. Furthermore, it was noticed that the overall exergy efficiency increased as the generator temperature increased and approached a constant value of 21% for a generator temperature of 85 °C, while increasing the ejector area ratio. A value of 21% exergetic efficiency was recorded for the system. The exergoeconomic analysis of the system demonstrated that heat exchangers require improvement thermodynamically at the expense of the capital investment cost. The economic analysis revealed that the calculated levelized total capital investment is 2251.34 $/h, and the levelized cost of the product is 0.009 $/kWh.

Supplementary Materials

The following supporting information can be downloaded at: https://www.mdpi.com/article/10.3390/en15249540/s1.

Author Contributions

I.S.: Software; Investigation. B.T.: Methodology; Investigation; Writing the original draft. T.M.: Reviewing and Editing; Supervision. All authors have read and agreed to the published version of the manuscript.

Funding

This research received no external funding.

Data Availability Statement

Not applicable.

Conflicts of Interest

The authors declare no conflict of interest.

References

  1. Petinrin, J.; Shaaban, M. Renewable energy for continuous energy sustainability in Malaysia. Renew. Sustain. Energy Rev. 2015, 50, 967–981. [Google Scholar] [CrossRef]
  2. Li, G.; Li, M.; Taylor, R.; Hao, Y.; Besagni, G.; Markides, C. Solar energy utilisation: Current status and roll-out potential. Appl. Therm. Eng. 2022, 209, 118285. [Google Scholar] [CrossRef]
  3. Cao, X.; Dai, X.; Liu, J. Building energy-consumption status worldwide and the state-of-the-art technologies for zero-energy buildings during the past decade. Energy Build. 2016, 128, 198–213. [Google Scholar] [CrossRef]
  4. Alnuaimi, A.; Natarajan, S.; Kershaw, T. The comfort and energy impact of overcooled buildings in warm climates. Energy Build. 2022, 260, 111938. [Google Scholar] [CrossRef]
  5. Aidoun, Z.; Ameur, K.; Falsafioon, M.; Badache, M. Current Advances in Ejector Modeling, Experimentation and Applications for Refrigeration and Heat Pumps. Part 1: Single-Phase Ejectors. Inventions 2019, 4, 15. [Google Scholar] [CrossRef] [Green Version]
  6. Besagni, G.; Mereu, R.; Inzoli, F. Ejector refrigeration: A comprehensive review. Renew. Sustain. Energy Rev. 2016, 53, 373–407. [Google Scholar] [CrossRef] [Green Version]
  7. Tashtoush, B.M.; Al-Nimr, M.A.; Khasawneh, M.A. A comprehensive review of ejector design, performance, and applications. Appl. Energy 2019, 240, 138–172. [Google Scholar] [CrossRef]
  8. Chen, X.; Omer, S.; Worall, M.; Riffat, S. Recent developments in ejector refrigeration technologies. Renew. Sustain. Energy Rev. 2013, 19, 629–651. [Google Scholar] [CrossRef]
  9. Riaz, F.; Lee, P.S.; Chou, S.K. Thermal modelling and optimization of low-grade waste heat driven ejector refrigeration system incorporating a direct ejector model. Appl. Therm. Eng. 2019, 167, 114710. [Google Scholar] [CrossRef]
  10. Yu, W.; Wang, H.; Ge, Z. Comprehensive analysis of a novel power and cooling cogeneration system based on organic Rankine cycle and ejector refrigeration cycle. Energy Convers. Manag. 2021, 232, 113898. [Google Scholar] [CrossRef]
  11. Hasan, A.; Mugdadi, B.; Al-Nimr, M.A.; Tashtoush, B. Direct and indirect utilization of thermal energy for cooling generation: A comparative analysis. Energy 2021, 238, 122046. [Google Scholar] [CrossRef]
  12. Atmaca, A.U.; Erek, A.; Ekren, O. Impact of the mixing theories on the performance of ejector expansion refrigeration cycles for environmentally-friendly refrigerants. Int. J. Refrig. 2018, 97, 211–225. [Google Scholar] [CrossRef]
  13. Yapıcı, R.; Ersoy, H. Performance characteristics of the ejector refrigeration system based on the constant area ejector flow model. Energy Convers. Manag. 2005, 46, 3117–3135. [Google Scholar] [CrossRef]
  14. Kumar, V.; Singhal, G.; Subbarao, P. Realization of novel constant rate of kinetic energy change (CRKEC) supersonic ejector. Energy 2018, 164, 694–706. [Google Scholar] [CrossRef]
  15. Chen, W.; Shi, C.; Zhang, S.; Chen, H.; Chong, D.; Yan, J. Theoretical analysis of ejector refrigeration system performance under overall modes. Appl. Energy 2017, 185, 2074–2084. [Google Scholar] [CrossRef]
  16. Hou, Y.; Chen, F.; Zhang, S.; Chen, W.; Zheng, J.; Chong, D.; Yan, J. Numerical simulation study on the influence of primary nozzle deviation on the steam ejector performance. Int. J. Therm. Sci. 2022, 179, 107633. [Google Scholar] [CrossRef]
  17. Ünal, S.; Yilmaz, T. Thermodynamic analysis of the two-phase ejector air-conditioning system for buses. Appl. Therm. Eng. 2015, 79, 108–116. [Google Scholar] [CrossRef]
  18. Van Nguyen, V.; Varga, S.; Soares, J.; Dvorak, V.; Oliveira, A.C. Applying a variable geometry ejector in a solar ejector refrigeration system. Int. J. Refrig. 2020, 113, 187–195. [Google Scholar] [CrossRef]
  19. Tashtoush, B.; Nayfeh, Y. Energy and economic analysis of a variable-geometry ejector in solar cooling systems for residential buildings. J. Energy Storage 2019, 27, 101061. [Google Scholar] [CrossRef]
  20. Chen, W.; Huang, C.; Bai, Y.; Chong, D.; Yan, J.; Liu, J. Experimental and numerical investigation of two phase ejector performance with the water injected into the induced flow. Int. J. Adv. Nucl. React. Des. Technol. 2020, 2, 15–24. [Google Scholar] [CrossRef]
  21. Li, C.; Li, Y.; Cai, W.; Hu, Y.; Chen, H.; Yan, J. Analysis on performance characteristics of ejector with variable area-ratio for multi-evaporator refrigeration system based on experimental data. Appl. Therm. Eng. 2014, 68, 125–132. [Google Scholar] [CrossRef]
  22. Tashtoush, B.; Algharbawi, A.B.R. Parametric study of a Novel Hybrid Solar Variable Geometry Ejector cooling with Organic Rankine Cycles. Energy Convers. Manag. 2019, 198, 111910. [Google Scholar] [CrossRef]
  23. Goetzler, W.; Guernsey, M.; Young, J.; Fujrman, J.; Abdelaziz, A. The Future of Air Conditioning for Buildings; Technical Report; US Department of Energy: Washington, DC, USA, 2016. [CrossRef] [Green Version]
  24. Salimpour, M.R.; Ahmadzadeh, A.; Al-Sammarraie, A.T. Comparative investigation on the exergoeconomic analysis of solar-driven ejector refrigeration systems. Int. J. Refrig. 2018, 99, 80–93. [Google Scholar] [CrossRef]
  25. Ahmadzadeh, A.; Salimpour, M.R.; Sedaghat, A. Thermal and exergoeconomic analysis of a novel solar driven combined power and ejector refrigeration (CPER) system. Int. J. Refrig. 2017, 83, 143–156. [Google Scholar] [CrossRef]
  26. Farshi, L.G.; Mahmoudi, S.; Rosen, M. Exergoeconomic comparison of double effect and combined ejector-double effect absorption refrigeration systems. Appl. Energy 2012, 103, 700–711. [Google Scholar] [CrossRef]
  27. Rashidi, J.; Yoo, C. Exergy, exergo-economic, and exergy-pinch analyses (EXPA) of the kalina power-cooling cycle with an ejector. Energy 2018, 155, 504–520. [Google Scholar] [CrossRef]
  28. Sadeghi, M.; Mahmoudi, S.; Saray, R.K. Exergoeconomic analysis and multi-objective optimization of an ejector refrigeration cycle powered by an internal combustion (HCCI) engine. Energy Convers. Manag. 2015, 96, 403–417. [Google Scholar] [CrossRef]
  29. MATLAB and Statistics Toolbox Release; The MathWorks, Inc.: Natick, MA, USA, 2021.
  30. Sag, N.B.; Ersoy, H.; Hepbasli, A.; Halkaci, H. Energetic and exergetic comparison of basic and ejector expander refrigeration systems operating under the same external conditions and cooling capacities. Energy Convers. Manag. 2015, 90, 184–194. [Google Scholar] [CrossRef]
  31. Luo, J.; Morosuk, T.; Tsatsaronis, G.; Tashtoush, B. Exergetic and Economic Evaluation of a Transcritical Heat-Driven Compression Refrigeration System with CO2 as the Working Fluid under Hot Climatic Conditions. Entropy 2019, 21, 1164. [Google Scholar] [CrossRef]
  32. Liu, X.; Yang, X.; Yu, M.; Zhang, W.; Wang, Y.; Cui, P.; Zhu, Z.; Ma, Y.; Gao, J. Energy, exergy, economic and environmental (4E) analysis of an integrated process combining CO2 capture and storage, an organic Rankine cycle and an absorption refrigeration cycle. Energy Convers. Manag. 2020, 210, 112738. [Google Scholar] [CrossRef]
  33. Singh, A.; Sarkar, J.; Sahoo, R.R. Experimental energy, exergy, economic and exergoeconomic analyses of batch-type solar-assisted heat pump dryer. Renew. Energy 2020, 156, 1107–1116. [Google Scholar] [CrossRef]
  34. Tsatsaronis, G.; Morosuk, T. Understanding and improving energy conversion systems with the aid of exergy-based methods. Int. J. Exergy 2012, 11, 518–542. [Google Scholar] [CrossRef]
  35. Thongtip, T.; Aphornratana, S. An experimental analysis of the impact of primary nozzle geometries on the ejector performance used in R141b ejector refrigerator. Appl. Therm. Eng. 2017, 110, 89–101. [Google Scholar] [CrossRef]
  36. Ruangtrakoon, N.; Thongtip, T. An experimental investigation to determine the optimal heat source temperature for R141b ejector operation in refrigeration cycle. Appl. Therm. Eng. 2020, 170, 114841. [Google Scholar] [CrossRef]
  37. Saleh, B. Performance analysis and working fluid selection for ejector refrigeration cycle. Appl. Therm. Eng. 2016, 107, 114–124. [Google Scholar] [CrossRef]
  38. Huang, B.J.; Chang, J.M.; Wang, C.P.; Petrenko, V.A. A 1-D analysis of ejector performance. Int. J. Refrig. 1999, 22, 354–364. [Google Scholar] [CrossRef]
  39. Elmorsy, L.; Morosuk, T.; Tsatsaronis, G. Exergy-Based Analysis and Optimization of an Integrated Solar Combined-Cycle Power Plant. Entropy 2020, 22, 655. [Google Scholar] [CrossRef]
  40. Tashtoush, B.; Morosuk, T.; Chudasama, J. Exergy and Exergoeconomic Analysis of a Cogeneration Hybrid Solar Organic Rankine Cycle with Ejector. Entropy 2020, 22, 702. [Google Scholar] [CrossRef]
Figure 1. (a) Schematic of the evaluated system. (b) Schematic of the variable are ejector.
Energies 15 09540 g001aEnergies 15 09540 g001b
Figure 2. Ebsilon Professional screenshot.
Energies 15 09540 g002
Figure 3. Flowchart of the ejector’s calculation process.
Energies 15 09540 g003
Figure 4. COP vs. ejector secondary flow temperature at Tg = 73 °C and Tc = 38 °C operating conditions.
Energies 15 09540 g004
Figure 5. The ejector area ratio vs. generator temperature at Tg = 73 °Cand Tc = 38 °C.
Energies 15 09540 g005
Figure 6. Ejector pressure and mass flow vs. spindle position.
Energies 15 09540 g006
Figure 7. Entrainment ration vs. generator temperature at Te = 5 °C and Ta = 38 °C operating conditions.
Energies 15 09540 g007
Figure 8. COP vs. generator temperature at Te = 5 °C and Tc = 38 °C operating conditions.
Energies 15 09540 g008
Figure 9. Entrainment ratio vs. evaporator temperature at Tg = 73 °C and Ta = 38 °C operating conditions.
Energies 15 09540 g009
Figure 10. COP vs. evaporator temperature at Tg = 73 °C and Ta = 38 °C operating conditions.
Energies 15 09540 g010
Figure 11. The results obtained from the exergy analysis: (a) exergy destruction(kW) and exergy destruction ratio (%) and (b) exergetic efficiency.
Energies 15 09540 g011
Figure 12. Comparison of entrainment ratio and exergy efficiency vs. generator temperature.
Energies 15 09540 g012
Figure 13. Exergy efficiency vs. ejector area ratio at Te = 5 °C and Ta = 38 °C operating conditions.
Energies 15 09540 g013
Figure 14. Distribution of the total capital investment.
Energies 15 09540 g014
Figure 15. Comparison of Z_k and C_D,k for each component.
Energies 15 09540 g015
Figure 16. Exergoeconomic factor of the system’s component.
Energies 15 09540 g016
Table 1. Ejector and entire system specifications.
SpecificationValue
Throat diameter ( d t ) 0.508 mm
Area ratio ( A p 1 / A t ) 2.905
Specific heat ratio ( γ R 141 b ) 1.2
Area ratio ( A 3 / A t ) 4
Primary stream isentropic efficiency ( η p ) 0.95
Sec ondary stream isentropic efficiency ( η s ) 0.85
Frictional losses coefficient of the primary flow ( φ p ) 0.88
Mixed flow frictional losses coefficient ( φ m ) 0.84
Generator pressure ( p g ) 3.6 bar
Generator temperature ( T g ) 75 °C
Evaporator temperature ( T e ) 11.76 °C
Condenser temperature ( T c )33 °C
Table 2. Simulation results of the proposed system.
Stream No.MaterialMass Flow RateTemperaturePressureSpecific
Enthalpy
Specific
Entropy
Specific
Physical Exergy
[kg/s][°C][bar][kJ/kg][kJ/kgK][kJ/kg]
1R141b0.030753.59488.791.862153.24
2R141b0.157120.47236.821.13021.20
3R141b0.187381.03464.161.871126.17
4R141b0.187321.02236.821.12722.02
5R141b0.030321.02236.821.12722.02
6R141b0.030323.60237.081.12732.49
7R141b0.157321.02236.821.12722.02
8R141b0.157120.47236.821.13021.21
9Water17.966853.50355.751.133046.17
10Water17.966853.50356.171.134246.27
11Water17.966853.50355.751.133046.17
12Water15.000301.00125.830.43686.43
13Water15.000221.0093.580.32903.61
14Air21.194292.0029.156.683154.76
15Air21.194312.0031.166.689854.96
Table 3. Model results validation.
T g
[°C]
T c
[°C]
A 3 A t ω
ExpHuang et al. [38]Present ModelExpHuang et al. [38]Present Model
9531.310.6410.8710.330.43770.46270.4412
9533.09.839.679.420.39370.37740.3876
9533.69.419.299.350.34570.34760.3398
9534.29.178.899.110.35050.32530.3298
9536.38.288.578.640.28140.29830.2954
9537.18.258.128.260.29020.26580.2733
9538.87.267.278.090.22730.20780.2165
9538.67.737.387.430.25520.21440.2232
9541.06.777.057.110.20430.19190.2041
9542.16.446.556.940.18590.15540.1763
9031.59.419.289.340.44460.41780.4413
9033.88.288.538.610.34880.35520.3461
9036.77.737.037.530.30400.23950.2976
9037.56.996.656.810.27180.20930.2103
9038.96.446.746.430.22460.21560.2231
8428.09.419.349.380.53870.52150.5406
8430.58.288.688.760.42140.46050.4377
8432.37.737.687.810.38830.37040.3713
8433.66.996.996.830.31170.30420.3111
8435.56.446.796.500.28800.28800.2792
7824.49.419.929.870.62270.69440.6532
7826.98.288.978.830.48890.59660.4679
7829.17.737.647.810.43930.46090.4599
7829.56.997.487.320.39220.44220.4274
7832.56.446.626.440.32570.35250.3179
Publisher’s Note: MDPI stays neutral with regard to jurisdictional claims in published maps and institutional affiliations.

