1. Introduction
Today, green and efficient is the mainstream direction of energy development. Although the integrated energy system (IES), which can coordinate and optimize the dispatch of multiple energy sources, improve the efficiency of energy utilization, and promote the consumption of renewable energy has been vigorously developed, it also brings some difficulties and challenges [
1], at the same time.
Since people are no longer satisfied with a single type of energy supply, and the energy demand is developing toward diversification, IES is becoming more and more complex, with different available types of renewable energy supply systems. For IES with complex multi-energy coupling, Zeng et al. [
2] proposed a typical physical architecture of IES and mathematical modeling of various types of devices. However, the separate modeling of electric, thermal, and gas systems and components is challenging to represent the multi-energy coupling in a unified way, and there are knowledge barriers between different disciplines. For this reason, some scholars have proposed the unified energy path theory to unify the grid, heat, and gas network equations in mathematical form [
3,
4,
5,
6,
7]. However, the unified energy path model is based on partial differential equations for analytical derivation, which is difficult to model and computationally intensive. In addition to the unified energy path theory, there are also modeling approaches based on the energy hub (EH) for unified modeling. The concept of EH was first proposed in [
8], and then the standardized matrix modeling method based on EH was proposed in [
9]. Tianhao et al. [
10] proposed the standardized multi-step modeling method and the linearized optimization method. The modeling method based on EH can describe various energy conversion relationships of IES using coupling matrices, but it has not been well applied in complex IES.
Moreover, there are momentary distribution characteristics of renewable energy output, such as the curve of solar power generation, which is the “hump” type, and the curve of wind power generation, which is the “saddle” type. Additionally, inadequate system peaking capacity will lead to many energy abandonment phenomena, improving the peaking capacity to enhance the flexibility of the IES. Therefore, scholars from various countries have conducted a lot of research around different energy storage methods for optimal system dispatch [
11,
12,
13,
14,
15]. In the literature [
11,
12,
13], heat and cold storage is carried out through combined heat and cold power generation, in [
14], pumped hydro energy storage is carried out through reservoirs, and in [
15], battery storage is carried out through vehicle to grid systems, for the optimal dispatch of renewable energy systems. The development of power to gas (P2G) technology can convert electrical energy, which is difficult to store in large quantities, into gas energy, which is easy to store and can consume more renewable energy, which falls in line with the concept of green energy development [
16,
17,
18,
19,
20]. For the application of P2G technology, Cui et al. [
21] introduced a two-stage operation of P2G to optimize the thermoelectric coupling and improve the energy utilization of the system. Liu et al. [
22] applied the P2G technology to an integrated electric cooling and heating energy system to improve the renewable energy consumption capacity of the system. Lili et al. [
23] used the P2G technology to convert excess renewable energy generation into methane as storage to reduce the system’s uncertainty risk caused by intermittent wind and solar energy. Although the positive effects of P2G on the system are reflected in the above studies, there is a common problem. In fact, only the economic benefits of P2G consumption on system operating costs are considered, while the impact of equipment installation costs on system economics is neglected, resulting in a large installed capacity and low overall utilization of P2G equipment. In the literature [
21,
22], the P2G equipment only operates at a high load during certain hours of the night and does not work most of the time, showing the “tip” characteristic. In [
23], the P2G equipment works during the daytime and hardly works at night, showing the “peak” characteristic. This operating characteristic is determined by combining renewable energy output within the IES and customer energy demand.
With the further development of IES, there will be multiple parks integrated energy systems (PIESs) with different attributes in the same regional distribution system, forming a regional integrated energy system group (RIESG). Each park’s renewable energy resources and energy demand vary, resulting in a shortage or surplus of renewable energy generation capacity in the system. In order to ensure the energy demand of users, parks with insufficient power supply require purchasing power from the grid to make up for the shortage. For parks with a surplus power supply, some of them meet the grid connection conditions and sell power to the grid, which leads to frequent power sales to the grid and affects the stable operation of the grid. As the renewable energy, which is disconnected from the grid, cannot be consumed, resources are wasted. For the study of RIESG, Li et al. [
24] proposed an optimal scheduling strategy, based on the demand response and master-slave game, which improves the overall economy of the system, and considers the competitive relationship among the parks without considering the cooperative relationship of each park in the region, and fails to reflect the advantages of RIESG scheduling. Luo et al. [
25] proposed an optimization model based on the cooperative game, which mainly solves the problem of renewable energy volatility. However, the IES structure is the same in each park, which cannot reflect the existing differences in different parks. Zhou et al. [
26] carried out differentiated modeling for different regional energy use attributes. It uses the park’s electric energy interaction as well as storage power plants to regulate wind power, which helps improve the system’s consumption capacity. However, the system only considered a single wind power generation without considering the diversified development status of renewable energy in each park.
According to the above problems and the current status of research, this paper proposes an optimal dispatching scheme for an integrated energy system group, with P2G conversion. This scheme integrates EH with the positive effects of P2G conversion technology and electric energy interaction among multiple parks integrated energy systems, on the economic operation of the system group, and constructs a RIESG with a weak dependence on large power grids and strong renewable energy consumption capacity. The main contributions in this paper are as follows:
Extending the modeling method, based on the graph theory and coupling matrix, to a RIESG with P2G conversion that enables efficient and flexible differentiated modeling of each PIES. In this method, the linear coupling matrix is used to describe the energy conversion relationship of each energy component, with each branch energy flow as a variable, which can portray the dynamic process and coupling relationship of energy flow within the system, and balance the accuracy of the model with the complexity of the problem, which is beneficial to the solution of the optimal dispatching model of the energy system cluster.
The optimal dispatching strategy combining P2G, and inter-park power mutual aid is proposed, using P2G equipment to enhance the park’s renewable energy consumption capacity. In this way, power complementarity is used to balance the resources of each park, combine the two to solve the frequent interaction problem between the distribution network and the power grid in the same region, and reduce the installed capacity of P2G equipment together with improving the utilization rate of P2G equipment, while ensuring the consumption of renewable energy. Thus, the operation economy of the RIESG is comprehensively improved.
2. Construction of EH Model
The concept of EH and modular modeling contribute to the optimal analysis of multi-energy coupled systems [
8,
9,
10]. Therefore, this paper applies graph theory and coupling matrix modeling approaches to specific IES in order to meet the need for differentiated modeling of EH in different parks.
2.1. Modeling Method
The structure of the EH from the graph theory perspective is shown in
Figure 1. The standardized coupling matrix modeling of the EH can be performed by analogy to the power system matrix modeling approach. The EH uses branches to represent the energy flow in the EH, nodes to represent the energy conversion and storage devices, and ports to define the input and output of the energy conversion and storage devices.
For a node in an EH, a node port-branch correlation matrix
can be defined. The number of rows in the matrix is equal to the sum of the input and output port types of the node’s transformation device, and the number of columns is equal to the number of branches of the entire system. The elements of matrix
are 1, if a branch is connected to the node’s input port, −1, if it is connected to the node’s output port, and 0, if it is not connected to any node’s port.
For a conversion module with the type of inputs and the type of outputs, the node-port conversion characteristic matrix can be defined. Its rows , are numerically equal to the input port category multiplied by the output port category, the physical meaning of which is the category of energy conversion between the input and output ports. Its column number, , is equal to the sum of the input port type and output port type of the transformed device at that node. The different conversion efficiencies corresponding to different energy inputs and outputs is the value of the element of the column in which the input port is located relative to the row in which the conversion process () is located. And the value of the element corresponding to the output port of this conversion process is 1, and the value of the rest of the elements is 0.
The node-branch energy conversion matrix
, which uses the branched energy flow to describe the energy conversion relationship of the component, is the product of the node-port conversion characteristic matrix
and the port-branch correlation matrix
, as given in the following equation.
Considering the analogy with Kirchhoff’s current law for power system modeling, the energy conversion equation corresponding to the internal EH is:
where
is the branch energy flow variable.
For the input and output ports of the whole EH, the input and output port-branch correlation matrices are defined as and , respectively. The number of rows in matrix is equal to the number of input port energy types, and elements corresponding to the input branch is 1, and the rest is 0. Similarly, the number of rows in matrix is equal to the number of output port energy types, and the elements corresponding to the output branch is 1, and the rest is 0. The number of columns in both matrices is equal to the number of branches.
The integrated equations of the entire EH can be obtained by associating all components of the node-branch energy conversion matrices, as well as the input and output matrices, as follows:
2.2. Modeling of Different Types of Nodes
According to the above modeling method, the equipment used in IES can be classified into conversion and energy storage types based on the energy conversion and storage characteristics. Moreover, the conversion type can be subdivided into single and multiple types based on the number of equipment conversion methods.
2.2.1. Single Conversion Type
The single conversion modeling takes P2G as an example, which equates the electrolysis of water and the methanation reaction included in the P2G technology to a single energy conversion module, to convert the electrical energy to gas energy with the structure shown as node 1, in
Figure 1. The P2G efficiency is indicated by
.
The energy conversion category of node 1 is electrical energy to gas energy. Moreover, the input port type is electrical, and the output port type is gas. Therefore, the node-port conversion characteristic matrix of node 1 is:
The electrical input port of node 1 contains branches 1 and 3, the gas output port is branch 6, and the EH contains 7 branches. Thus, the port-branch correlation matrix of node 1 can be presented as follows:
The node-branch energy conversion matrix for node 1 is:
The EH branch column variables are:
The node 1 energy flow conversion equation can be expressed as:
According to (5)–(9), the following equation can be obtained.
This energy flow conversion equation satisfies the physical significance of P2G to convert electrical energy to gas energy with the conversion efficiency of .
2.2.2. Multiple Conversion Type
Multiple conversion type modeling is exemplified by combined heat and power (CHP) units, and the CHP device structure is shown in node 2, in
Figure 1. The energy conversion can be categorized as gas to electric energy and gas to heat energy. The input port type is gas, and the output port type is electric and heat. The efficiencies of electricity and heat productions are
and
, respectively. Thus, the node-port conversion characteristic matrix of node 2 is:
The gas input port of node 2 is branch 2, the electrical output port includes branches 3 and 4, the thermal output port is branch 5, and the EH contains 7 branches. Thus, the port-branch correlation matrix of node 2 is:
The node-branch energy conversion matrix for node 2 is:
Combined with the EH branch column variables, the node 2 energy flow conversion equation can be expressed as:
According to (11)–(14), the below equation is obtained:
This energy flow conversion equation satisfies the physical meaning of CHP, converting gas energy to electrical energy with conversion efficiency , and gas energy to heat energy with conversion efficiency .
2.2.3. Energy Storage Type
The heat storage device is an example of energy storage type device modeling, and its structure is shown as node 3, in
Figure 1. The energy storage device is a special energy conversion and storage module which describes the input and output variables of the energy storage device. Furthermore, a dummy variable needs to be introduced to describe the change of energy inside the energy storage.
For the heat storage device represented by node 3,
denotes the amount of heat storage change,
represents the charging efficiency, and
expresses the discharging efficiency. The node-port conversion characteristic matrix of node 3 can be written as:
In node 3, the heat input port is branch 5, the heat output port is branch 7, and the dummy variable is
. Therefore, the whole number of EH branches is 8, and the EH branch column variable is written after increasing and expanding as follows:
The augmented port-branch correlation matrix for node 3 is:
The node-branch energy conversion matrix for node 3 is:
Combined with the EH expansion branch column variables, the node 3 energy flow conversion equation can be expressed as:
According to (16)–(20), the following equation is obtained.
The energy flow equation satisfies the basic charging and discharging characteristics of the energy storage device.
2.3. EH Overall Model
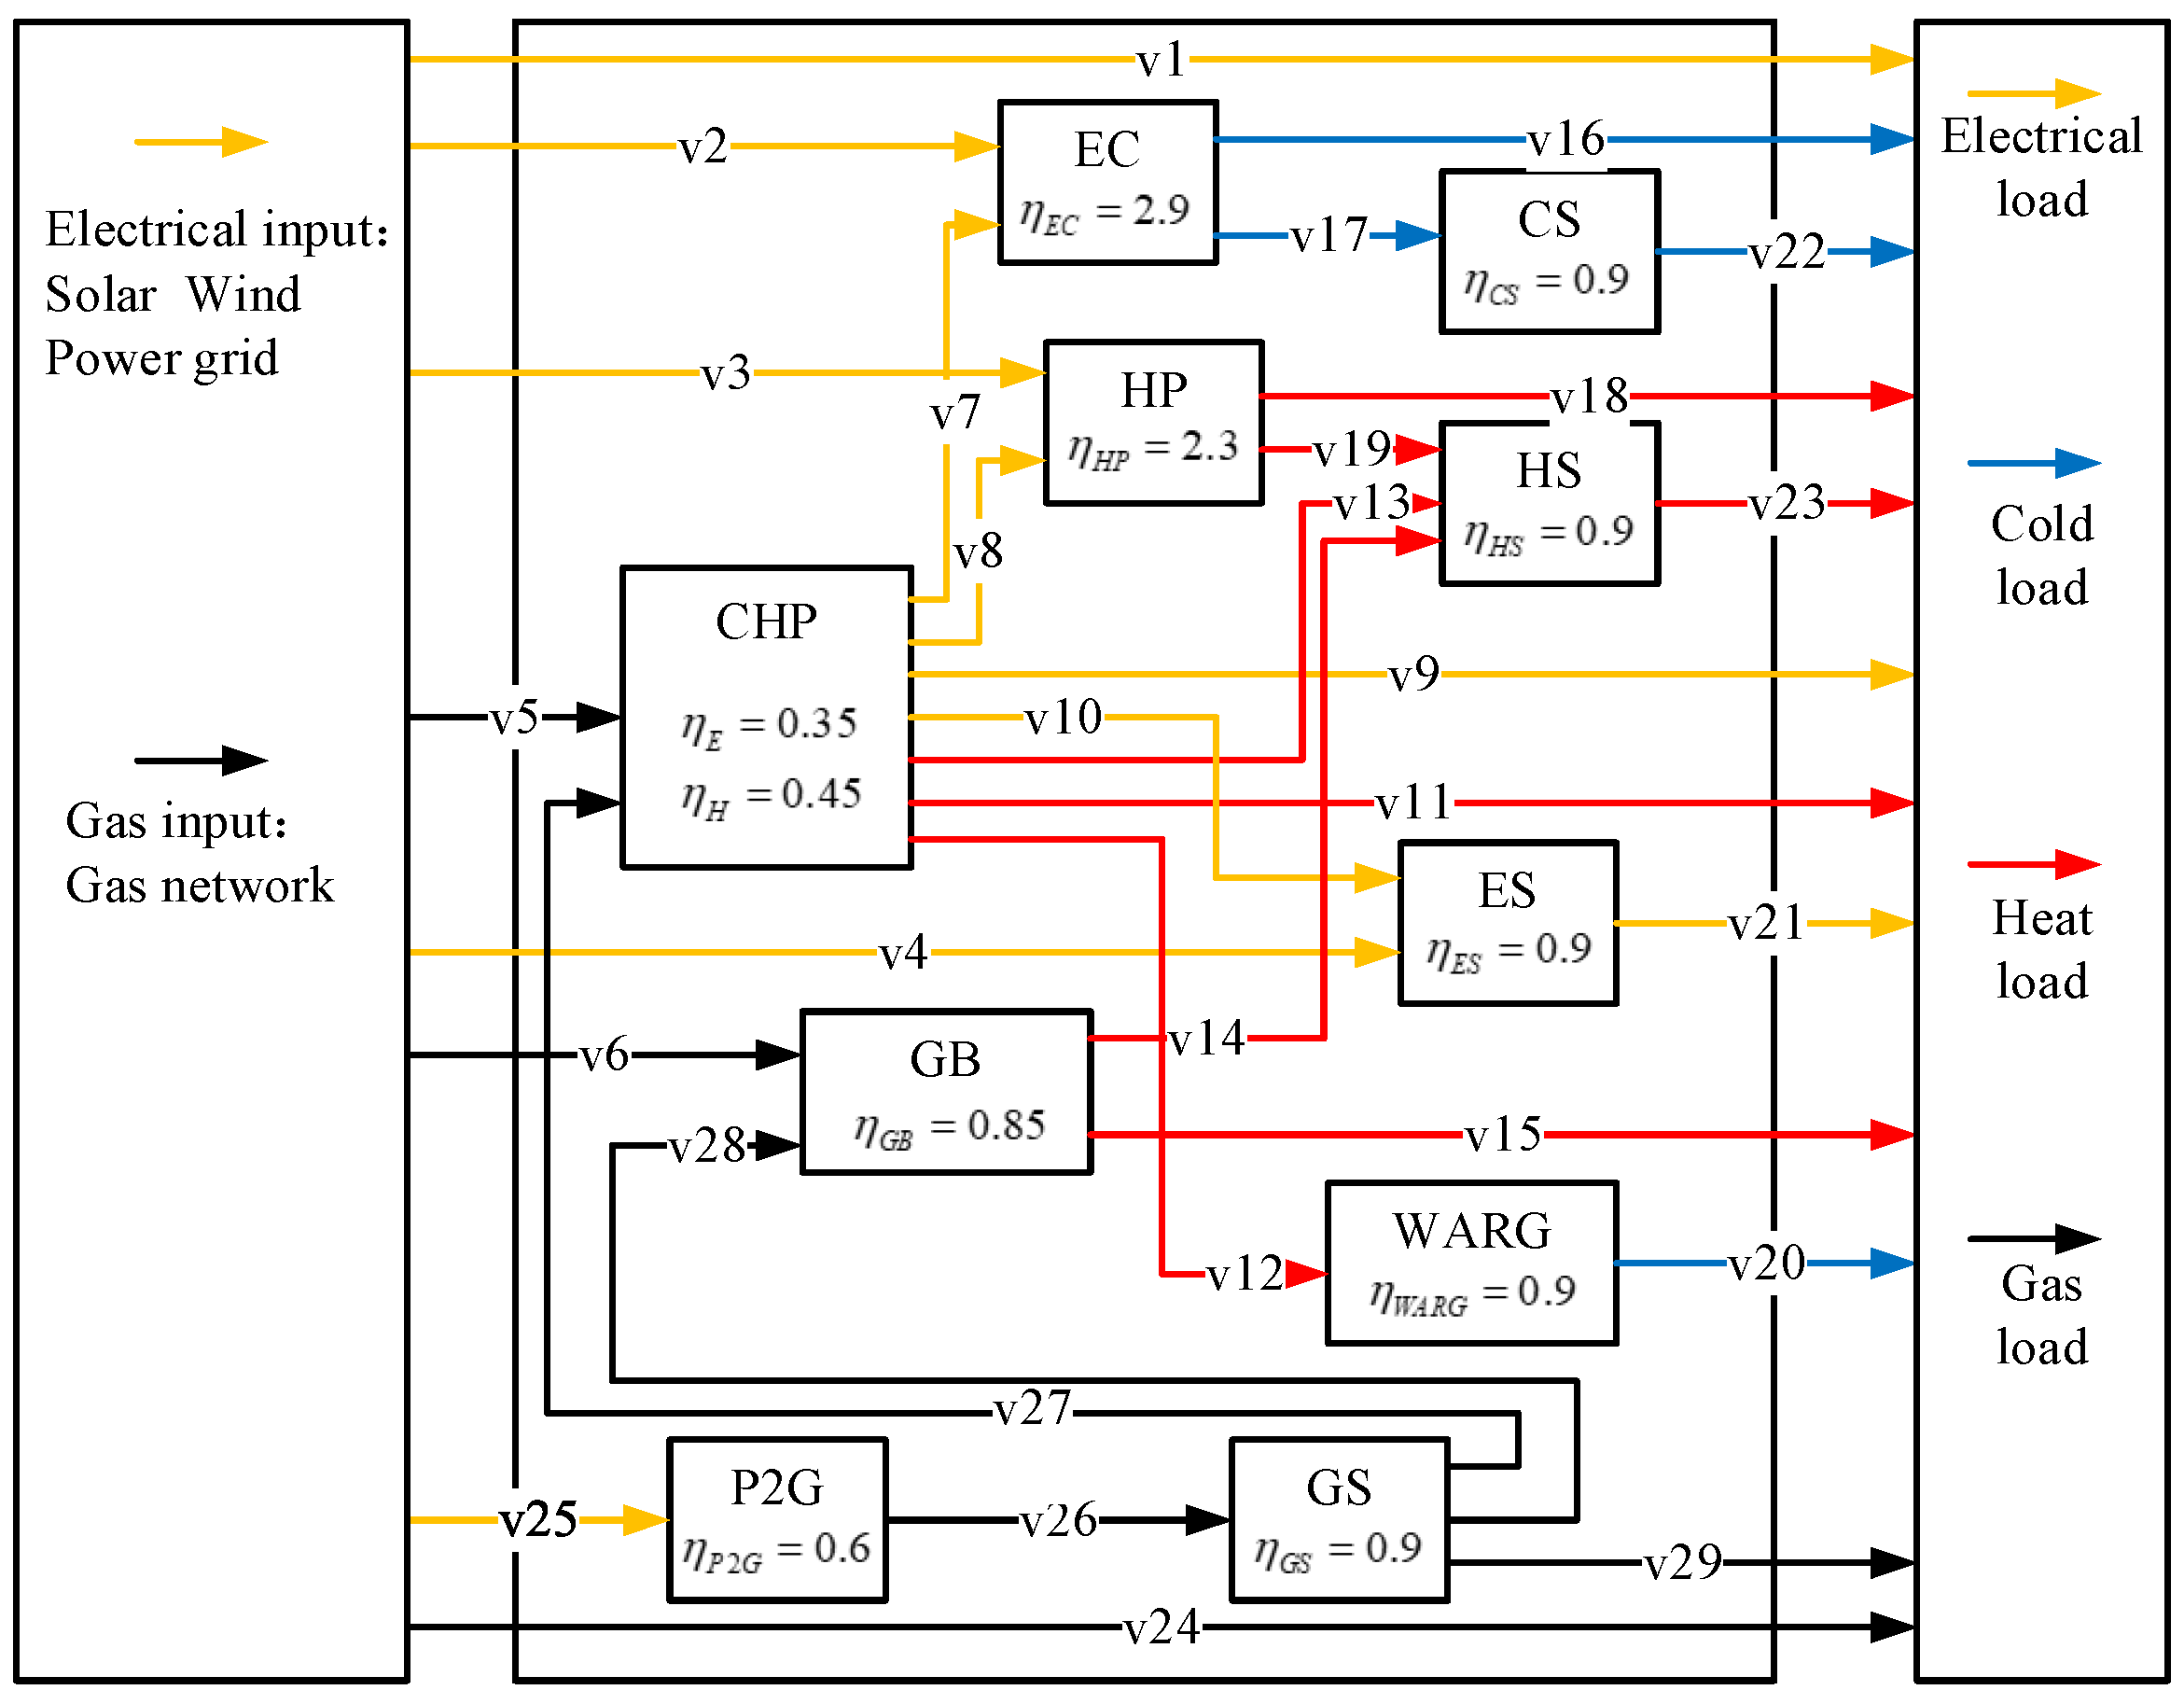
Figure 2 shows the EH structure of the PIES, containing single conversion type equipment: gas boiler (GB), electric cooling (EC), heat pump (HP), water absorption refrigerator group (WARG), and P2G; containing multiple conversion type equipment: CHP; containing energy storage type equipment: electricity storage (ES), heat storage (HS), cooling storage (CS), and gas storage (GS). According to the above modular modeling method in
Figure 2, the energy conversion relationship matrix is presented in (22), and each park’s energy conversion relationship matrix can be added and deleted based on the differences in energy conversion modules in each park.
2.4. Objective Functions and Constraints
For PIES standalone operation, minimizing operating costs as the goal is presented as:
where
denotes system operation cost;
represents electricity purchase cost;
indicates gas purchase cost;
denotes equipment operation and maintenance cost;
implies energy loss cost;
,
,
, and
are electricity purchase price, gas purchase price, solar disposal price, and wind disposal price, respectively;
is the operation and maintenance coefficient of equipment
;
,
,
,
, and
are electricity purchase, gas purchase, the output power of equipment
, solar disposal power, and wind disposal power at time
, respectively.
To consider the economic benefits of adding P2G to PIES, the cost of P2G installation must be converted to each dispatch cycle to be included in the total system cost, and the cost of P2G equipment installation is obtained as:
where
denotes P2G installation cost,
represents P2G installation price conversion factor, and
implies P2G installation capacity.
Therefore, the total cost of running the PIES installation
is:
From (10), (15), and (21), it can be concluded that different types of modeled modules satisfy energy conservation. Moreover, the integrated EH Equations (4) and (22) composed of each module satisfy the power balance equation constraint, and the remaining inequality constraints are as follows.
Equipment power constraints:
where
and
are the upper and lower limits of the output force of equipment
, respectively.
Energy storage element cycle energy storage constraint:
where
and
are the upper and lower limits of energy storage of device
, respectively. Moreover,
denotes the energy storage of each element at time
.
Climbing rate constraint:
where
and
denote the output variation and climbing rate of device
, respectively.
3. Optimal Scheduling of RIESG
A large amount of clean energy is underutilized in surplus power parks due to the differences in renewable energy resources and energy demand among PIES, and the limited regulation capacity of individual system optimization and dispatch. In contrast, power shortage parks require a regular power supply from large grids. Therefore, this paper proposes a complementary optimal dispatching model for RIESG with the electric energy interaction between each park as a link.
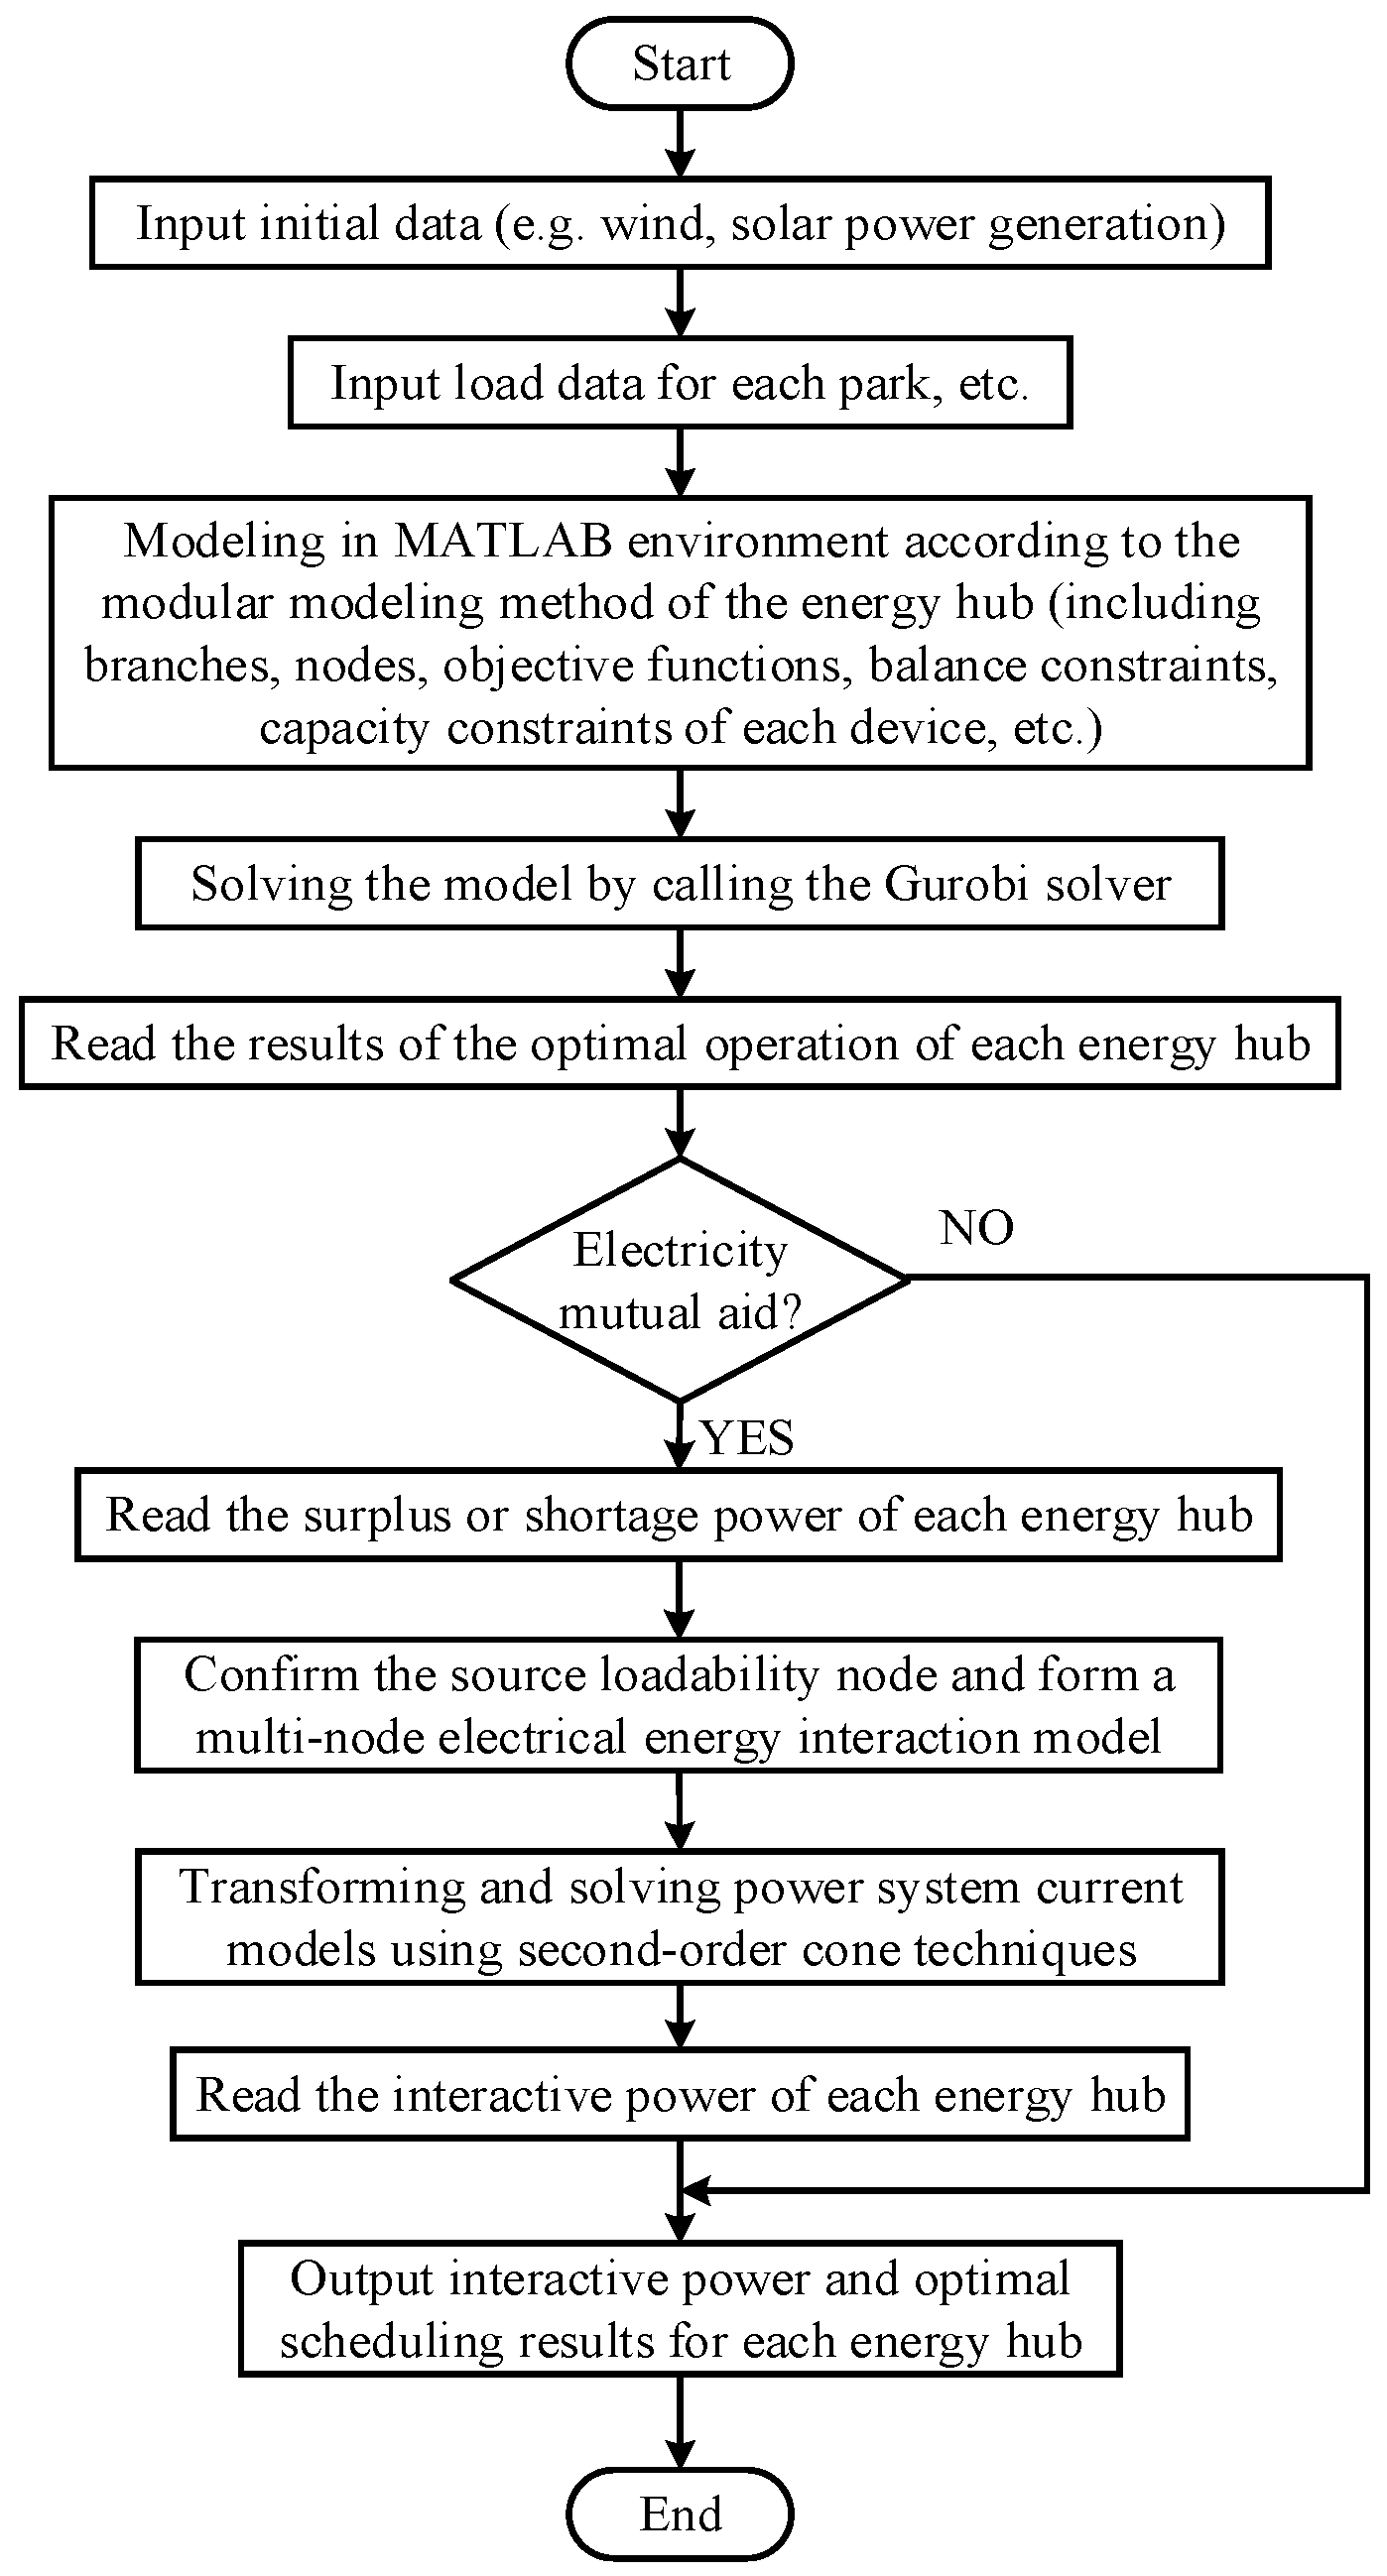
Firstly, wind and solar power generation and various types of load data of each park are input, and according to the renewable energy type and energy conversion module of each park, the energy branch decision variables are set in Matlab, using Yalmip toolbox. The integrated equations of each hub are obtained by modeling each type of node according to the modular modeling method of the energy hub. Using Equations (4) and (26)–(28) as the constraints and Equation (23) as the objective for each park to optimally dispatch itself, the Gurobi solver is invoked to solve for the surplus or shortage of electricity under optimal operation of each park. Then, the multi-node optimal flow model is constructed with the surplus park as the source node, the shortage park as the load node, and the surplus park that provides the most power as the balance node, with the minimum system network loss as the objective function when the energy flow is mutual aid. The second-order cone relaxation technique is used to convert the mathematical model into a second-order cone programming problem, and the Gurobi solver is invoked to find the output power of each source node to obtain the optimal solution of energy mutual aid among the parks. The source node transmits power to the load node to achieve the effect of making full use of renewable energy in the surplus park, and reducing the dependence on the power grid in the shortage park, bringing into play the regulating ability of the system group and realizing complementary optimization in the region. Finally, according to the energy mutual aid results, the optimal scheduling scheme for each park is modified and obtained.
The flow chart for solving the optimal dispatching model of the RIESG is shown in
Figure 3.
4. Simulation and Results
This chapter will verify the effectiveness and reasonableness of the proposed optimal dispatching strategy for the RIESG with P2G conversion through the analysis of case studies.
4.1. Case System
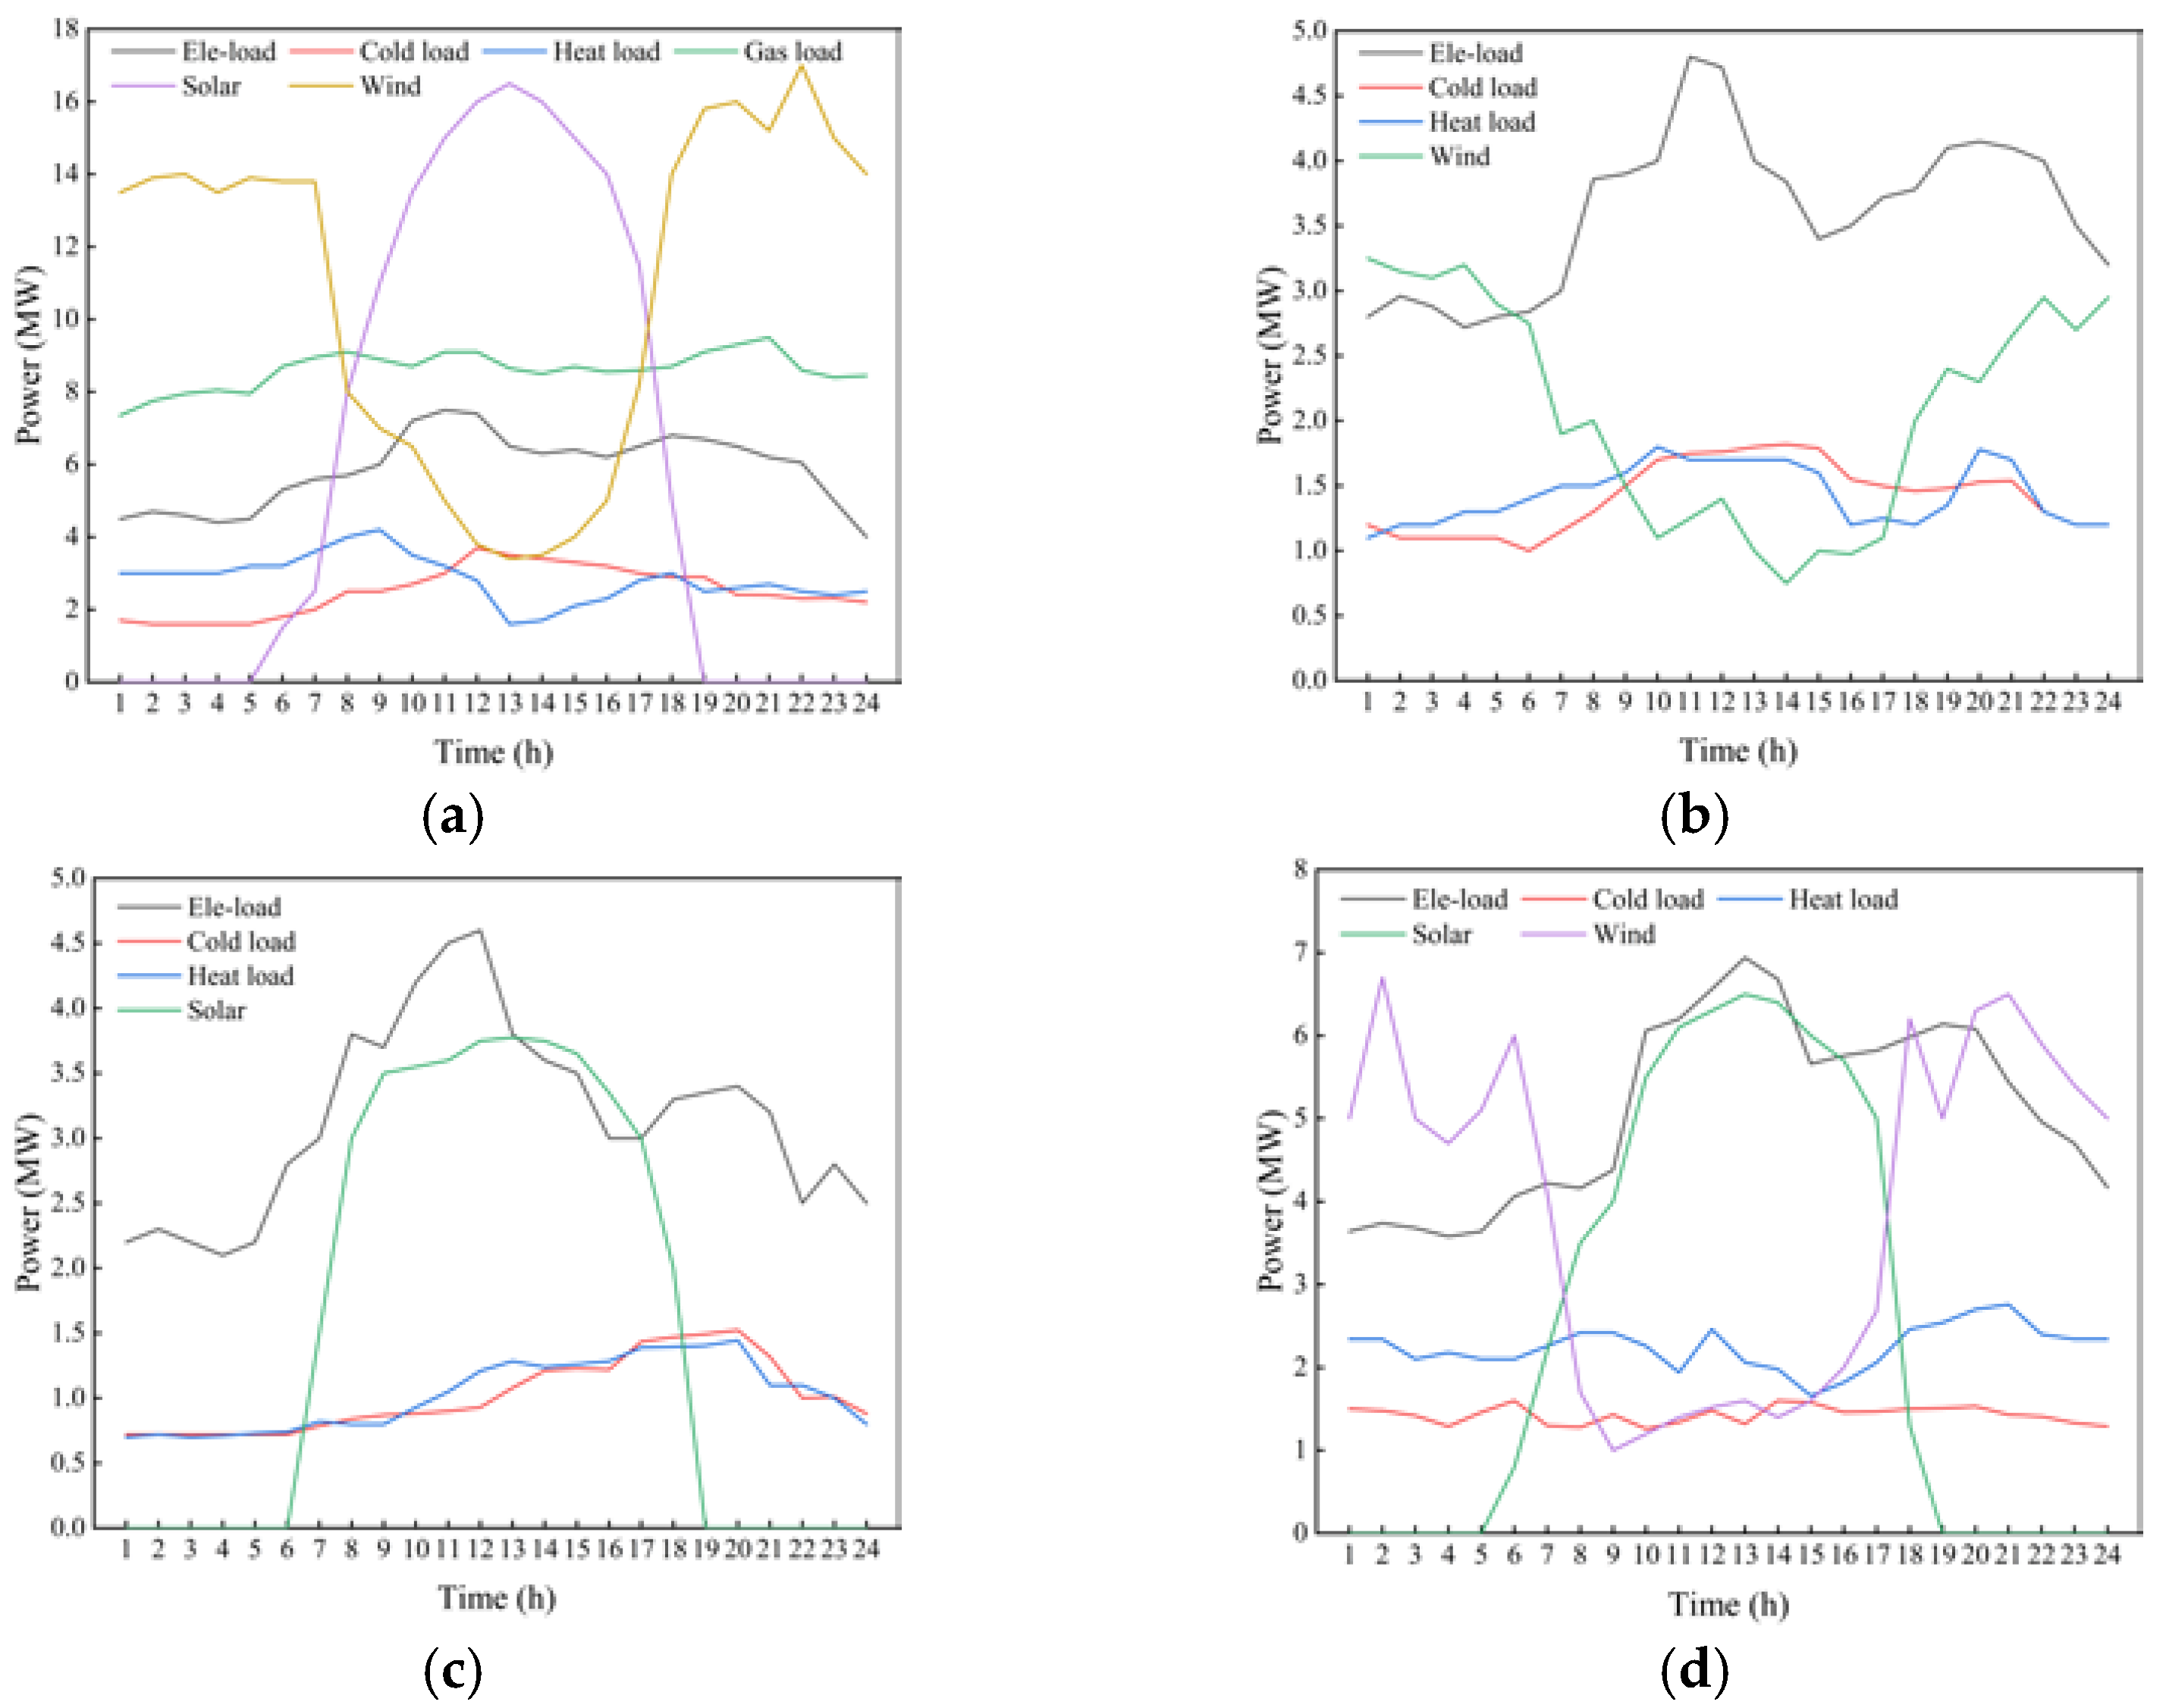
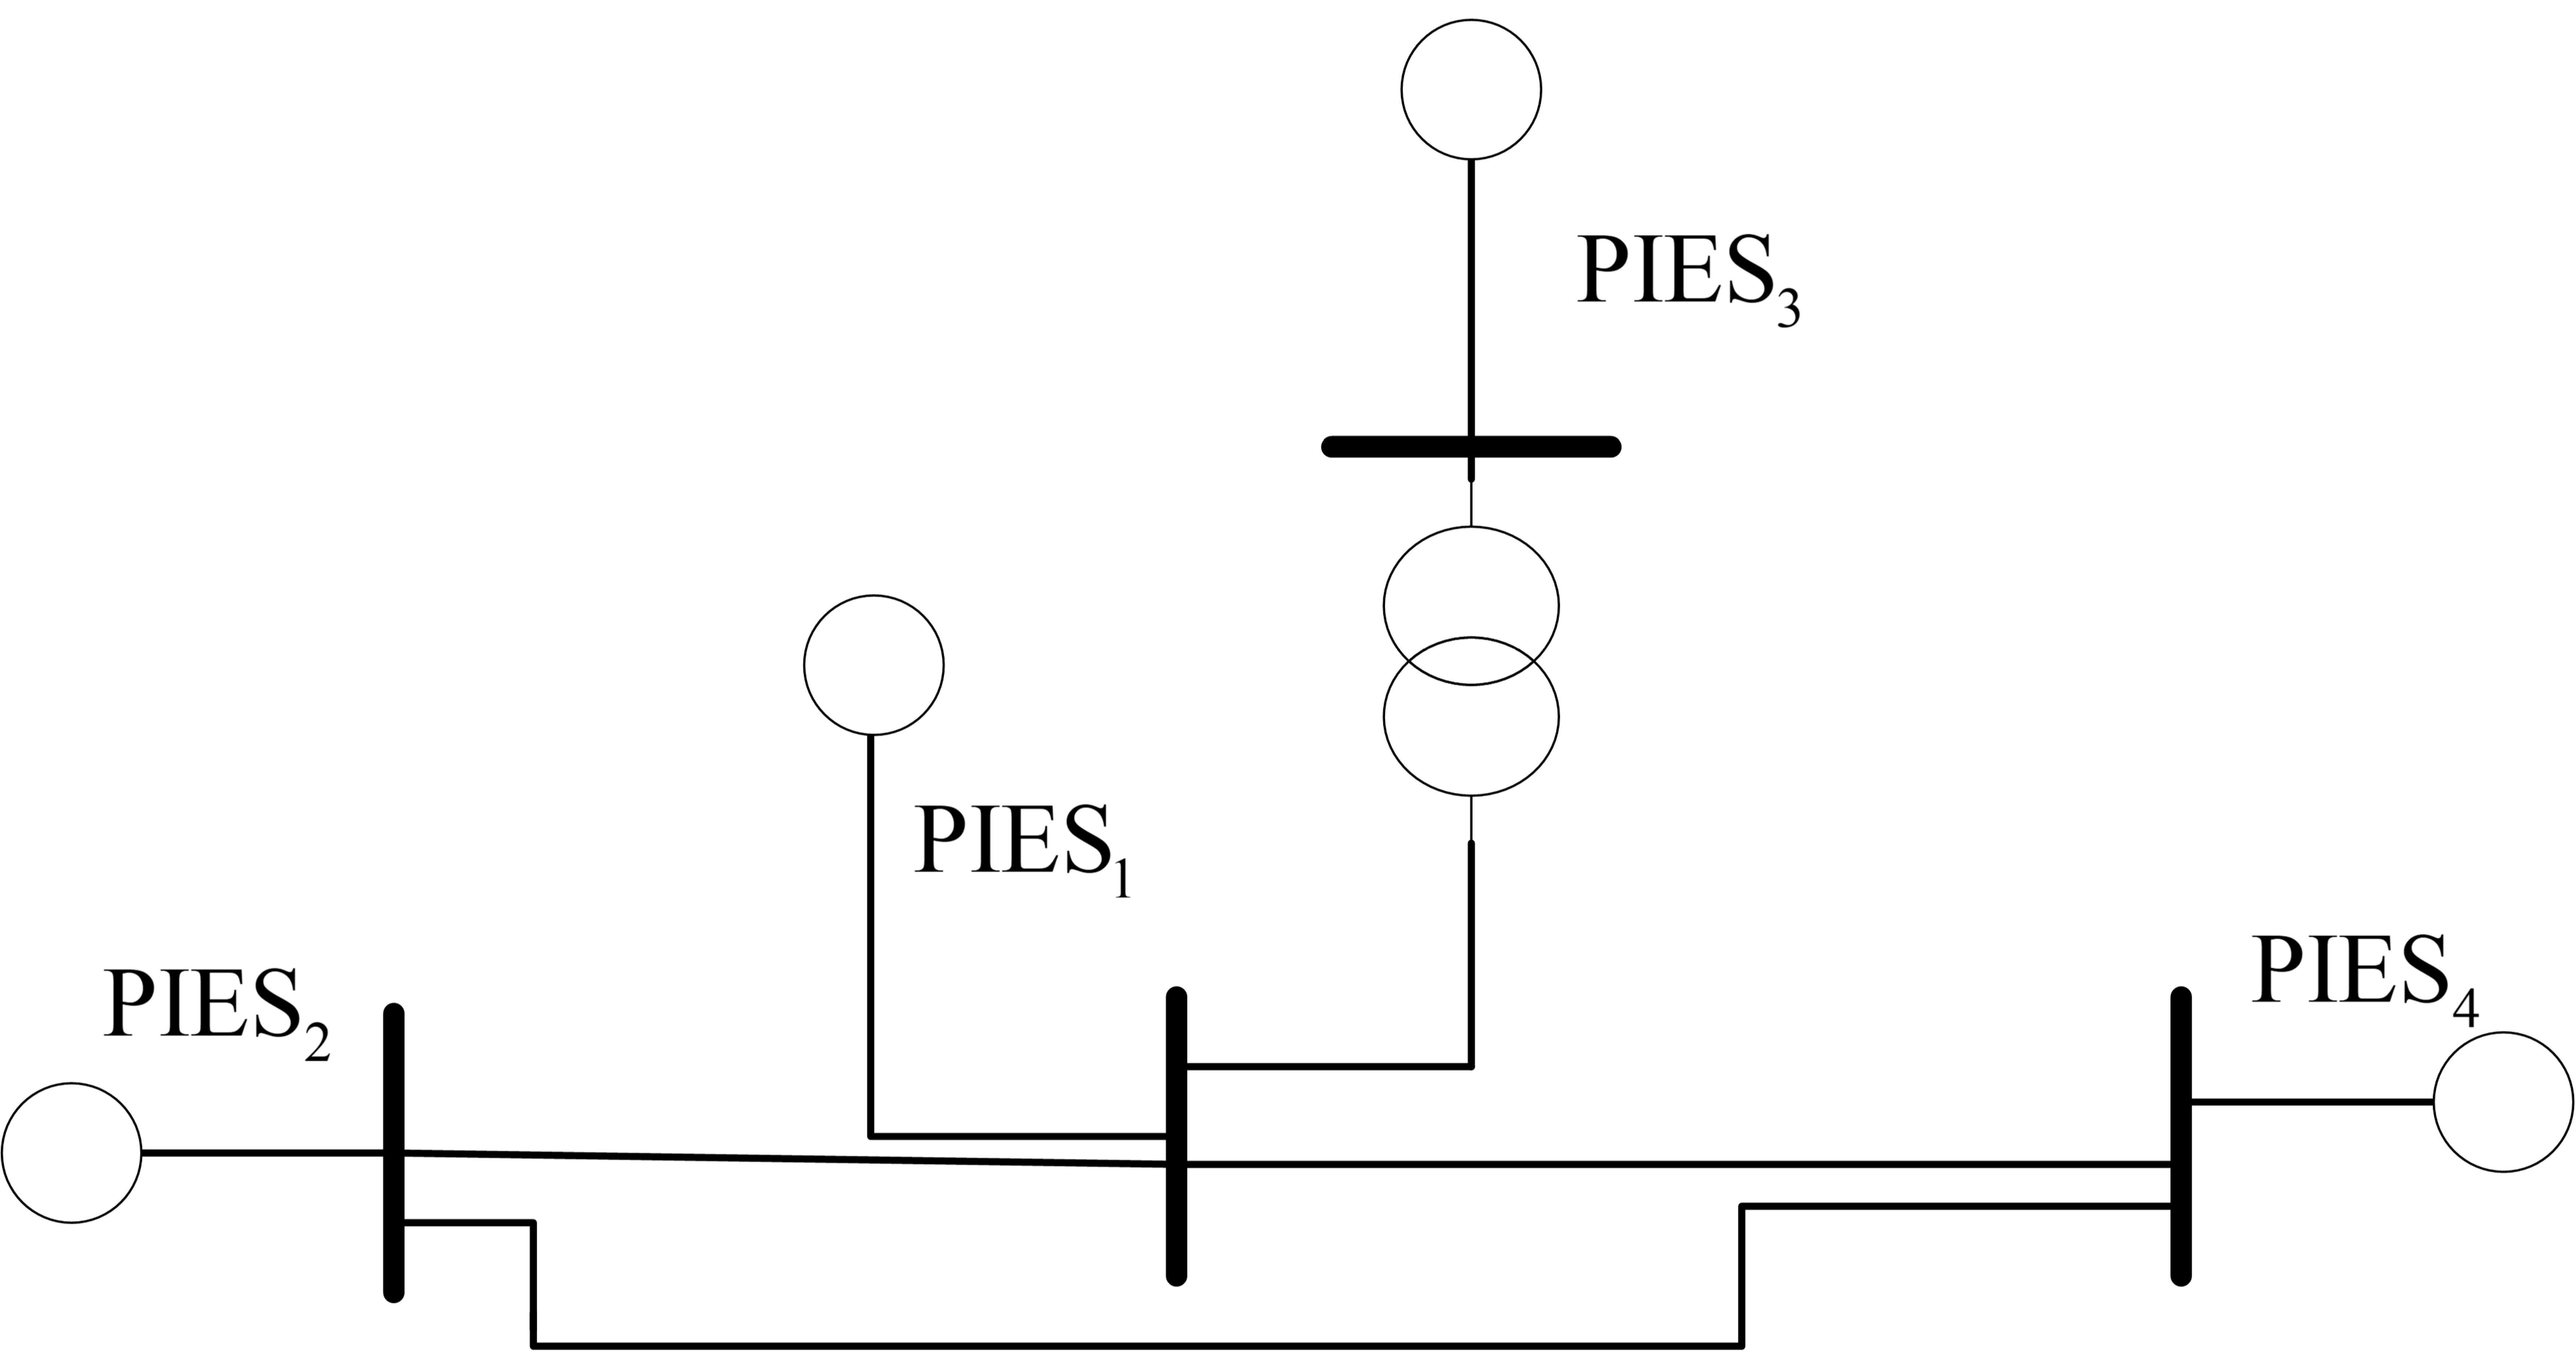
In this paper, four different IES structures for parks are constructed for resource and energy use differences, where PIES
1 is an IES of electricity, cooling, heat, and gas for parks with abundant wind and solar resources, PIES
2 and PIES
3 are integrated energy systems for parks with a single type of wind or solar energy, and PIES
4 is an IES for parks with complementary wind and solar energy. However, wind and solar energy resources are scarce compared with PIES
1, and the internal resources are inadequate to meet the load demand. The structural configuration of each PIES, renewable energy output, and various load demand curves are shown in
Figure A1 and
Figure A2, in
Appendix A. The proposed complementary topology of the RIESG is shown in
Figure 4, and its line parameters refer to the standard data of IEEE 4 nodes system.
The various parameters used for each system are adjusted based on [
27,
28,
29], and the price of natural gas purchased by the system from the external gas grid is 2.65 RMB/m
3, and the calorific value of natural gas is 9.88 (kWh)/m
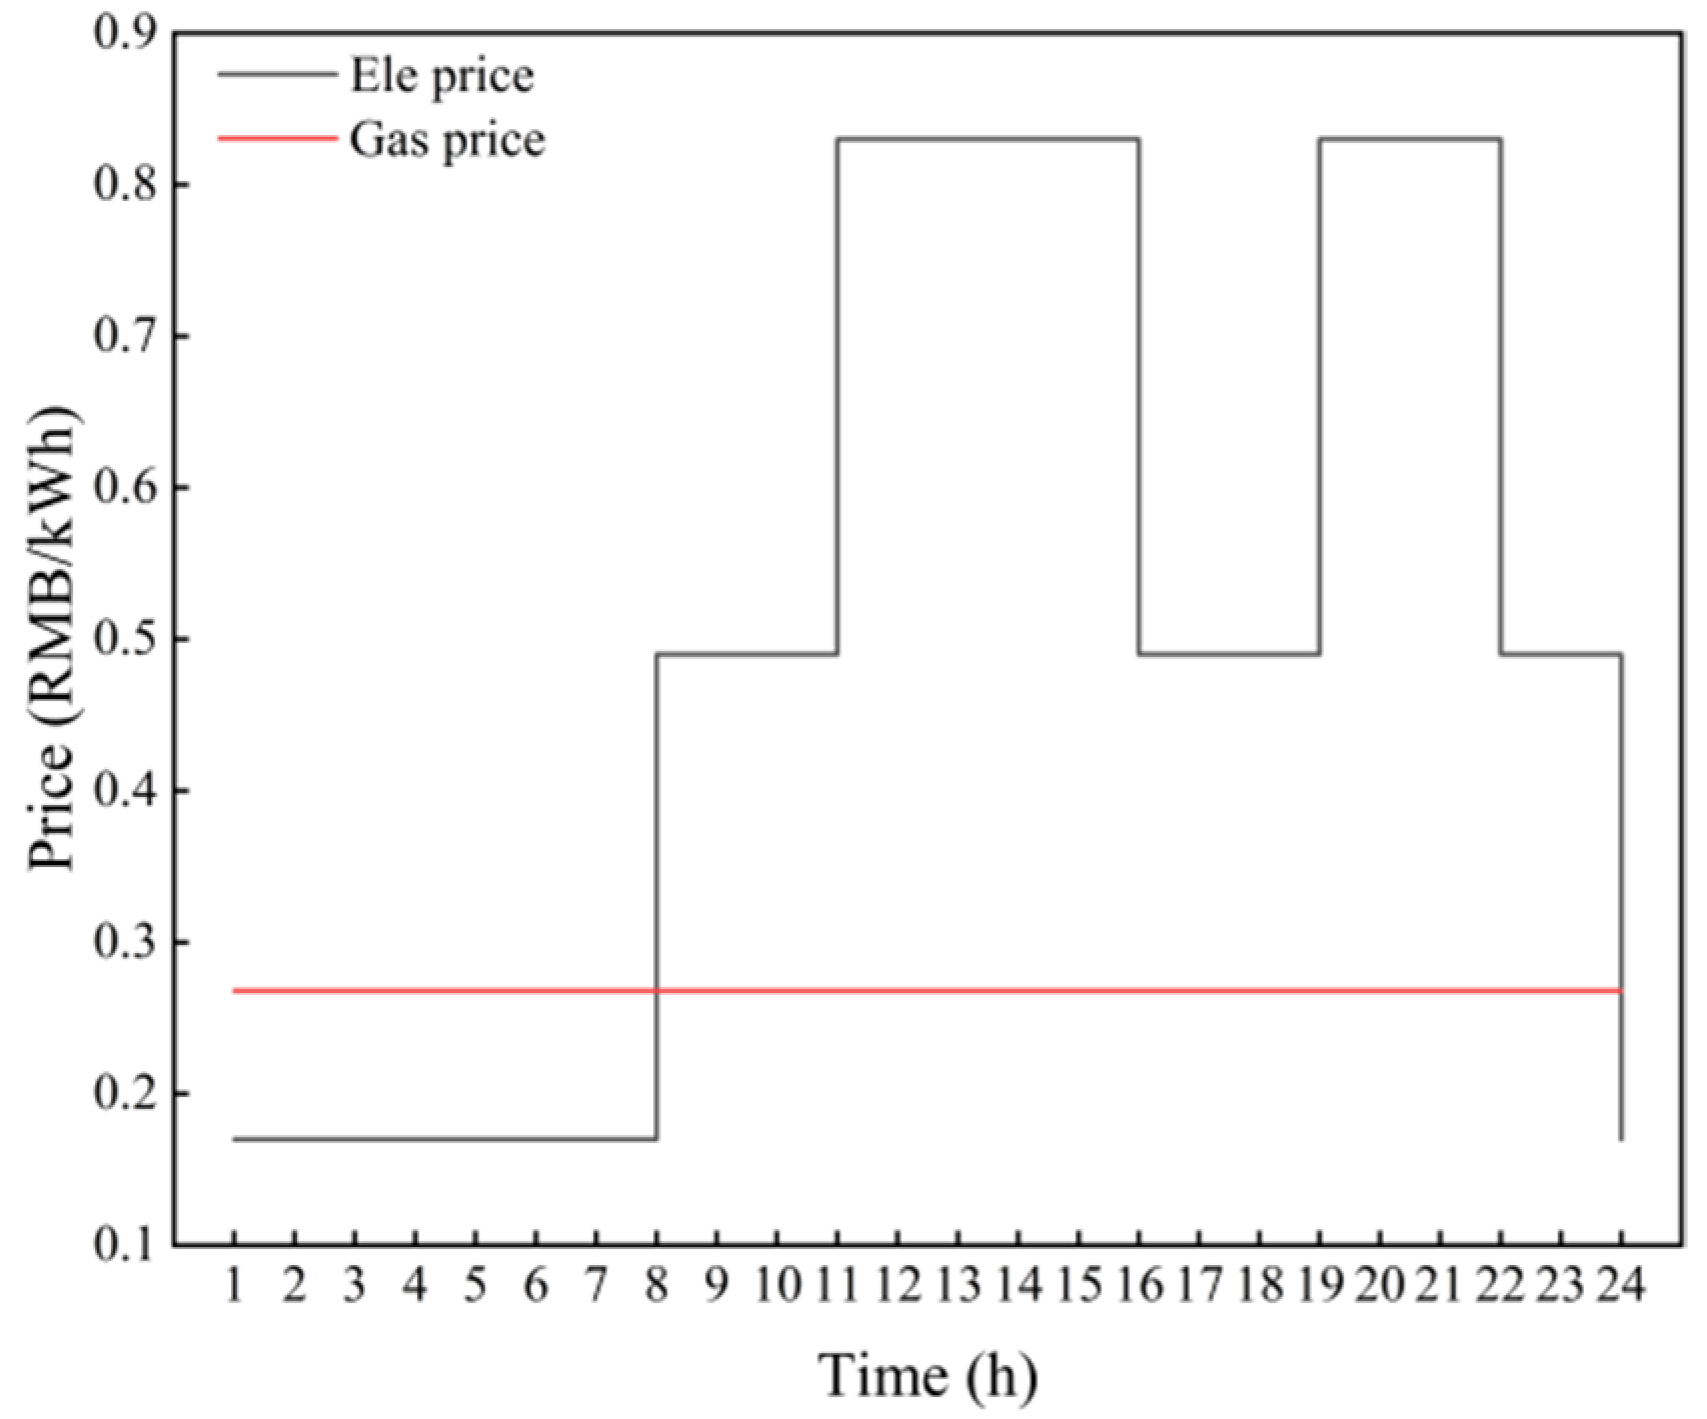
3. The price of sold electricity from the external grid of the system is a time-of-use tariff, and the energy price is shown in
Figure 5.
The operation and maintenance cost coefficients of each equipment are shown in
Table 1, in which the abandoned energy cost is set to 150 RMB/MWh, and the converted cost of P2G equipment installation is 2500 RMB/MW. The simulation examples in this paper are programmed on the MATLAB software and modeled and solved using the YALMIP toolbox and Gurobi solver.
4.2. Case Scenario Setup
In this paper, 4 scenarios are considered for comparative analysis, including:
Scenario 1: Without considering the P2G equipment and the power interaction between parks, each park operates intending to optimize its economy. The utilization of renewable energy resources under the independent operation of each park is examined.
Scenario 2: Without considering the electric energy interaction between parks, but with considering the impact of P2G equipment on each park, the impact of adding different capacity P2G equipment on the economic operation of different parks is examined.
Scenario 3: Without considering the impact of P2G equipment on the economic operation of each park, but considering the electrical energy interaction between parks, the overall resource utilization of the RIESG operating mode is examined.
Scenario 4: Considering both P2G facilities and inter-park energy interactions, the impact of the complementary structure of a group of integrated regional energy systems containing P2G on each park is examined.
4.3. Results and Analysis
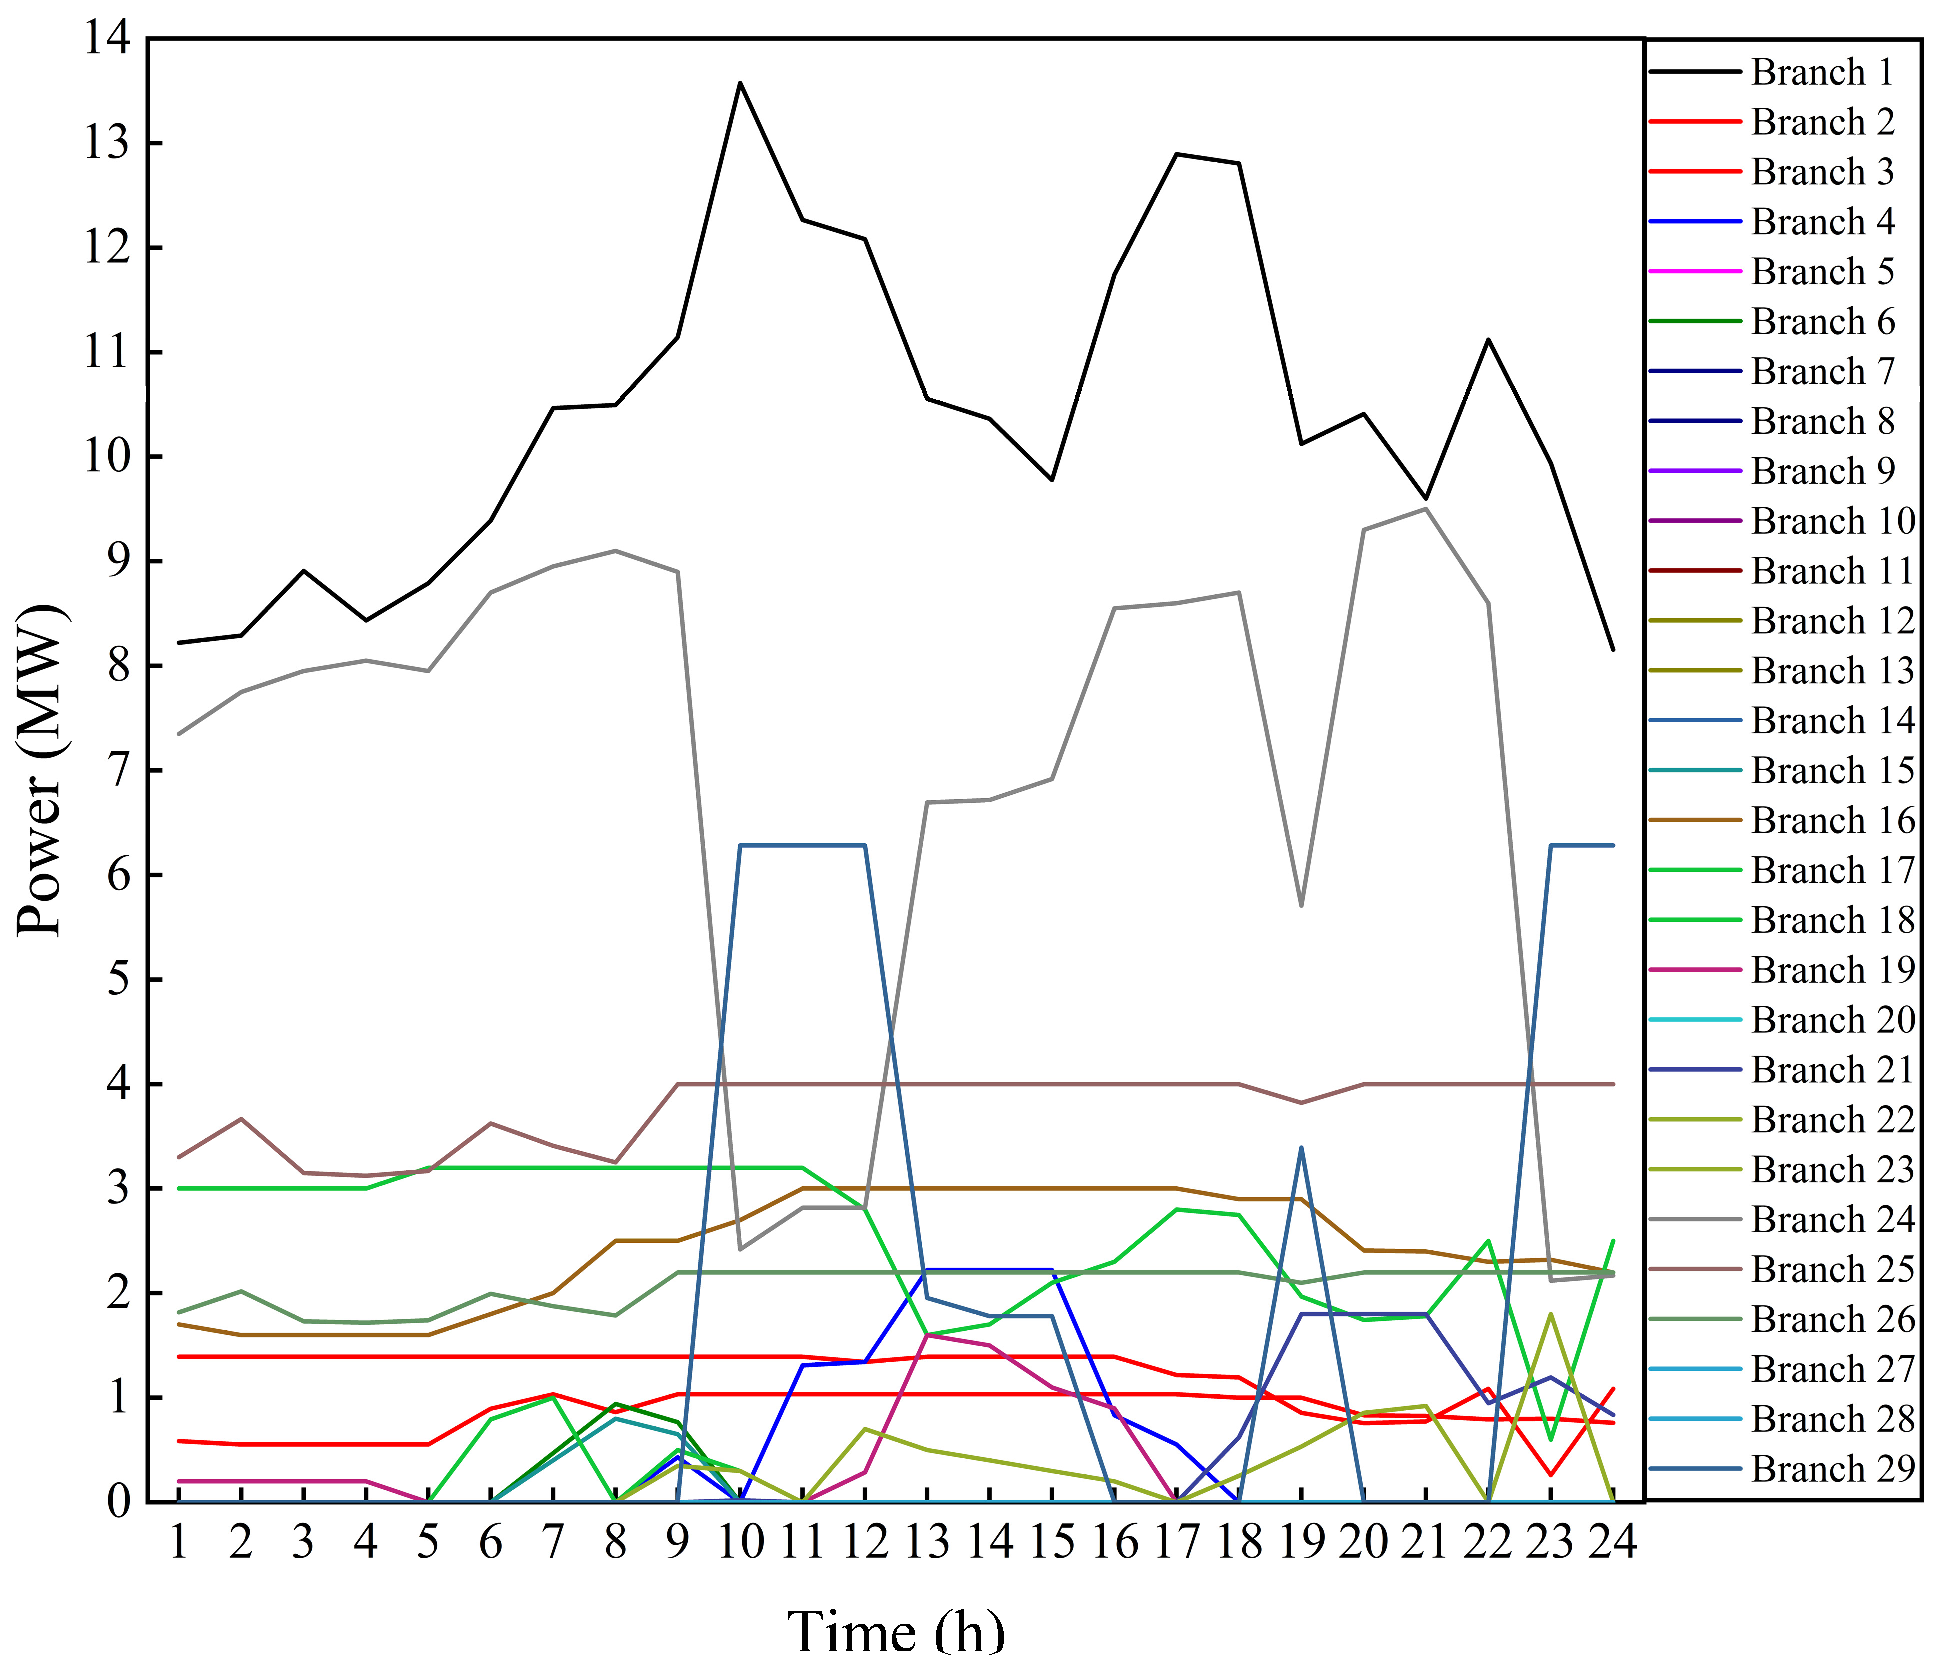
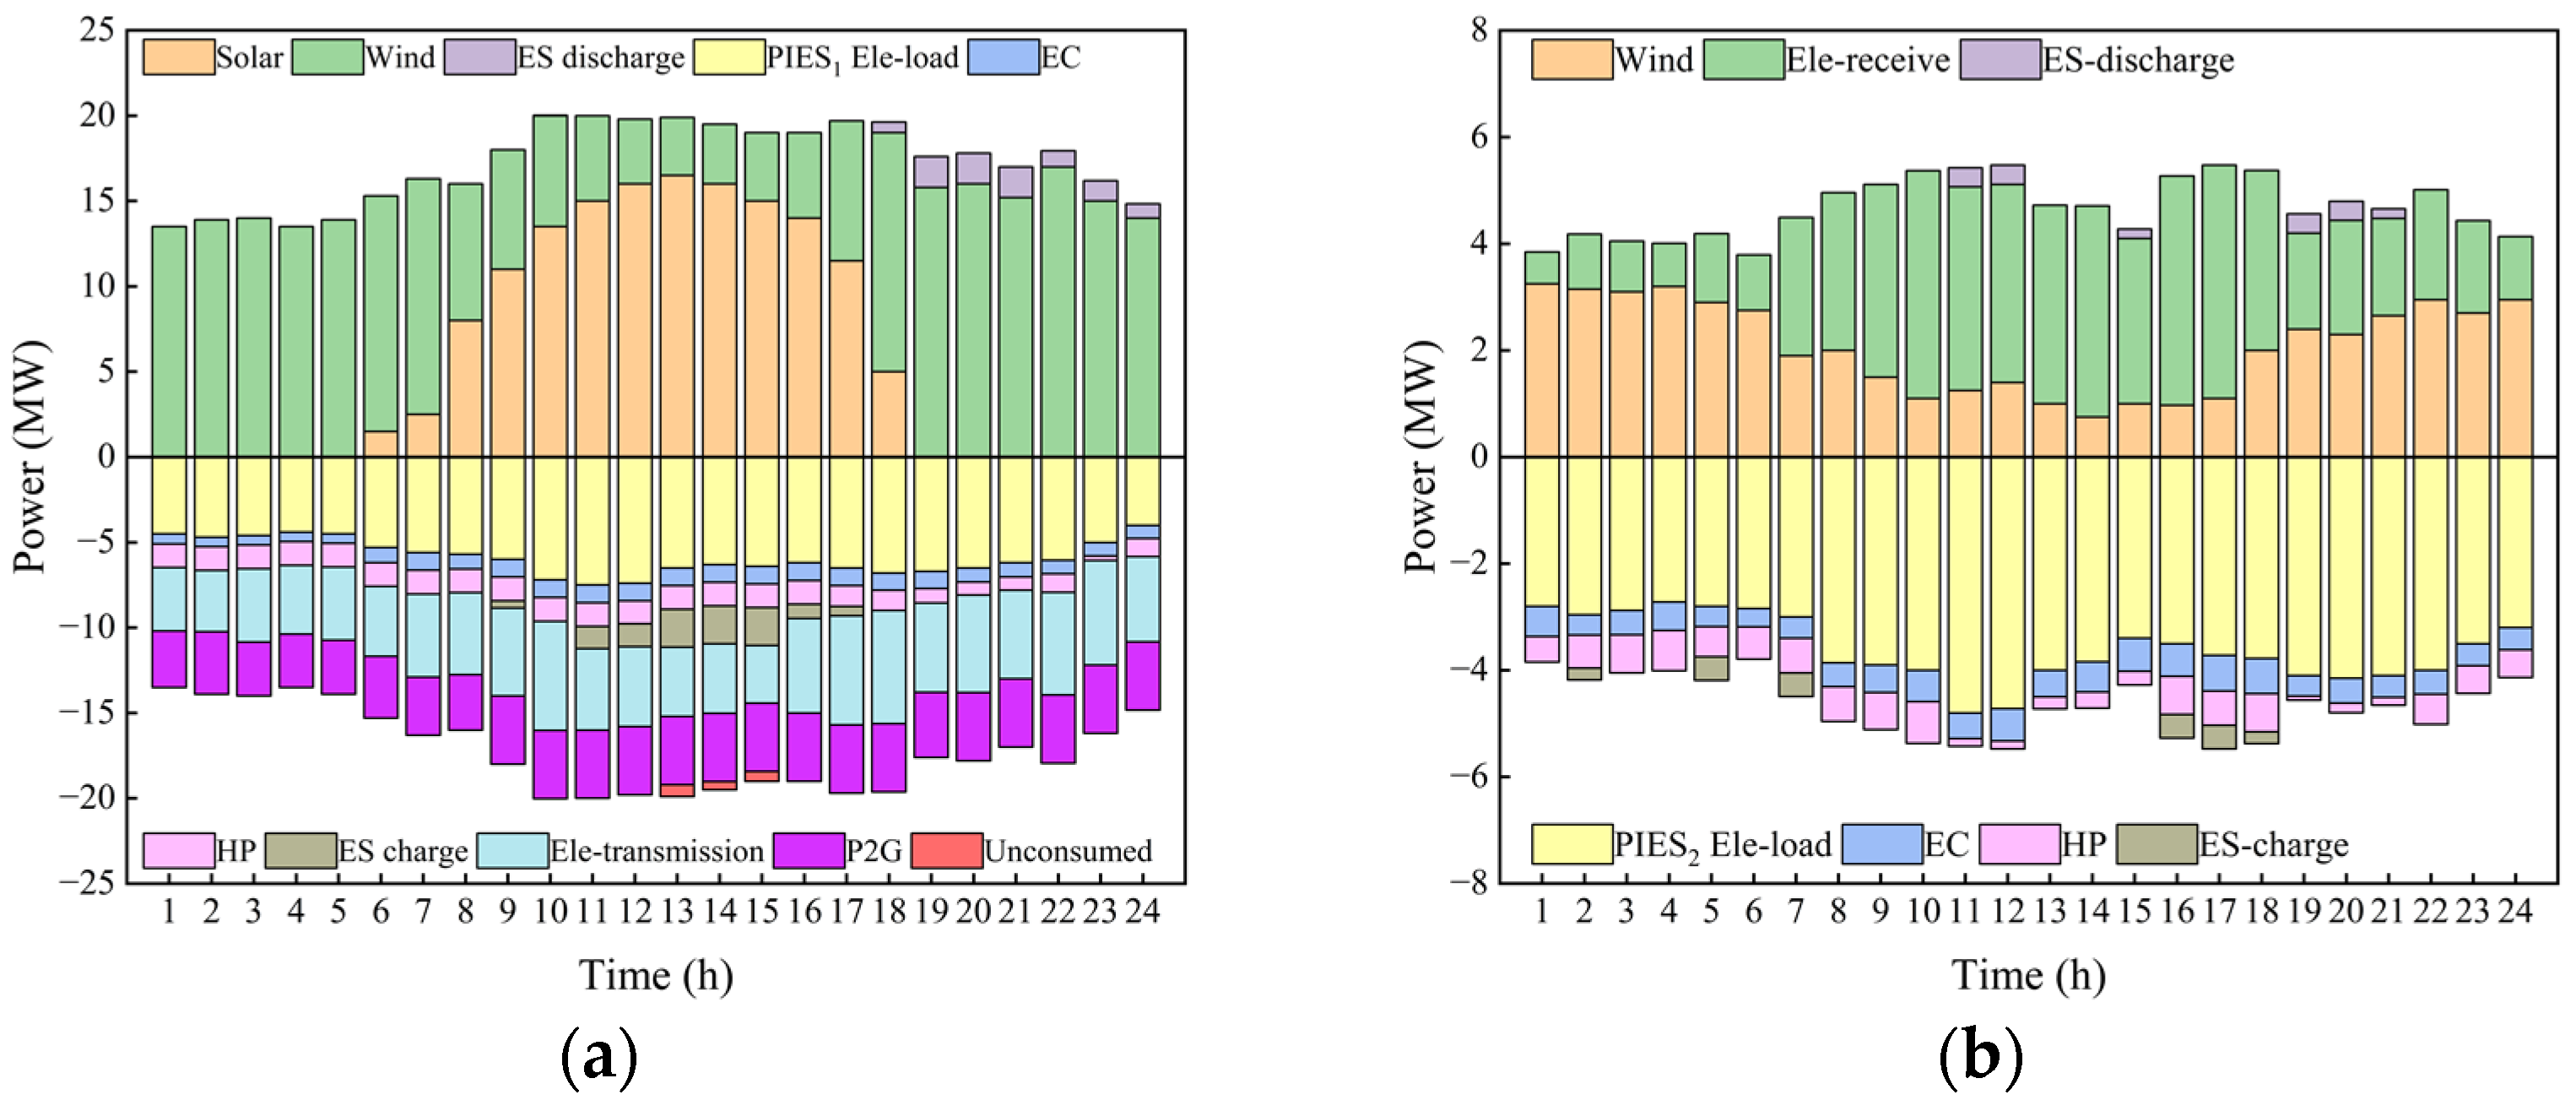
The energy flow of PIES can be obtained by solving each park in each scenario based on modular modeling of the EH. The solution time of scenario 4 is 0.0929 s, and the energy flow of PIES
1 is shown in
Figure 6. The figure contains the energy flow values of each branch at each period, which visually reflects the energy flow process of each coupled component branch in the EH. The following further analysis is based on the energy flow diagram of each PIES in each scenario.
4.3.1. Scenario 1 Results Analysis
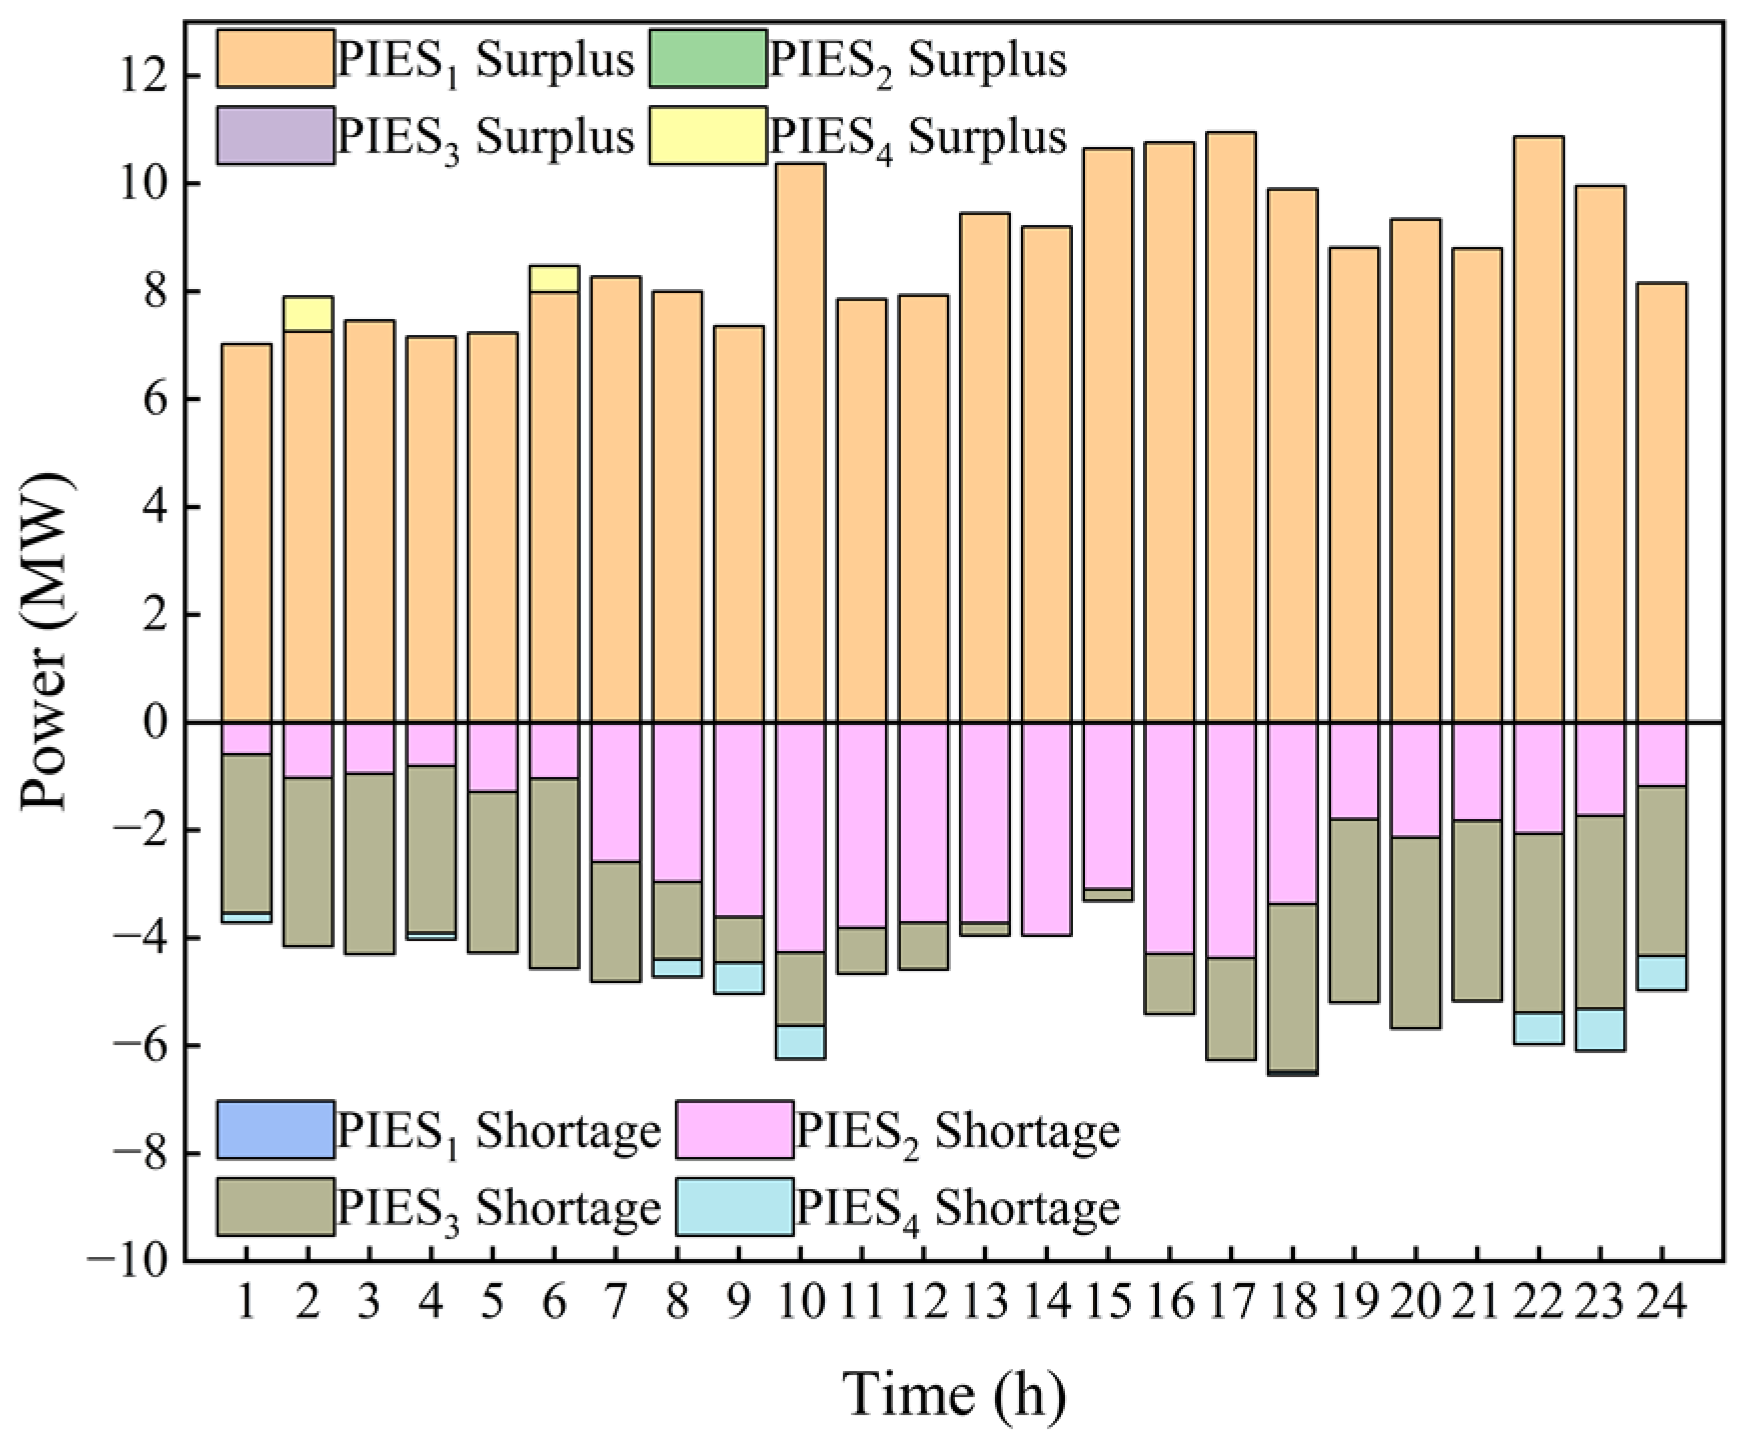
Each PIES under the scenario 1 setting operates independently to optimize its economy to meet the demand of various types of loads, and obtains the surplus power of each park, and the need for the external grid to provide power to cover the shortage, as shown in
Figure 7.
As can be seen in
Figure 7, PIES
1 has a large surplus of renewable energy to meet its own load demand, due to the abundant wind and solar resources inside the park. It is worth noting that the surplus renewable energy cannot be consumed under the independent operation mode. PIES
2 is a single wind power generation system, and PIES
3 is a single photovoltaic power generation system. Since the renewable energy resources in the park are inadequate to supply the energy demand of the system itself, the situation reflects the time difference of scenery resources, in which PIES
2 is a wind power generation system, and the power shortage is larger in the daytime when the wind power generation is small, and PIES
3 is a photovoltaic power generation system, and the power shortage is larger at night. PIES
4 is a combination of wind and solar power generation systems. As the shortage of renewable energy resources in the park is still available, a small amount of external grid is required to cover up the shortage several times, and occasionally a small amount of surplus is not utilized. The results of the independent operation of the four PIESs reflect the resource and demand differences between the parks, and the region has the feasibility of inter-park energy mutual aid to achieve the complementarity of a RIESG.
4.3.2. Scenario 2 Results Analysis
According to the setting of scenario 2, each PIES is added with different electric to gas equipment capacities for optimized operation. The structure of PIES after adding the P2G equipment is shown in
Figure 2 (taking PIES
1 as an example).
Since PIES
2 and PIES
3 have no unconsumed renewable energy in the park, no additional electricity to gas equipment is installed. PIES
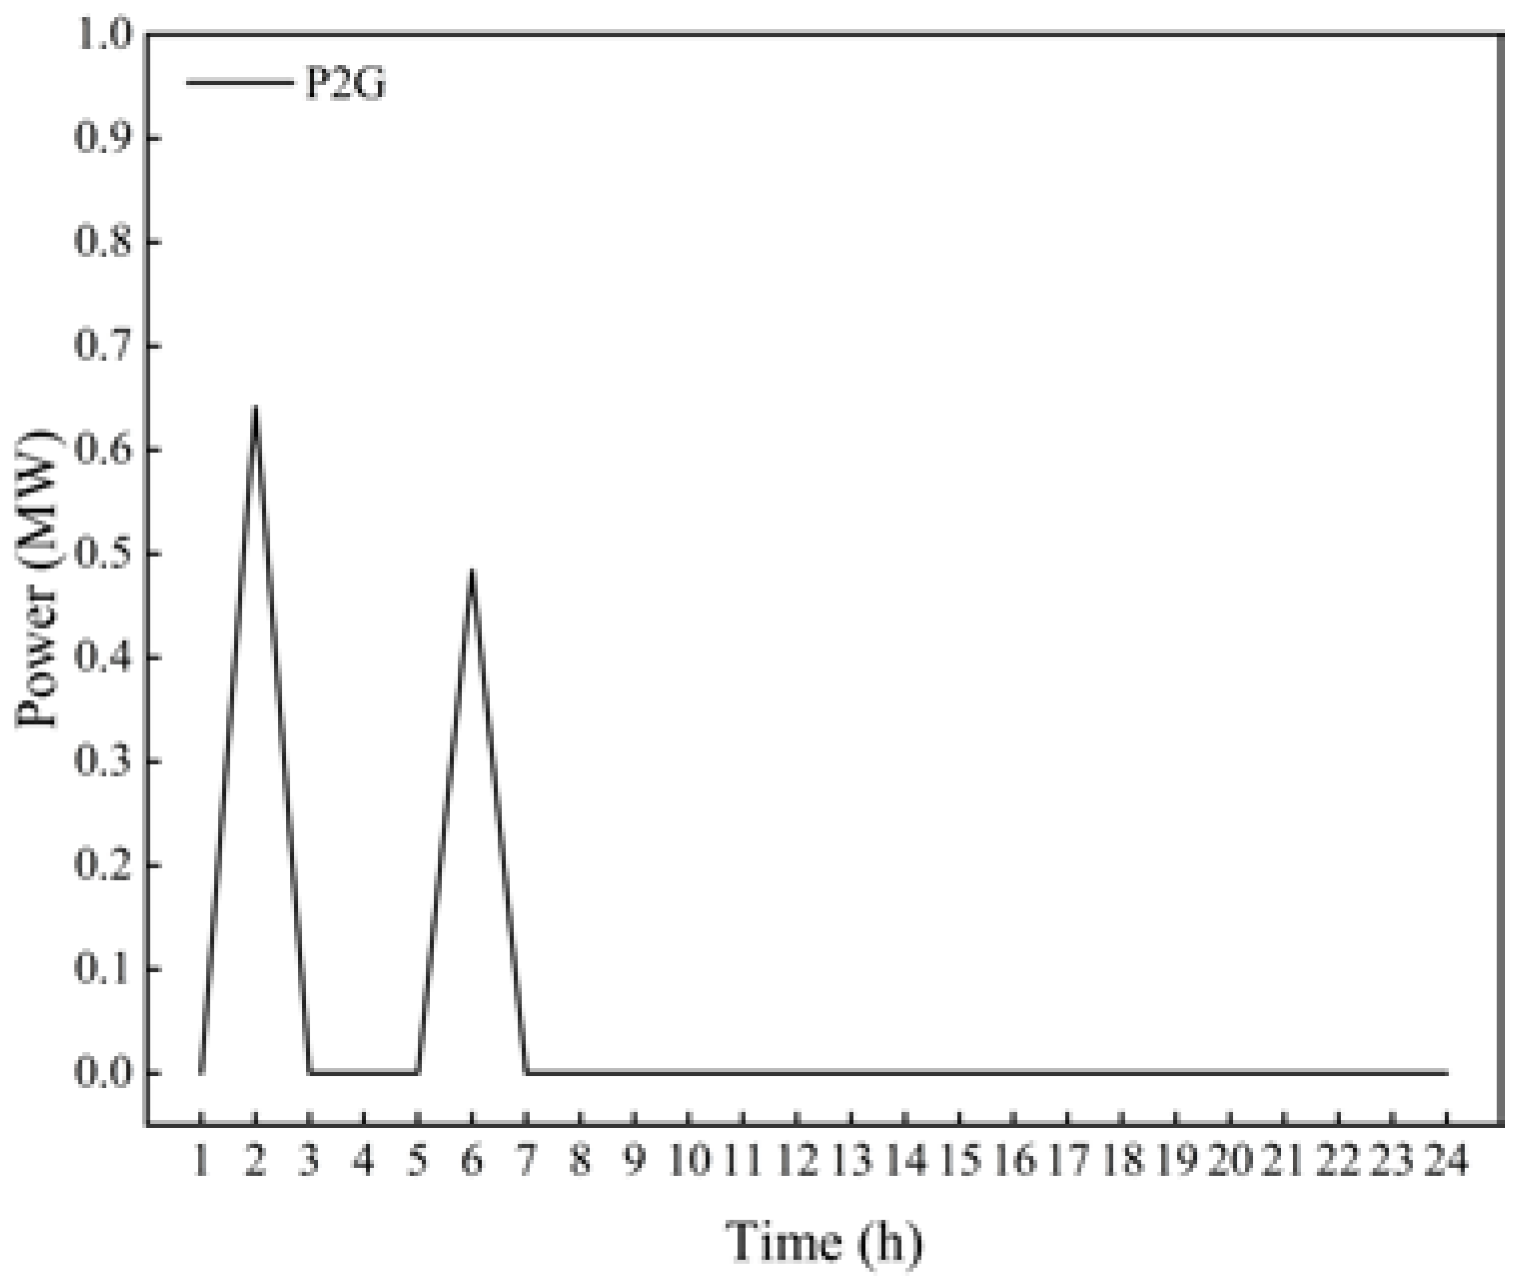
4 has unconsumed renewable energy, but the unconsumed amount is small. Therefore, 1 MW of electricity to gas equipment is added, and the P2G equipment works as shown in
Figure 8. The equipment only works at 2:00 and 6:00, which is a very low utilization rate for the P2G equipment.
The operating cost of PIES
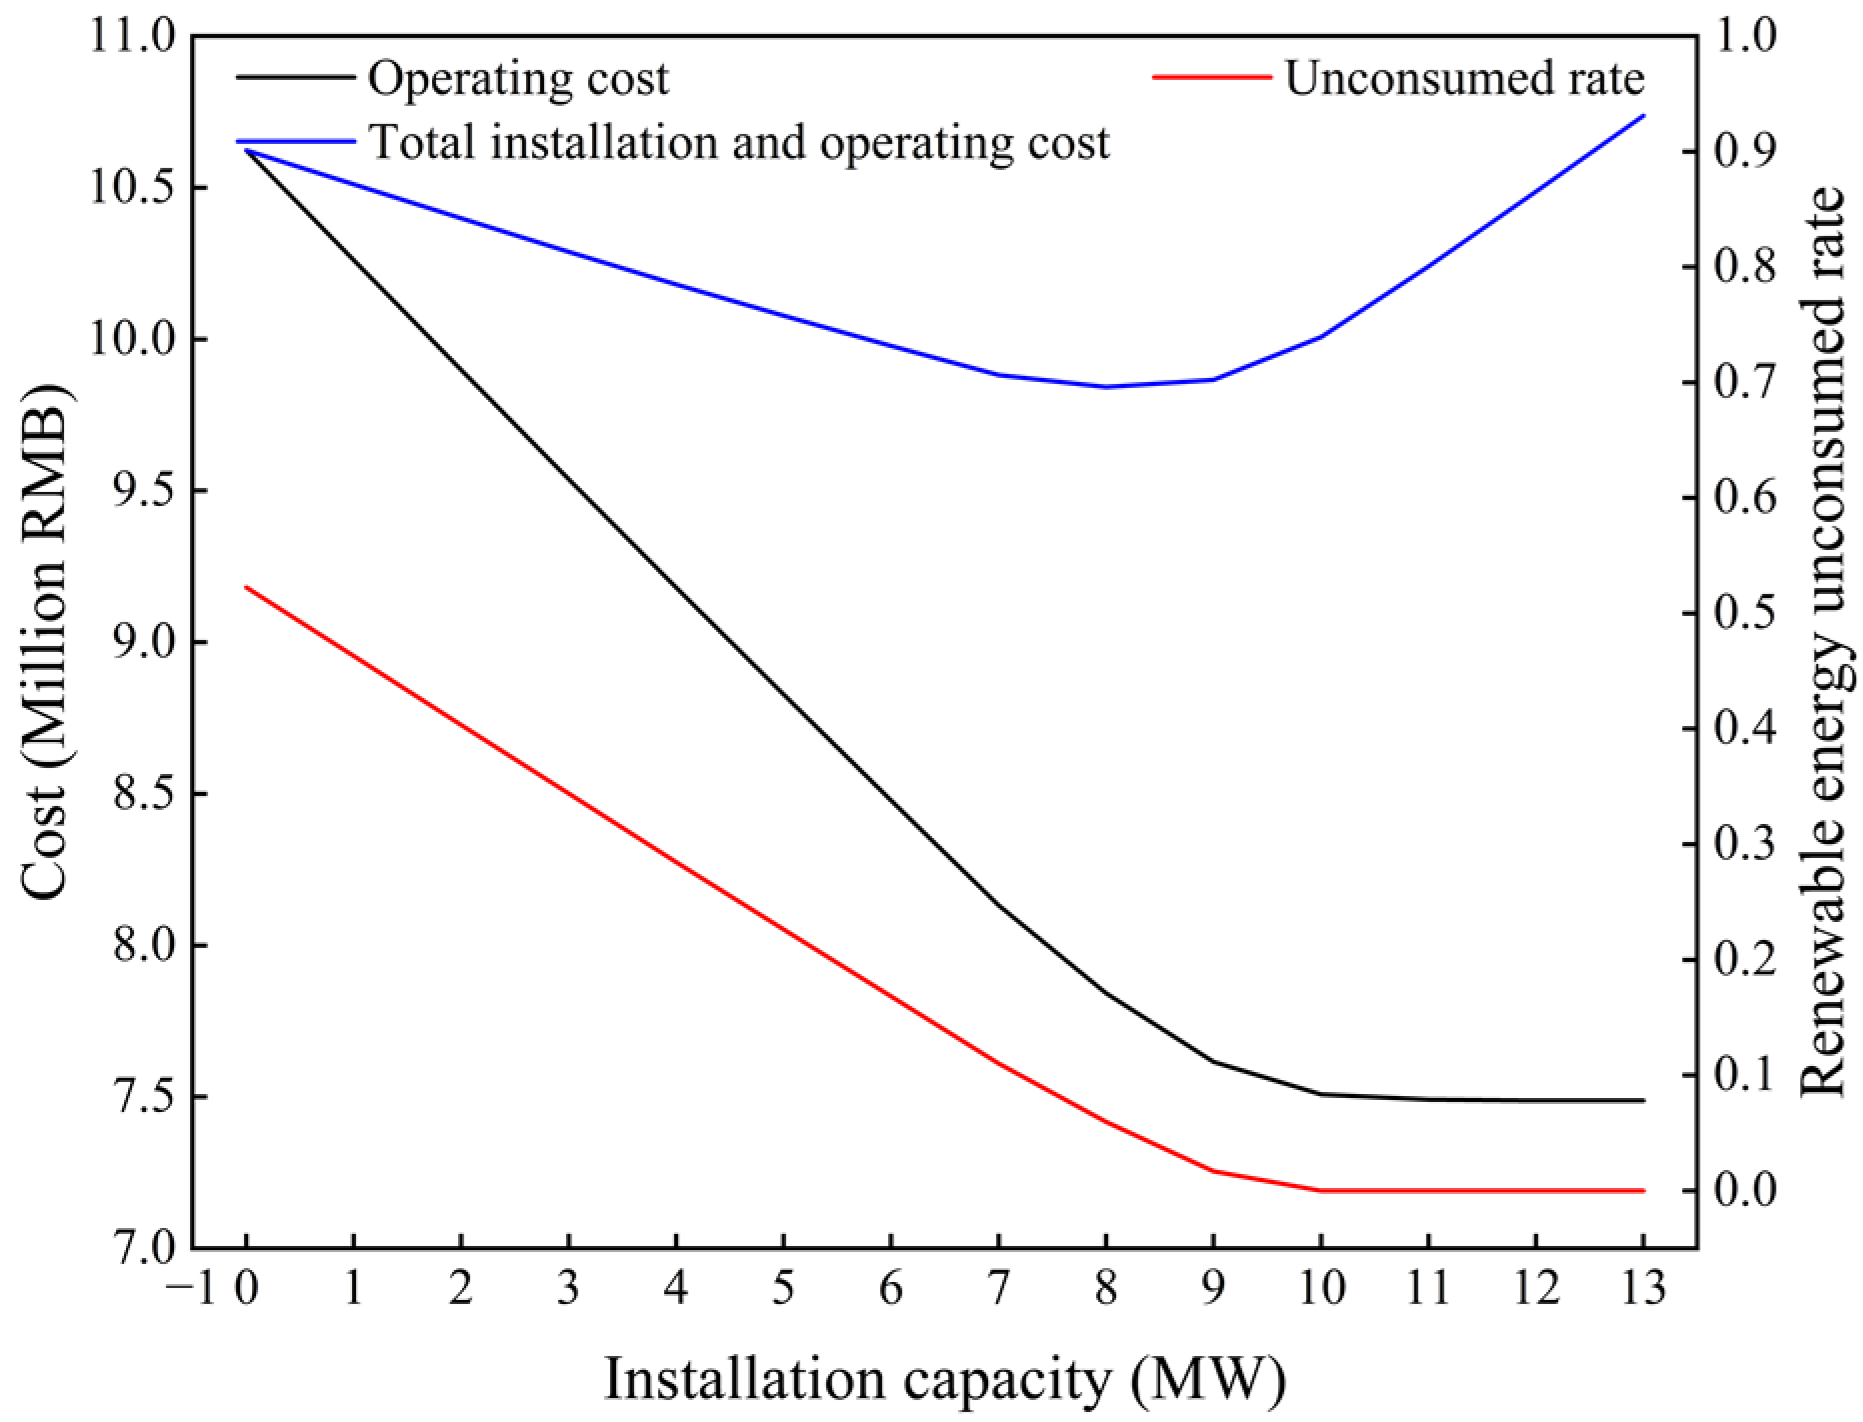
1, the total cost of installation and operation, and the renewable energy consumption of the system by installing different capacities of P2G equipment are shown in
Figure 9. As can be seen, PIES
1 has a large amount of surplus power, which requires installing additional larger capacity P2G equipment for renewable energy consumption.
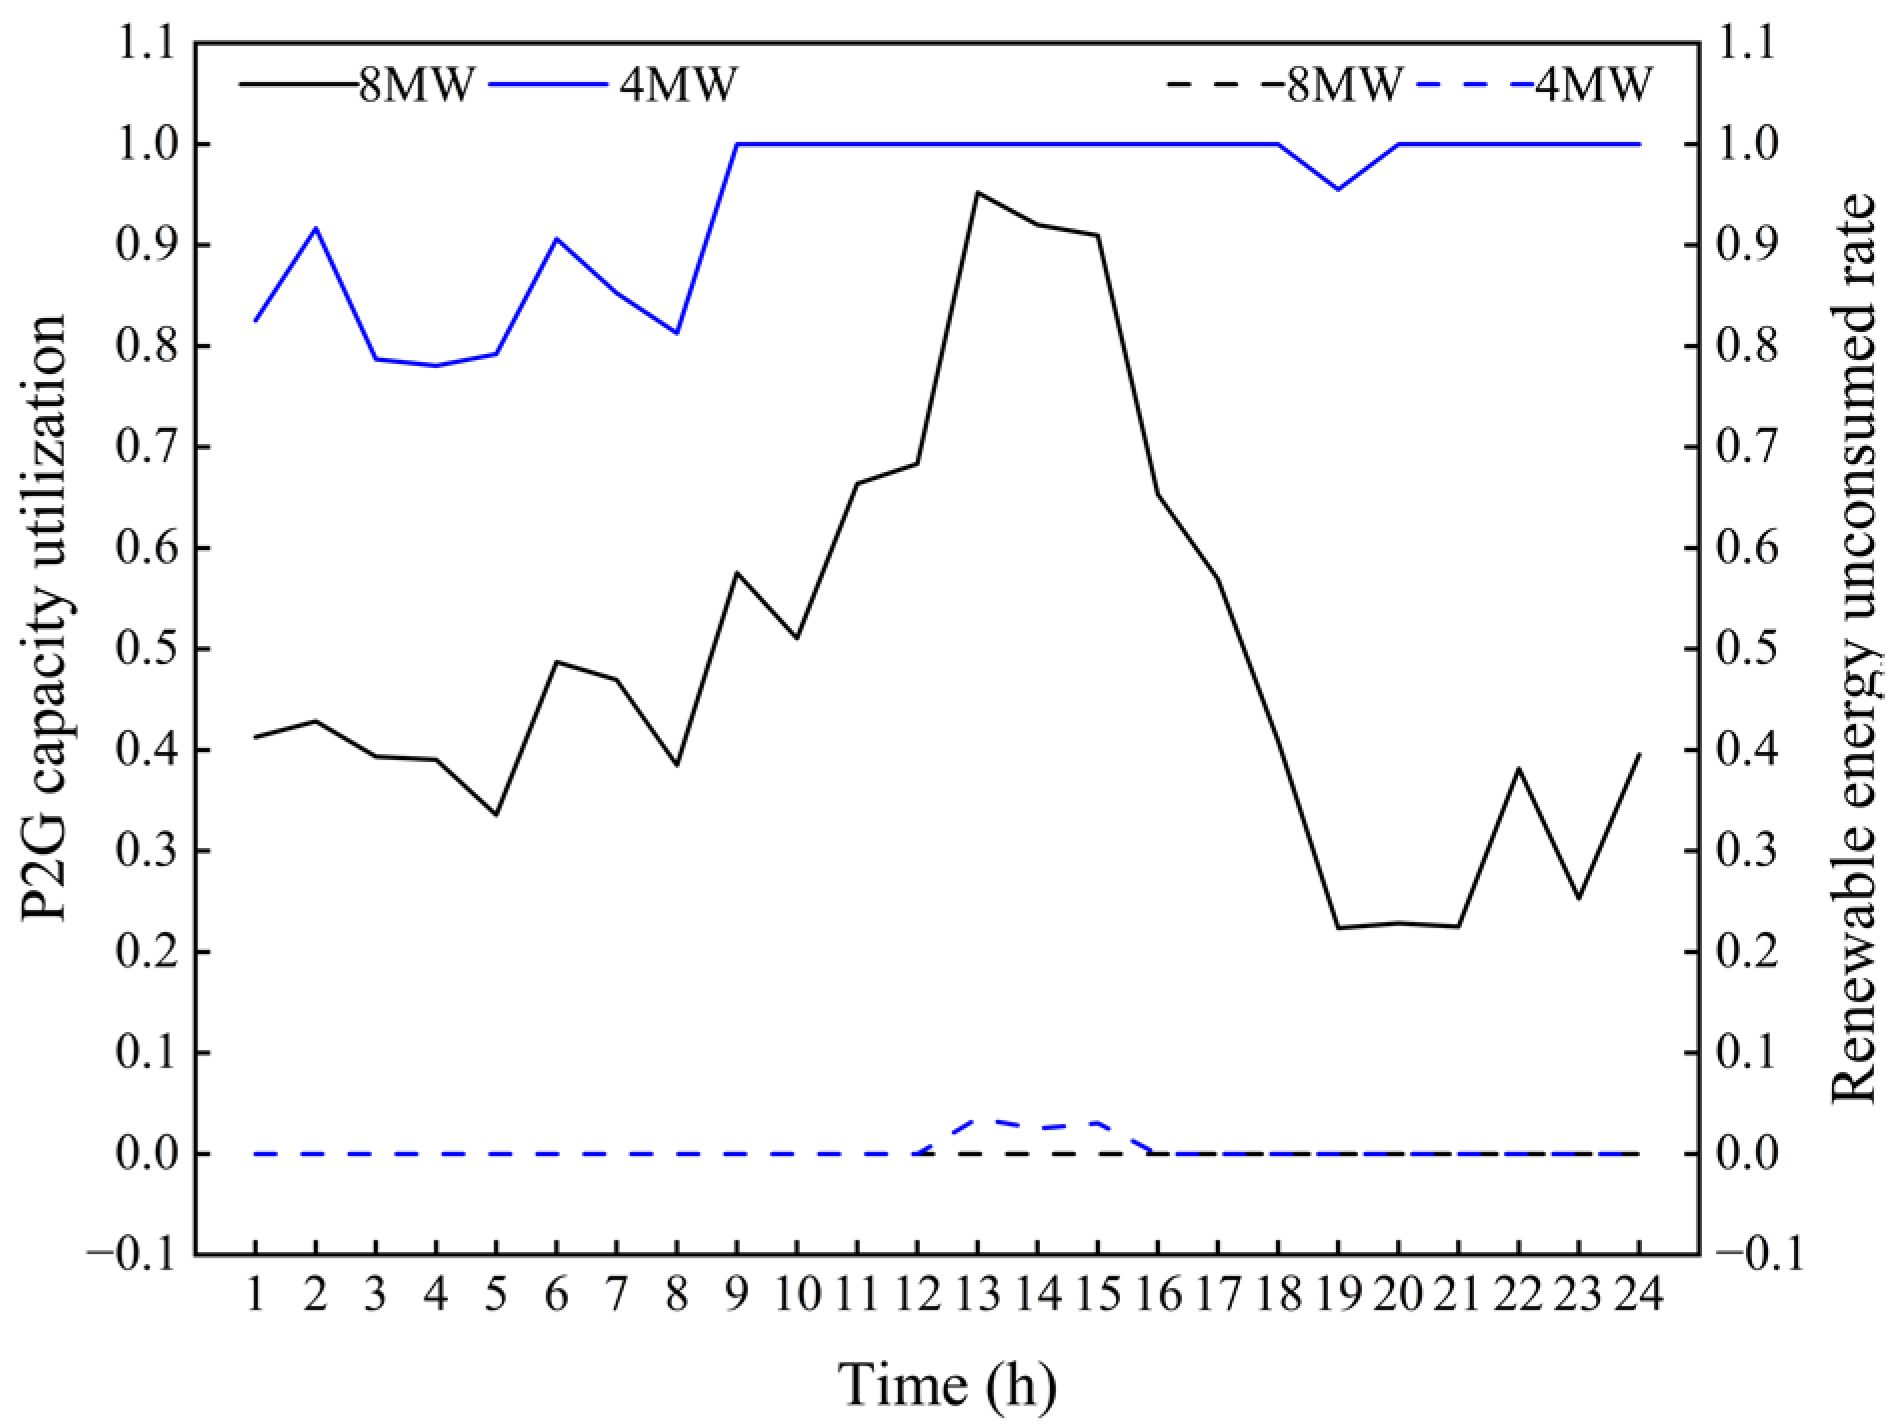
It can be seen from
Figure 9 that the larger the installed P2G capacity, the lower the unconsumed rate and the lower the operating cost, and the operating cost no longer decreases when the capacity reaches 12 MW. However, when the P2G capacity is greater than 8 MW, the equipment installation cost is greater than the economic benefit of the equipment to the system operation. Hence, the total system installation and operation cost increases. The equipment capacity with the lowest operating cost and total installation and operation cost is selected for further analysis. The equipment utilization and system consumption are shown in
Figure 10.
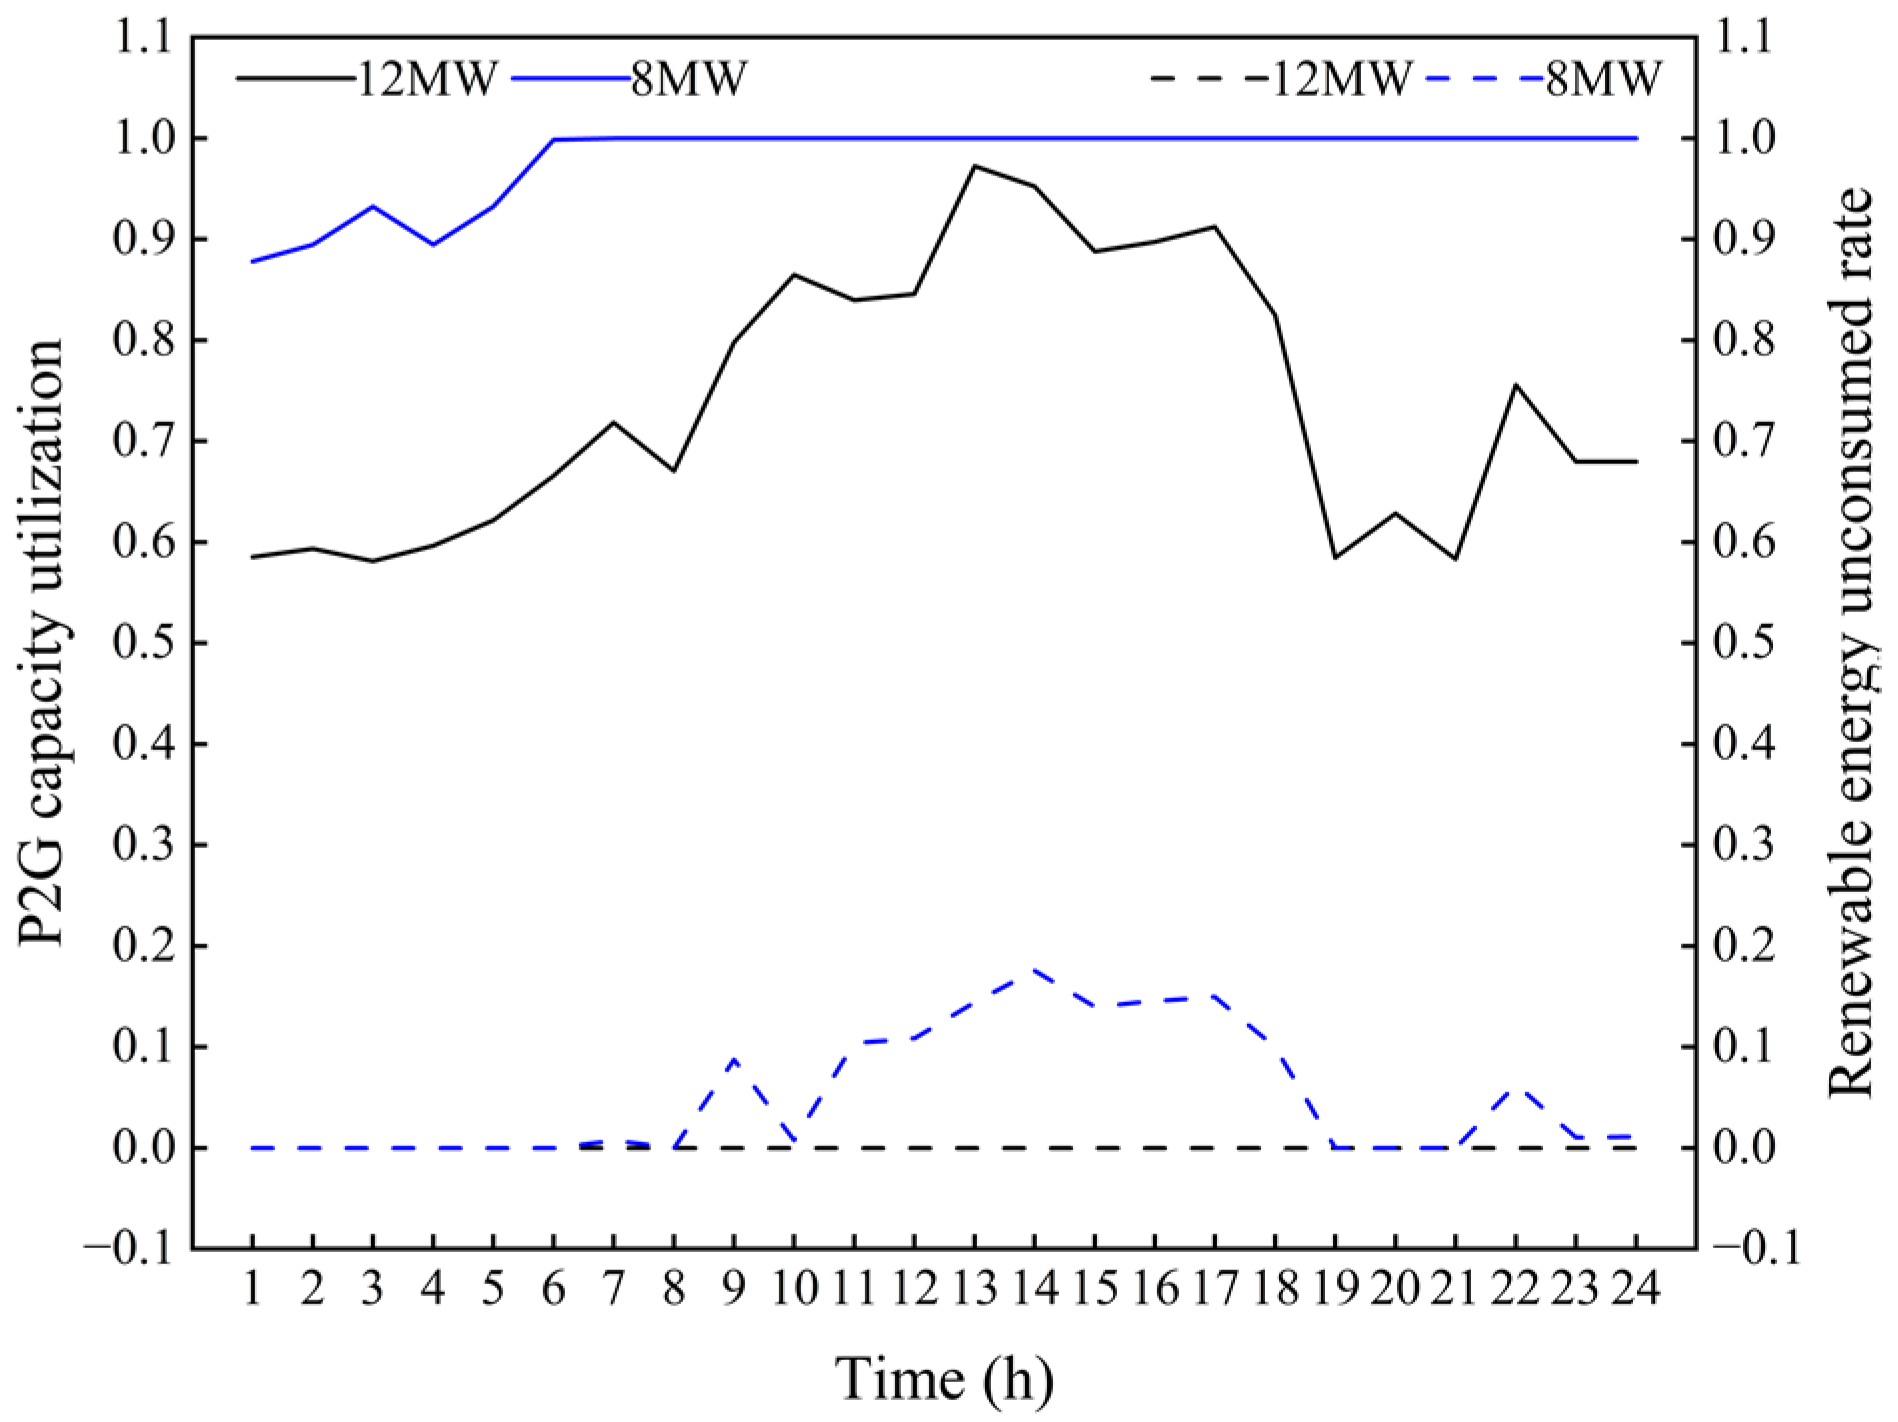
According to the operation results in
Figure 10, a 12 MW P2G equipment can fully consume the renewable energy of PIES
1, but the utilization rate of the equipment only reaches 80% or more at time 10:00–18:00. The utilization rate of P2G equipment is above 90% when the capacity of P2G equipment is set to 8 MW, and the equipment operates at full load most of the time. However, it cannot fully consume renewable energy, and the unconsumed rate of renewable energy for the entire day is 5.95%, and the highest unconsumed rate reaches 17.57% at 14:00.
From the above results, it can be concluded that the installation of additional P2G equipment promotes the renewable energy consumption of PIES. However, for independently operated PIES, the utilization rate of P2G equipment and renewable energy consumption rate cannot be guaranteed simultaneously.
4.3.3. Scenario 3 Results Analysis
According to scenario 3, the inter-network electric energy interaction is carried out for the four PIESs, with the lowest network loss as the target function to realize the RIESG energy mutual aid, without requiring an external power grid for power shortage replenishment.
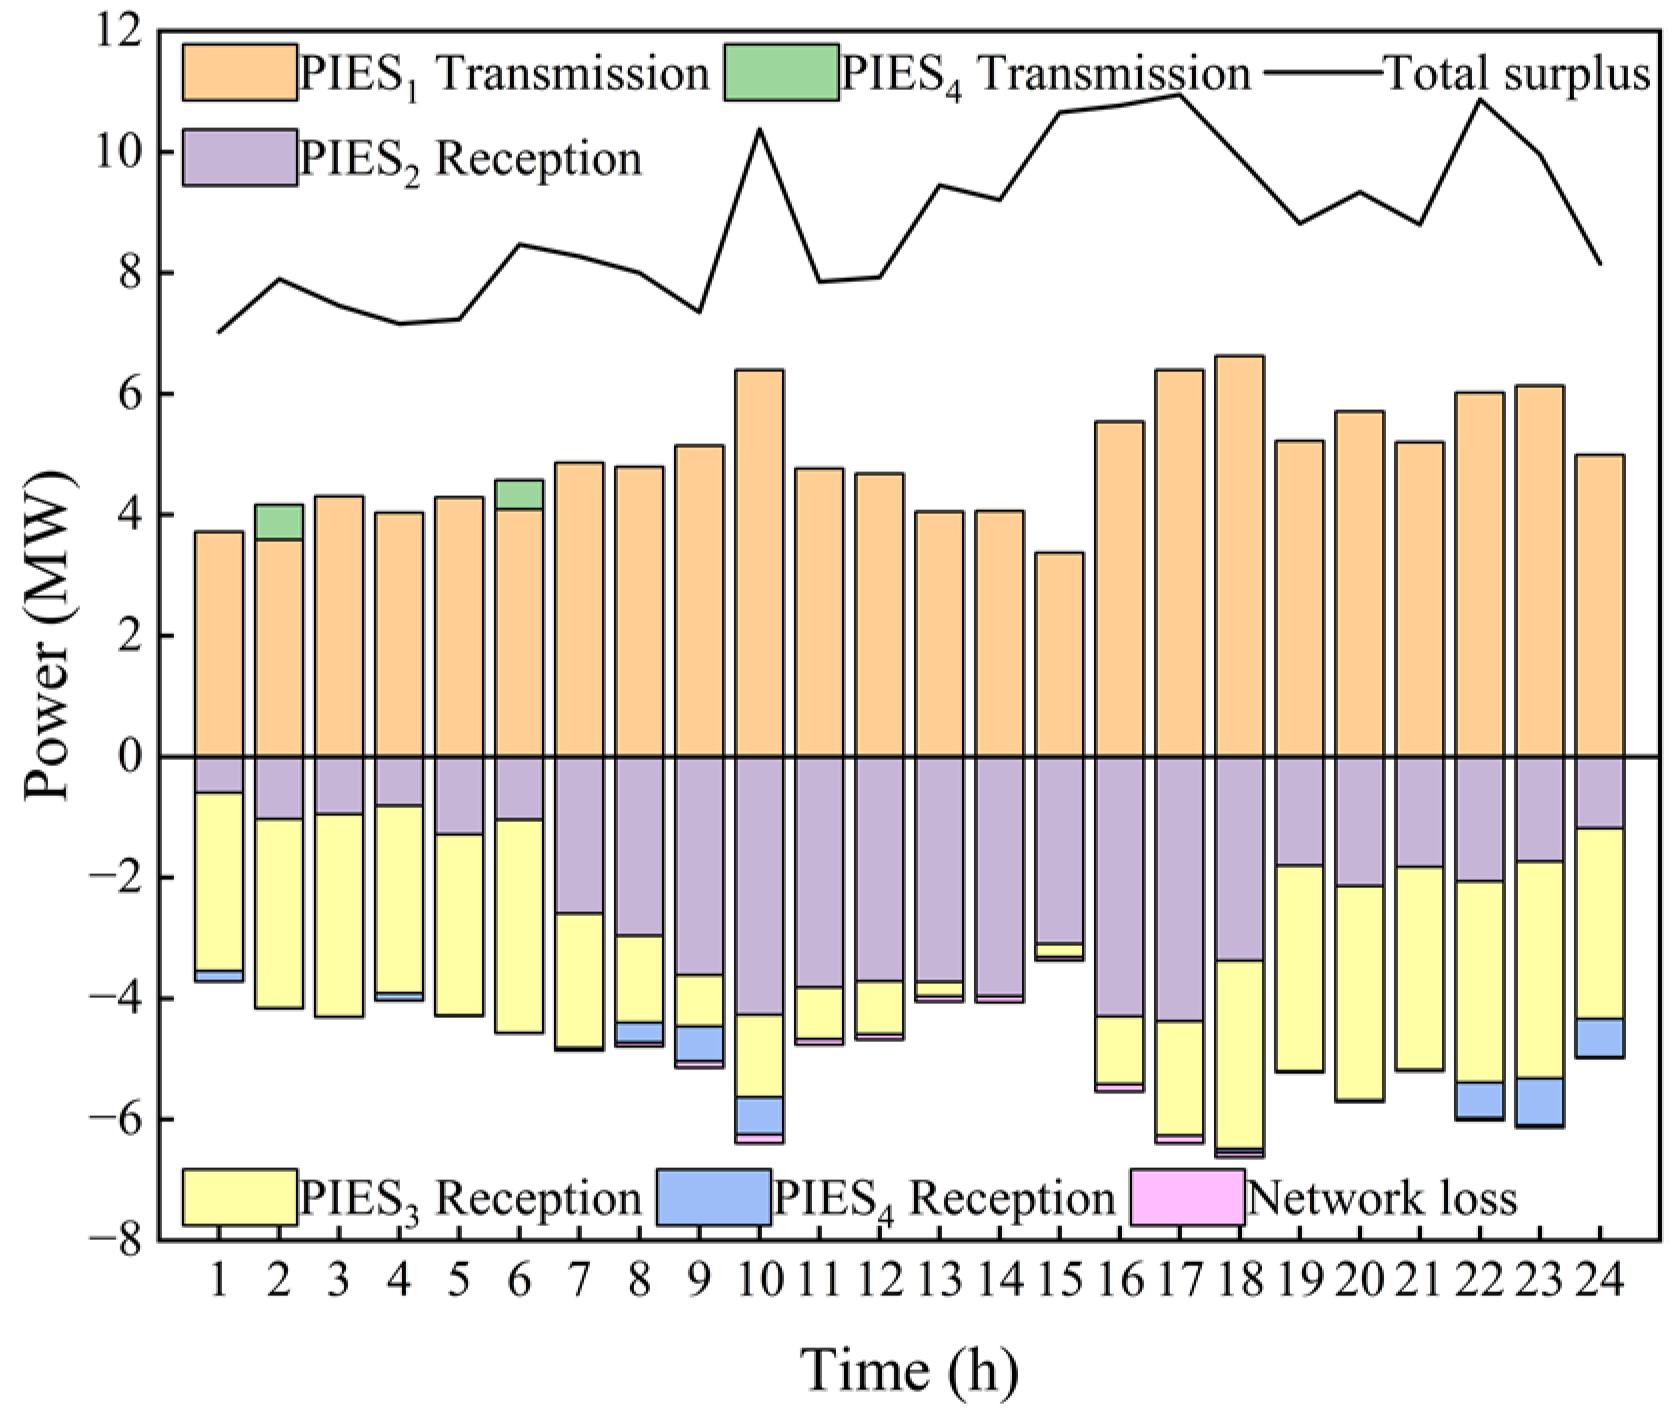
Figure 11 illustrates the electric energy transmission and reception of each park, and the load demand diagram of PIES
1 before and after an interaction is shown in
Figure 12.
Comparing
Figure 7 and
Figure 11, it can be seen that the complementary regional system transmits the surplus power in PIES
1 and PIES
4 to PIES
2 and PIES
3 for shortage replenishment. PIES
4 is able to consume the surplus power at 2:00 and 6:00, and the inter-park power interaction also covers the power shortage for the rest of the time. However, PIES
1 still has a large amount of unconsumed renewable energy after providing the power shortage in the rest of the parks, and the unconsumed power accounts for 30.03–68.30% of the surplus power before the interaction at each time. The above operation results and analysis prove that the interaction of multiple parks can play a complementary regional role and contribute to the overall renewable energy consumption. However, only relying on the form of mutual energy aid has a limited effect on the regional system, and cannot achieve the full consumption of renewable energy in the integrated energy system group.
4.3.4. Scenario 4 Results Analysis
Scenario 4 is the optimal dispatching scheme of RIESG considering P2G and park power interaction proposed in this paper. Based on scenario 3, additional P2G equipment is installed to further improve the capacity of PIES1 to consume renewable energy.
Figure 13 shows the system cost curves of adding different capacities of P2G equipment at PIES
1 after the inter-campus power interaction and the consumption situation. As can be seen, when the capacity is 8 MW, the operation cost is the lowest and the lowest total system installation, and operation cost occurs when the capacity is 4 MW. These two nodes are selected for further analysis. The equipment utilization and system consumption are shown in
Figure 14.
Compared with Scenario 2, the proposed solution in Scenario 4 consumes the surplus renewable energy in PIES
4 through the electric energy interaction between parks, and eliminates the additional P2G equipment installation in PIES
4. Moreover, it solves the problem of the “tip” of P2G equipment in PIES
4, as shown in
Figure 8. It also turns the disadvantage of park electricity shortage in PIES
2 and PIES
3 into the advantage of regional electricity consumption, to relieve the consumption pressure of PIES
1 and significantly reduce the installed capacity of P2G equipment. In this paper, the installation of 4 MW of additional P2G equipment is chosen by considering the system economy and renewable energy consumption capacity. In this condition, the utilization rate of the equipment is more than 78%, and the average utilization rate reaches 94.28%, which solves the significant installed capacity requirement problem. Furthermore, the operation is “peak”, and the overall utilization rate is not high due to the cost of P2G installation in existing studies. The solution only has a small amount of unconsumed renewable energy between 13:00 and 15:00, the highest unconsumed rate is 3.51%, and the whole day unconsumed rate is 0.44%, which improves the equipment utilization rate and ensures the system’s consumption rate.
Scenario 4 adds 4 MW of P2G equipment and obtains the following results for the optimal dispatch of the RIESG.
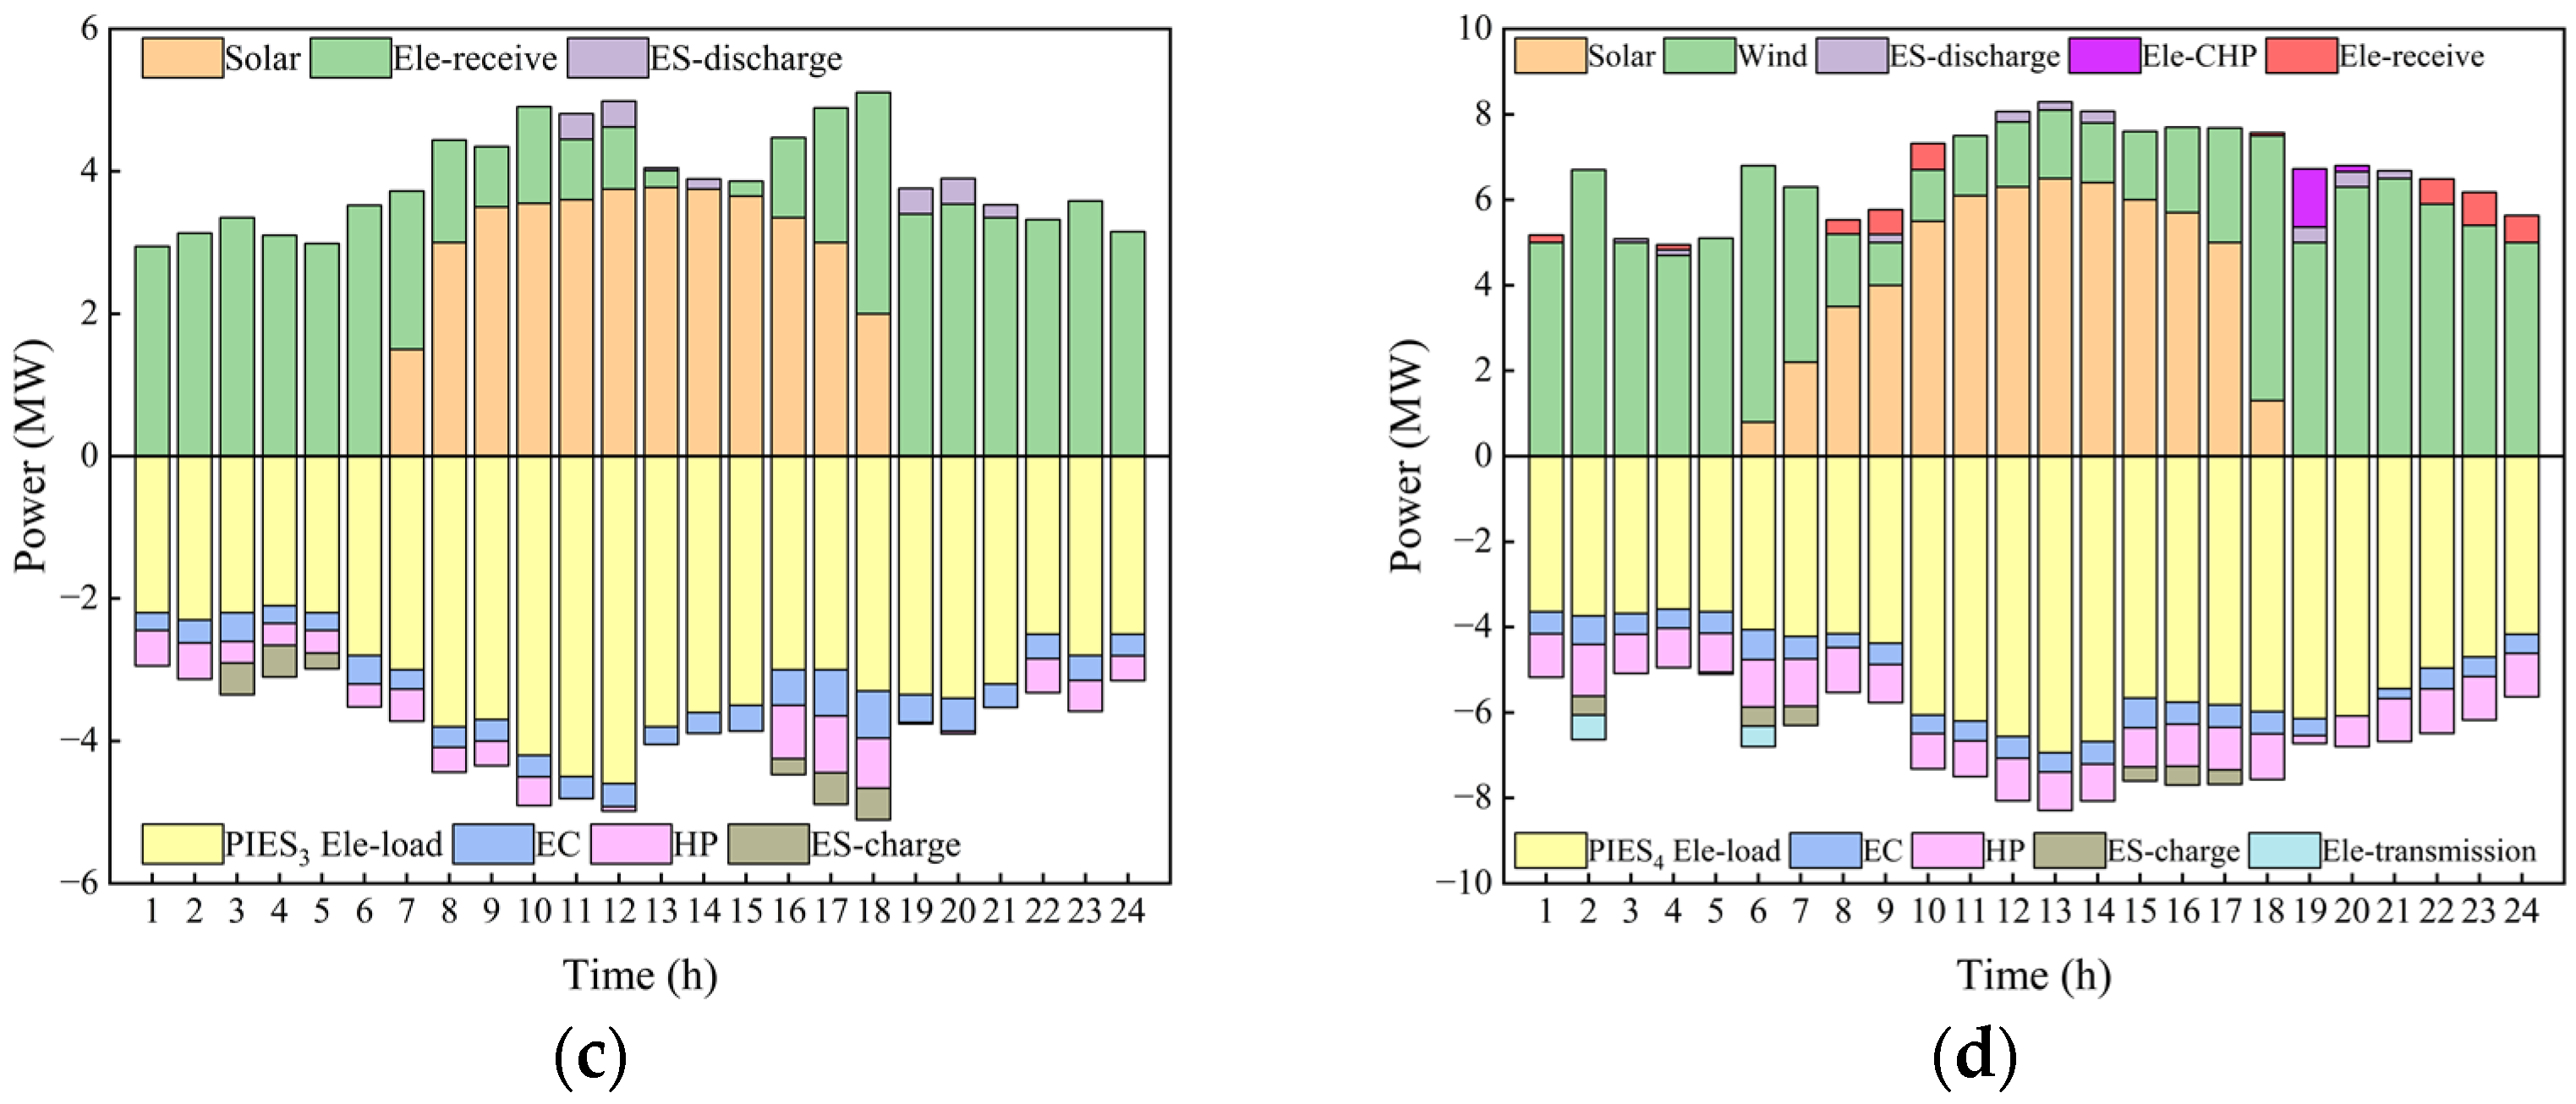
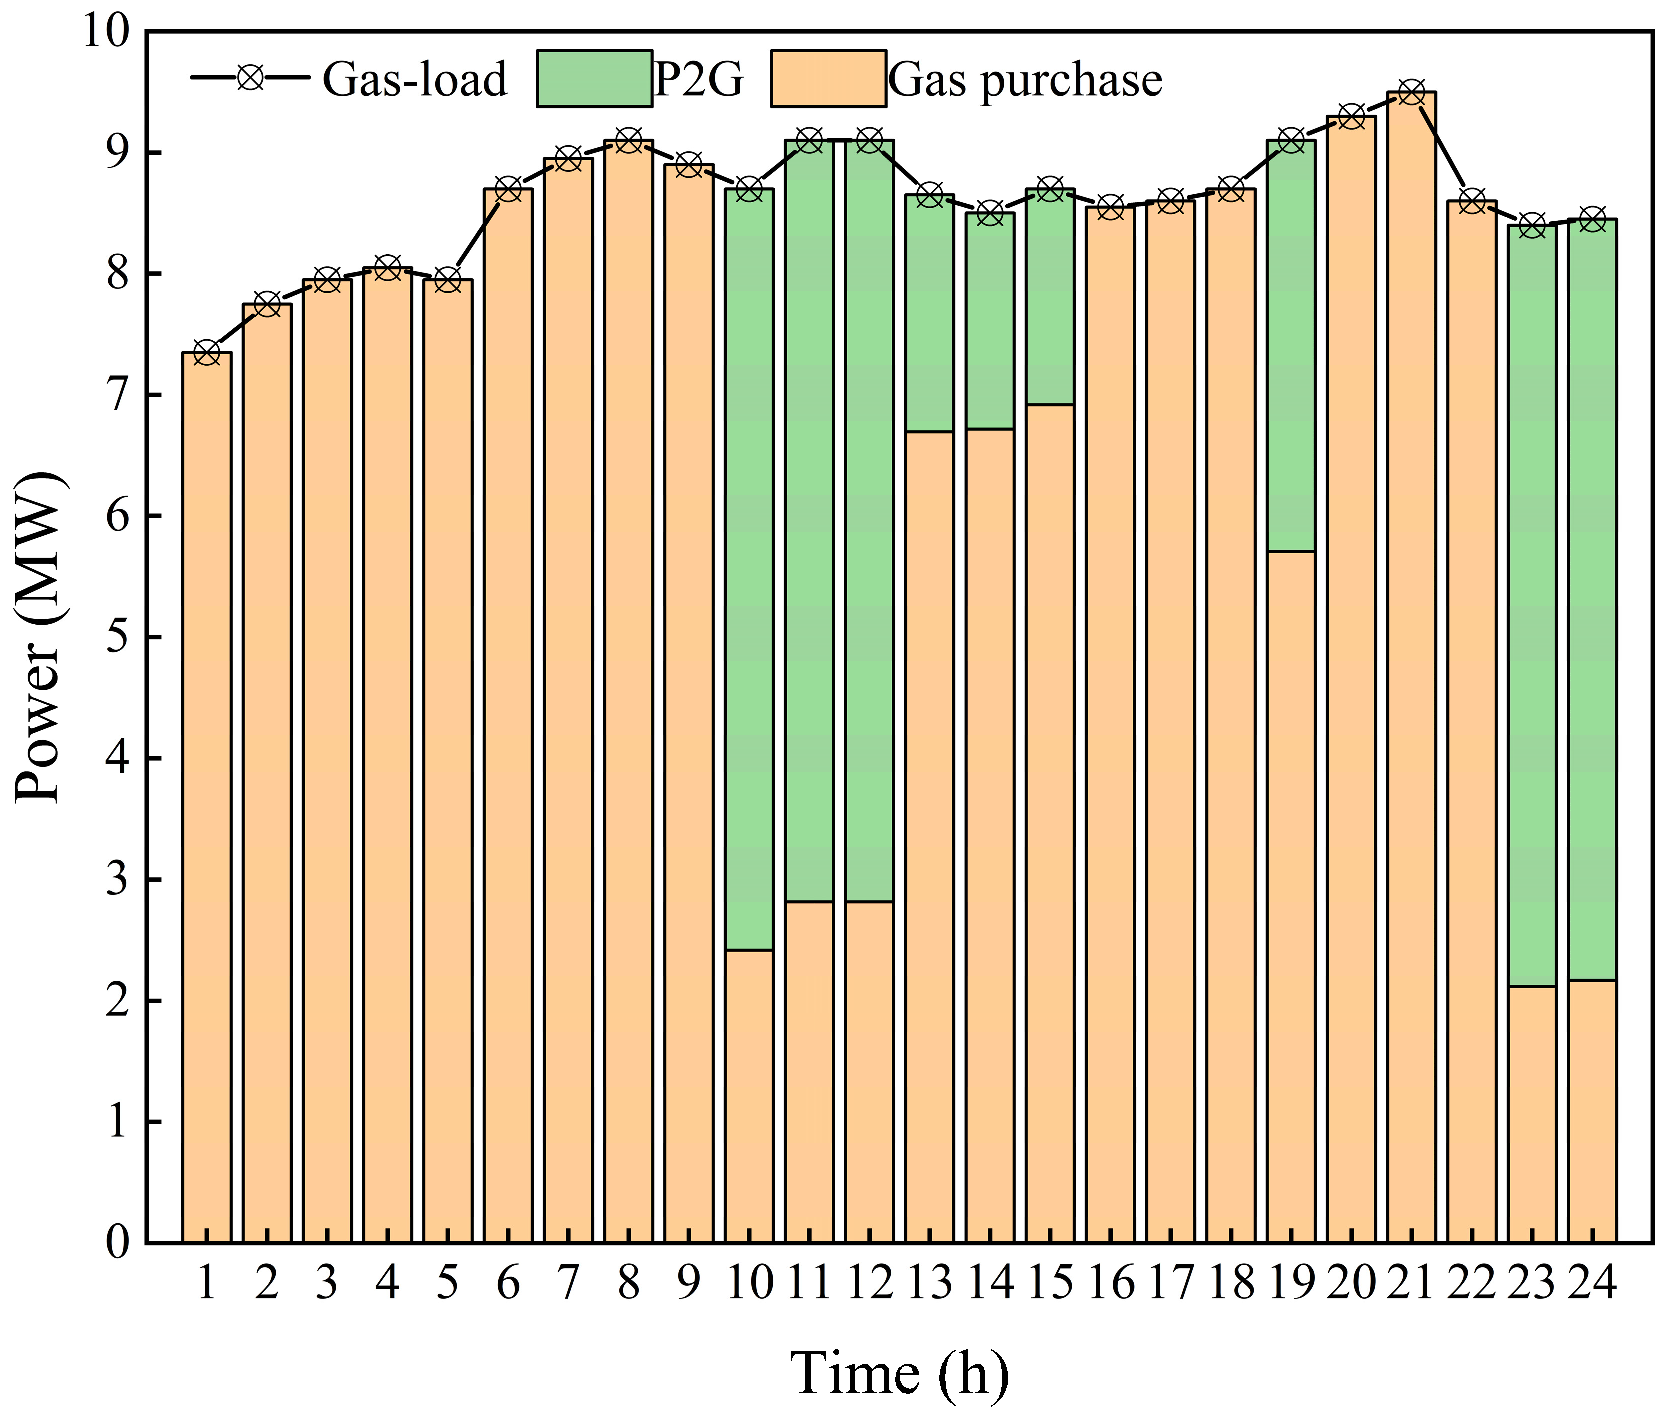
In
Figure 15,
Figure 16 and
Figure 17, part of the surplus renewable energy of PIES
1 is used to make up the electric difference to other power shortage type parks, through the electric energy interaction of the parks within the region. Moreover, the other part is electrically coupled through the electric to gas equipment to meet part of the gas load demand. The optimal scheduling of RIESG can complement the advantages and disadvantages of each park within the region and fully use each park’s internal energy storage elements to maximize the economy of the RIESG. The total cost of each RIESG category consisting of four parks under each scenario is shown in
Table 2.
From
Table 2, the effect of P2G and regional complementarity on the economic operation of the RIESG can be analyzed. The results show that the P2G equipment mainly decreases the total system cost by reducing the gas purchase cost, and improving the renewable energy consumption capacity. Moreover, the complementary regional system mainly reduces the total system cost by declining the power purchase, energy disposal costs, and the capacity of power-to-gas equipment. In this situation, the total cost of system installation and operation of the proposed scheme is the lowest, at 34.83% lower than the total cost of independent operation of each park in Scenario 1.


