
ZnMn2O4 Nanopyramids Fabrication by Hydrothermal Route: Effect of Reaction Time on the Structural, Morphological, and Electrochemical Properties

 ,
,  ,
,  ,
,  and
and 
Abstract
:
1. Introduction
2. Materials and Methods
2.1. Materials Synthesis
2.2. Materials Characterization
2.3. Electrochemical Measurements
3. Results and Discussion
3.1. Materials Characterization
3.2. Electrochemical Studies

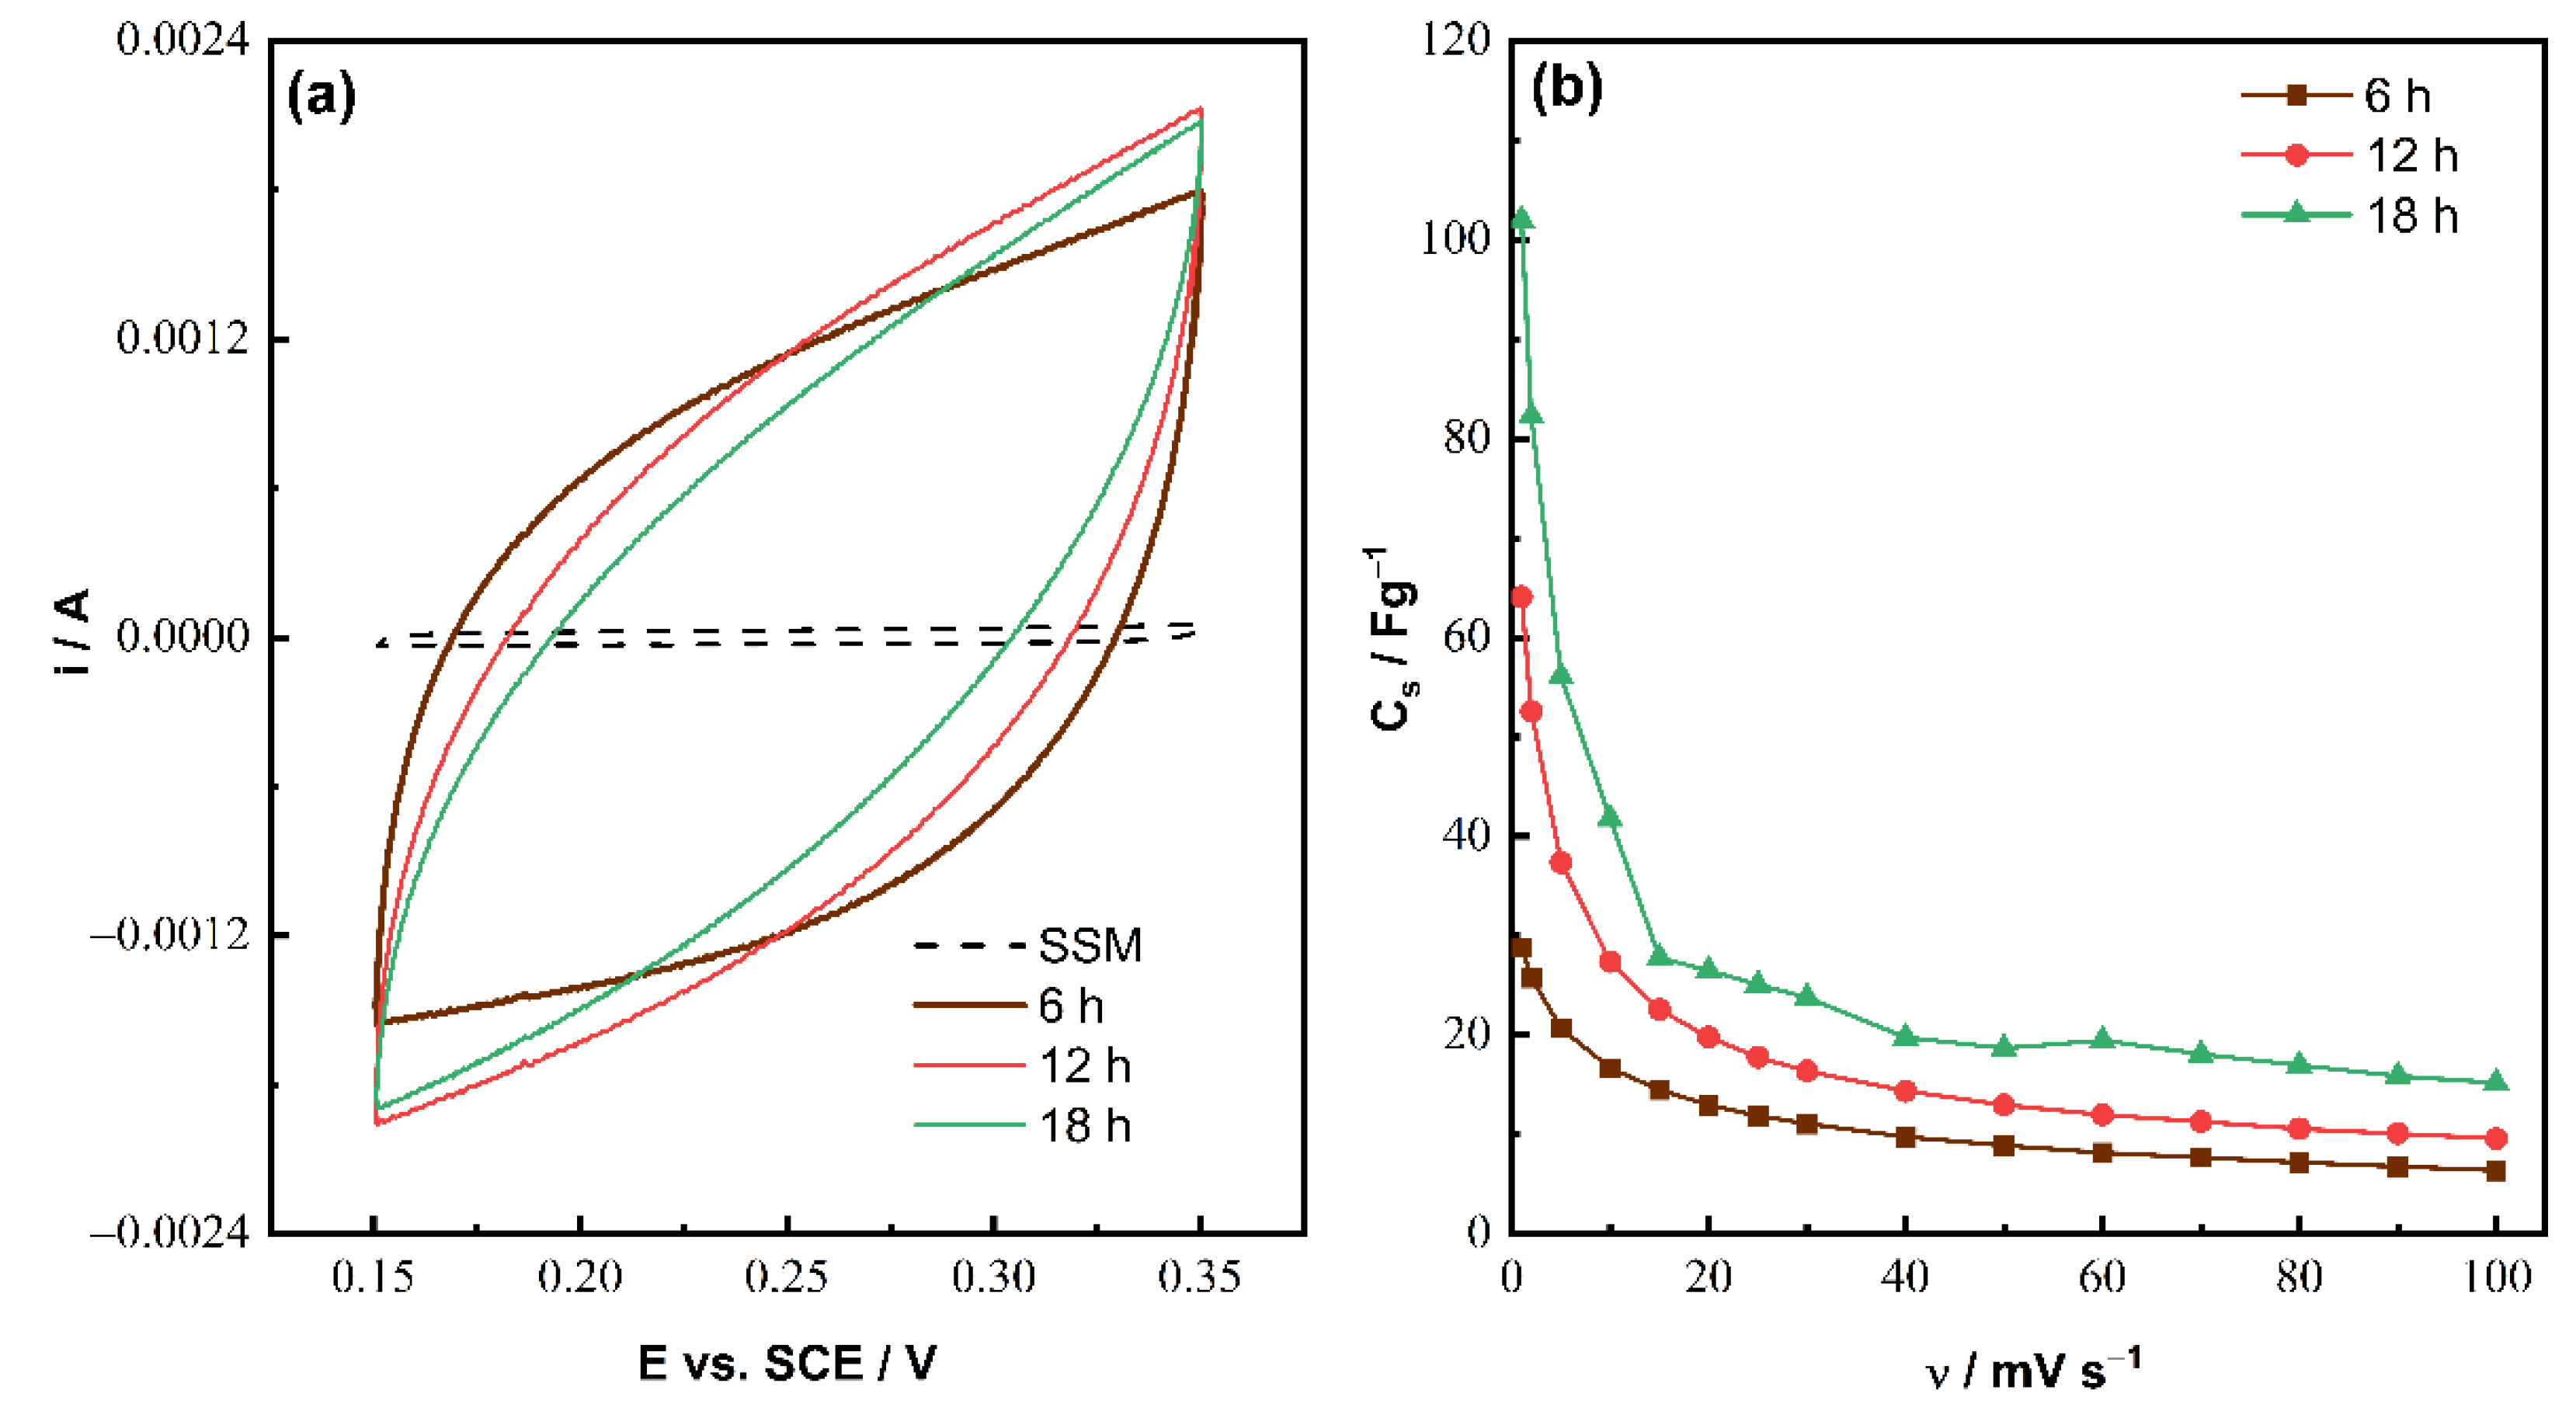
| Working Electrode | Substrate | Fabrication Method | Electrolyte | Scan Rate (mV s−1) | Cs (F g−1) | Source |
|---|---|---|---|---|---|---|
| ZnMn2O4 | SSM | hydrothermal | Na2SO4 (1 M) | 1 | 102 | Present work |
| ZnMn2O4 | nickel foil | hydrothermal | Na2SO4 (1 M) | 1 | 87 | [46] |
| ZnMn2O4 | Ti | modified solution combustion | Na2SO4 (1.75 M) | 2 | 38 | [48] |
| C-ZnMn2O4 | Ti | modified solution combustion | Na2SO4 (1.75 M) | 2 | 75 | [48] |
| ZnMn2O4 | − | sol-gel auto-combustion | Na2SO4 (2 M) | 5 | 96 | [49] |
| ZnMn2O4 | nickel foil | hydrothermal | KOH (3 M) | 5 | 492 | [33] |
| ZnMn2O4 | nickel foil | hydrothermal | KOH (2 M) | 5 | 776 | [23] |
| Cd-ZnMn2O4 | nickel foam | hydrothermal | KOH (2 M) | 2 | 364 | [50] |
4. Conclusions
Author Contributions
Funding
Data Availability Statement
Acknowledgments
Conflicts of Interest
References
- Nandagudi, A.; Nagarajarao, S.H.; Santosh, M.S.; Basavaraja, B.M.; Malode, S.J.; Mascarenhas, R.J.; Shetti, N.P. Hydrothermal Synthesis of Transition Metal Oxides, Transition Metal Oxide/Carbonaceous Material Nanocomposites for Supercapacitor Applications. Mater. Today Sustain. 2022, 19, 100214. [Google Scholar] [CrossRef]
- Liu, C.; Li, F.; Ma, L.-P.; Cheng, H.-M. Advanced Materials for Energy Storage. Adv. Mater. Lett. 2010, 22, E28–E62. [Google Scholar] [CrossRef] [PubMed]
- Mustaqeem, M.; Naikoo, G.A.; Yarmohammadi, M.; Pedram, M.Z.; Pourfarzad, H.; Dar, R.A.; Taha, S.A.; Hassan, I.U.; Bhat, M.Y.; Chen, Y.-F. Rational Design of Metal Oxide Based Electrode Materials for High Performance Supercapacitors—A Review. J. Energy Storage 2022, 55, 105419. [Google Scholar] [CrossRef]
- Aouini, S.; Bardaoui, A.; Santos, D.M.F.; Chtourou, R. Hydrothermal Synthesis of CuMn2O4 Spinel-Coated Stainless Steel Mesh as a Supercapacitor Electrode. J. Mater. Sci. Mater. Electron. 2022, 33, 12726–12733. [Google Scholar] [CrossRef]
- Zhai, Z.; Zhang, L.; Du, T.; Ren, B.; Xu, Y.; Wang, S.; Miao, J.; Liu, Z. A Review of Carbon Materials for Supercapacitors. Mater. Des. 2022, 221, 111017. [Google Scholar] [CrossRef]
- Jamwal, D.; Hussain, S.; Rohit; Rana, D.; Katoch, A.; Mehta, S.K. Mixed Transition Metal Oxide Nanostructures Based Supercapacitors. In Ency of Energy Storage; Elsevier: Amsterdam, The Netherlands, 2022; pp. 566–580. [Google Scholar]
- Yadav, S.; Sharma, A. Importance and Challenges of Hydrothermal Technique for Synthesis of Transition Metal Oxides and Composites as Supercapacitor Electrode Materials. J. Energy Storage 2021, 44, 103295. [Google Scholar] [CrossRef]
- Senthilkumar, N.; Venkatachalam, V.; Kandiban, M.; Vigneshwaran, P.; Jayavel, R.; Vetha Potheher, I. Studies on Electrochemical Properties of Hetarolite (ZnMn2O4) Nanostructure for Supercapacitor Application. Phys. E Low Dimens. Syst. Nanostruct. 2019, 106, 121–126. [Google Scholar] [CrossRef]
- Liang, C.; Chen, J.; Yu, K.; Jin, W. ZnMn2O4 Spheres Anchored on Jute Porous Carbon for Use as a High-Performance Anode Material in Lithium-Ion Batteries. J. Alloys Compd. 2021, 878, 160445. [Google Scholar] [CrossRef]
- uz Zaman, F.; Nagamuthu, S.; Cui, K.; Hou, L.; Yuan, C. Microwave-Assisted Synthesis of Porous Heterojunction ZnO/ZnMn2O4 Microrods for Efficient Degradation of Organic Pollutants. Inorg. Chem. Commun. 2022, 144, 109845. [Google Scholar] [CrossRef]
- Azmoodeh, Z.; Milani Moghaddam, H.; Nasirian, S. Hydrogen Gas Sensing Feature of Polypyrrole Nanofibers Assisted by Spinel ZnMn2O4 Microspheres in Dynamic Conditions. Int. J. Hydrog. Energy 2022, 47, 29971–29984. [Google Scholar] [CrossRef]
- Cai, K.; Luo, S.; Cong, J.; Li, K.; Yan, S.; Hou, P.; Song, Y.; Wang, Q.; Zhang, Y.; Liu, X.; et al. Sol-Gel Synthesis of Nano Block-like ZnMn2O4 Using Citric Acid Complexing Agent and Electrochemical Performance as Anode for Lithium-Ion Batteries. J. Alloys Compd. 2022, 909, 164882. [Google Scholar] [CrossRef]
- Li, H.; Song, B.; Wang, W.J.; Chen, X.L. Facile Synthesis, Thermal, Magnetic, Raman Characterizations of Spinel Structure ZnMn2O4. Mater. Chem. Phys. 2011, 130, 39–44. [Google Scholar] [CrossRef]
- Zhou, P.; Zhong, L.; Liu, Z.; Liu, M.; Zhou, T.; Zhao, Y.; Lai, X.; Bi, J.; Gao, D. Porous ZnMn2O4 Hollow Microrods: Facile Construction and Excellent Electrochemical Performances for Lithium Ion Batteries. Appl. Surf. Sci. 2022, 578, 152087. [Google Scholar] [CrossRef]
- Gherbi, R.; Bessekhouad, Y.; Trari, M. Optical and Transport Properties of Sn-Doped ZnMn2O4 Prepared by Sol–Gel Method. J. Phys. Chem. Solids 2016, 89, 69–77. [Google Scholar] [CrossRef]
- Chen, X.; Zhang, Y.; Lin, H.; Xia, P.; Cai, X.; Li, X.; Li, X.; Li, W. Porous ZnMn2O4 Nanospheres: Facile Synthesis through Microemulsion Method and Excellent Performance as Anode of Lithium Ion Battery. J. Power Sources 2016, 312, 137–145. [Google Scholar] [CrossRef]
- Sutar, R.A.; Kumari, L.; Murugendrappa, M.V. Temperature-Dependent Transport Properties of Micro and Nano-Sized Zinc Cobalt Oxide (ZnCo2O4) and Zinc Manganese Oxide (ZnMn2O4) Particles Synthesized by a Hydrothermal Route. Ceram. Int. 2020, 46, 22492–22503. [Google Scholar] [CrossRef]
- Annalakshmi, M.; Kumaravel, S.; Balamurugan, T.S.T.; Chen, S.-M.; He, J.-L. Facile Solvothermal Synthesis of Ultrathin Spinel ZnMn2O4 Nanospheres: An Efficient Electrocatalyst for in Vivo and in Vitro Real Time Monitoring of H2O2. J. Electroanal. Chem. 2021, 900, 115674. [Google Scholar] [CrossRef]
- Fan, B.; Hu, A.; Chen, X.; Zhang, S.; Tang, Q.; Wang, J.; Deng, W.; Liu, Z.; Xiao, K. Hierarchical Porous ZnMn2O4 Microspheres as a High-Performance Anode for Lithium-Ion Batteries. Electrochim. Acta 2016, 213, 37–45. [Google Scholar] [CrossRef]
- Alfaruqi, M.H.; Rai, A.K.; Mathew, V.; Jo, J.; Kim, J. Pyro-Synthesis of Nanostructured Spinel ZnMn2O4/C as Negative Electrode for Rechargeable Lithium-Ion Batteries. Electrochim. Acta 2015, 151, 558–564. [Google Scholar] [CrossRef]
- Müller, G.; Friedrich, J. Crystal Growth, Bulk: Methods. In Ency Condens Matter Phys; Elsevier: Amsterdam, The Netherlands, 2005; pp. 262–274. [Google Scholar]
- Barkhordari, H.; Heydari, H.; Nosrati, A.; Mohammadi, J. Facile Synthesis of ZnMn2O4 Nanosheets via Cathodic Electrodeposition: Characterization and Supercapacitor Behavior Studies. Ionics 2019, 25, 275–285. [Google Scholar] [CrossRef]
- Mani, M.P.; Venkatachalam, V.; Thamizharasan, K.; Jothibas, M. Evaluation of Cubic-Like Advanced ZnMn2O4 Electrode for High-Performance Supercapacitor Applications. J. Electron. Mater. 2021, 50, 4381–4387. [Google Scholar] [CrossRef]
- Dias, A.; Bundaleska, N.; Felizardo, E.; Tsyganov, D.; Almeida, A.; Ferraria, A.M.; Botelho do Rego, A.M.; Abrashev, M.; Strunskus, T.; Santhosh, N.M.; et al. N-Graphene-Metal-Oxide(Sulfide) Hybrid Nanostructures: Single-Step Plasma-Enabled Approach for Energy Storage Applications. J. Chem. Eng. 2022, 430, 133153. [Google Scholar] [CrossRef]
- Gadkari, D.B. Study of the Ga Doped In(1−x)GaxSb (X = 0.10, 0.15, 0.25) Crystals’ the Compositional, Structural, Electrical, and the Microstructures Properties: Growth by the VDS-Process. Int. J. Eng. Res. Appl. 2020, 10, 35–51. [Google Scholar]
- Scherrer, P. Estimation of the Size and Internal Structure of Colloidal Particles by Means of Röntgen. Nachr. Ges. Wiss. Göttingen 1918, 2, 96–100. [Google Scholar]
- Williamson, G.K.; Hall, W.H. X-Ray Line Broadening from Filed Al and W. Acta Metal. 1953, 1, 22–31. [Google Scholar] [CrossRef]
- Heiba, Z.K.; Deyab, M.A.; El-naggar, A.M.; Mohamed, M.B. Electrochemical Performance of Quaternary (1-x)ZnMn2O4/(x)MgFe2O4 Solid Solution as Supercapacitor Electrode. Ceram. Int. 2021, 47, 7475–7486. [Google Scholar] [CrossRef]
- Patra, P.; Naik, I.; Bhatt, H.; Kaushik, S.D. Structural, Infrared Spectroscopy and Magnetic Properties of Spinel ZnMn2O4. Phys. B Condens. Matter. 2019, 572, 199–202. [Google Scholar] [CrossRef]
- Vijaya Lakshmi, S.; Pauline, S. Structural, Morphological and Optical Properties of Hetarolite—ZnMn2O4 Nano Particle by Hydrothermal Method. Int. J. Sci. Res. (IJSR) 2014, 3, 2319–7064. [Google Scholar]
- Kommu, P.; Singh, G.P.; Chakra, C.S.; Jana, S.; Kumar, V.; Bhattacharyya, A.S. Preparation of ZnMn2O4 and ZnMn2O4/Graphene Nano Composites by Combustion Synthesis for Their Electrochemical Properties. Mater. Sci. Eng. B 2020, 261, 114647. [Google Scholar] [CrossRef]
- Shamitha, C.; Senthil, T.; Wu, L.; Kumar, B.S.; Anandhan, S. Sol–Gel Electrospun Mesoporous ZnMn2O4 Nanofibers with Superior Specific Surface Area. J. Mater. Sci. Mater. Electron. 2017, 28, 15846–15860. [Google Scholar] [CrossRef]
- Saranya, P.E.; Selladurai, S. Efficient Electrochemical Performance of ZnMn2O4 Nanoparticles with RGO Nanosheets for Electrodes in Supercapacitor Applications. J. Mater. Sci. Mater. Electron. 2018, 29, 3326–3339. [Google Scholar] [CrossRef]
- Bhagwan, J.; Kumar, N.; Yadav, K.L.; Sharma, Y. Probing the Electrical Properties and Energy Storage Performance of Electrospun ZnMn2O4 Nanofibers. Solid State Ion. 2018, 321, 75–82. [Google Scholar] [CrossRef]
- Alexander, V.N.; Anna, K.-V.; Stephen, W.G.; Cedric, J.P. NIST X-ray Photoelectron Spectroscopy Database. NIST Standard Reference Database 20, Version 4.1. 2012. Available online: https://srdata.nist.gov/xps/ (accessed on 19 October 2022).
- X-ray Photoelectron Spectroscopy (XPS) Reference Pages. Available online: http://www.xpsfitting.com/search/label/Zinc (accessed on 19 October 2022).
- Biesinger, M.C.; Payne, B.P.; Grosvenor, A.P.; Lau, L.W.M.; Gerson, A.R.; Smart, R.S.C. Resolving Surface Chemical States in XPS Analysis of First Row Transition Metals, Oxides and Hydroxides: Cr, Mn, Fe, Co and Ni. Appl. Surf. Sci. 2011, 257, 2717–2730. [Google Scholar] [CrossRef]
- Chen, J.; Zuo, H.; Wang, C.; Zhang, Y.-C.; Gao, W.; Zhao, N.; Huang, Y.; Xiao, S. Synthesis and Electrochemical Properties of ZnMn2O4 with Hollow Porous Panpipe-like Structure as Anode Material for Li-Ion Battery. Electrochim. Acta 2022, 426, 140780. [Google Scholar] [CrossRef]
- Chen, C.; Huang, Y.; Fang, Q.; Wang, S. Preparation of C, Sn Modified ZnMn2O4 Porous Microsphere and Its Electrochemical Performance. J. Alloys Compd. 2021, 889, 161654. [Google Scholar] [CrossRef]
- Mahdi, F.; Javanbakht, M.; Shahrokhian, S. Anodic Pulse Electrodeposition of Mesoporous Manganese Dioxide Nanostructures for High Performance Supercapacitors. J. Alloys Compd. 2021, 887, 161376. [Google Scholar] [CrossRef]
- Zhu, X.; Wei, Z.; Ma, L.; Liang, J.; Zhang, X. Synthesis and Electrochemical Properties of Co-Doped ZnMn2O4 Hollow Nanospheres. Bull. Mater. Sci. 2020, 43, 4. [Google Scholar] [CrossRef]
- Zhang, Y.; Li, G.; Lv, Y.; Wang, L.; Zhang, A.; Song, Y.; Huang, B. Electrochemical Investigation of MnO2 Electrode Material for Supercapacitors. Int. J. Hydrog. Energy 2011, 36, 11760–11766. [Google Scholar] [CrossRef]
- Fang, Q.; Chen, C.; Yang, Z.; Chen, X.; Chen, X.; Liu, T. Synthetization and Electrochemical Performance of Pomegranate-like ZnMn2O4 Porous Microspheres. J. Alloys Compd. 2020, 826, 154084. [Google Scholar] [CrossRef]
- Gholami laelabadi, K.; Moradian, R.; Manouchehri, I. Facile Method of Fabricating Interdigitated and Sandwich Electrodes for High-Performance and Flexible Reduced Graphene Oxide@Polyaniline Nanocomposite Supercapacitors. ACS Appl. Energy Mater. 2021, 4, 6697–6710. [Google Scholar] [CrossRef]
- Huang, C.; Wang, Q.; Zhang, D.; Shen, G. Coupling N-Doping and Rich Oxygen Vacancies in Mesoporous ZnMn2O4 Nanocages toward Advanced Aqueous Zinc Ion Batteries. Nano Res. 2022, 15, 8118–8127. [Google Scholar] [CrossRef]
- Aruchamy, K.; Nagaraj, R.; Manohara, H.M.; Nidhi, M.R.; Mondal, D.; Ghosh, D.; Nataraj, S.K. One-Step Green Route Synthesis of Spinel ZnMn2O4 Nanoparticles Decorated on MWCNTs as a Novel Electrode Material for Supercapacitor. Mater. Sci. Eng. B 2020, 252, 114481. [Google Scholar] [CrossRef]
- Park, C.; Samuel, E.; Kim, B.-Y.; An, S.; Lee, H.-S.; Yoon, S.S. Supersonically Sprayed Self-Aligned RGO Nanosheets and ZnO/ZnMn2O4 Nanowires for High-Energy and High-Power-Density Supercapacitors. J. Mater. Sci. Technol. 2023, 137, 193–204. [Google Scholar] [CrossRef]
- Abdollahifar, M.; Huang, S.-S.; Lin, Y.-H.; Lin, Y.-C.; Shih, B.-Y.; Sheu, H.-S.; Liao, Y.-F.; Wu, N.-L. High-Performance Carbon-Coated ZnMn2O4 Nanocrystallite Supercapacitors with Tailored Microstructures Enabled by a Novel Solution Combustion Method. J. Power Sources 2018, 378, 90–97. [Google Scholar] [CrossRef]
- Hasan, M.; Zawar, S.; Mustafa, G.M.; Ghaffar, A.; Razaq, A.; Atiq, S. Porous Architecture of Ni Substituted ZnMn2O4 Nanospheres as an Electrode Material for Supercapacitor Applications. Phys. B Condens. Matter. 2022, 633, 413767. [Google Scholar] [CrossRef]
- Wang, Y.L.; Wei, X.Q.; Guo, N.; Deng, X.L.; Xu, X.J. Synthesis and Characterization of Cd-Doped ZnMn2O4 Microspheres as Supercapacitor Electrodes. J. Mater. Sci. Mater. Electron. 2017, 28, 1223–1228. [Google Scholar] [CrossRef]
- Sharifi, S.; Yazdani, A.; Rahimi, K. Incremental Substitution of Ni with Mn in NiFe2O4 to Largely Enhance Its Supercapacitance Properties. Sci. Rep. 2020, 10, 10916. [Google Scholar] [CrossRef]
- Wang, X.; Tanaike, O.; Kodama, M.; Hatori, H. High Rate Capability of the Mg-Doped Li–Mn–O Spinel Prepared via Coprecipitated Precursor. J. Power Sources 2007, 168, 282–287. [Google Scholar] [CrossRef]
- Zhu, X.; Wei, Z.; Zhao, W.; Zhang, X.; Zhang, L.; Wang, X. Microstructure and Electrochemical Properties of ZnMn2O4 Nanopowder Synthesized Using Different Surfactants. J. Electron. Mater. 2018, 47, 6428–6436. [Google Scholar] [CrossRef]
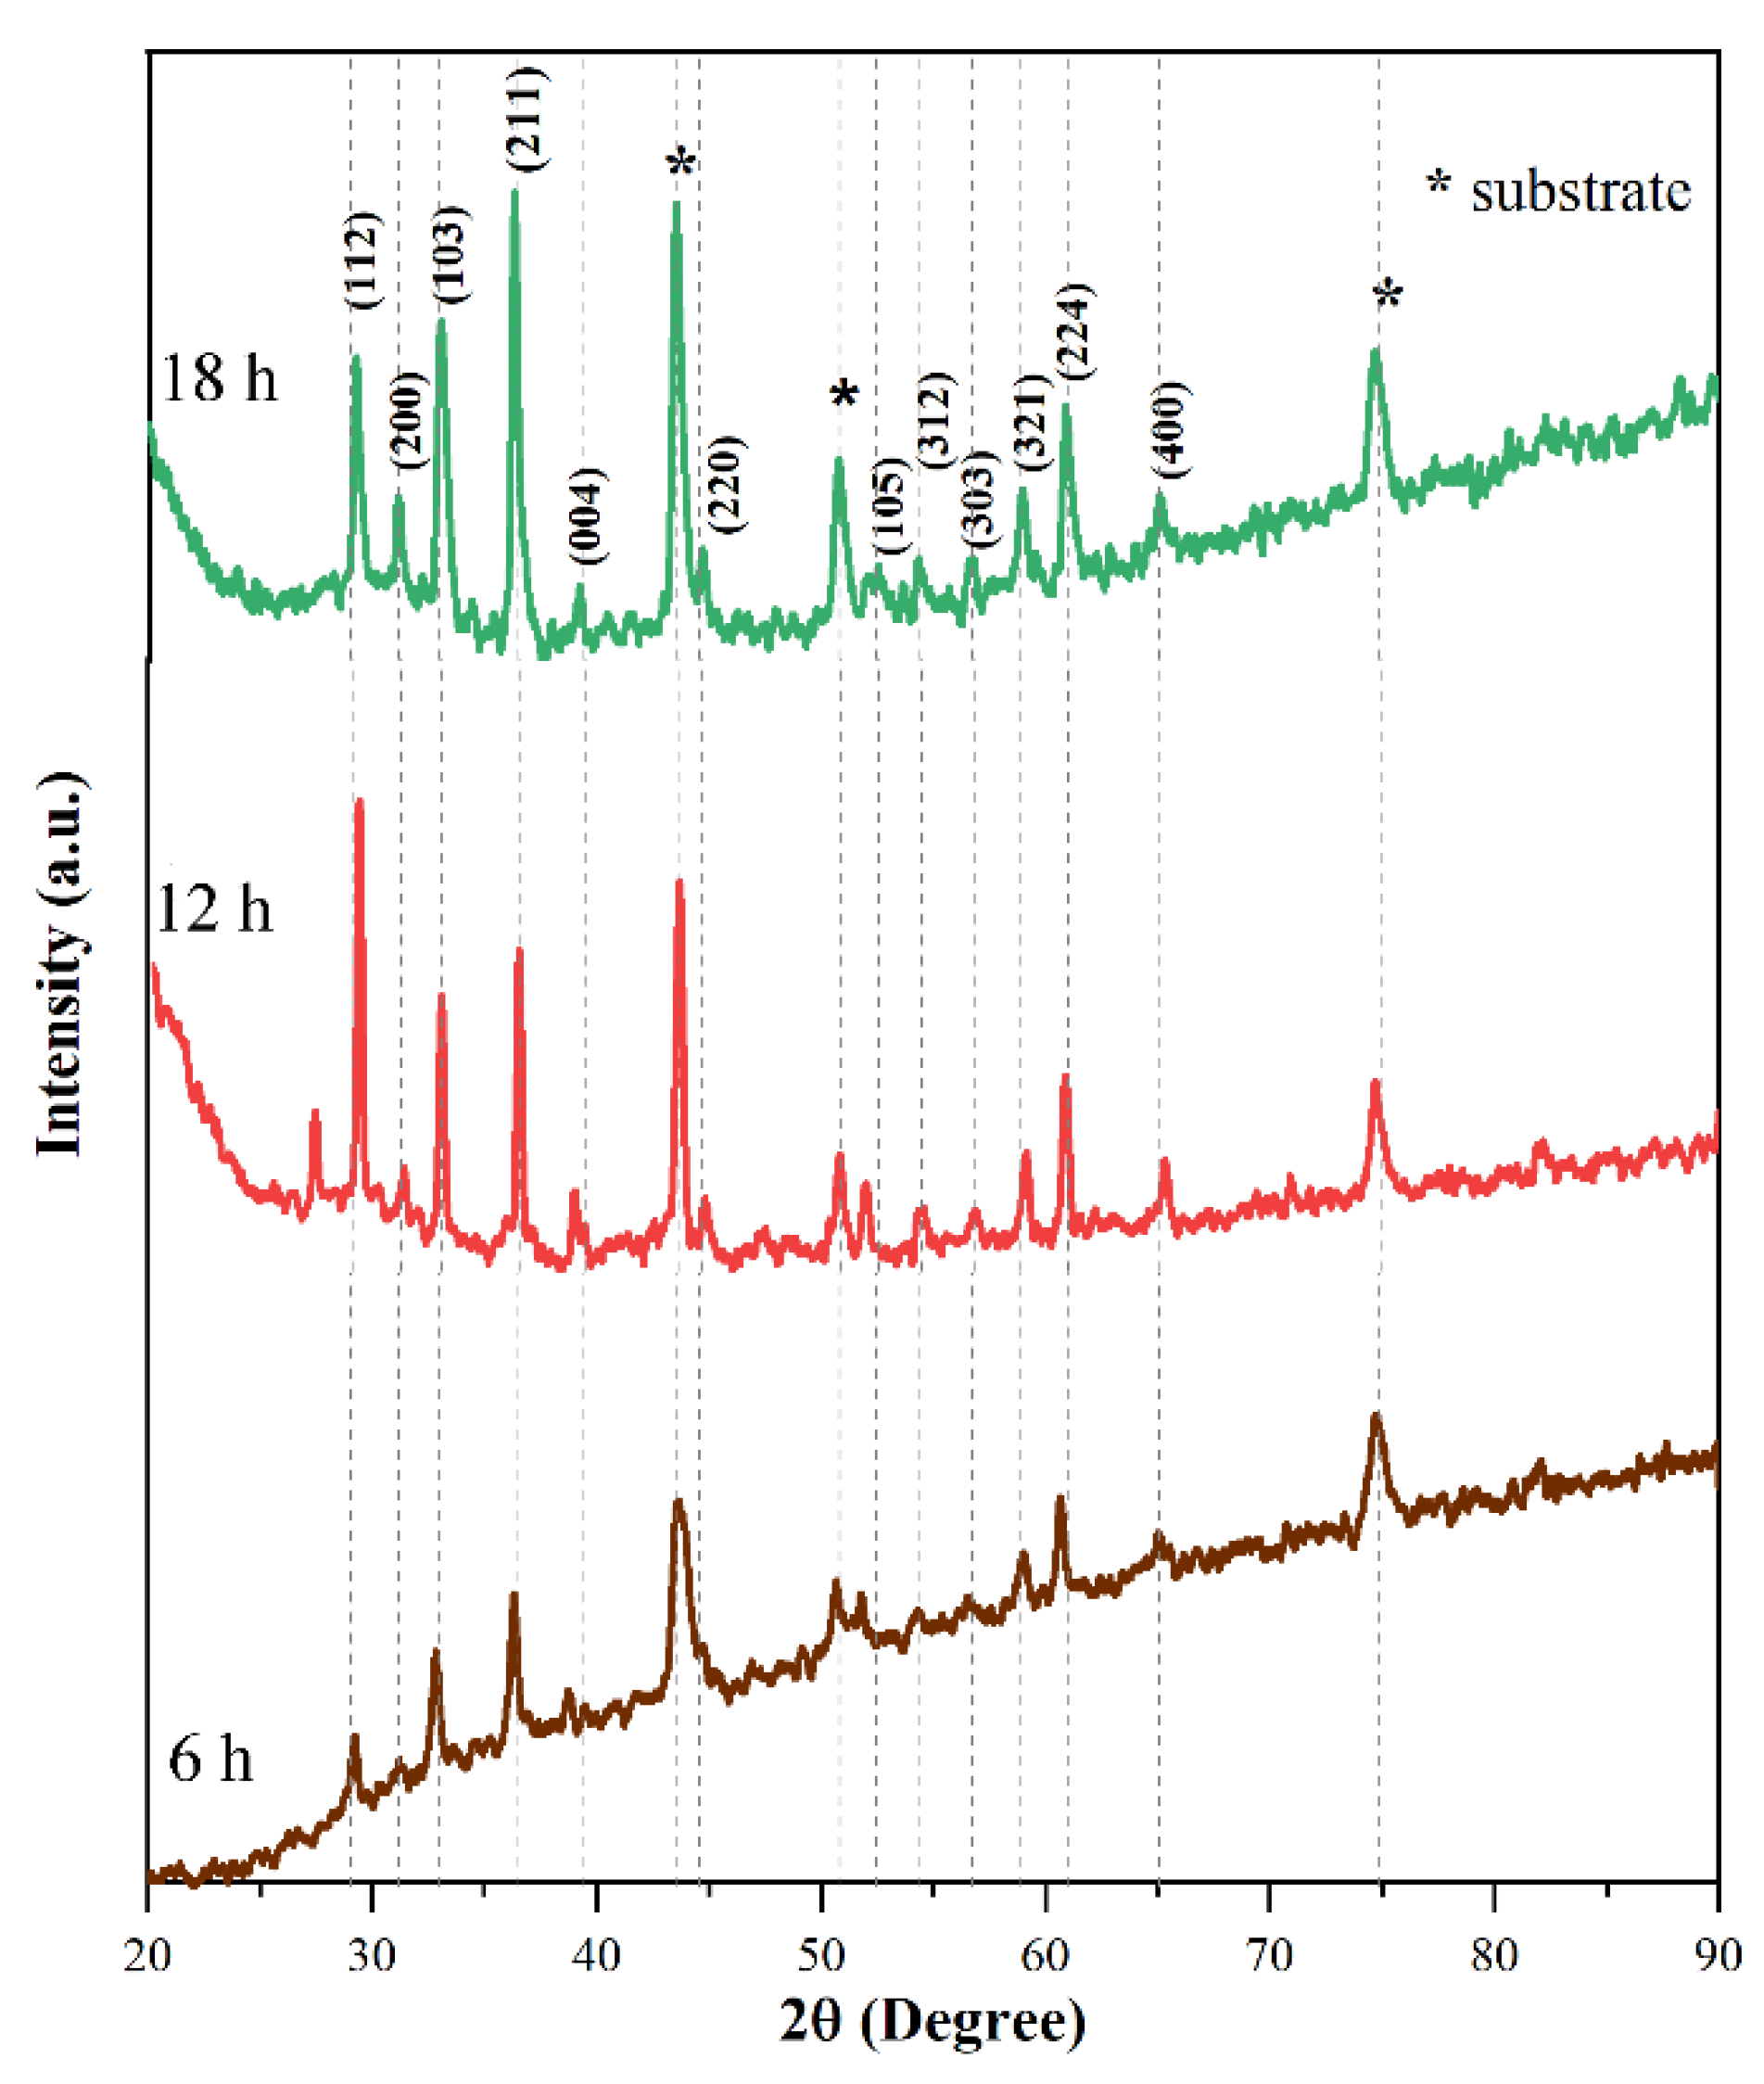


| Time (h) | 6 | 12 | 18 |
|---|---|---|---|
| 2θ (radians) | 29.22 | 29.33 | 29.29 |
| 32.85 | 33.12 | 32.96 | |
| 36.33 | 36.37 | 36.43 | |
| β (radians) | 0.42 | 0.45 | 0.28 |
| 0.47 | 0.46 | 0.26 | |
| 0.79 | 0.32 | 0.24 | |
| D (nm) | 19.30 | 18.38 | 29.56 |
| 17.69 | 17.84 | 31.89 | |
| 10.64 | 25.94 | 35.29 | |
| Average crystallite size (nm) | 15.87 | 20.72 | 32.25 |
| Microstrain | −0.054 | −0.022 | −0.017 |
| Dislocation × 1015 (m−2) | 3.969 | 2.329 | 0.962 |
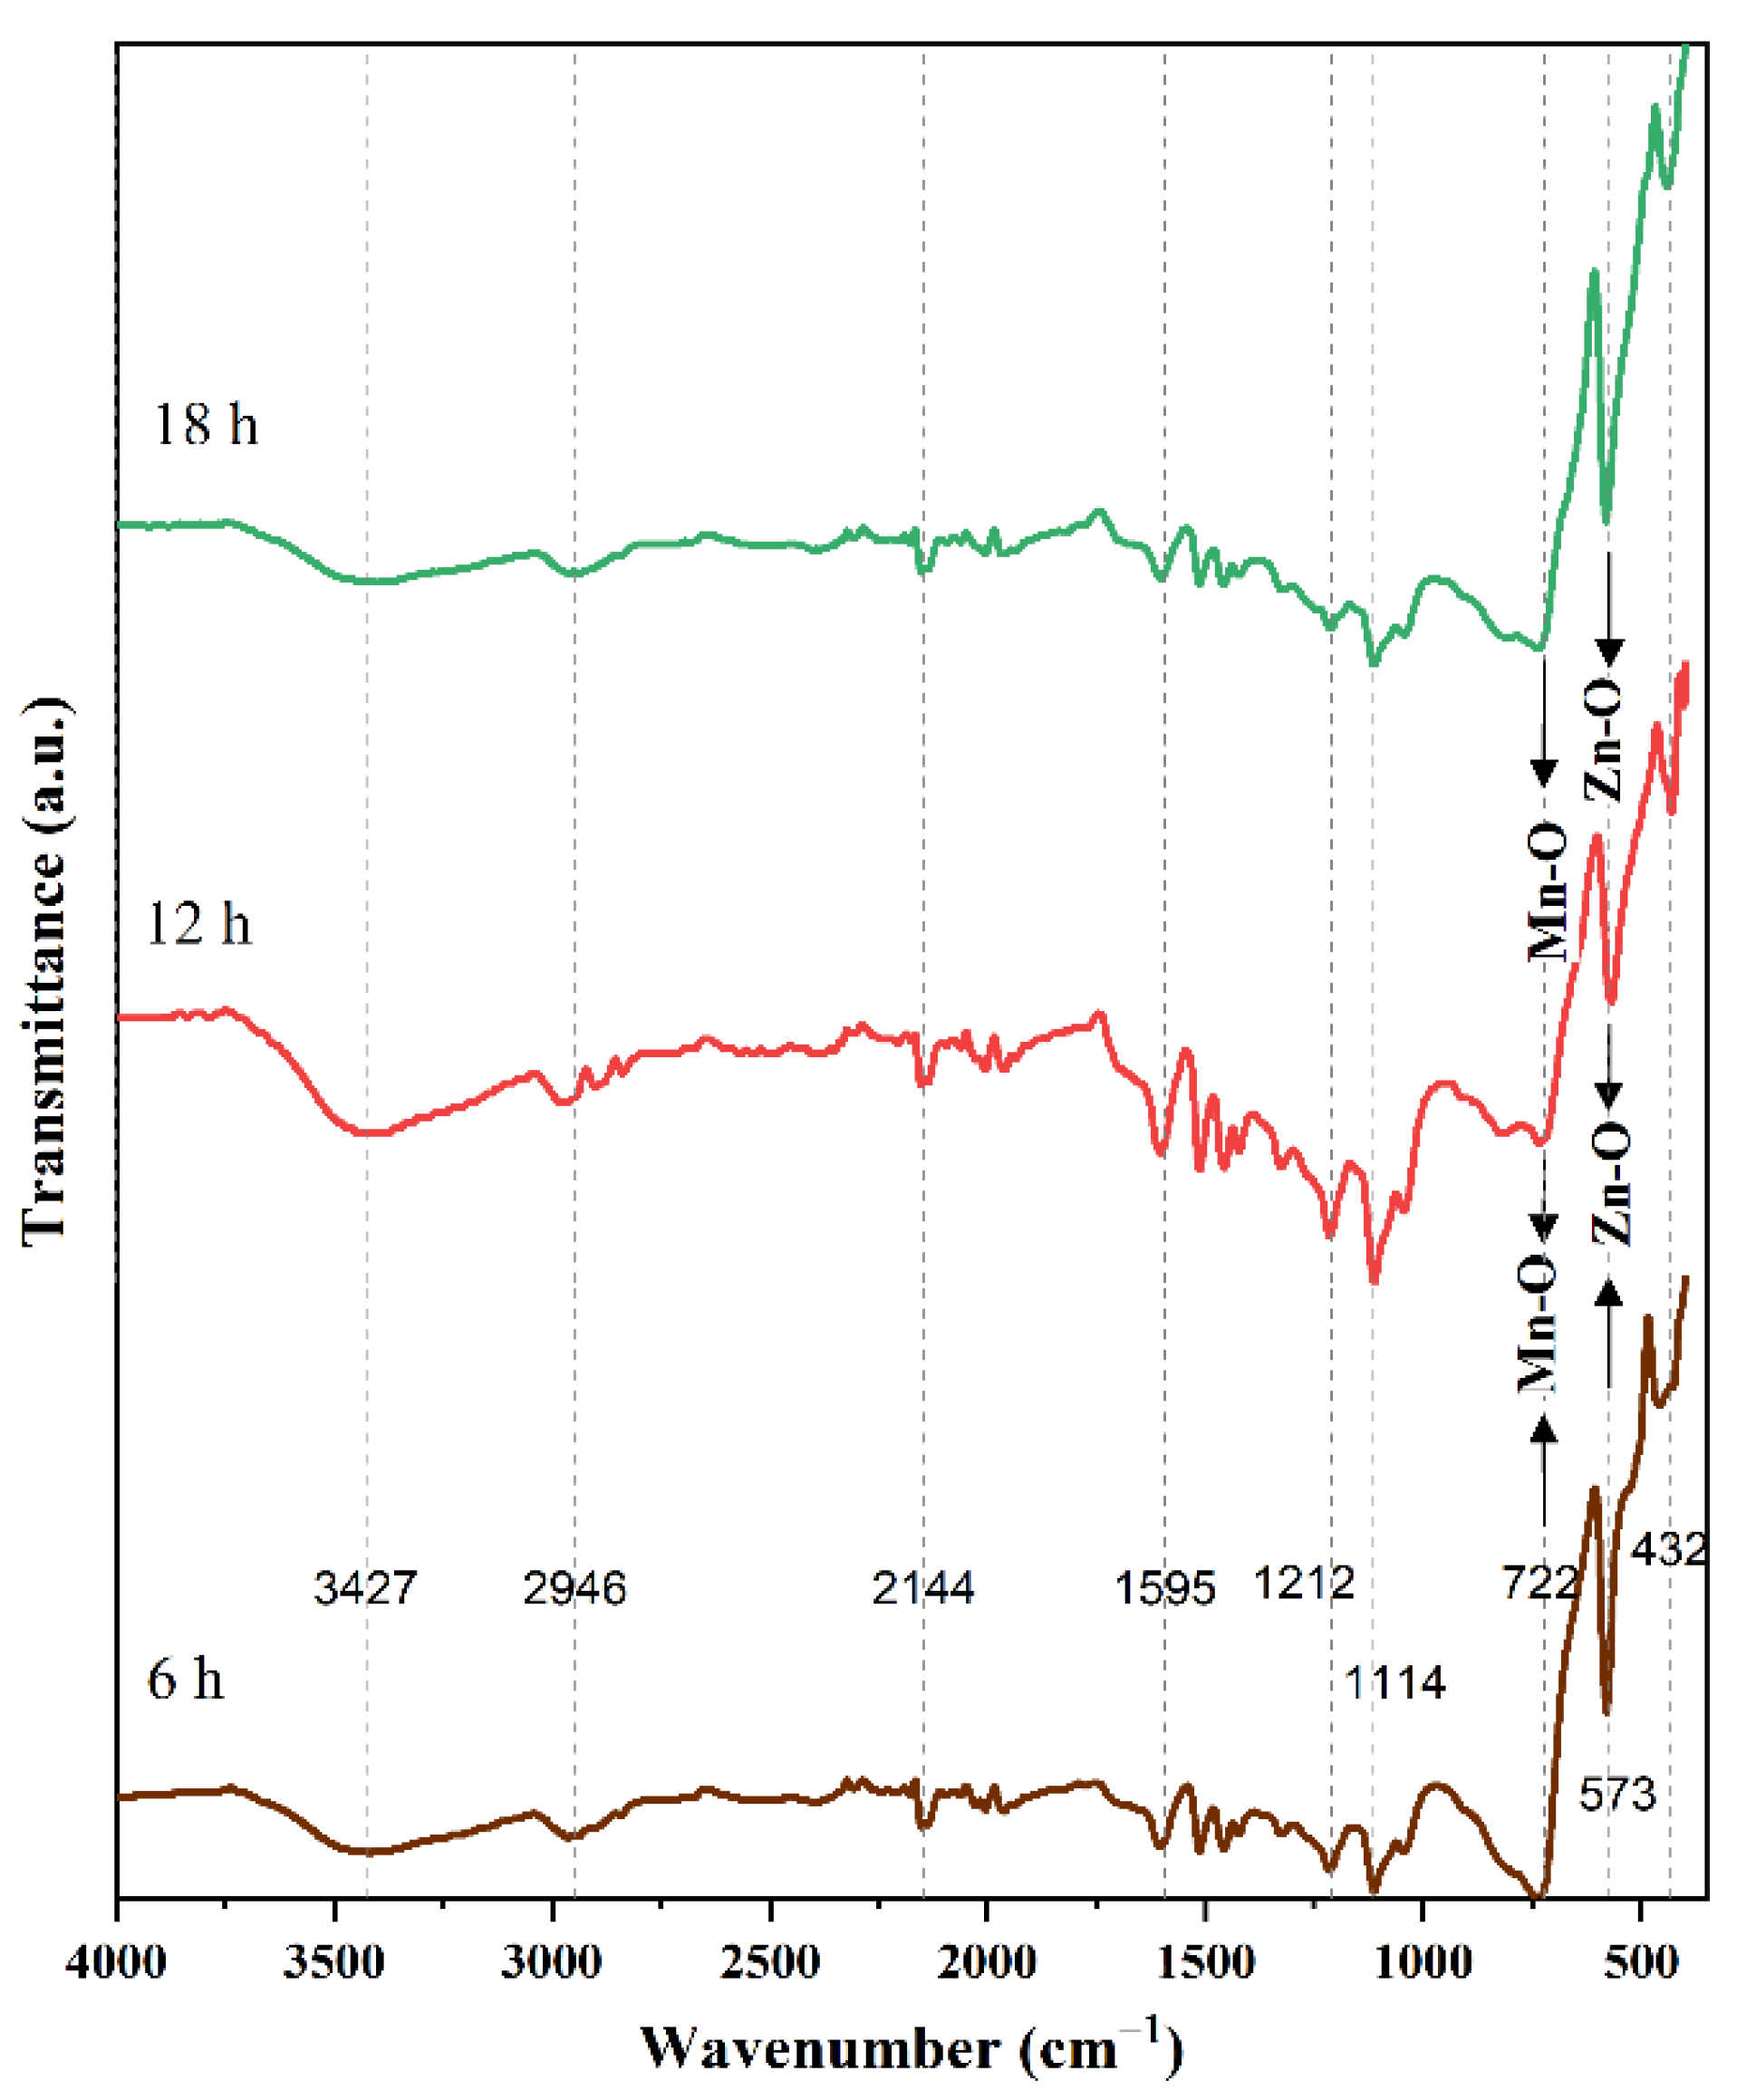
| Wavenumber (cm−1) | Functional Groups | Source |
|---|---|---|
| 1113.66 | Mn–O–OH ethanol molecules on the surface | [30] |
| 1212.22 | C-O stretching | [31] |
| 1595.01 | C=O stretching | [32] |
| 2144.12 | CO2 from atmosphere | [33] |
| 2945.78 | Aliphatic C-H stretching | [34] |
| 3427.13 | Associated O-H stretching | [31] |
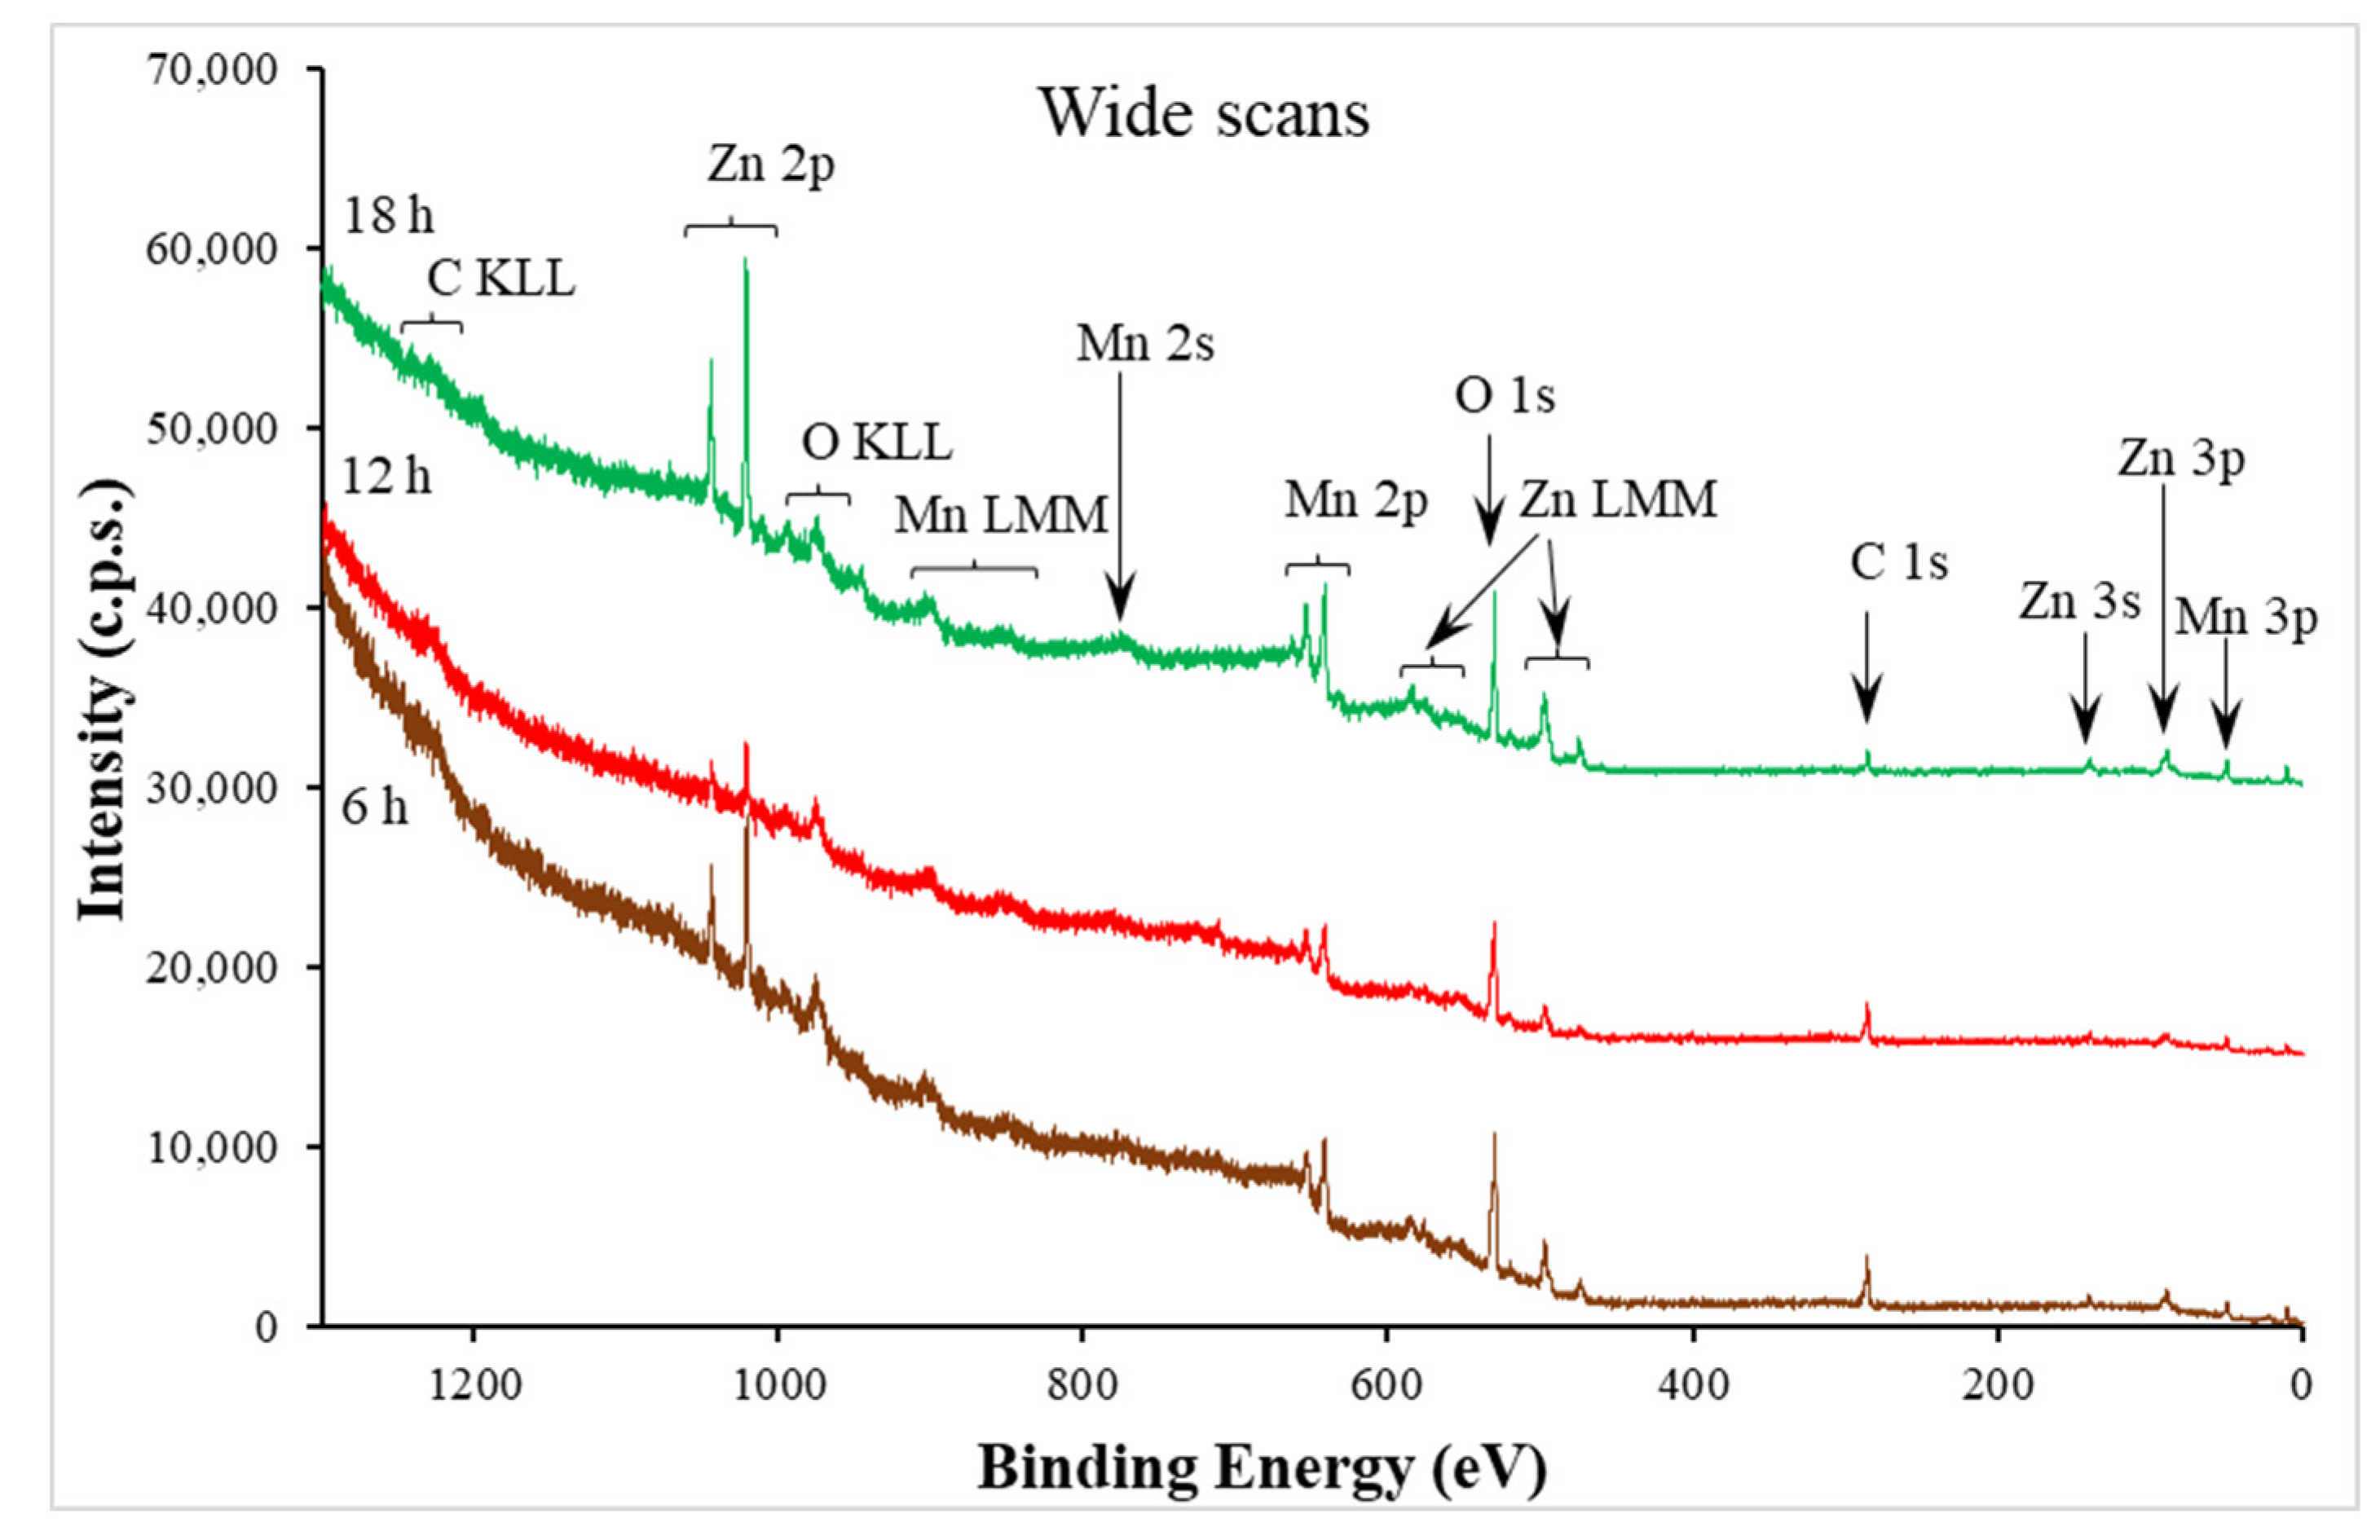
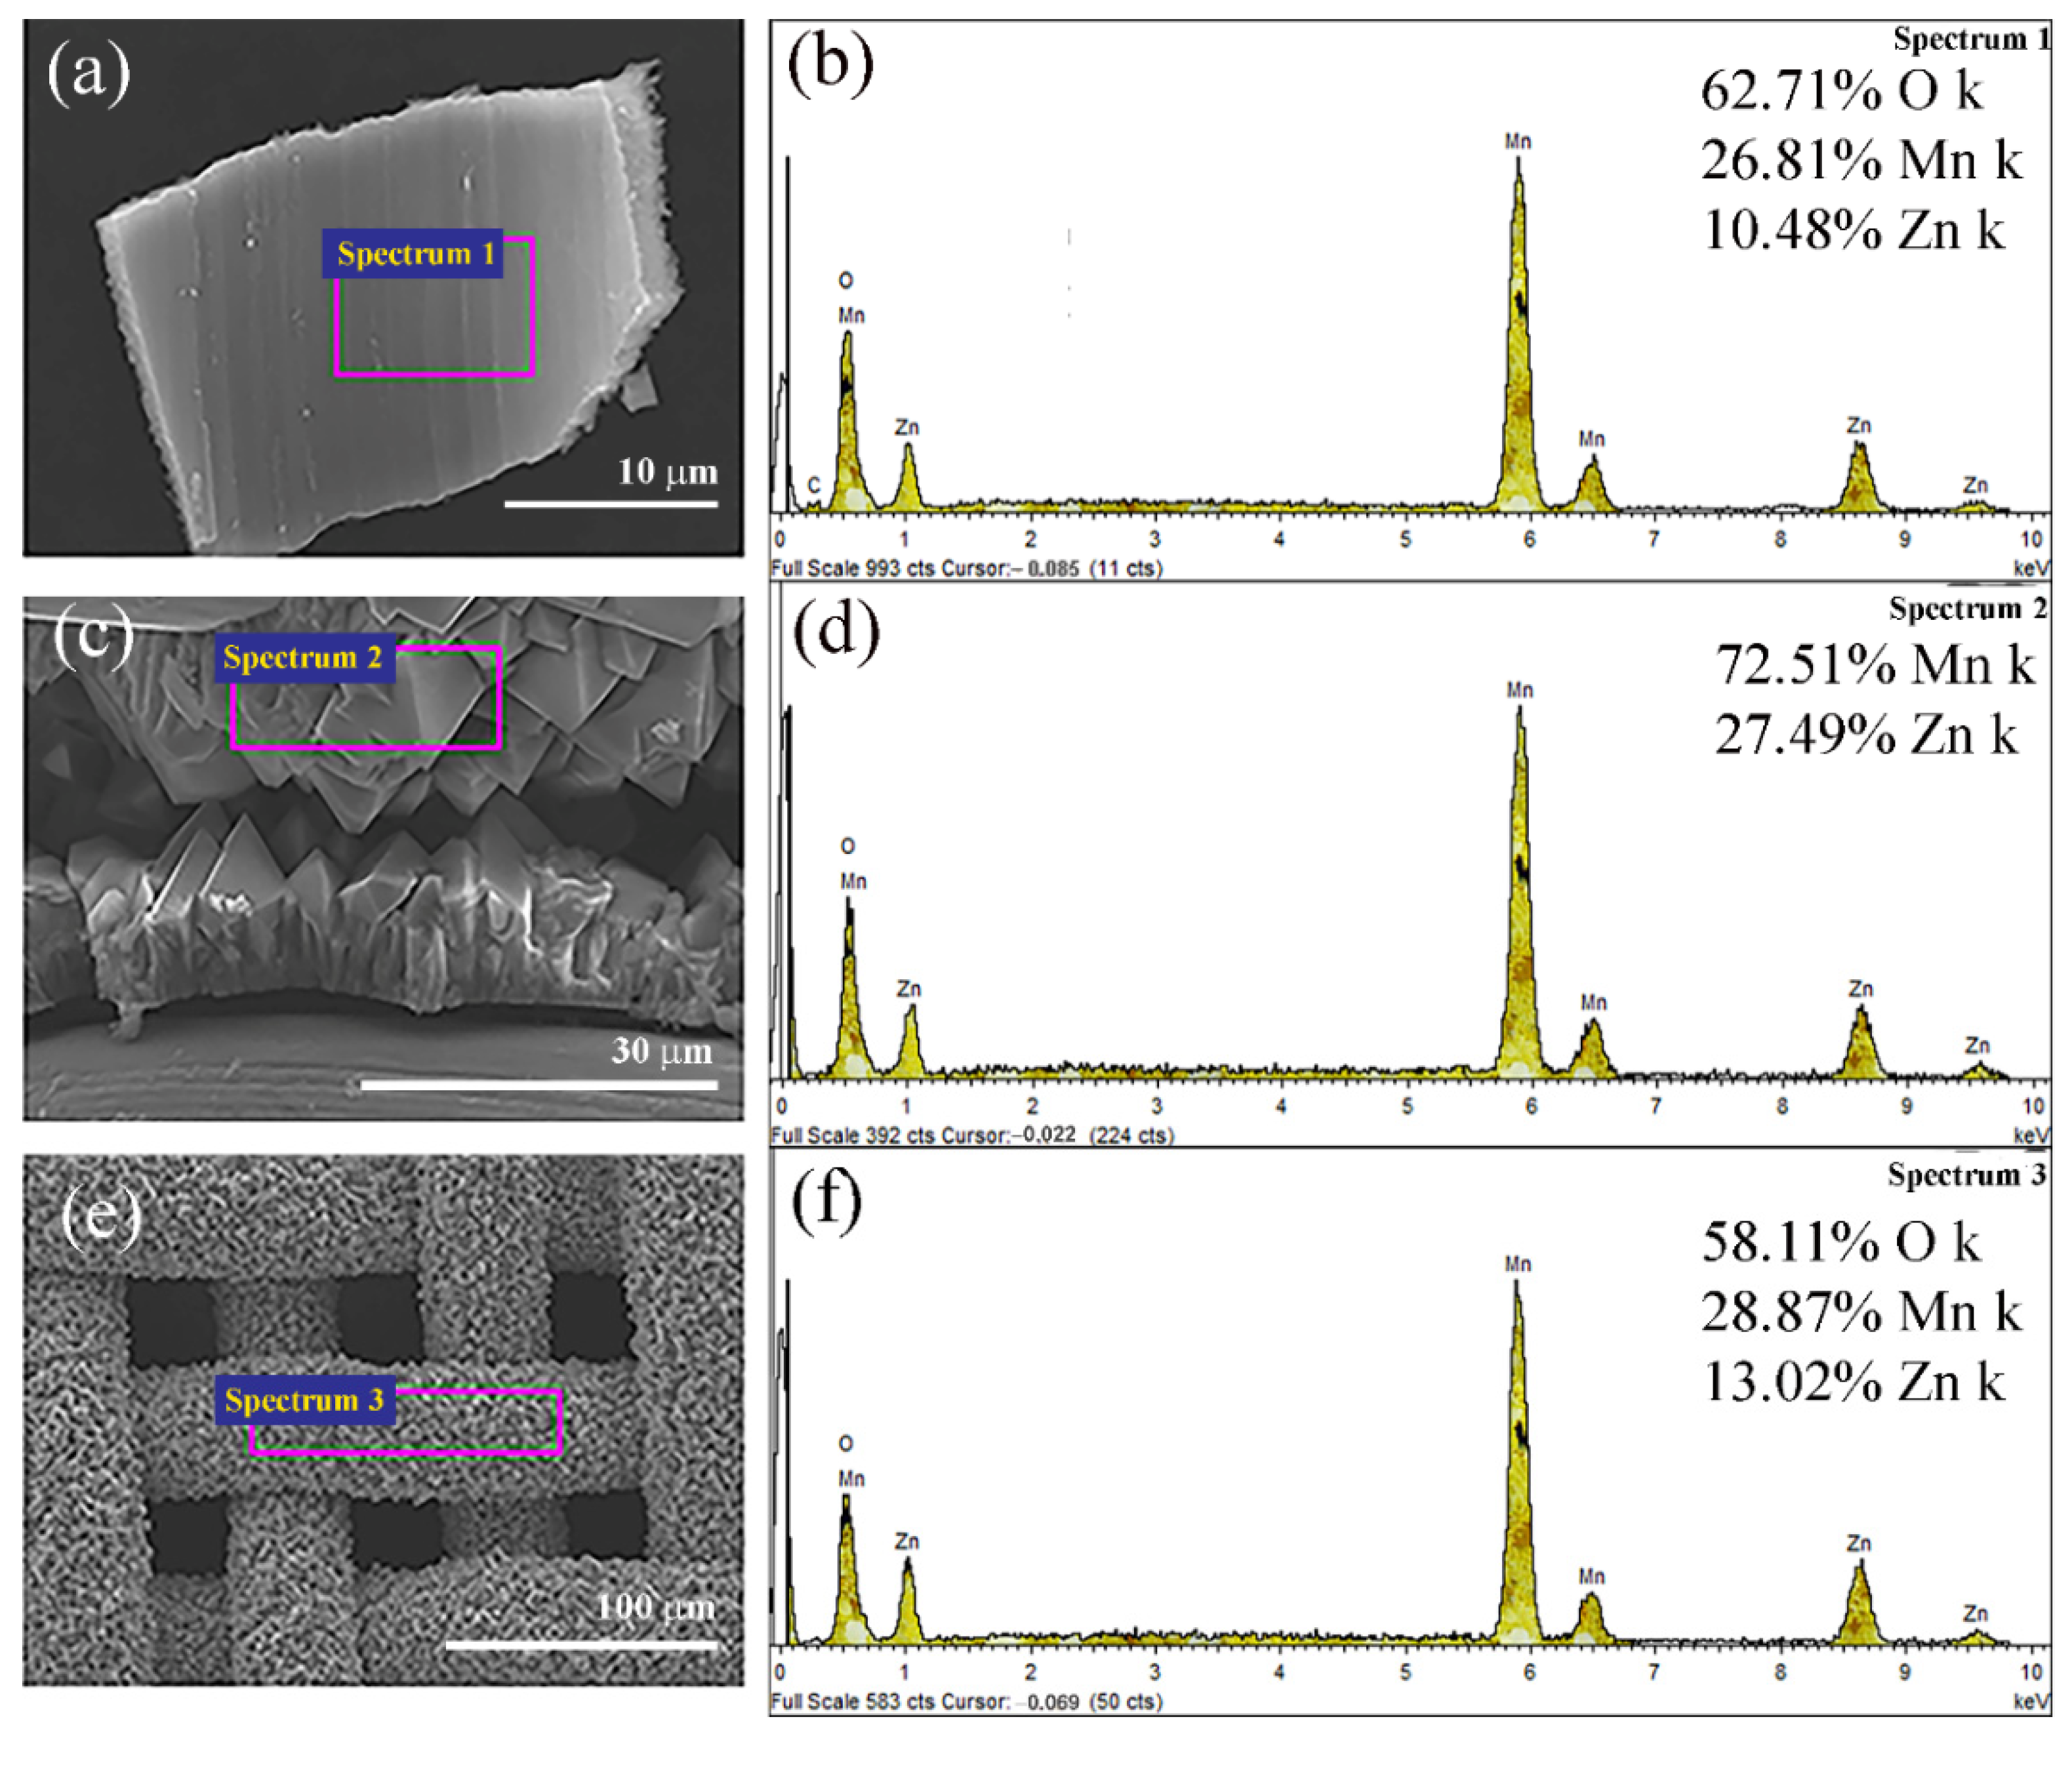
| at.% | 6 h | 12 h | 18 h |
|---|---|---|---|
| C | 36.5 | 40.4 | 18.6 |
| O | 43.7 | 45.4 | 46.1 |
| Zn | 8.1 | 3.6 | 17.2 |
| Mn | 11.6 | 10.5 | 18.1 |
| atomic ratios | |||
| Mn/Zn | 1.4 | 2.9 | 1.1 |
| O/Zn | 5.4 | 12.5 | 2.7 |
| Atomic Ratios | 6 h | 12 h | 18 h | Predicted Ratios |
|---|---|---|---|---|
| Mn/Zn | 1.6 | 1.5 | 1.8 | 2 |
| O/Zn | 2.7 | - | 3.5 | 4 |
| Specific Capacitance (mF g−1) | |||
|---|---|---|---|
| Specific Current (mA g−1) | 6 h | 12 h | 18 h |
| 7 | 147 | 186 | 157 |
| 5 | 195 | 238 | 253 |
| 3 | 197 | 278 | 358 |
| 2 | 416 | 443 | 742 |
| 1.5 | 407 | 398 | 754 |
Publisher’s Note: MDPI stays neutral with regard to jurisdictional claims in published maps and institutional affiliations. |
© 2022 by the authors. Licensee MDPI, Basel, Switzerland. This article is an open access article distributed under the terms and conditions of the Creative Commons Attribution (CC BY) license (https://creativecommons.org/licenses/by/4.0/).
Share and Cite
Aouini, S.; Bardaoui, A.; Ferraria, A.M.; Santos, D.M.F.; Chtourou, R. ZnMn2O4 Nanopyramids Fabrication by Hydrothermal Route: Effect of Reaction Time on the Structural, Morphological, and Electrochemical Properties. Energies 2022, 15, 9352. https://doi.org/10.3390/en15249352
Aouini S, Bardaoui A, Ferraria AM, Santos DMF, Chtourou R. ZnMn2O4 Nanopyramids Fabrication by Hydrothermal Route: Effect of Reaction Time on the Structural, Morphological, and Electrochemical Properties. Energies. 2022; 15(24):9352. https://doi.org/10.3390/en15249352
Chicago/Turabian StyleAouini, Souha, Afrah Bardaoui, Ana M. Ferraria, Diogo M. F. Santos, and Radhouane Chtourou. 2022. "ZnMn2O4 Nanopyramids Fabrication by Hydrothermal Route: Effect of Reaction Time on the Structural, Morphological, and Electrochemical Properties" Energies 15, no. 24: 9352. https://doi.org/10.3390/en15249352
APA StyleAouini, S., Bardaoui, A., Ferraria, A. M., Santos, D. M. F., & Chtourou, R. (2022). ZnMn2O4 Nanopyramids Fabrication by Hydrothermal Route: Effect of Reaction Time on the Structural, Morphological, and Electrochemical Properties. Energies, 15(24), 9352. https://doi.org/10.3390/en15249352