Review

Direct Contact Condensers: A Comprehensive Review of Experimental and Numerical Investigations on Direct-Contact Condensation

Department of Power Systems and Environmental Protection Facilities, Faculty of Mechanical Engineering and Robotics, AGH University of Science and Technology, Al. Mickiewicza 30, 30-059 Krakow, Poland
*
Author to whom correspondence should be addressed.
Energies 2022, 15(24), 9312; https://doi.org/10.3390/en15249312
Submission received: 10 October 2022 / Revised: 29 November 2022 / Accepted: 4 December 2022 / Published: 8 December 2022

Abstract

:
Direct contact heat exchangers can be smaller, cheaper, and have simpler construction than the surface, shell, or tube heat exchangers of the same capacity and can operate in evaporation or condensation modes. For these reasons, they have many practical applications, such as water desalination, heat exchangers in power plants, or chemical engineering devices. This paper presents a comprehensive review of experimental and numerical activities focused on the research about direct condensation processes and testing direct contact condensers on the laboratory scale. Computational Fluid Dynamics (CFD) methods and CFD solvers are the most popular tools in the numerical analysis of direct contact condensers because of the phenomenon’s complexity as multiphase turbulent flow with heat transfer and phase change. The presented and developed numerical models must be carefully calibrated and physically validated by experimental results. Results of the experimental campaign in the laboratory scale with the test rig and properly designed measuring apparatus can give detailed qualitative and quantitative results about direct contact condensation processes. In this case, the combination of these two approaches, numerical and experimental investigation, is the comprehensive method to deeply understand the direct contact condensation process.

1. Introduction

Direct Contact Condensers (DCCs) have been used in industry since the beginning of the 20th century [1], covering a wide range of various applications in chemical engineering, water desalination, air conditioning, and energy conversion processes.
In this device, the cooling liquid is directly mixed with gas or vapour, which results in condensation and a significant decrease in device volume [2]. Involving a surface condenser of the same capacity direct condenser has several advantages. Due to direct contact with process fluids, its construction is simpler and more corrosion resistant [3], less expensive [4], easier to maintain, and simpler in operation [5].
Direct contact condensers are generally divided into spray-type, film-type, and bubbling type [6]. In the first solution, the sprayed liquid phase flows downwards and is in contact with flowing upwards gas. In the second case, both phases flow counter currently. In the latter solution, the bubbling gas phase passes through the liquid layer. Furthermore, spray condensers can exist with constant pressure or constant area jet ejectors [7]. Despite these apparatuses’ wide range of applications, plenty of studies summarize theoretical and practical aspects of their development. Aidoun et al. [8,9] presented results of experimental and numerical studies focusing on ejectors and their applications in refrigeration systems. Mil’man and Anan’ev [10] focused on the application of air-cooled condensing units in thermal power plants. Xu et al. [11] discussed recent advances in humidification-dehumidification desalination processes, including direct and indirect contact condensers. They are also commonly used as dehumidifiers in solar-driven humidification-dehumidification desalination [12,13] and seawater greenhouse [14] systems. The application of direct and indirect condensers in the pyrolysis of waste plastics was discussed by Kartik et al. [15], and in pyrolysis of biomass to bio-oil was presented in [16].
The wide range of possible and actual applications of these devices indicates the need to investigate more deeply the direct contact condensation process by using simulation and experimental studies devoted to developing direct contact condensers. This paper aims to present various analyses and their main outcomes to give the full view of the most important factors that must be considered during theoretical and experimental research.

2. Direct Contact Condensers

Direct Contact Heat Exchangers (DCHEs) play an important role in various technological processes, including humidifying air, cooling water, and removing excess heat from flue gases. The exchange processes in such apparatuses occur under contact with the liquid phase (e.g., water) and gas phase (e.g., air) at the interphase surface. In this case, heat and mass transfer are mainly determined by the geometric dimensions of the surface area for contact between the two phases. A specific value of this surface area (attributed, for instance, to the volume of the active zone of DCHE) depends on the method of interaction of the contacting phases, i.e., on the DCHE design. The most commonly used designs of heat exchangers are the following [6]:
-
spray-type (gas phase flows upwards and comes into contact with the liquid phase, which is sprayed from the nozzles and flows downwards),
-
film-type (liquid phase flows downwards as a thin liquid film on the inside wall of the vertical tube while the air flows counter currently) [17,18,19,20],
-
bubbling-type (bubbling of the gas phase through a layer of the liquid located on a hole tray [21,22,23] or in a vertical channel [24,25].
Direct Contact Condensers (DCCs) have a variety of purposes. They can be used to heat the liquid for heat recovery. The hot liquid can be used to heat rooms, preheat raw materials, or melt solids such as ice. DCCs can be used to cool the gas to generate condensate. Condensate can be used to purge a reaction product, such as acids coabsorbed in the DCC, condense a particulate by converting it from a vapor to a liquid or solid, and grow particulate by condensing directly on the particulate surface to improve its capture or reclaim water in arid regions. Direct Contact Condensers also can reduce gas volume, suppress stack plumes, and lower energy requirements.

2.1. Type of Direct Contact Condensers

In direct-contact condensers, the gas and liquid come in direct contact. The cooling liquid is sprayed into the gas region to start a rapid condensation, which maximizes the thermal efficiency of condensers. The heat is transferred from a gas to a liquid, and the condensate temperature is the same as that of the cooling liquid leaving the condenser. The condensate cannot be reused as feed water if the cooling water is not pure and free from harmful impurities. The occurrence of the other gases strongly impacts the heat transfer rate and condensation efficiency. This process is one of the important issues investigated experimentally or numerically to determine overall efficiency and properly design Direct Contact Condensers. The general classification of condensers is presented in Figure 1.
In a parallel flow jet type condenser, the exhaust steam and cooling water find their entry at the top of the condenser and then flow downwards, and condensate and water are finally collected at the bottom (Figure 2).
The steam and cooling water enter the condenser from opposite directions in a counter jet type condenser. Generally, the exhaust steam travels upward and meets the cooling water, which flows downwards. In this low-level jet-type condenser (counter jet type condenser), presented in Figure 3, the exhaust steam enters slightly lower than in a parallel flow jet-type condenser, and the cooling water is supplied from the top of the condenser chamber (Figure 3). The direction of the steam is upward, and the cooling water is downward. An air pump creates a vacuum and is placed on top of the condenser. The vacuum sucks the cooling water, and a hollow cone plate collects the falling water, which joins the second series of streams and meets the exhaust steam entering from below. The resulting condensate is delivered to the tank through a vertical pipe by the condensate pump. Another solution of counter jet type condensers is called barometric condenser and is presented in Figure 4. In this type, the shell is placed at the height of about 10.363 m above the hot well; thus, there is no need to provide an extraction pump. Provision of providing injection pump is observed, where water under pressure is unavailable.
In Figure 4, the discharge pipe is connected to the bottom of the condenser shell. The exhaust steam enters the system in the lower part of the condenser, with the flow direction pointing upwards. Cooling water enters at the top and is collected by a punched cone plate. An air pump creates the vacuum on top of the shell. Steam and cooling water mix together and are carried through a discharge pipe to the tank. The difference between low and high-level jet condensers is that there is no pump between the tank and the discharge pipe in the high-level type.
The last type of jet condenser is an ejector flow jet type condenser (Figure 5). Here the exhaust steam and cooling water mix in hollow truncated cones. Due to this decreased pressure, exhaust steam and associated air are drawn through the truncated cones, finally leading to the diverging cone. In the diverging cone, a portion of kinetic energy is converted into pressure energy which is more than the atmospheric, so that condensate consisting of condensed steam, cooling water, and the air is discharged into the hot well. The exhaust steam inlet is provided with a non-return valve which does not allow the water from the hot well to rush back to the engine in case of cooling water supply to the condenser.
The cooling cycle makes use of a steam ejector condenser. The steam ejector condenser is classified into two types based on the mixing method in the primary nozzle exit [7,26]. The first one is the constant pressure jet ejector (CPJE), and the other one is the constant area jet ejector (CAJE). The CPJE performs better than the CAJE due to better turbulent mixing [7,27]. In addition to having no moving parts, the steam ejector condenser benefits from lower maintenance and capital cost than the compressor.

2.2. Water and CO2 Separation

After the exhaust passes through the Direct Contact Condenser (DCC) for condensation, the condensate water from the DCC consists of a proportion of non-condensable gases such as CO2, air, or other gases. The stream is passed through the separator or non-condensable gas removal system, which separates the water and the non-condensable gases. By this method, the separated CO2 can be sent to the CCU unit for further utilization, or the separated air gases can be removed from the system. Gas separation from the DCC outlet stream can be carried out in various methods. The axial flow cyclone separator is the most commonly used gas-liquid separation method widely used in industries. Kou et al. [28] simulated and experimentally proved gas-liquid separation using an axial flow cyclone separator. The experiment is conducted by passing the gas-liquid mixture stream into the cylindrical axial flow separator. A guide vane at the bottom of the cyclone separator produces centrifugal force in the fluid passing through it. Once the fluid passes into the separator, the centrifugal force created in the fluid separates the gas and liquid due to the density difference. While the liquid is collected at the bottom, the gas escapes through the top of the separator [28,29]. Ji et al. [29] experimentally proved that the efficiency of the cyclone separator could be improved by combining components to the cyclone separator. The combined cyclone separator includes components such as a steady flow element, leaf grind element, and folding plate element, which increases the efficiency of gas-liquid separation by more than 95%. Chemical looping is one of the methods of splitting the H2O and CO2 in the exhaust gas. The exhaust, which consists of H2O and CO2 undergoes a chemical reaction with the metal oxide used in chemical looping and produces different components. Farooqui et al. [30] state the process of chemical looping with cerium oxide (CeO2). The H2O and CO2 are pressurized, and the temperature is raised up to 500 °C by compression. By integrating chemical looping, oxidation occurs with CeO2, which splits H2O into Hydrogen and CO2 into carbon monoxide. The separated components from the exhaust of the chemical looping is further used for dimethyl ether (DME) production. This is considered one of the methods for CCU technology using chemical looping. Wotzka et al. [31] presented the possibility of separating CO2 and water with the application of a microporous membrane. The separation of carbon dioxide and water using an MFI zeolite membrane treated with amine is analyzed experimentally and with molecular simulation. For experimental purposes, the liquid water is heated up to 120 °C, mixed with CO2 in an evaporator, and further sent to separation. The performance of membrane separation is analyzed under different factors.

3. Experimental Facilities for Direct Contact Condensers Investigation

3.1. Description of Experiments

When considering direct contact condensers, researchers were directed to several topics. The first one covers various physical aspects of the direct contact condensation phenomenon in different construction variants, as in downcommerless trays for the steam–water system, direct contact condensation in a moving steam-water interface, in the case of the steam jet in subcooled water flow in a rectangular mix chamber or in a vertical square cross-section pipe. Additionally, visualization studies involving high-speed cameras were presented. There can also be distinguished direct contact condensation in the presence of non-condensable gas.
Other studies were devoted to analyzing heat transfer coefficient or volumetric heat transfer in direct contact condensers. Then, various construction aspects and their impact on condenser performance were analyzed. Finally, a few cases of DCC performance in the presence of non-condensable gases were given. Their short description, with emphasis on applied fluids (liquids and gases), is shown in Table 1.
In the following paragraphs, experimental studies on direct contact heat exchangers are presented. They are grouped according to the previous section into the parallel flow, counter flow, and ejector flow condensers.

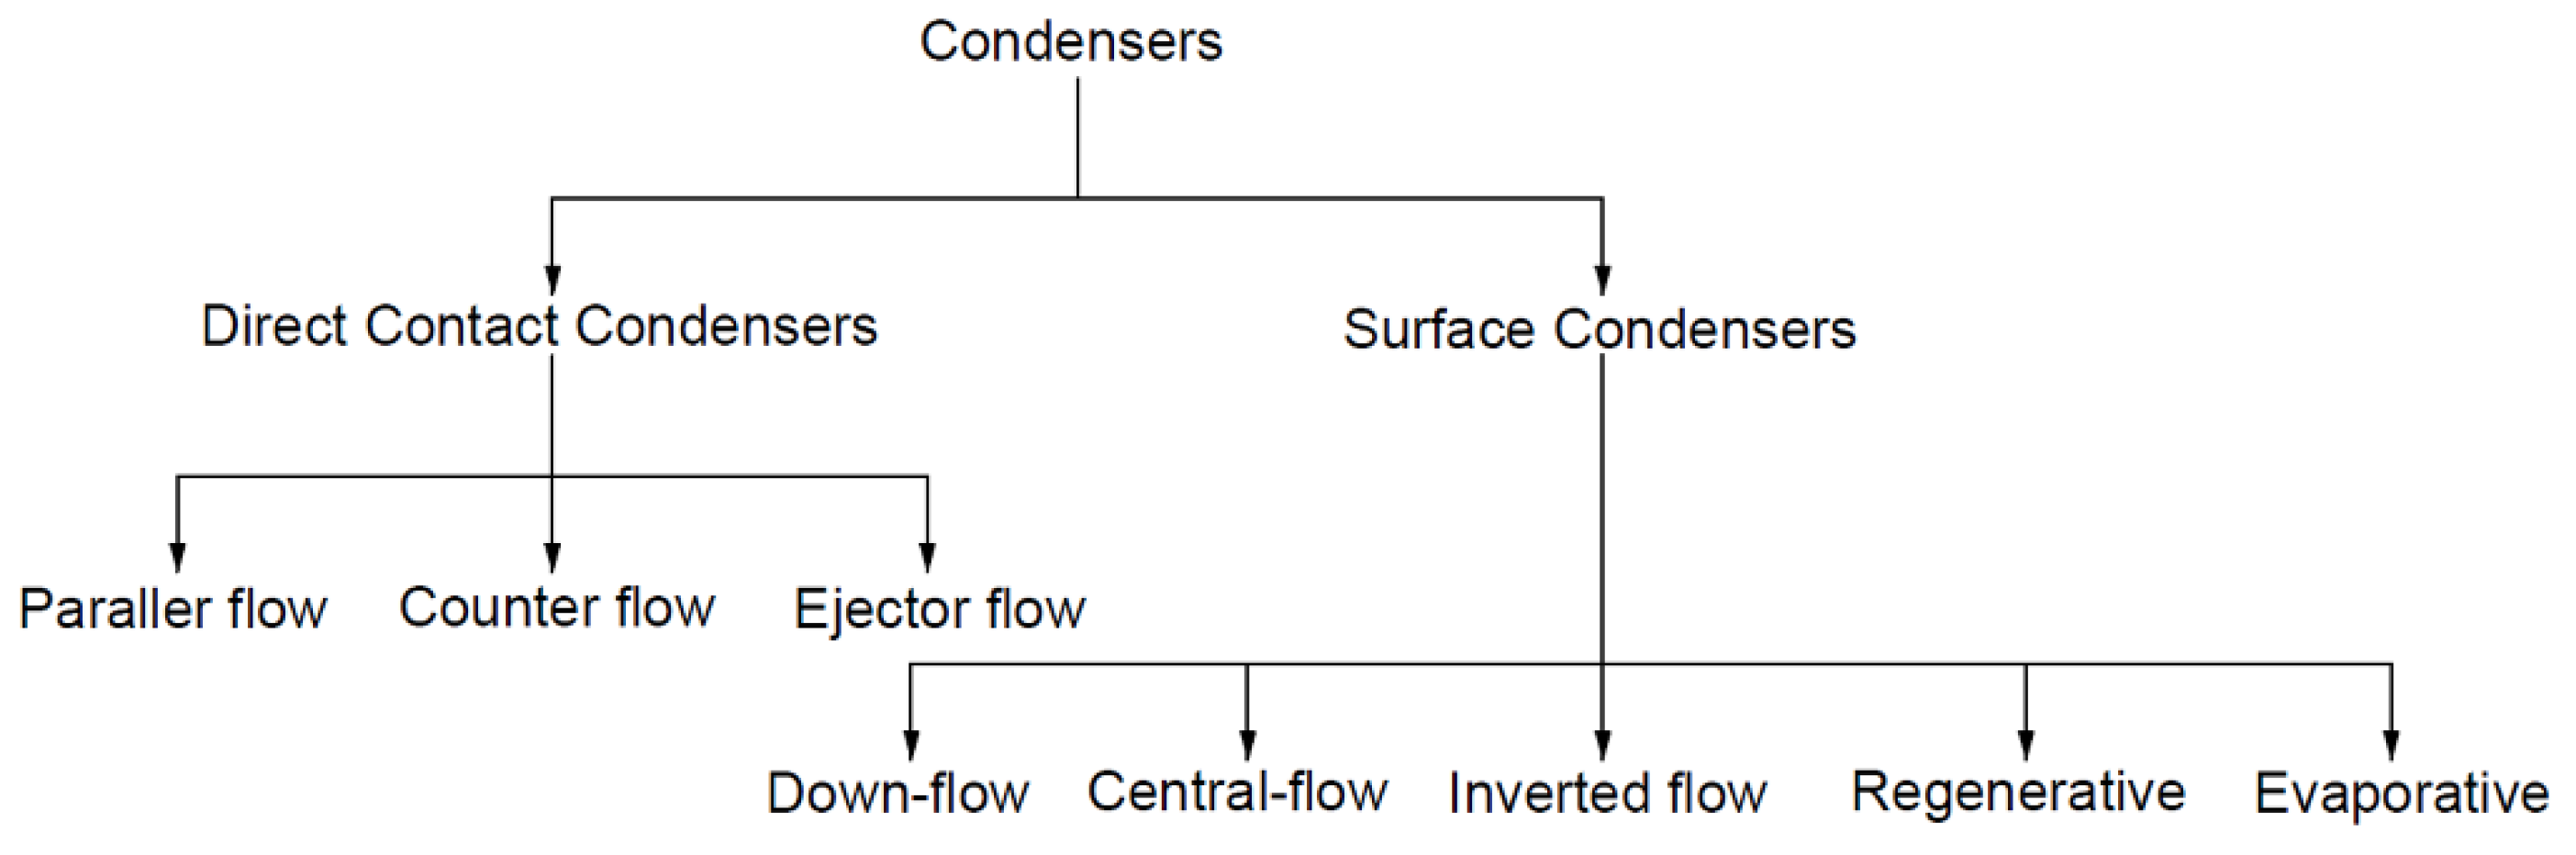
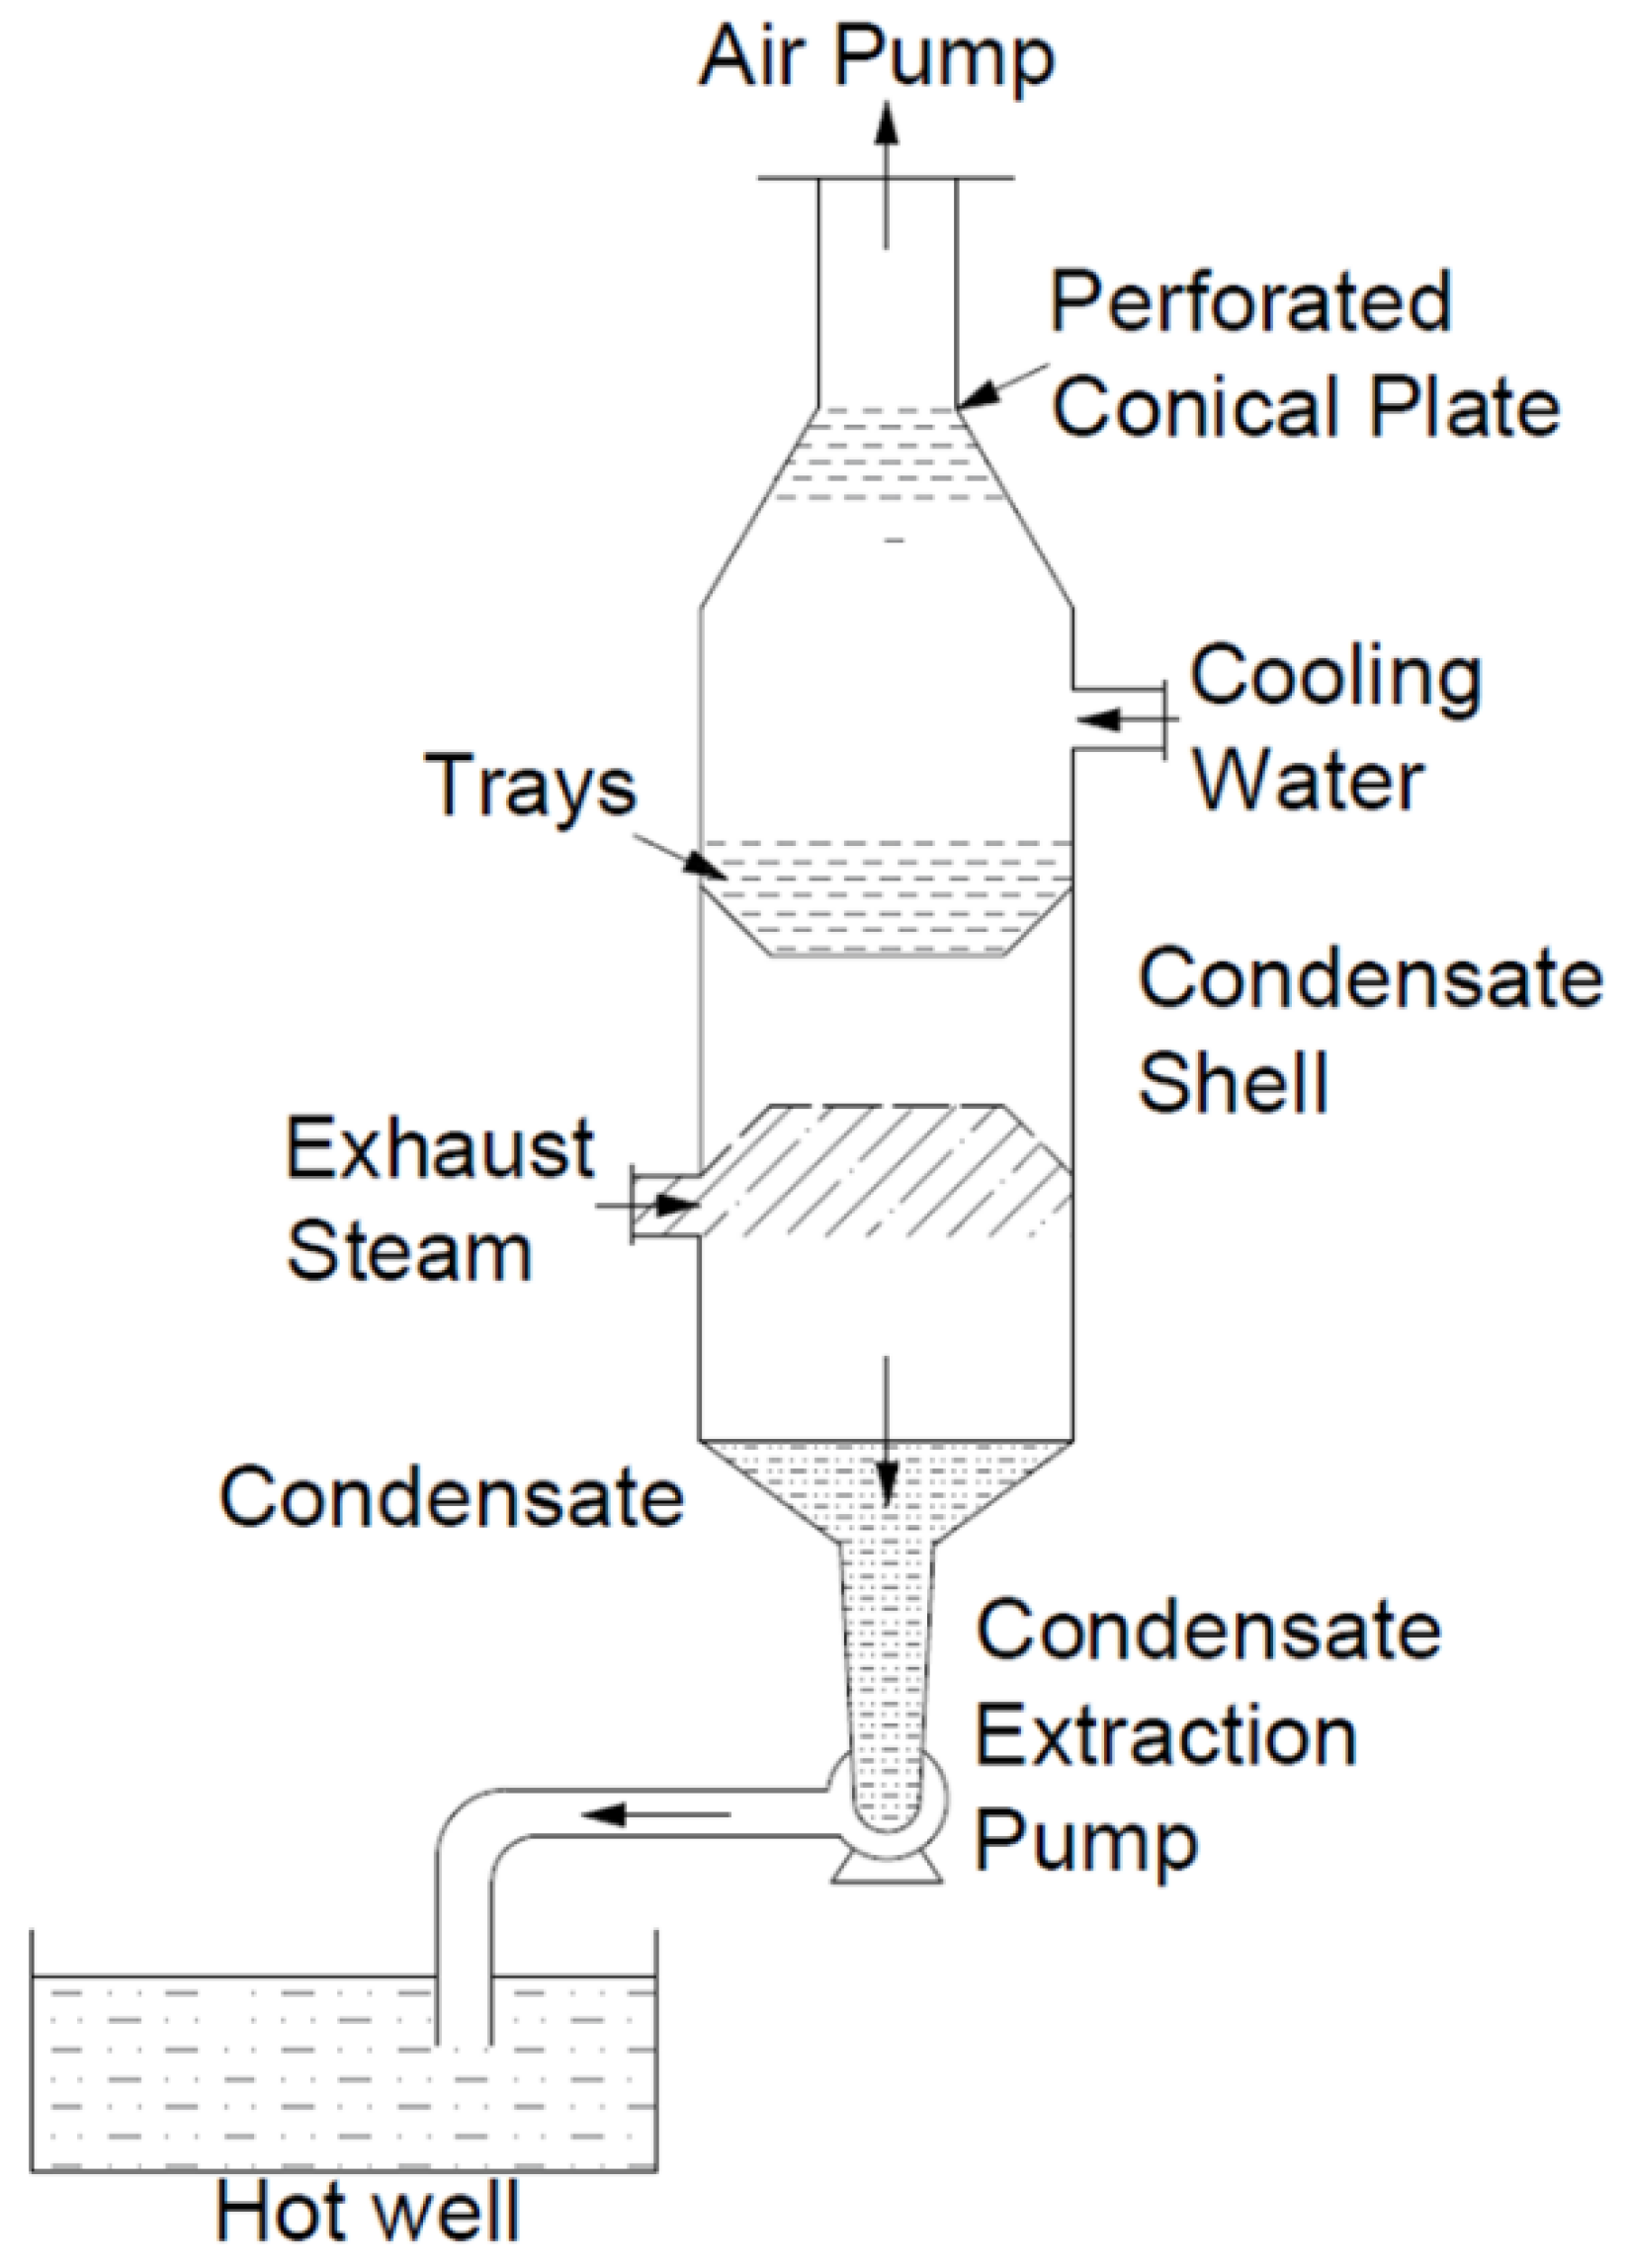
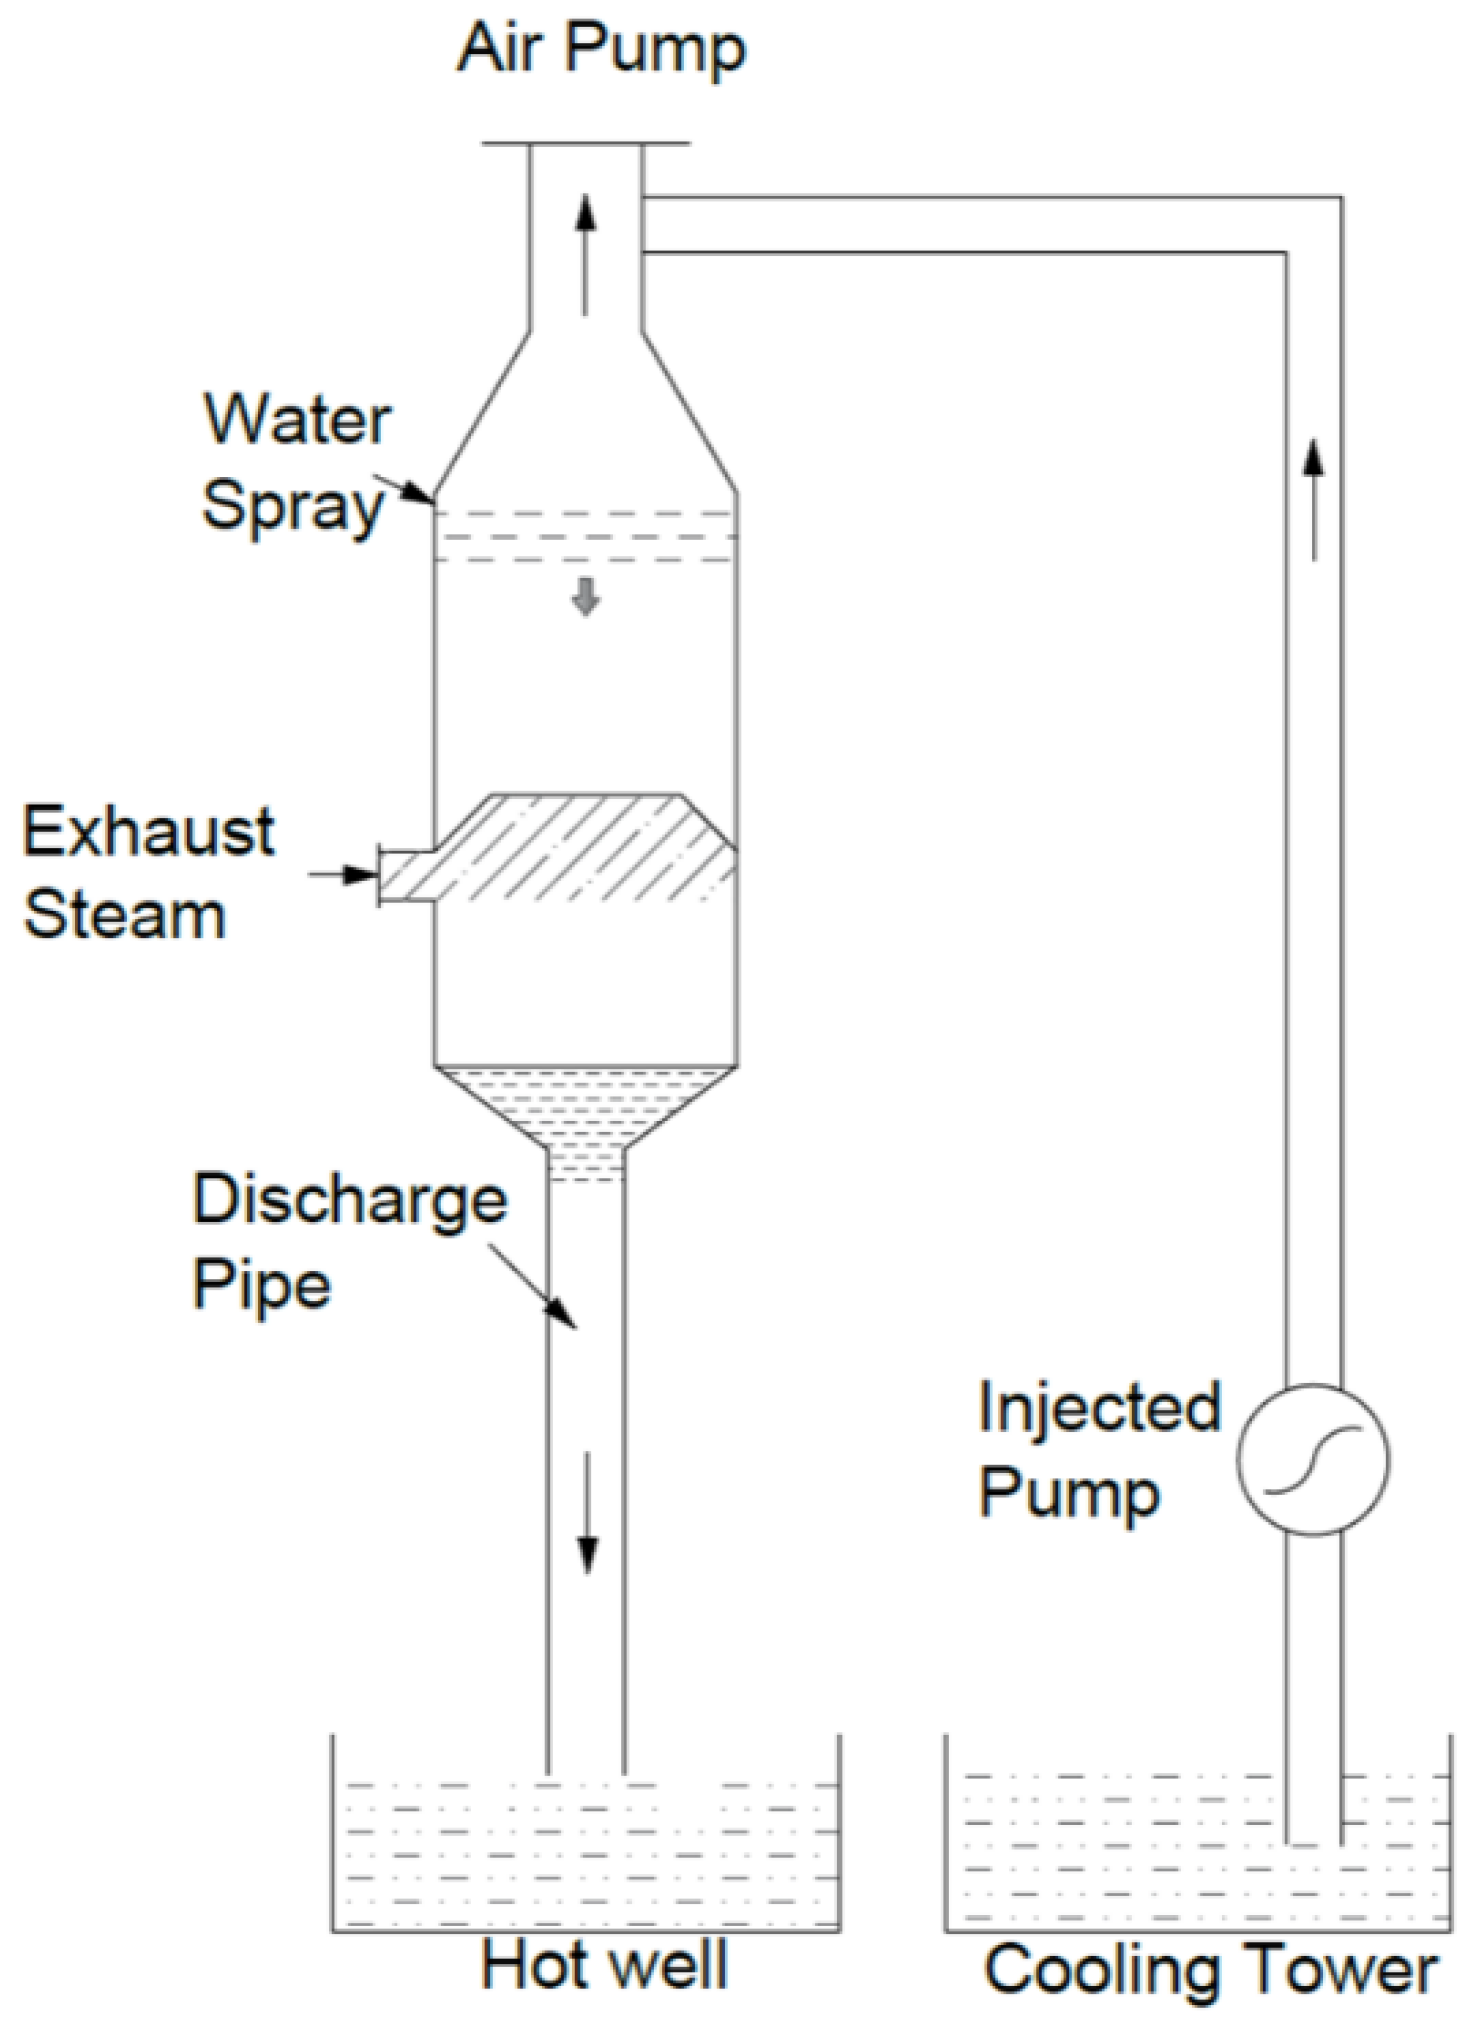
3.2. Parallel Flow Condensers

The Thermochemical Power Group (TPG) at the Polytechnic School of the University of Genoa developed and implemented the contact condenser test rig [36,37,38,39] (Table 2). It was intended for studies on the humid air turbine cycle where water introduction in a gas turbine circuit is provided by a pressurised saturator (i.e., humidification tower or saturation tower).
Changing input variables at the levels given in Table 3, the authors performed 162 tests in total. Data analysis was provided using two types of correlations for the non-dimensional outlet air temperature, i.e., based on polynomial correlation:
T a d i m = c 0 + c 1 x 1 + c 2 x 1 2 + c 3 x 1 3 + c 4 x 2 + c 5 x 2 2 + c 6 x 2 3 + ,
and applying non-dimensional parameters, as non-dimensional temperature (T*), mass flow (M*) and the Reynolds number of inlet air (Re*):
Δ T a d i m = 4.5259 × M 0.0326 × T 0.4645 × R e 0.1027 ,
and:
Δ T a d i m = 4.8198 × M 0.0277 × T 0.4667 × R e 0.1108 .
Equation (5) was derived based on enthalpy balance and assuming an adiabatic saturation process. The standard deviation of 2.5 K and 2.8 K were obtained in the first and second case, respectively. Hence, presented relationships can be used when designing structured packing saturators.
In the work [39] the same rig was used to validate the numerical code TRANSAT developed to simulate the transient performance of direct contact heat exchangers. The error for water temperature was less than 1%.
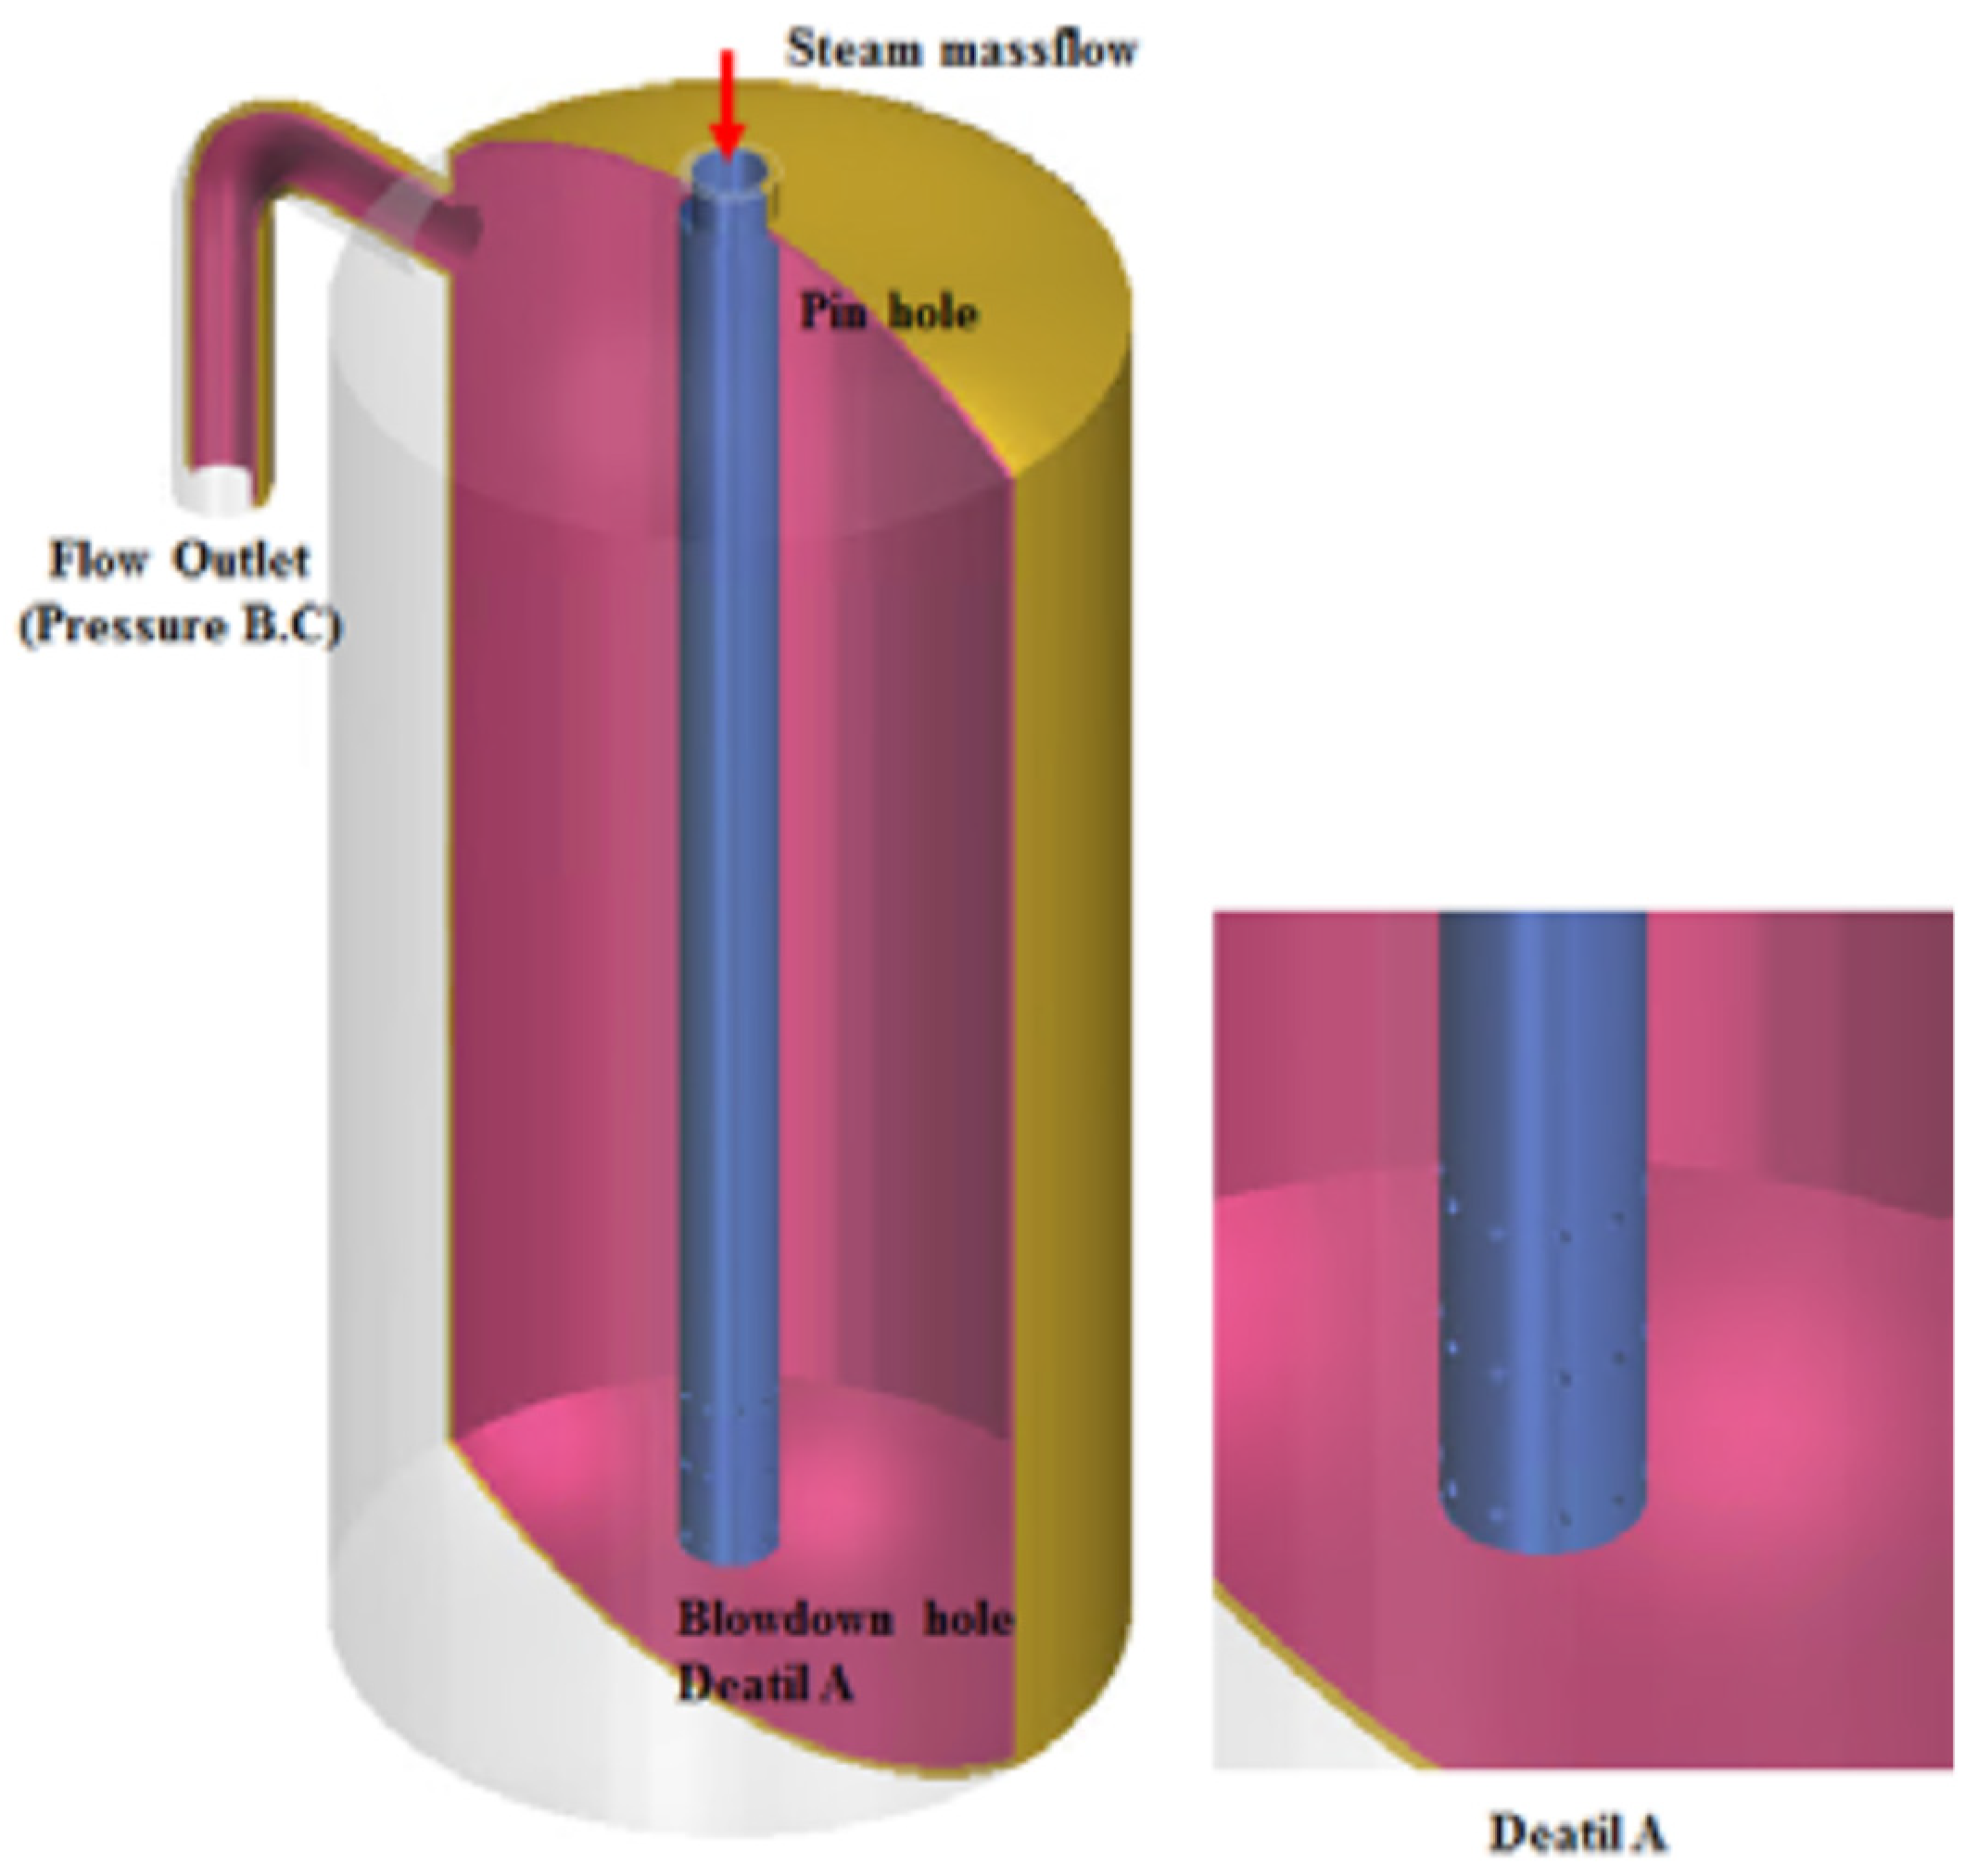
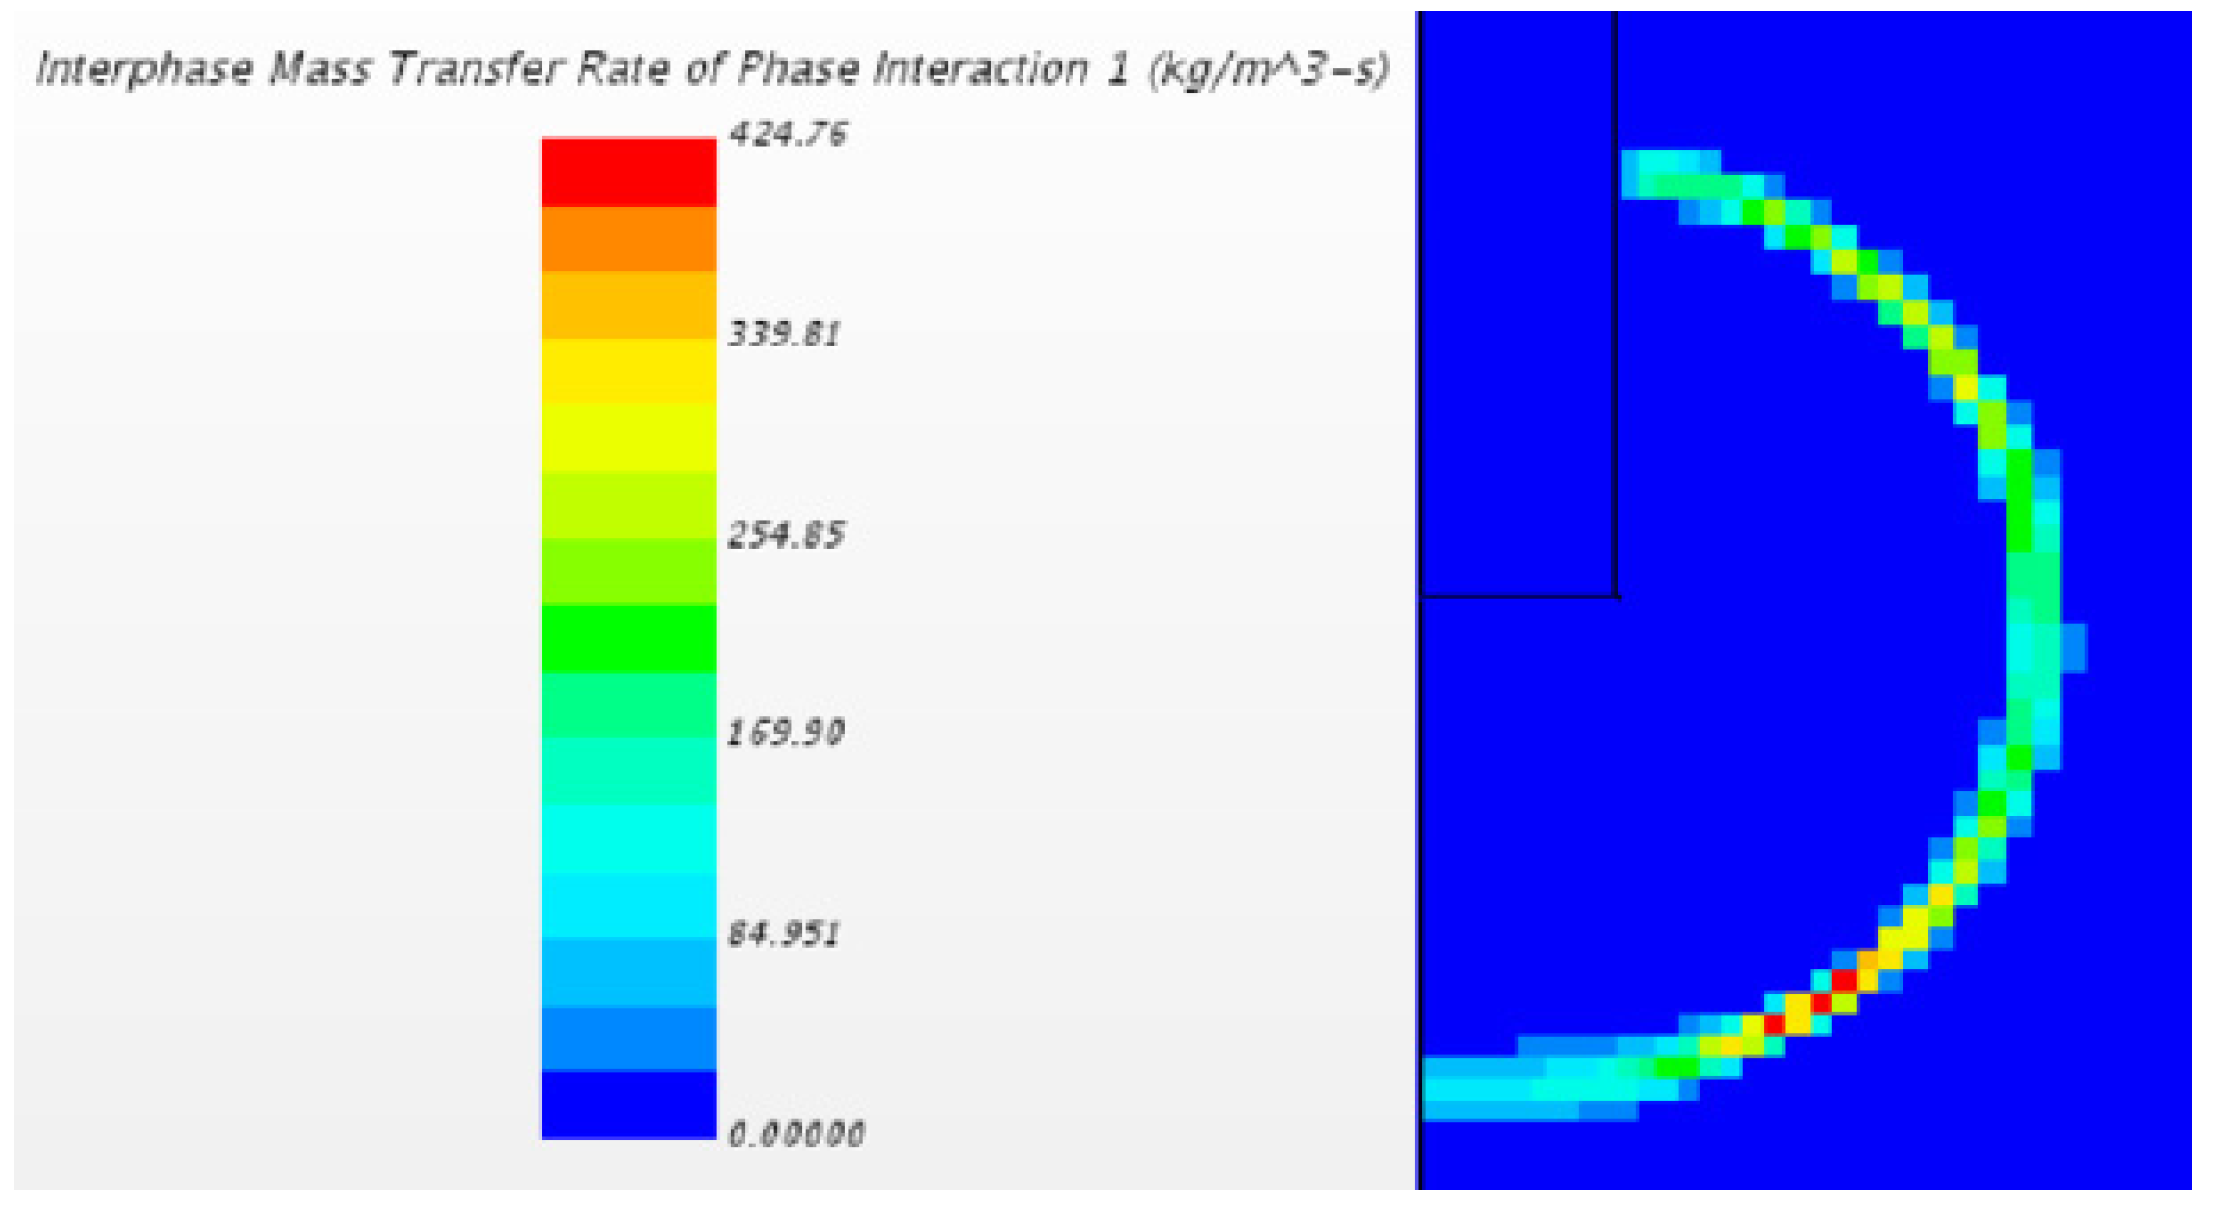
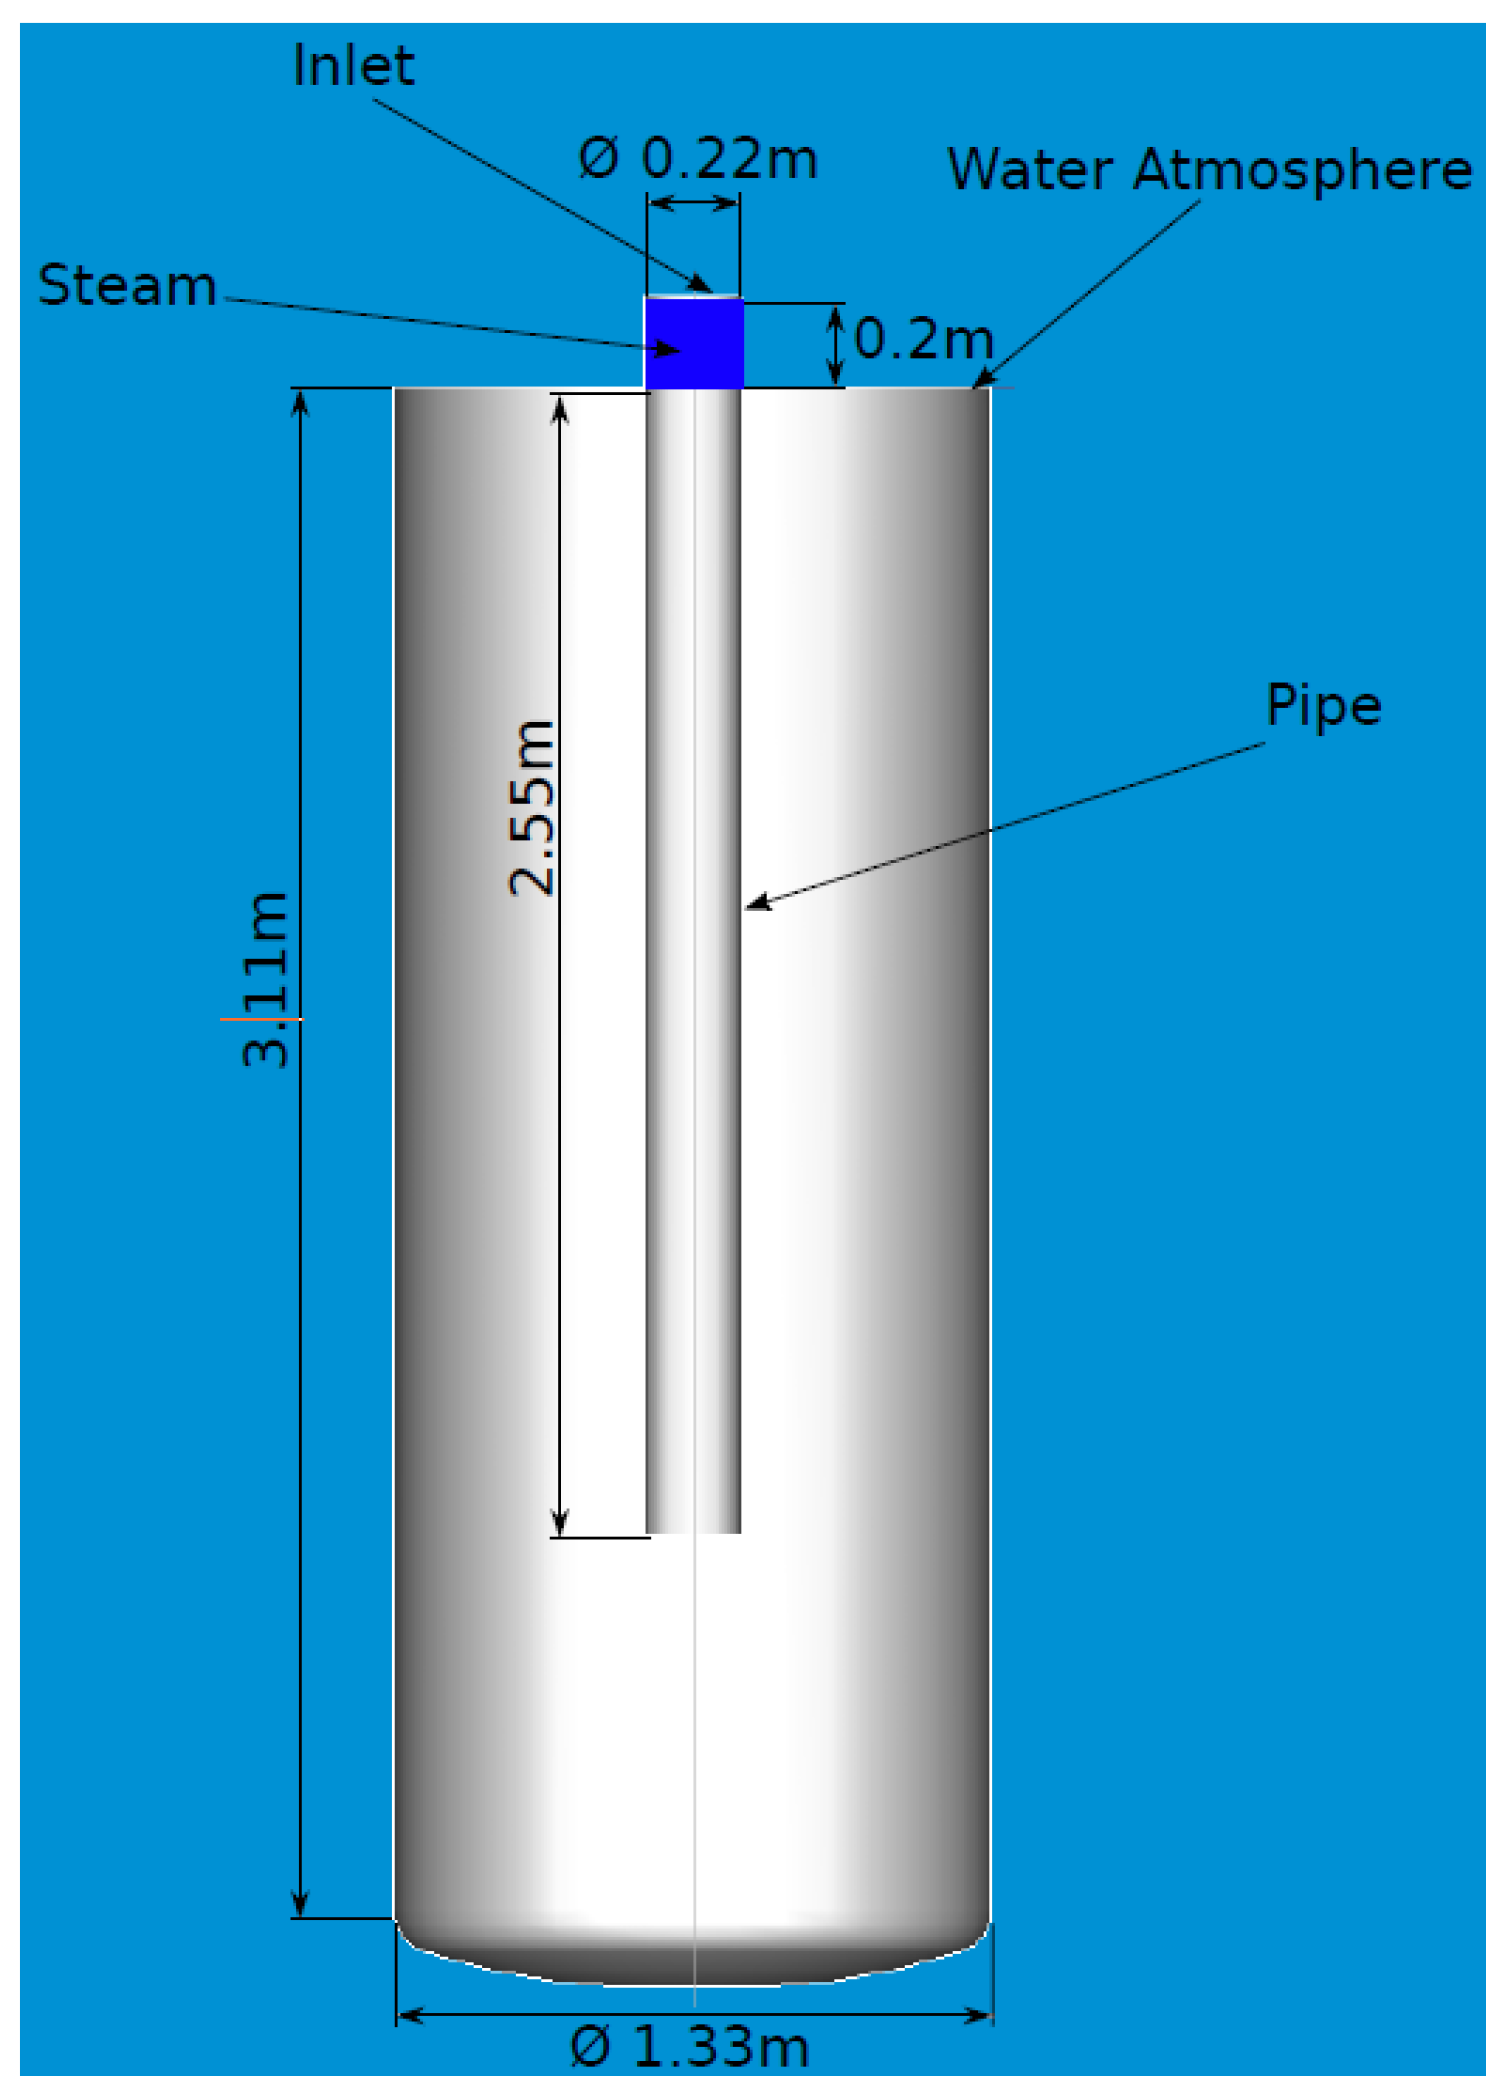
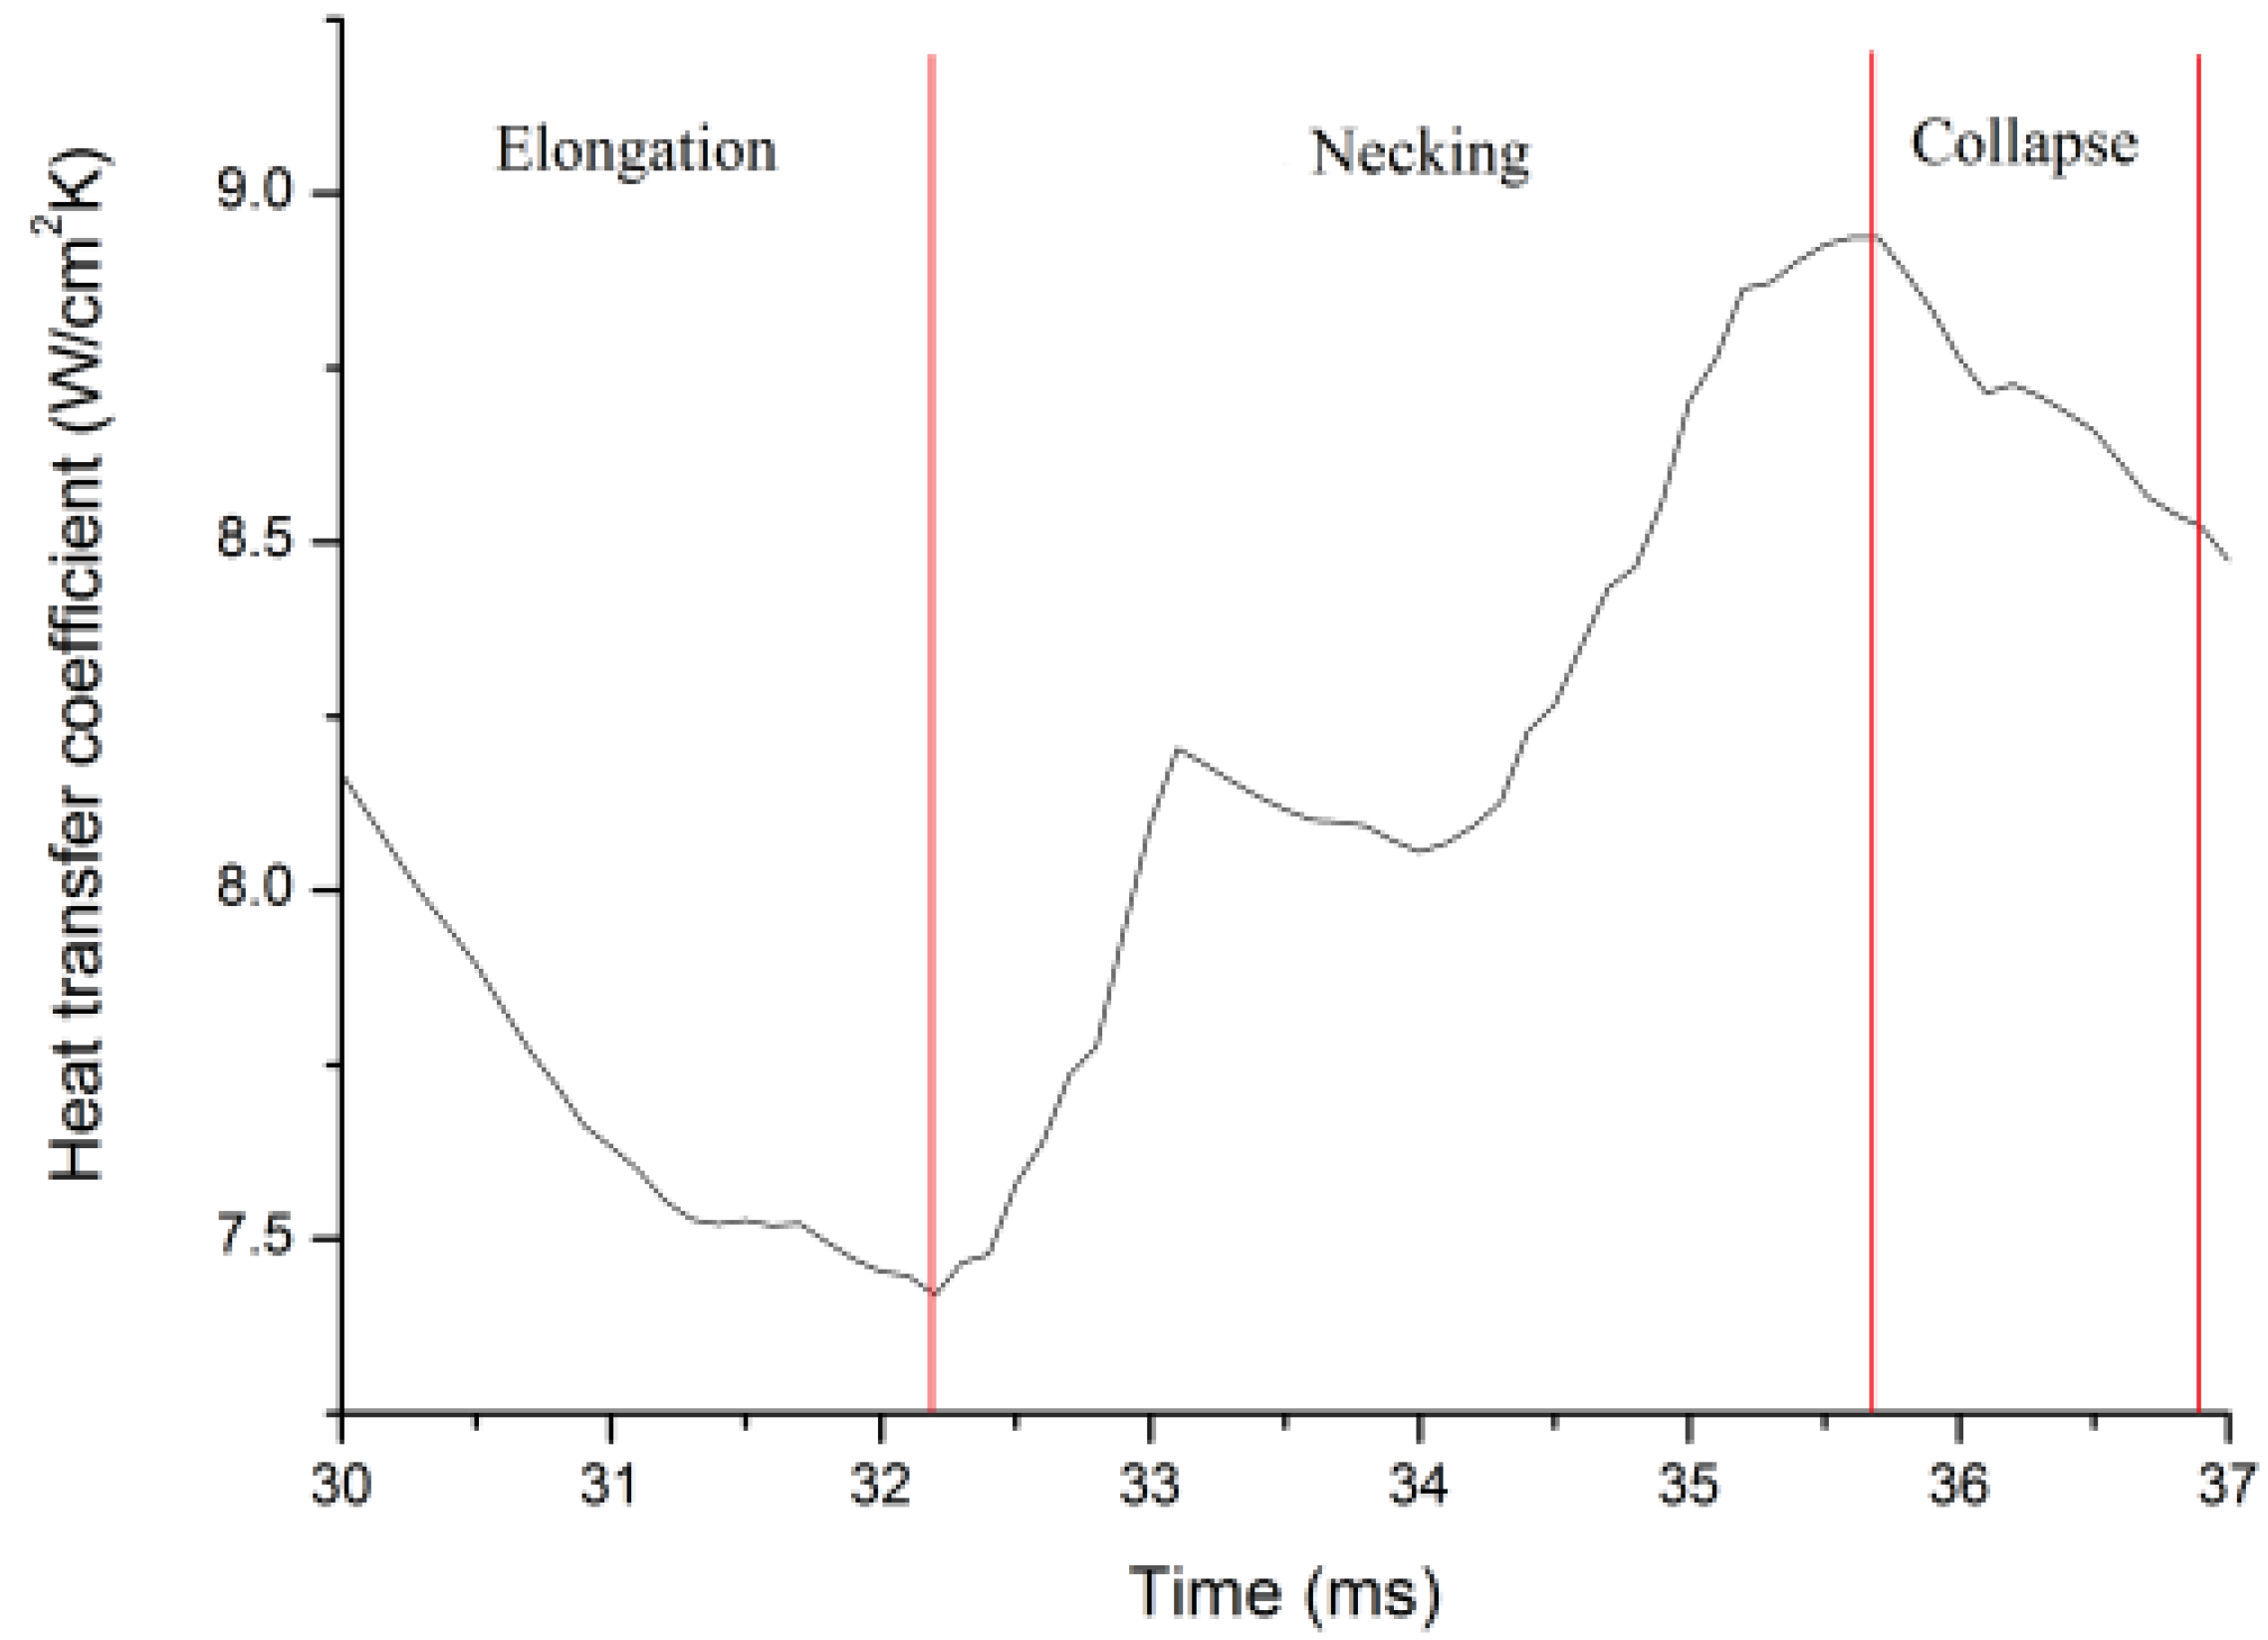
Zare et al. [40] analysed a steam-water system with a vertical square cross-section pipe supplying equipment (Table 4). The high-speed camera (set at 100 fps) photographed the studied phenomenon.
Based on experimental data and employing a genetic algorithm, authors developed an empirical correlation for the average heat transfer coefficient steam-water der direct contact condensation:
N u a v = h a v D λ w = 2083 × B 1.47 G 0 G m 1.51 × R e 0.525
with:
λw—thermal conductivity of water, W/(m·K),
D—hydraulic diameter of the test section, m,
B—condensation driving potential, -
Gm—critical steam mass flux, Gm = 275 kg/m2 s at an atmospheric condition
G0—Steam mass flux, kg/m2 s.
Under experimental conditions (Table 5) the calculated average heat transfer coefficient was within the range of 0.716–3.131 MW/(m2 K).
Datta et al. [41] investigated direct contact condensation during subcooled water injection into a horizontal pipe supplied with steam. The test section was made of stainless steel. A steam tank was used as a steam accumulator (Table 6). Three pressure and five temperature sensors were mounted along the test section to provide their temporal variations.
During experiments, steam and water pressure varied from 2 to 3 bar and from 3 to 6 bar, respectively. Supplying water temperature was maintained about 30 °C. Steam temperature was from 120.2 °C to 133.5 °C. Authors observed higher pressure peaks (up to 6.08 bar) in the test section when the rising pressure difference between its inlet and water section was up to 3 bar.
Karapantsios et al. [42,43] considered a steam—air system using a vertical and transparent column 2660 mm high with 50 mm of internal diameter. They divided the column into the inlet (300 mm), intermediate (900 mm), and measurement (1400 mm) sections. Inlet steam pressure was maintained constant at 1.5 bar. The water flow rate was changed within the range of 26 to 416 g/s.
They defined a condensation heat transfer coefficient:
h c = L Δ T Δ W c Δ x   ,
with:
L—latent heat, J/kg,
ΔWc—condensation rate, kg/s·m.
ΔT—temperature difference, K,
Δx—distance between measuring points, m.
Then the cumulative heat transfer coefficient was analyzed, assuming as ΔT the logarithmic mean temperature difference. During experiments, it varied between 500 and 2000 W/m2 K for the entire condensing region (at heights between 0 and 690 mm from the steam entry).
The steam condensation subatmospheric conditions in the concurrent flow packing tower were investigated by Chen et al. [44]. As the direct contact condenser, they used a stainless steel 1000 mm high column with 300 mm of internal diameter. A steam generator with 0–144 kW of heating power and a 1.5 kW vacuum pump (6 × 10⁻² Pa and flow rate of 15 L/s) were used.
During an impact of steam temperature Tcond, steam flow Gin, inlet water temperature Tin, and water flow Lw on the condensation process was studied. These parameters were set at values given in Table 7.
The authors analyzed several parameters, such as condensation rate (R), degree of subcooling (ΔT), number of liquid-phase heat transfer units (NTUL), and the total volume heat transfer coefficient KV. The relationship gives the latter one:
K V = c p L G L   T o u t T i n Δ T m   V ,
with:
cpL—specific heat at constant pressure, J/(kgK),
GL—mass flow rate of cooling water, kg/s,
Tin—inlet temperature of cooling water, K,
Tout—outlet temperature of cooling water, K,
ΔTm—logarithmic average temperature difference during condensation, K,
V—volume from the liquid distributor to the stable liquid level of the tower bottom, m3.
During experiments, KV varied from 80 to 250 kW/(m3 K). After fitting to experimental data, authors provided the correlation in the form:
K V = 50 T r F L G 1.512 ,
with FLG given by the equation:
F L G = G L G S , i n ρ S ρ L .
Ma et al. [35] analyzed steam condensation in the presence of non-condensable gas (steam-nitrogen and steam argon) in relation to pure steam and estimated the heat transfer coefficient in relation to various conditions (pressure, gas content). The test section was the 1669 mm high tube with 5 mm and 8 mm inner and outer diameters, respectively. It was placed in a cylindrical container, 3660 mm high and with an internal diameter of 40 mm.
The test section was the tube-in-tube type, made of an inner tube with an outer diameter of 34 mm and an outer condensing tube with an inner diameter of 60 mm, and located in the axial centre of a stainless steel vessel with an inner diameter of 0.4 m and a height of 3.66 m. At its bottom were electrical heaters with power controlled from 0 to 60 kW, used to heat water. The condensing section had a height of 1.669 m. The thickness of the inner and outer tubes was 5 mm and 8 mm, respectively. A 60 kW electric heater was used to heat up water. The mass fraction of N2/Ar was between 5% and 90%. Other experimental conditions are given in Table 8.
During pure steam condensation, when increasing the bulk pressure from 0.21 MPa to 3.12 MPa, the average condensation heat transfer coefficient, hc, increased from 1.74 kW/(m2 K) to 8.95 kW/(m2 K). The introduction of non-condensable gases significantly influenced obtained results. In the presence of N2 with a mass fraction of 11.5% hc increased from 0.99 kW/(m2 K) to 4.37 kW/(m2 K) under the system pressure rise from 0.21 MPa to 3.11 MPa. They also noticed that under constant pressure, the condensation heat transfer coefficient decreases along with the increase of non-condensable gas share. They gave a case for 4.12 MPa bulk pressure and the mass fraction of N2 increased from 8.41% to 81.5% when hc decreased from 6.12 kW/(m2 K) to 0.54 kW/(m2 K).

3.3. Counter Flow Condensers

Genic [45] analyzed a water and steam system (Table 9) comprising a 300 mm diameter column for water deaerators with downcommerless trays.
The author derived experimental correlation for the number of transfer units for the liquid phase (NTUL), with a correlation ratio of 0.925 and standard deviation of 15.9%, in the following form:
N T U L = 0.185 G L G S , i n ρ S ρ L 1.48
with:
GL—mass flow rate of liquid, kg/s,
GS,in—inlet mass flow rate of steam (vapour), kg/s,
ρL—liquid density, kg/m3,
ρS—steam (vapour) density, kg/m3.
In the next study [46] based on the same test rig, authors investigated heat transfer during direct-contact condensation on baffle trays. They presented the experimental correlation for Nusselt number based on dimensionless numbers:
N u = 5.8 × 10 6 × R e 5 / 3 × P r 1 / 3 × F r 2 / 3
With a correlation ratio of 0.983 and a standard deviation of 13.3% sufficient for engineering design purposes.
In the study of Chen et al. [47], the authors investigated sonic steam jet condensation in sonic flow of water. Visualization of steam plumes was performed using a high-speed camera. Then digital image processing with Matlab software was applied. The test rig was set to provide the maximum steam flow rate of 126 kg/s (Table 10). The test conditions are given in Table 11.
The authors distinguished five considered plume shapes: hemispherical, conical, contraction-expansion-contraction, ellipsoidal, and divergent, and presented a 3-D map of these shapes.
Introducing, as in previous studies, several dimensionless parameters authors derived experimental correlation for average heat transfer coefficient:
h a v = 3.51 × 10 3 × c p G m B 0.64 G e G m 1.25 × R e 0.15
Under presented experimental conditions, hav varied Nusselt number:
N u a v = h a v d e λ w = 0.008 B 1.15 G e G m 1.34 × R e 0.16
with:
de—diameter of steam nozzle exit, mm,
Gm—critical steam mass flux,
Ge—steam mass flux, kg/m2 s.
The presented model produced results with an accuracy of 20% when comparing the experimental data. The measured heat transfer coefficient was within the range of 1.6–5.5 MW/m2 K.
Fei [48] and Xu [49] investigated bubbles’ uniformity and mixing time in a direct contact heat exchanger. They used a two-component system with heat transfer fluid (HTF) and R-245fa under the test conditions presented in Table 12.
The authors concluded that there was a linear relationship between the flow patterns of a bubble swarm and heat transfer.
Xu et al. [33] investigated direct-contact condensation of the steam jet in water flow in pipes. The authors investigated the average heat transfer coefficient and Nusselt number. They also observed the plume’s shape and length using a high-speed camera. The test conditions are given in Table 13.
Finally, they presented experimental correlations to obtain average heat transfer coefficients. For Reynolds numbers from 2456 to 29,473:
h a v = 0.61 C p G m B 0.59 G e G m 0.58 × R e 0.30 .
For 29,473 ≤ Re < 117,893:
h a v = 7.21 × 10 5 C p G m B 0.35 G e G m 0.55 × R e 1.10 .
B—condensation driving potential
Cp—water-specific heat, J/kgK
Ge—steam mass flux at nozzle exit, kg/m2 s
Gm—critical steam mass flux, kg/m2 s
Its value during experiments was within the range of 0.34–11.36 MW/m2 K.
Mahood et al. [34] presented an experimental test facility for the investigation of a three-phase direct contact condenser using three phases (pentane, liquid-, vapor-water). A test section was built in the form of a 70 cm high Perspex vertical column with a 4 cm internal diameter and with seven thermocouples located along its height. The initial dispersed phase (liquid pentane) and continuous phase (water) temperature were from 37.6 °C to 41.7 °C and 19 °C, respectively.
The authors studied the impact of the mass flow rate ratio and temperature of the dispersed phase on the outlet conditions of the condenser and found that they depend mainly on the relation between dispersed and continuous mass flows. Additionally, the water temperature increased along with the column height.
In the next studies [50,51,52,53,54,55,56,57,58] they modified the test rig, locating thermocouples in different positions, and investigated the time-dependent volumetric heat transfer coefficient. In [50] they concluded that it decreases with time until steady-state conditions (at about 100 s in the considered case) are reached, according to the relationship:
U v = C p c 1 α ρ c t l n T d i T c o + m ˙ d / m ˙ c h f g / C p c T d i T c o
with:
Cpc—specific heat of continuous phase, J/kgK
α—holdup ratio, -
ρc—density of continuous phase, kg/m3,
t—time, s,
Tdi—dispersed phase inlet temperature, K
Tco—continuous phase outlet temperature, K,
hfg—latent heat of condensation, J/kg.
Depending on the dispersed to continuous phases mass flow ratio, R, the initial value of Uv was from about 150 kW/m3 K at R = 6.5% to 780 kW/m3 K at R = 43.7%. Further, in [53] they confirmed that its value was not dependent on the initial dispersed temperature. In [54] the Uv was studied during the inception of the undesirable flooding phenomenon. Its value was from about 30 kW/m3 K to 60 kW/m3 K at Tdi = 40°C to 60°C, respectively.
The next papers [55,56] were devoted to heat transfer by convection during direct contact condensation. Experiments showed that the unit heat transfer rate increased along with the mass flow rate ratio: from 100 kW/m3K to 200 kW/m3K at m ˙ c = 0.05 kg/min to 200–400 kW/m3K at m ˙ c = 0.38 kg/min.
In [51] authors developed their research determining the efficiency and capital cost of this heat exchanger. The heat transfer efficiency was given as:
H T e f f = T c o T c i T d , s a t T c i × 100 % ,
with:
Tci—continuous phase inlet temperature, K
Tco—continuous phase outlet temperature, K,
Td,sat—vapour saturation temperature, K.
It was found that efficiency was controlled by means of the mass flow ratio (R). At higher values of R, the efficiency was above 50%.
This test rig with the different columns, 100 cm high with a 10 cm internal diameter, was also used [57] in investigations of the temperature distribution in the column condenser. The presented results showed a decrease in the continuous phase temperature down the height of the column. In [58,59] heat transfer measurements were performed depending on various parameters. The authors showed that the water (continuous phase) flow rate significantly affected the average volumetric heat transfer coefficient. During tests its value varied within the range of 20–60 kW/m3 K.
Observations of the transient behavior of a steam-water system with a packed column 1045 mm high and with an internal diameter of 325 mm were presented in [60]. The flow rate of cooling water was set at 120 L/h, 160 L/h, 350 L/h, 540 L/h, and 840 L/h, at a constant temperature of 28 °C.
The authors defined the volumetric heat transfer coefficient by the following equation:
h v = Q w a t e r V e × Δ T m ,
with:
Ve—effective heat transfer volume of the column, m2,
ΔTm—logarithmic mean temperature difference, K.
They reported that hv increased from 1.47 kW/m3 K to 10.93 kW/m3 K with an increasing water flow rate from 120 L/h to 840 L/h. Additionally, time constant, referred to as the maximum attenuation of steam, shortened from 75 s to 13 s with the water flow rate rising within the same range.
Pommerenck et al. [61] used steam with volatile oils entrained in an air flow in the direct condenser with the sprayed water to analyze the recovery phenomenon for such oils. The condenser was built as a vertical PVC pipe with a 10 cm diameter. Water sprayer tips were mounted opposite at the same height. There were between 2 to 8 spray tips used during tests. Steam was introduced into the condenser through 2, 4, or 8 sprayers. The authors found that the direct contact condenser allowed better recovery in relation to the shell condenser. The direct condenser capture efficiency was found to be less depended on steam concentration than spray development.

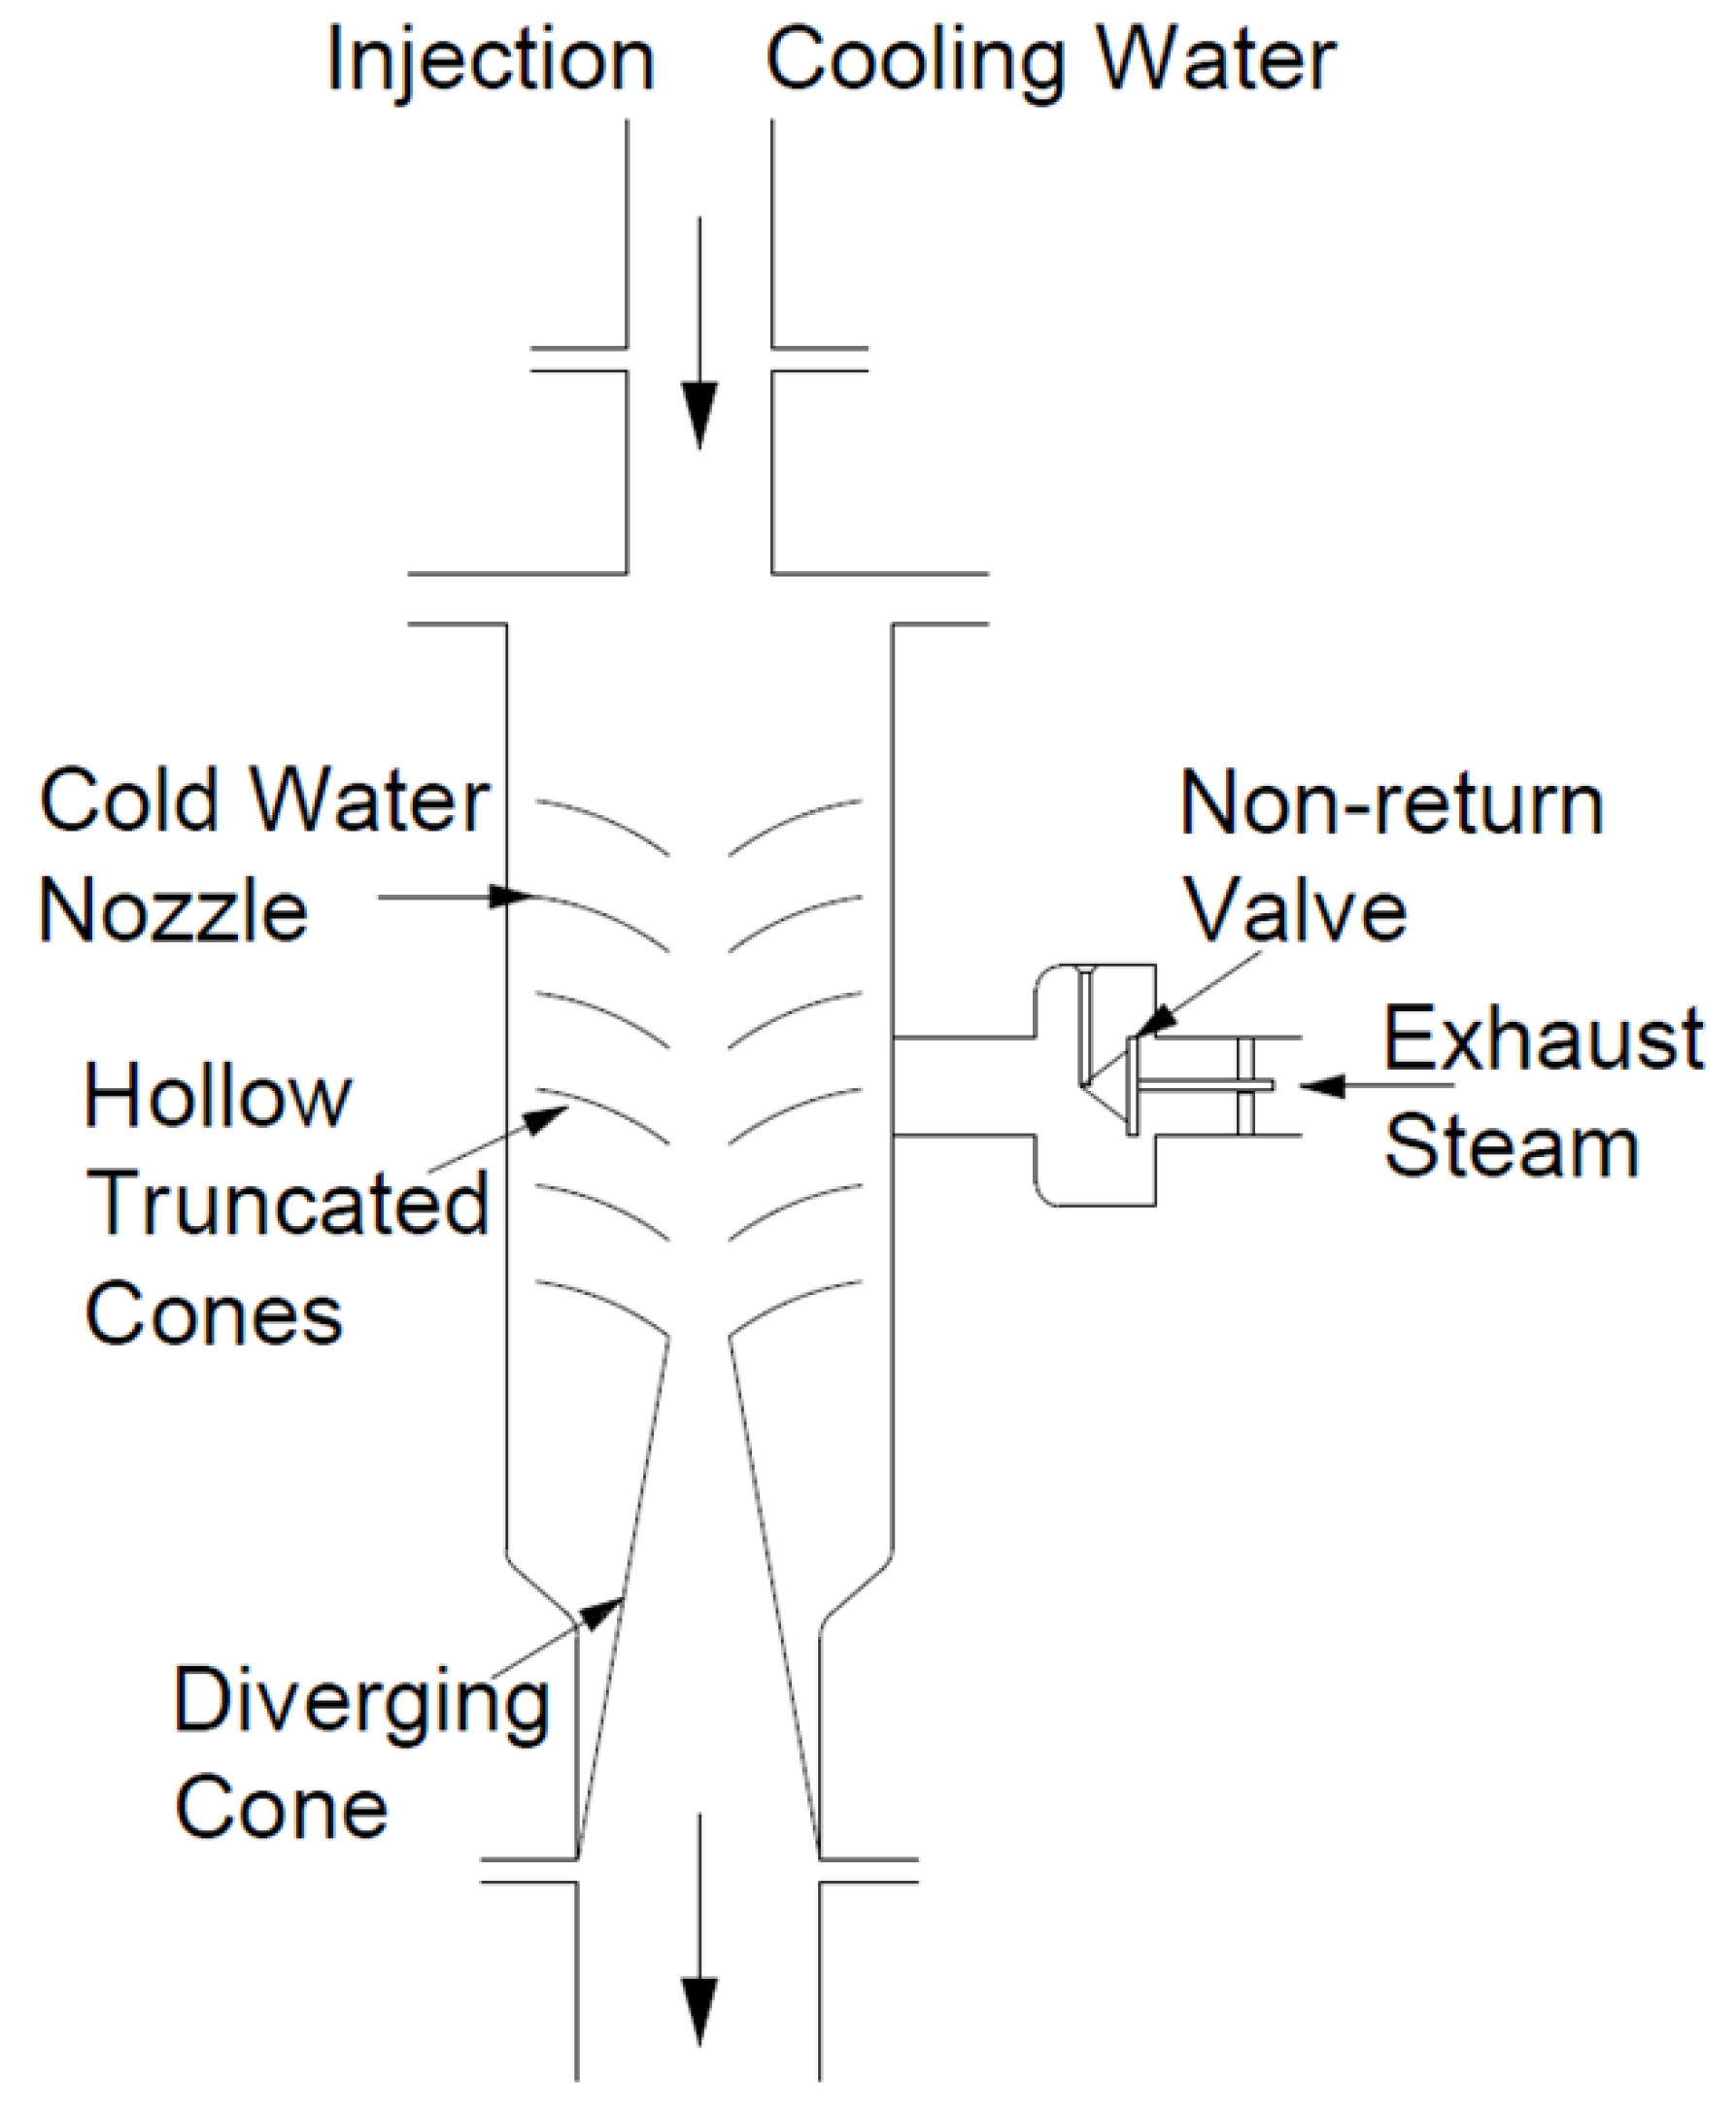
3.4. Ejector Condensers

Yang et al. [32,60] investigated flow patterns and the influence of inlet water and steam parameters on pressure and temperature distributions in an ejector condenser under experimental conditions given in Table 14.
The authors presented selected pressure and temperature distributions for stable and unstable flow patterns, providing input conditions.
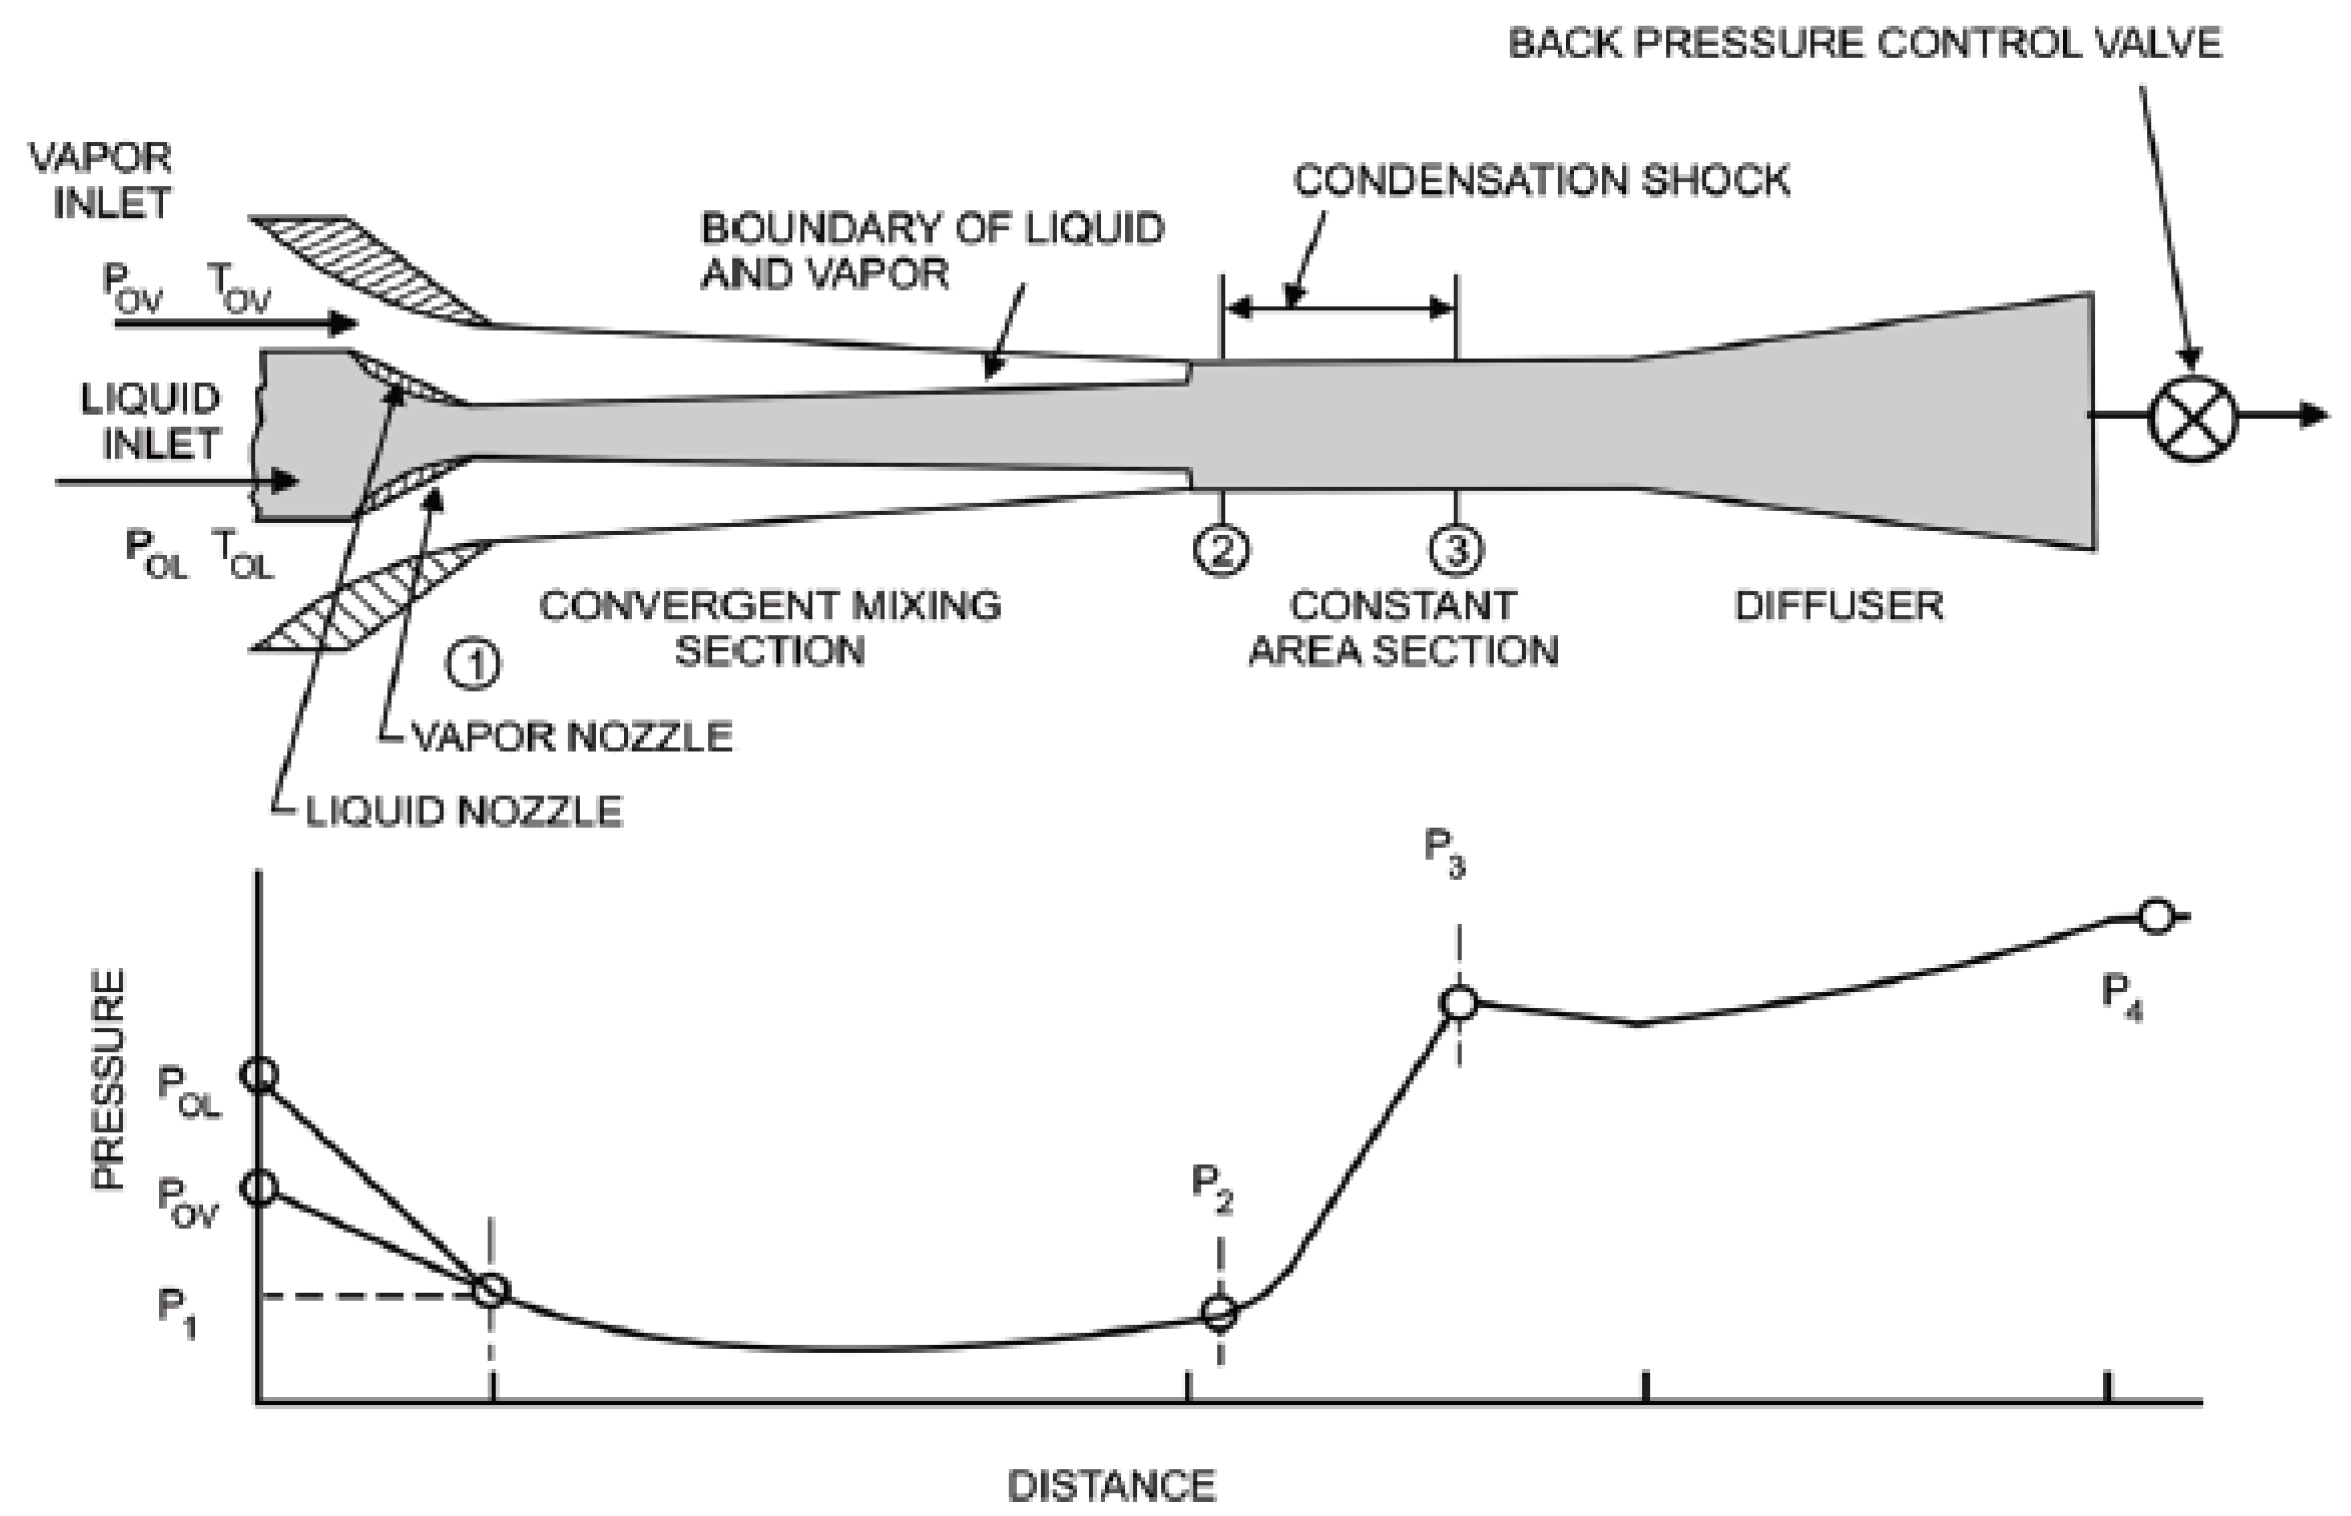
Kwidzinski [62] investigated two-phase steam-water injectors. Four devices were used, each with different dimensions. During experiments motive steam pressure was from 60 to 430 kPa with flow rates from 75 to 130 kg/h. The water flow rate was between 1500 and 6500 kg/h at a water temperature of 14 to 40 °C. The average heat transfer coefficient for condensation in a mixing chamber of the condenser was given by:
α M C = m ˙ c 2 h V 1 h L 2 A M C Δ T M C ,
with:
m ˙ c 2 —mass flow rate of condensate at the outlet of a mixing chamber, kg/s,
hV1—steam enthalpy at the steam nozzle outlet, J/kg,
hL2—liquid enthalpy at the mixing chamber outlet, J/kg,
ΔTMC—logarithmic mean temperature difference between the vapour and liquid in the mixing chamber, K,
AMC—surface area of the mixing chamber wall, m2.
Depending on the device, it was found that αMC varied from 250 kW/m2 K to about 800 kW/m2 K at the temperature difference (ΔTMC) from 24 K to 68 K. Other experimental studies devoted to steam-ejector condensers were presented by Shah et al. [63,64,65]. The authors evaluated the effect of the mixing section length (110, 130, and 150 mm) on the transport process in the condenser. In addition, CFD simulations were performed.
As the source of steam, the electric 36 kW steam boiler with a 38 L tank generates saturated steam at a maximum flow rate of 52 kg/h (14.4 g/s) and pressure of 8 bar. The operating conditions during experiments are given in Table 15.
The authors didn’t present experimental correlations. However, several general outcomes were given. They observed an increasing water mass flow rate along with increasing inlet steam pressure. Additionally, under the same operating conditions, they obtainedhigher suction pressure and flow rate at a shorter length of the mixing section.
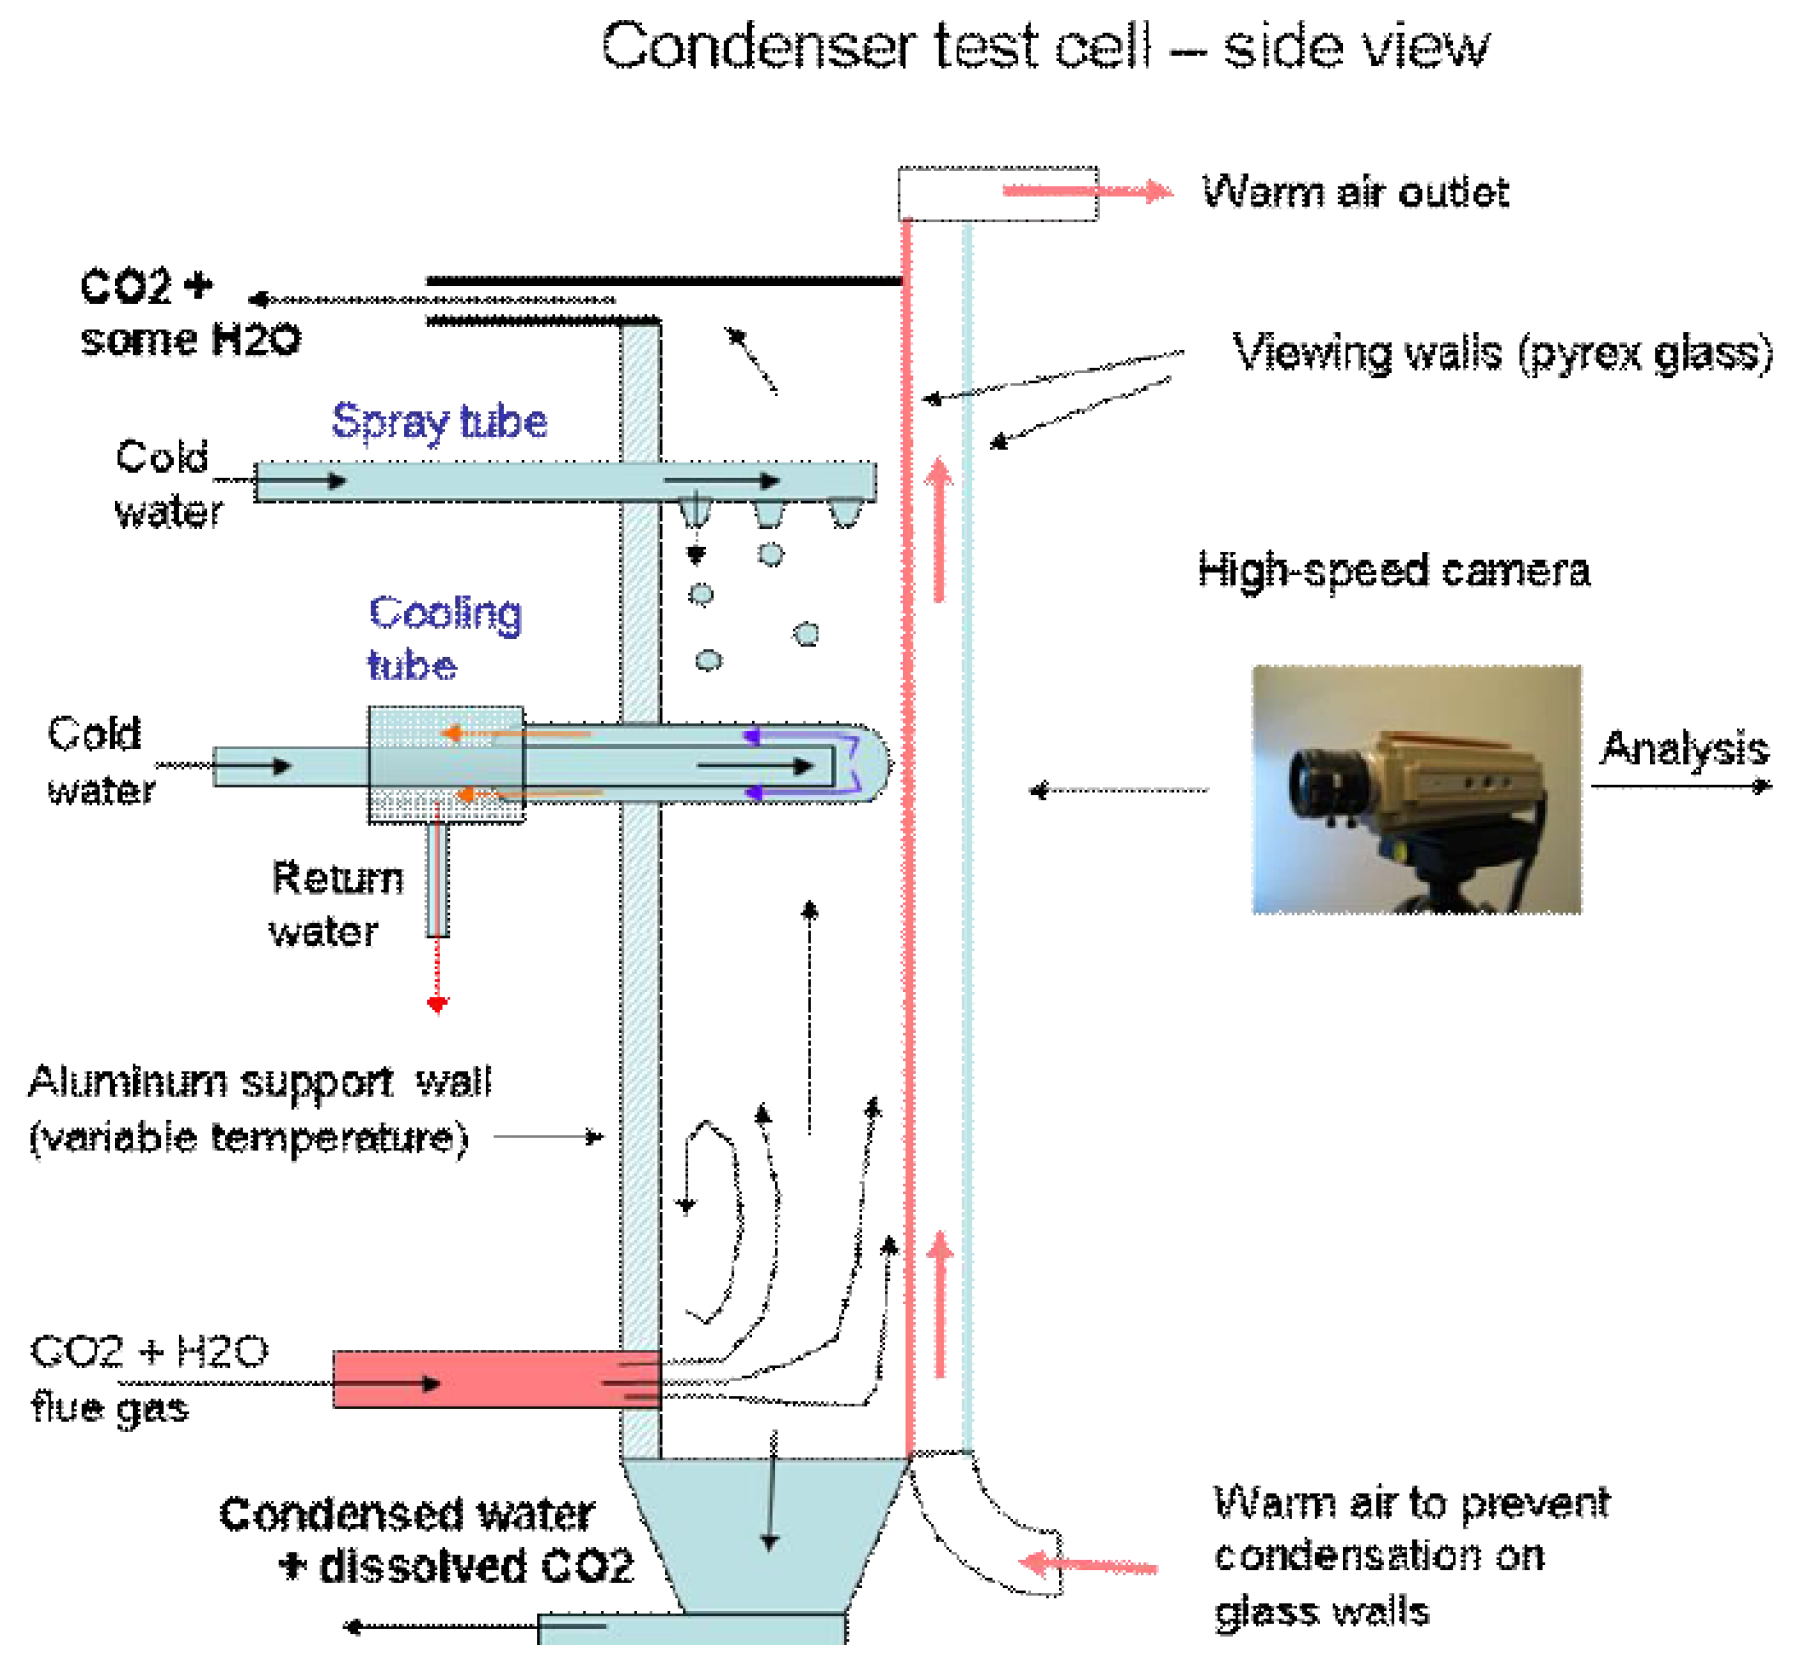
Reddick et al. [66] investigated a steam ejector’s performance in a mixture of steam and carbon dioxide (as non-condensable gas). The test rig included the 75 kW electric boiler (maximum pressure of 600 kPa), a 3 kW superheater, an ejector, a flash tank, and a condenser. Several operation variants were considered (Table 16) and performance curves were then prepared.
When pure steam, without CO2 entraining, was used, then it was observed that increasing the primary pressure, secondary pressure or nozzle diameter resulted in a higher value of critical pressure and lower critical entrainment ratio.
Entraining CO2 resulted in different outcomes. Authors reported that the rising share of CO2 resulted in an increased critical entrainment ratio, linearly. At the same time, the critical pressure was unchanged.

4. Measuring Systems in DCC Analysis

The main physical quantities measured in test rigs with direct contact condensers include temperature, pressure, and flow rate. A large variety of measurement methods and techniques can be applied here. However, from a practical and economical point of view, those that the authors found best in a given case were used. It should be emphasized here that none of the presented publications gave reasons for this or that choice. So, it may be worth giving a short presentation of various measurement methods with their main advantages and disadvantages and then presenting a short summary of findings.
The first criterion used when choosing a given sensor is based on the design of the test rig. From this, one can say if there is an electronic data acquisition system or not. If so, a sensor with an electric output signal should be used. If not, there can be applied simpler and cheaper solutions. Scientific experiments require data measurement and acquisition for further processing. Therefore, the presented description covers mainly measurement sensors with electric output signals, which can be used in modern data acquisition systems.
Regarding the temperature measurement, the temperature range of process fluids in the presented papers has not exceeded 300 °C [36]. Hence, thermocouples (TC) and resistance temperature detectors (RTD) could be useful. This is so because these kinds of sensors provide electrical-type output measurement signals that can be very easily transmitted and converted into computer measurement systems. Thermocouples can be used for a wide measurement range, from –270 °C to +1370 °C (K-type chrome–alumel thermocouple) to over 2000 °C (Pt-Rh thermocouples). The IEC 60584 standard defines classes 1 and 2 of tolerance. For class 1 of a measured temperature of 200 °C tolerance is from ±0.50 °C (type T) to ±1.50 °C (types E, J, K, and N). Due to the fact that the sensitive measuring point of the thermocouple (measuring junction) can be very small, with a diameter below 0.5 mm, the response time of these sensors can be very short. Protection of this junction against the negative impact of the external environment in a protective tube (sheath) results in a greater value of this response time [67,68].
The second kind of electrical temperature sensor are RTDs, which are more expensive, larger, and more fragile than thermocouples. Yet they have good accuracy, stability, and sensitivity [67,68]. At a temperature of 200 °C, according to the IEC 60751, the wire-wound A-class Pt100 sensor has a tolerance of ±0.44 °C. Protection of the sensitive part, platinum resistive wires, against the negative environmental impact results in a longer thermal time constant. Temperature measurement in direct contact condensers in presented test rigs was performed mainly by thermocouples. Additionally, RTDs were used but on a smaller scale. Their main parameters are given in Table 17.
As pressure measurement is considered, dominated piezoresistive absolute and differential pressure transducers [48,50], and piezoelectric transducers were used for pressure measurements. [49,66]. They have good accuracy and sensitivity.
The next very important measured quantity is the flow rate of various liquids and gases in the presented test rigs. Genić et al. [37] applied orifice flow meters manufactured following ISO 5167-1, with classical mercury U-tube manometers. When the water flow rate is to be considered, the most popular solution was the electromagnetic flow meter. However, in several cases, the turbine flow meter was also chosen (Table 18).
In steam flow measurement, vortex flow meters were the most popular (Table 19). However, despite the wide range of analysed studies, no selection guidelines were given by the authors.
The presented review shows various measurement techniques used in experiments with direct contact condensers. Despite the importance of this issue, authors presented a general overview and review about the selection of measurement equipment devoted to the test rig with the ejector condenser.

5. Numerical Modeling of Direct Contact Condensation

Numerical modeling of Direct Contact Condensation (DCC), which occurs in Direct Contact Condensers (DCCs), is challenging because of the phenomenon’s complexity. It requires taking into account the multiphase flow, often combined with turbulence. Computational Fluid Dynamics (CFD) can fully overcome these challenges, which is the most common tool for DCC modeling. There is no universal modeling framework for DCC because of the diversity of the phenomenon. Various flow regimes can occur (stratified flow, bubbly/droplets flow, etc.). The Euler-Euler interface tracking methods are suitable for liquid/vapour jet-type condensation, where the heat and mass transfer occurs mainly on the interface between phases. The most known clear interface tracking method is the Volume of Fluid (VOF). For drop-type direct condensation, where the vapor condenses on the surface of the droplets, methods allowing for a dispersed phase should be used. They can be based on the Euler-Euler and Euler-Lagrange approaches [69], but the Euler-Euler approach is often used. In this framework, two models are worth mentioning: the Mixture and the Eulerian two-fluid model. The Eulerian two-fluid model allows for modelling a mixed flow regime combined with interface tracking. Together with the k-ε model, it is often used for modeling steam/bubble jets submerged in subcooled water [70]. The major disadvantage of this model is extensive computational time. This section contains examples of numerical modeling of Direct Contact Condensation in various types of devices.

5.1. Numerical Analysis of DCC of Vapour Injected in the Liquid Tank

The direct contact condensation of steam from a vertical pipe into a water pool was examined numerically by Kunwoo Yi et al. [71]. The scheme of the geometrical model was presented in Figure 6. The presence of inert gas (air) was taken into account. The Star CCM+ solver was used. The Volume of Fluid model (VOF) was used to simulate multiphase flow. Reynolds-Averaged Navier-Stokes equations were closed using the k-ω SST model. The mixture of gas (steam and air) was assumed as an ideal gas. The evaporation/condensation model was used to model the direct contact condensation phenomenon. Mesh consists of mesh with 3 million polyhedral elements. The steam rate was 0.468 kg/m2 s, and the flow was chugging. The tank was initially filled with water in 30% above the bottom of the suppression pool. The initial pressure in the suppression pool was atmospheric, and the temperature was 48.9 °C. As a result of the study, the influence of vertical tube pin holes on the behavior of chugging flow was investigated. The low steam flow rate in the blowdown pipe can prevent the chugging flow.
Multiphase CFD analysis of steam-water direct contact condensation in a Pressure Suppression Chamber was conducted by Tyler Dee Hughes [73]. The pressure Suppression Chamber is a crucial part of the BWR Reactor Core Cooling system. A 2D, axisymmetric model was developed using commercial Star CCM+ software based on the Finite Volume Method (FVM). The Eulerian two-fluid multiphase model with a segregated solver was used. Direct contact condensation was modelled based on the Hughes-Duffey Nusselt number correlation correlated to the liquid side:
N u = 2 π R e t 1 / 2 P r l
with:
R e t —turbulent Reynolds number, -,
P r l —liquid Prandtl number, -,
The Standard k-ε turbulence model was used to model both phases’ behavior. The boundary conditions were assumed in accordance with the experimental environments. The physical properties of water and steam were computed based on IAPWS tables [74]. The simulation was transient First-order backward Euler implicit time step discretization and was applied; the Courrant Number did not exceed 10. For all fields, the second order discretization scheme was used. Simulation relaxation factors were presented in Table 20. Two types of meshes are considered: polygonal and structured. The temperature of the steam was 120 °C (Saturation temperature for 197 kPa pressure), and the mass flow was 34 kg/m2 s. The average water temperature in the pool was 67 °C. The bubbling flow regime was observed numerically and experimentally. Figure 7 shows the condensation which occurs near the periphery of the bubble. In the simulation, rapid changes in the pressure were observed. The 2D axisymmetric structured mesh was the best for this type of calculation.
Roman Thiele [75] did the modeling of Direct Contact Condensation of saturated steam to subcooled water using the opensource, OpenFoam framework. The condensation occurs in the suppression pool, which is part of the Nuclear Power Plant. The solver uses the VOF method based on the cavitation model earlier developed by Kunz [76]. The governing equations are based on the volume continuity law. Pressure, velocity, and phase continuity equations were solved separately. Two-phase change models were developed to describe direct contact condensation: one based on the combustion approach and the second using inter-facial heat transfer. The simulation model of the facility was presented in Figure 8. The fluid properties were based on the IF97 database [74]. The steam temperature was 102 °C, and the corresponding saturation pressure was 1.1 bar. The liquid temperature was 22 °C with the same ambient pressure. Various steam mass flow rates were used for the time step and velocity dependence tests: 1.2 g/s, 4.9 g/s, and 12.4 g/s. The interface model better predicts the direct contact condensation phenomenon. It also shows great time-step stability. It should be considered for further development.
Jayachandran et al. [77] investigated numerically bubbling direct contact condensation of gas and liquid oxygen to capture heat and mass transfer effects. Direct contact condensation takes place as a result of mixing between hot gas mixture jet and subcooled liquid oxygen in booster turbopump exit of oxidizer-rich staged combustion cycle. To simplify the complex phenomenon, the gas mixture consists only of pure oxygen. The problem was solved using CFD methods with the ANSYS CFX solver based on the Finite Volume Method (FVM). For multiphase flow modeling, the two-fluid (particle-based) model was applied. The mean bubble diameter was taken from Anglart et al. [78]. RANS approach with separate equations for phases was used in the case of turbulence modeling. The two-equationsk-ε model was used for modeling turbulence on the liquid side, and the dispersed phase zero equation model was used for the vapor side [79]. The first-order upwind scheme was used to solve turbulence and advection schemes and the first-order backward Euler scheme to solve unsteady terms. The time step was 10−4 s. Direct Contact Condensation was modeled using the thermal phase change model, which is a two-resistance model. The Nusselt number for the vapor side was calculated using the zero-equation formula, and the liquid side was based on the Ranz Marshall model [80], which is expressed below:
N u = 2 + 0.6 R e 0.6 P r 0.3
The mass flow rate of steam and temperature were respectively 0.0051 kg/s and −293 °C. The liquid temperature was 208 °C, and the pressure in the tank was 0.1 MPa. Figure 9 presents the heat transfer coefficient for a typical cycle. The observed DCC heat transfer coefficient is approximately ten times higher than in film condensation (for oxygen). The maximum value of the heat transfer coefficient and the strongest pressure oscillations are achieved for the necking stage of bubbling DCC.

5.2. Numerical Analysis of Jet-Type Flow Direct Contact Condensers

The condensing ejector was the object of the numerical investigation conducted by Colarossi et al. [72]. The aim was to develop a CFD model of condensing ejector producing growth in static pressure in refrigeration systems based on a CO2 working medium. Computation Fluid Dynamics supplemented with semiempirical correlations was used to create a numerical model. The open-source OpenFoam library was used and the Eulerian pseudo-fluid approach was applied. The thermodynamic non-equilibrium state of the working fluid was taken into account. Pressure and velocity fields were calculated implicitly using the PISO algorithm (Pressure Implicit with Splitting of Operators). Modified versions of the Homogeneous relaxation model (HRM) were used (originally HRM model has developed for modeling of Flash boiling phenomenon [81]). The HRM model is based on the total derivative which describes the mass fraction of vapour:
D x D t = x ¯ x θ
with:
x —quality (mass fraction of vapour), -,
x ¯ —equiblirum quality, -,
t - time, s,
θ - timescale, s,
In considering the modified HRM model, the timescale is expressed as:
θ = θ o α a ψ b 1 α a
with:
θ o ,   a ,   b —model constants, -,
α —vapour volume fraction, -,
ψ —dimensionless pressure difference, -.
The HRM model coefficient values for low-pressure conditions (below 10 bar) were taken from Downar-Zapolski et al. [82]. RANS equations were supplemented with the k-ε model. The 2D mesh consists of nearly 6100–6750 elements was used. The results show good agreement with the experimental data. Turbulence modeling was marked as the most challenging in the case of condensing ejectors modeling.
The three-dimensional CFD model of condensing ejectors was developed by Bergander et al. [83]. The Condensing Ejector is part of the second compression step in the refrigeration cycle. The article contains theoretical, numerical, and experimental analyses. The scheme of condensing the ejector and pressure distribution is presented in Figure 10. The working medium was R22. The study aims to calculate the exit pressure of the condensing ejector at given inlet boundary conditions. Operating parameters are presented in Table 21. The temperature was taken from R22 tables based on pressure and enthalpy values presented by the authors.The pseudo-fluid approach was applied, considering a mixture of no thermodynamic-equilibrium conditions with a homogeneous relaxation model HRM. The prepared model can be used for flash-boiling and condensation modeling.
Zhang et al. [84] conducted a numerical and experimental study of steam-water ejectors in a trigeneration system for hydrogen production. Direct Contact Condensation takes place in the presence of non-condensable gas (air). The aim was to predict the performance of the ejector using CFD method. CFD solver available in ANSYS 18.2 version was used. For multiphase modeling, Euler-Euler two-fluid model was used. The species transport model was incorporated into the simulation to consider the inert gas’s presence. K-ω SST model with enhanced wall treatment accounted for the turbulent flow phenomenon. All equations were descretized using a high-order scheme. The thermal equilibrium model, a two-resistance model, was applied to model direct contact condensation [85]. The condensation rate per unit volume m ˙ from gas phase α to liquid phase β:
m ˙ = h α A α β T s T α H S β H w
with:
h α —heat transfer coefficient at liquid side, W/(m2 K),
A α β ¯ —interface area per unit volume, 1/m,
T s —saturation temperature, K,
T α —liquid phase temperature, K,
H S β —specific enthalpy of steam, J/kg,
H w —specific enthalpy of liquid-phase at the gas-liquid interface temperature, J/kg,
The heat transfer coefficient h α for the liquid side was calculated based on the Nusselt Number expressed by the Hughmark model [86]:
N u = 2 + 0.6 R e 0.5 P r 0.33 ,   0 R e < 776.06 ,   0 P r < 250
N u = 2 + 0.27 R e 0.62 P r 0.33 ,   776.06 R e ,   0 P r < 250
The 3D mesh consisting of 141,376 hexahedral elements was created using ICEM CFD. The steam mass flowrate was 1.45 g/s. The temperature of the water was 8 °C. At the outlet, a 1 atm pressure boundary condition was assumed. Simulation parameters are summarized in Table 22. Properties of water and steam were assumed based on the IAPWS-IF-1997 [74]. The density of air was calculated using the ideal-gas law. For a small amount of air, the performance of the ejector was improved. The achieved maximum value of condensation rate is 3252–2340 kg/m3 s, depending on the air concentration.
Shah et al. did a numerical and experimental investigation of steam pumps taking into account the direct contact phenomenon [63]. The task of the steam jet pump is to pump water. CFD, a three-dimensional model, was developed. Ansys Fluent 6.3 software was used. The multiphase flow was modeled using the Eulerian two-fluid model. The direct-contact condensation phenomenon was considered using the two-resistance model, developed earlier by [85]. The heat transfer coefficient of the liquid side was calculated based on the Hughmark Nusselt number correlation [86]. The heat transfer coefficient for steam bubbles was calculated according to the Brucker and Sparrow formula [87]. Steam is modeled using ideal gas relation. A realizable k-e model was used. Continuity and volume fraction equations were discretizated using second-order and first-order upwind schemes, respectively, and the remaining equations using Power law scheme. Mesh consists of 69,677 hexahedral and tetrahedral elements. Various steam inlet pressures were considered: 140, 160, 180, 200, 220 kPa. The steam temperature was saturated at mentioned pressures. The different water nozzle pressures were assumed: 93.56, 92.92, 91.87, 90.38, and 89.30 kPa. The water nozzle temperature was 17 °C. The static pressure and temperature charts along the length were prepared. ThThe temperature agreement between simulation results and experimental data can be observed. Considering conditions, it is possible to suck in the water from 2.12 m depth.
A numerical investigation of condensing water jet eductorwas done by Koirala et al. [88]. Mass and heat transfer in direct contact condensation occurs in two-phase flow were computationally studied using the CFD method. The aim of the study was to investigate the performance of the device as a direct contact condenser for various operational conditions. The eductor is part of a thermal desalination system. The motive fluid was water, and the sucked-in fluid was steam. The Eulerian model using ANSYS Fluent software was used to calculate multiphase flow. Fluid turbulence was taken into account using k-ωmixture model. Inlet and outlet pressure boundary conditions were applied and presented in Table 23. For direct contact condensation heat transfer calculations, two resistance models were applied. For mass transfer calculations, the thermal phase change model was used. Pressure based double precision solver was used. Under-relaxation factors of pressure, turbulent kinetic energy, and turbulent dissipation rate were respectively 0.1, 0.2 and 0.4. As a result of the study, the influence of back pressureand motive fluid temperature on the performance of eductor was investigated. Increasing back pressure decreased the flow of entertainment. Increasing the motive fluid temperature causes a lower entertainment ratio because a decrease in the condensation rate can be observed.

5.3. Other Works

CFD simulation of direct contact condenser in the presence of inert gas for Oxy-fuel CO2 Capture process was developed by Takami et al. [89]. The scheme of the device is presented in Figure 11. The aim of the condenser is to separate steam and CO2 through the condensation process. The goal of the investigation was to provide a better understanding of the separation process depending on various boundary conditions and different fluid properties. The process was conducted based on 2D CFD modeling using a COMSOL solver. The simulation parameters at inlets and outlets are presented in Table 24. Constant fluid properties were assumed. The triangular mesh with 27,054 elements was applied. The application of considering condenser allows for condensing 75% of water content from exhaust gases. Laminar flow regimes were observed in the middle of the condenser and zones near the walls.
Numerical modeling of a Direct Contact Condensation of steam in a horizontal pipe was conducted by Thomas Hofne et al. [90]. The study aimed to model the two-phase stratified steam-water flow experiment and compute new heat and mass transport models between water and steam. In this stratified flow pattern, condensation occurs mainly on the interface. The Eulerian two-fluid model was used. Algebraic Interfacial Area Density (AIAD) model was implemented in the Ansys CFX solver. The models allow for simulating momentum exchange depending on the character of the stratified flow. Three various DCC models, which express the correlations for Nusselt number calculation, were used: the Egorov model with the Ranz Marshall correlation, modified Hughes-Duffey with the Ranz Marshall correlation, and the Adapted Coste model. The Nusselt Number for the last one can be expressed as the following:
N u = 2.7 R e t 0.875 P r l 1 / 2
The gas temperature was 100 °C (saturation temperature), and the mass flow rate was 5.3 g/s. The water temperature was 20 °C (initially), and the mass flow rate was 13.8 g/s. No slip boundary conditions were applied, and the simulation was stationary. Mesh consisted of 1.3 million elements.

5.4. Numerical Analysis of DCC—Summary

Table 25 and Table 26 summarize the most important issues connected with the numerical modeling of direct contact condensation. Table 25 is an overview of the computational models (multiphase, turbulence, and condensation). Table 26 shows the simulation conditions in the listed research: mass flow rate, temperature, and pressure of phases. In the last column of Table 26, the main conclusions are presented. Still, the developed direct condensation CFD models need to be carefully calibrated and physically validated by the use of experimental results [91,92].

6. Conclusions

A wide range of applications of Direct Contact Condensers indicates the strong need to investigate these phenomena occurring during the direct contact condensation process. Computational and experimental studies are two more popular ways to explore and investigate heat and mass transfer processes. To date, the developed direct condensation models still need to be carefully calibrated and physically validated by the use of experimental results. On the other side, the experimental test rig’s conceptual design should be first analyzed by using available numerical results. The paper presented a comprehensive review of experimental and numerical investigations on the DirectContact Condensation process.
CFD computational methods are very helpful in the numerical analysis of direct contact condensers because of the phenomenon’s complexity. Multiphase, turbulent flow with phase change requires sophisticated methods to consider all crucial aspects. Commercial software (Ansys, CFX, STAR CCM+) are most often used. Numerical calculations mainly concern cases in nuclear reactor safety systems (suppression pools) and refrigeration and heating systems (condensing ejectors). Various boundary conditions and geometries cause the flow of structure occurring during direct contact to be very diverse (jet, bubbly/droplets flows). Because of the diversity of the flow patterns, there is no universal modeling framework. Pseudofluid multiphase approaches are often used for computational calculations of ejector condensers. The VOF model is used for modeling DCC in suppression pools, where vapor is injected into stationary liquid. The eulerian two-fluid model is suitable for a wide range of applications (ejectors, tanks, pipes, etc.). Two equations RANS models: the k-ε model and the k-ω SST modelare sufficiently accurate for turbulence modelling in case of direct contact condensation. For DCC heat and mass transfer calculation, interface methods are dominating. In this model, heat transport is most often calculated based on Nusselt number correlation, which allows for calculating the heat transfer coefficient. Another type of approach, mainly used in the numerical calculation of condensing ejectors, is HRM model. It is strongly based on empirical correlations but tuned with coefficients and is characterized by robustness and sufficient accuracy. The review of the numerical investigation shows that various types of direct contact condensation modelling approaches are still developing because of the immense diversity and complexity of the phenomenon.
Various measurement methods and techniques applied to direct contact condensation experiments are presented in the studies. In temperature measurement, thermocouples prevailed due to their short thermal time constant and small dimensions. Pressure measuring techniques are based mainly on piezoelectric or piezoresistive transducers. Water flow rate measurement was performed using mainly electromagnetic and turbine flow meters. For steam flow rate measurements, mainly vortex flow meters were used. The developed detailed guidelines for measurement equipment in DCC experimental campaign are complicated and should be designed individually for the selected type of Direct Contact Heat Exchanger and operating conditions.

Author Contributions

Conceptualization, P.M. (Paweł Madejski); methodology, P.M. (Paweł Madejski), P.M. (Piotr Michalak), T.K.; formal analysis, P.M. (Paweł Madejski),P.M. (Piotr Michalak), T.K., investigation, P.M. (Paweł Madejski),T.K., P.M. (Piotr Michalak), N.S., M.K.; resources, P.M. (Piotr Michalak), T.K., P.M. (Paweł Madejski), M.K., N.S.; data curation, P.M. (Paweł Madejski), T.K., P.M. (Piotr Michalak); writing—original draft preparation, T.K.,P.M. (Piotr Michalak), P.M. (Paweł Madejski), N.S.; writing—review and editing, P.M. (Paweł Madejski); T.K., P.M. (Piotr Michalak); visualization, P.M. (Paweł Madejski), P.M. (Piotr Michalak), T.K., N.S.; supervision, P.M. (Paweł Madejski); project administration, P.M. (Paweł Madejski); funding acquisition, P.M. (Paweł Madejski). All authors have read and agreed to the published version of the manuscript.

Funding

Research project supported by the program, “Excellence initiative—research university” for the AGH University of Science and Technology.

Data Availability Statement

Not applicable.

Conflicts of Interest

The authors declare no conflict of interest.

References

  1. Jacobs, H.R. Direct-Contact Condensation. InDirect-Contact Heat Transfer; Kreith, F., Boehm, R.F., Eds.; Springer: Berlin/Heidelberg, Germany, 1988; pp. 223–236. [Google Scholar] [CrossRef]
  2. Chantasiriwan, S. Effects of cooling water flow rate and temperature on the performance of a multiple-effect evaporator. Chem. Eng.Commun. 2015, 202, 622–628. [Google Scholar] [CrossRef]
  3. Zhao, X.; Fu, L.; Sun, T.; Wang, J.Y.; Wang, X.Y. The recovery of waste heat of flue gas from gas boilers. Sci. Technol. Built Environ. 2017, 23, 490–499. [Google Scholar] [CrossRef]
  4. Prananto, L.A.; Juangsa, F.B.; Iqbal, R.M.; Aziz, M.; Soelaiman, T.A.F. Dry steam cycle application for excess steam utilization: Kamojang geothermal power plant case study. Renew. Energy 2018, 117, 157–165. [Google Scholar] [CrossRef]
  5. Sanopoulos, D.; Karabelas, A. H2 Abatement in Geothermal Plants: Evaluation of Process Alternatives. Energy Sources 1997, 19, 63–77. [Google Scholar] [CrossRef]
  6. Barabash, P.; Solomakha, A.; Sereda, V. Experimental investigation of heat and mass transfer characteristics in direct contact exchanger. Int. J. Heat Mass Transf. 2020, 162, 120359. [Google Scholar] [CrossRef]
  7. Ebrahimi, M.; Keshavarz, A.; Jamali, A. Energy and exergy analyses of a micro-steam CCHP cycle for a residential building. Energy Build. 2012, 45, 202–210. [Google Scholar] [CrossRef]
  8. Aidoun, Z.; Ameur, K.; Falsafioon, M.; Badache, M. Current Advances in Ejector Modeling, Experimentation and Applications for Refrigeration and Heat Pumps. Part 1: Single-Phase Ejectors. Inventions 2019, 4, 15. [Google Scholar] [CrossRef] [Green Version]
  9. Aidoun, Z.; Ameur, K.; Falsafioon, M.; Badache, M. Current Advances in Ejector Modeling, Experimentation and Applications for Refrigeration and Heat Pumps. Part 2: Two-Phase Ejectors. Inventions 2019, 4, 16. [Google Scholar] [CrossRef] [Green Version]
  10. Mil’man, O.O.; Anan’ev, P.A. Air-Cooled Condensing Units in Thermal Engineering (Review). Therm. Eng. 2020, 67, 872–891. [Google Scholar] [CrossRef]
  11. Xu, H.; Jiang, S.; Xie, M.X.; Jia, T.; Dai, Y.J. Technical improvements and perspectives on humidification-dehumidification desalination—A review. Desalination 2022, 541, 116029. [Google Scholar] [CrossRef]
  12. Narayan, G.P.; Sharqawy, M.H.; Summers, E.K.; Lienhard, J.H.; Zubair, S.M.; Antar, M.A. The potential of solar-driven humidification-dehumidification desalination for small-scale decentralized water production. Renew. Sustain. Energy Rev. 2010, 14, 1187–1201. [Google Scholar] [CrossRef]
  13. Giwa, A.; Akther, N.; Al Housani, A.; Haris, S.; Hasan, S.W. Recent advances in humidification dehumidification (HDH) desalination processes: Improved designs and productivity. Renew. Sustain. Energy Rev. 2016, 57, 929–944. [Google Scholar] [CrossRef]
  14. Al-Ismaili, A.M.; Jayasuriya, H. Seawater greenhouse in Oman: A sustainable technique for freshwater conservation and production. Renew. Sustain. Energy Rev. 2016, 54, 653–664. [Google Scholar] [CrossRef]
  15. Kartik, S.; Balsora, H.; Sharma, M.; Saptoro, A.; Jain, R.K.; Joshi, J.B.; Sharma, A. Valorization of plastic wastes for production of fuels and value-added chemicals through pyrolysis—A review. Therm. Sci. Eng. Prog. 2022, 32, 101316. [Google Scholar] [CrossRef]
  16. Qureshi, K.M.; Lup, A.N.K.; Khan, S.; Abnisa, F.; Daud, W.M.A.W. A technical review on semi-continuous and continuous pyrolysis process of biomass to bio-oil. J. Anal. Appl. Pyrolysis 2018, 131, 52–75. [Google Scholar] [CrossRef]
  17. Wongwises, S.; Naphon, P. Heat-mass transfer and flow characteristics of two-phase countercurrent annular flow in a vertical pipe. Int. Commun. Heat Mass Transf. 1998, 25, 819–829. [Google Scholar] [CrossRef]
  18. Han, H.; Gabriel, K. Flow physics of upward cocurrent gas-liquid annular flow in a vertical small diameter tube. Microgravity Sci. Technol. 2006, 18, 27–38. [Google Scholar] [CrossRef]
  19. Ami, T.; Umekawa, H.; Ozawa, M. Dryout of counter-current two-phase flow in a vertical tube. Int. J.Multiph. Flow 2014, 67, 54–64. [Google Scholar] [CrossRef]
  20. Abishek, S.; King, A.J.; Narayanaswamy, R. Computational analysis of—Two-phase flow and heat transfer in parallel and counter flow double-pipe evaporators. Int. J. Heat Mass Transf. 2017, 104, 615–626. [Google Scholar] [CrossRef]
  21. Chen, W.B.; Tan, R.B.H. Theoretical analysis of two phase bubble formation in an immiscible Liquid. AIChEJ. 2003, 49, 1964–1971. [Google Scholar] [CrossRef]
  22. Shilyaev, M.I.; Tolstykh, A.V. Simulation of heat and mass exchange in foam apparatus at high moisture content in vapor–gas mixture. Theor. Found. Chem. Eng. 2013, 47, 165–174. [Google Scholar] [CrossRef]
  23. Lapteva, E.A.; Laptev, A.G. Models and calculations of the effectiveness of gas and liquid cooling in foam and film apparatuses. Theor. Found. Chem. Eng. 2016, 50, 430–438. [Google Scholar] [CrossRef]
  24. Inaba, H.; Aoyama, S.; Haruki, N.; Horibe, A.; Nagayoshi, K. Heat and mass transfer characteristics of air bubbles and hot water by direct contact. Heat Mass Transf. 2002, 38, 449–457. [Google Scholar] [CrossRef]
  25. Bezrodny, M.K.; Goliyad, N.N.; Barabash, P.A.; Kostyuk, A.P. Interphase heat-and-mass transfer in a flowing bubbling layer. Therm. Eng. 2012, 59, 479–484. [Google Scholar] [CrossRef]
  26. Pianthong, K.; Seehanam, W.; Behnia, M.; Sriveerakul, T.; Aphornratana, S. Investigation and improvement of ejector refrigeration system using computational fluid dynamics technique. Energy Convers. Manag. 2007, 48, 2556–2564. [Google Scholar] [CrossRef]
  27. Kim, H.D.; Setoguchi, T.; Yu, S.; Raghunathan, S. Navier-Stokes computations of the supersonic ejector-diffuser system with a second throat. J. Therm. Sci. 1999, 8, 79–83. [Google Scholar] [CrossRef]
  28. Kou, J.; Li, Z. Numerical Simulation of New Axial Flow Gas-Liquid Separator. Processes 2021, 10, 64. [Google Scholar] [CrossRef]
  29. Ji, L.; Zhao, Q.; Deng, H.; Zhang, L.; Deng, W. Experimental Study on a New Combined Gas–Liquid Separator. Processes 2022, 10, 1416. [Google Scholar] [CrossRef]
  30. Farooqui, A.; Tomaso, F.D.; Bose, A.; Ferrero, D.; Llorca, J.; Santarelli, M. Techno-economic and exergy analysis of polygeneration plant for power and DME production with the integration of chemical looping CO2/H2O splitting. Energy Convers.Manag. 2019, 186, 200–219. [Google Scholar] [CrossRef]
  31. Wotzka, A.; Jorabchi, M.N.; Wohlrab, S. Separation of H2O/CO2 mixtures by mfi membranes: Experiment and monte carlo study. Membranes 2021, 11, 439. [Google Scholar] [CrossRef]
  32. Zong, X.; Liu, J.-P.; Yang, X.-P.; Yan, J.-J. Experimental study on the direct contact condensation of steam jet in subcooled water flow in a rectangular mix chamber. Int. J. Heat Mass Trans. 2015, 80, 448–457. [Google Scholar] [CrossRef]
  33. Xu, Q.; Guo, L.; Zou, S.; Chen, J.; Zhang, X. Experimental study on direct contact condensation of stable steam jet in water flow in a vertical pipe. Int. J. Heat Mass Transf. 2013, 66, 808–817. [Google Scholar] [CrossRef]
  34. Mahood, H.B.; Sharif, A.O.; Al-Aibi, S.; Hawkins, D.; Thorpe, R. Analytical solution and experimental measurements for temperature distribution prediction of three-phase direct-contact condenser. Energy 2014, 67, 538–547. [Google Scholar] [CrossRef]
  35. Ma, X.; Xiao, X.; Jia, H.; Li, J.; Ji, Y.; Lian, Z.; Guo, Y.U. Experimental research on steam condensation in presence of non-condensable gas under high pressure. Ann. Nucl. Energy 2021, 158, 108282. [Google Scholar] [CrossRef]
  36. Pedemonte, A.A.; Traverso, A.; Massardo, A.F. Experimental analysis of pressurised humidification tower for humid air gas turbine cycles. Part A: Experimental campaign. Appl. Therm. Eng. 2008, 28, 1711–1725. [Google Scholar] [CrossRef]
  37. Pedemonte, A.A.; Traverso, A.; Massardo, A.F. Experimental analysis of pressurised humidification tower for humid air gas turbine cycles. Part B: Correlation of experimental data. Appl. Therm. Eng. 2008, 28, 1623–1629. [Google Scholar] [CrossRef]
  38. Traverso, A. Humidification tower for humid air gas turbine cycles: Experimental analysis. Energy 2010, 35, 894–901. [Google Scholar] [CrossRef]
  39. Caratozzolo, F.; Traverso, A.; Massardo, A.F. Implementation and experimental validation of a modeling tool for humid air turbine saturators. Appl. Therm. Eng. 2011, 31, 3580–3587. [Google Scholar] [CrossRef] [Green Version]
  40. Zare, S.; Jamalkhoo, M.H.; Passandideh-Fard, M. Experimental Study of Direct Contact Condensation of Steam Jet in Water Flow in a Vertical Pipe With Square Cross Section. Int. J. Multiph. Flow 2018, 1, 74–88. [Google Scholar] [CrossRef]
  41. Datta, P.; Chakravarty, A.; Ghosh, K. Experimental investigation on the effect of initial pressure conditions during steam-water direct contact condensation in a horizontal pipe geometry. Int. Commun. Heat Mass Transf. 2021, 121, 105082. [Google Scholar] [CrossRef]
  42. Karapantsios, T.D.; Kostoglou, M.; Karabelas, A.J. Local condensation rates of steam-air mixtures in direct contact with a falling liquid film. Int. J. Heat Mass Transf. 1995, 38, 779–794. [Google Scholar] [CrossRef]
  43. Karapantsios, T.D.; Karabelas, A.J. Direct-contact condensation in the presence of noncondensables over free-falling films with intermittent liquid feed. Int. J. Heat Mass Transf. 1995, 38, 795–805. [Google Scholar] [CrossRef]
  44. Chen, X.; Tian, Z.; Guo, F.; Yu, X.; Huang, Q. Experimental investigation on direct-contact condensation of subatmospheric pressure steam in cocurrent flow packed tower. Energy Sci. Eng. 2022, 10, 2954–2969. [Google Scholar] [CrossRef]
  45. Genić, S.B. Direct-contact condensation heat transfer on downcommerless trays for steam-water system. Int. J. Heat Mass Transf. 2006, 49, 1225–1230. [Google Scholar] [CrossRef]
  46. Genić, S.B.; Jaćimović, B.M.; Vladić, L.A. Heat transfer rate of direct-contact condensation on baffle trays. Int. J. Heat Mass Transf. 2008, 51, 5772–5776. [Google Scholar] [CrossRef]
  47. Chen, X.; Tian, M.; Zhang, G.; Leng, X.; Qiu, Y.; Zhang, J. Visualization study on direct contact condensation characteristics of sonic steam jet in subcooled water flow in a restricted channel. Int. J. Heat Mass Transf. 2019, 145, 118761. [Google Scholar] [CrossRef]
  48. Fei, Y.; Xiao, Q.; Xu, J.; Pan, J.; Wang, S.; Wang, H.; Huang, J. A novel approach for measuring bubbles uniformity and mixing efficiency in a direct contact heat exchange. Energy 2015, 93, 2313–2320. [Google Scholar] [CrossRef]
  49. Xu, J.; Xiao, Q.; Chen, Y.; Fei, Y.; Pan, J.; Wang, H. A modified L2-star discrepancy method for measuring mixing uniformity in a direct contact heat exchanger. Int. J. Heat Mass Transf. 2016, 97, 70–76. [Google Scholar] [CrossRef]
  50. Mahood, H.B.; Thorpe, R.B.; Campbell, A.N.; Sharif, A.O. Experimental measurements and theoretical prediction for the transient characteristic of a two-phase two-component direct contact condenser. Appl. Therm. Eng. 2015, 87, 161–174. [Google Scholar] [CrossRef]
  51. Mahood, H.B.; Campbell, A.N.; Thorpe, R.B.; Sharif, A.O. Heat transfer efficiency and capital cost evaluation of a three-phase direct contact heat exchanger for the utilisation of low-grade energy sources. Energy Convers. Manag. 2015, 106, 101–109. [Google Scholar] [CrossRef] [Green Version]
  52. Mahood, H.B.; Sharif, A.; Thorpe, R.B. Transient volumetric heat transfer coefficient prediction of a three-phase direct contact condenser. Heat Mass Trans. 2015, 52, 165–170. [Google Scholar] [CrossRef]
  53. Mahood, H.B.; Campbell, A.N.; Thorpe, R.B.; Sharif, A.O. Experimental measurements and theoretical prediction for the volumetric heat transfer coefficient of a three-phase direct contact condenser. Int. Commun. Heat Mass Transf. 2015, 66, 180–188. [Google Scholar] [CrossRef] [Green Version]
  54. Mahood, H.B.; Campbell, A.N.; Sharif, A.O.; Thorpe, R.B. Heat transfer measurement in a three-phase direct-contact condenser under flooding conditions. Appl. Therm. Eng. 2016, 95, 106–114. [Google Scholar] [CrossRef]
  55. Mahood, H.B.; Campbell, A.N.; Baqir, A.S.; Sharif, A.O.; Thorpe, R.B. Convective heat transfer measurements in a vapour-liquid-liquid three-phase direct contact heat exchanger. Heat Mass Transf. 2018, 54, 1697–1705. [Google Scholar] [CrossRef]
  56. Mahood, H.B.; Campbell, A.N.; Thorpe, R.B.; Sharif, A.O. Measuring the overall volumetric heat transfer coefficient in a vapor-liquid–liquid three-phase direct contact heat exchanger. Heat Trans. Eng. 2018, 39, 208–216. [Google Scholar] [CrossRef]
  57. Baqir, A.S.; Mahood, H.B.; Sayer, A.H. Temperature distribution measurements and modelling of a liquid-liquid-vapour spray column direct contact heat exchanger. Appl. Therm. Eng. 2018, 139, 542–551. [Google Scholar] [CrossRef]
  58. Baqir, A.S.; Mahood, H.B.; Campbell, A.N.; Griffiths, A.J. Measuring the average volumetric heat transfer coefficient of a liquid–liquid–vapour direct contact heat exchanger. Appl. Therm. Eng. 2016, 103, 47–55. [Google Scholar] [CrossRef]
  59. Baqir, A.S.; Mahood, H.B.; Hameed, M.S.; Campbell, A.N. Heat transfer measurement in a three-phase spray column direct contact heat exchanger for utilisation in energy recovery from low-grade sources. Energy Convers. Manag. 2016, 126, 342–351. [Google Scholar] [CrossRef]
  60. Yang, X.P.; Liu, J.P.; Zong, X.; Chong, D.T.; Yan, J.J. Experimental study on the direct contact condensation of the steam jet in subcooled water flow in a rectangular channel: Flow patterns and flow field. Int. J. Heat Fluid Flow 2015, 56, 172–181. [Google Scholar] [CrossRef]
  61. Pommerenck, J.; Alanazi, Y.; Gzik, T.; Vachkov, R.; Pmmerenck, J.; Hackleman, D.E. Recovery of a multicomponent, single phase aerosol with a difference in vapor pressures entrained in a large air flow. J. Chem. Thermodyn. 2012, 46, 109–115. [Google Scholar] [CrossRef] [Green Version]
  62. Kwidzinski, R. Condensation heat and mass transfer in steam–water injectors. Int. J. Heat MassTransf. 2021, 164, 120582. [Google Scholar] [CrossRef]
  63. Shah, A.; Chughtai, I.R.; Inayat, M.H. Experimental and numerical analysis of steam jet pump. Int. J. Multiph. Flow 2011, 37, 1305–1314. [Google Scholar] [CrossRef]
  64. Shah, A.; Chughtai, I.R.; Inayat, M.H. Experimental study of the characteristics of steam jet pump and effect of mixing section length on direct-contact condensation. Int. J. Heat Mass Trans. 2013, 58, 62–69. [Google Scholar] [CrossRef]
  65. Shah, A.; Chughtai, I.R.; Inayat, M.H. Experimental and numerical investigation of the effect of mixing section length on direct-contact condensation in steam jet pump. Int. J. Heat Mass Trans. 2014, 72, 430–439. [Google Scholar] [CrossRef]
  66. Reddick, C.; Sorin, M.; Sapoundjiev, H.; Aidoun, Z. Effect of a mixture of carbon dioxide and steam on ejector performance: An experimental parametric investigation. Exp. Therm. Fluid Sci. 2018, 92, 353–365. [Google Scholar] [CrossRef]
  67. Michalski, L.; Eckersdorf, K.; Kucharski, J.; McGhee, J. Temperature Measurement, 2nd ed.; John Wiley & Sons Ltd.: Hoboken, NJ, USA, 2001. [Google Scholar]
  68. Lee, T.-W. Thermal and Flow Measurements; CRC Press: Boca Raton, FL, USA; Taylor & Francis Group: Abingdon, UK; LLC: Boca Raton, FL, USA, 2008. [Google Scholar]
  69. Prosperetti, A.; Tryggvason, G. Computational Methods for Multiphase Flow; Cambridge University Press: Cambridge, UK, 2007. [Google Scholar]
  70. Wang, J.; Chen, C.; Cai, Q.; Wang, C. Direct contact condensation of steam jet in subcooled water: A review. Nucl. Eng. Des. 2021, 377, 111142. [Google Scholar] [CrossRef]
  71. Yi, K.; Kim, S.; Park, S. Numerical Study on Direct Contact Condensation Phenomenon of Saturated Steam. In Proceedings of the Transactions of the Korean Nuclear Society Autumn Meeting, Yeosu, Republic of Korea, 25–26 October 2018. [Google Scholar]
  72. Colarossi, A.; Trask, N.; Schmidt, D.P.; Bergander, M.J. Multidimensional modeling of condensing two-phase ejector flow. Int. J. Refrig. 2012, 35, 290–299. [Google Scholar] [CrossRef] [Green Version]
  73. Hughes, T.D. Multiphase CFD Analysis of Direct Contact Condensation Flow Regimes in a Large Water Pool. Master’s Thesis, Texas A&M University, College Station, TX, USA, August 2019. [Google Scholar]
  74. Wagner, W.; Kretzschmar, H.-J. International Steam Tables, Properties of Water and Steam Based on the Industrial Formulation IAPWS-IF97: Tables, Algorithms, Diagrams, and CD-ROM Electronic Steam Tables: All of the Equations of IAPWS-IF97 Including a Complete Set of Supplementary Backward Equations for Fast Calculations of Heat Cycles, Boilers, and Steam Turbines, 2nd ed.; Springer: Berlin/Heidelberg, Germany, 2002. [Google Scholar]
  75. Thiele, R. Modeling of Direct Contact Condensation with OpenFoam. Master’s Thesis, Division of Nuclear Technology, Royal Institute of Technology, Stockholm, Sweden, 2010. [Google Scholar]
  76. Kunz, R.A. Preconditioned NavierStokes method for two-phase flows with application to cavitation prediction. Comput. Fluid 2000, 29, 849–875. [Google Scholar] [CrossRef]
  77. Jayachandran, K.N.; Roy, A.; Ghosh, P. Numerical investigation on unstable direct contact condensation of cryogenic fluids. IOP Conf. Ser. Mater. Sci. Eng. 2017, 171, 012052. [Google Scholar] [CrossRef]
  78. Anglart, H.; Nylund, O.; Kurul, N.; Podowski, M.Z. CFD prediction of flow and phase distribution in fuel assemblies with spacers. Nucl. Eng. Des. 1997, 177, 215–228. [Google Scholar] [CrossRef]
  79. Sato, Y.; Sekoguchi, K. Liquid velocity distribution in two-phase bubble flow. Int. J. Multiph. Flow 1975, 2, 79–95. [Google Scholar] [CrossRef]
  80. Ranz, W.; Marshall, W. Evaporation from Drops. Chem. Eng. Prog. 1952, 48, 141–146. [Google Scholar]
  81. Schmidt, D.P.; Gopalakrishnan, S.; Jasak, H. Multidimensional simulation of thermal non-equilibrium channel flow. Int. J. Multiph. Flow 2010, 36, 284–292. [Google Scholar] [CrossRef]
  82. Downar-Zapolski, P.; Bilicki, Z.; Bolle, L.; Franco, J. The non-equilibrium relaxation model for one-dimensional flashing liquid flow. IJMF 1996, 22, 473–483. [Google Scholar] [CrossRef]
  83. Bergander, M.J.; Schmidt, D.P.; Wojciechowski, J.; Szklarz, M. Condensing Ejector for Second Step Compression in Refrigeration Cycles. In Proceedings of the International Refrigeration and Air Conditioning Conference, West Lafayette, IN, USA, 14–17 July 2008. [Google Scholar]
  84. Zhang, Y.; Qu, X.; Zhang, G.; Leng, X.; Tian, M. Effect of non-condensable gas on the performance of steam-water ejector in a trigeneration system for hydrogen production: An experimental and numerical study. Int. J. Hydrogen Energy 2020, 45, 20266–20281. [Google Scholar] [CrossRef]
  85. Shah, A.; Chughtai, I.R.; Inayat, M.H. Numerical simulation of Direct-contact Condensation from a Supersonic Steam Jet in Subcooled Water. Chin. J. Chem. Eng. 2010, 18, 577–587. [Google Scholar] [CrossRef]
  86. Hughmark, G.A. Mass and heat transfer from a rigid sphere. AICHE J. 1967, 13, 1219–1221. [Google Scholar] [CrossRef]
  87. Brucker, G.G.; Sparrow, E.M. Direct contact condensation of steam bubbles in water at high pressure. Int. J. Heat Mass Transf. 1977, 20, 371–381. [Google Scholar] [CrossRef]
  88. Koirala, R.; Inthavong, K.; Date, A. Numerical study of flow and direct contact condensation of entrained vapor in water jet eductor. Exp. Comput. Multiph. Flow 2022, 4, 291–303. [Google Scholar] [CrossRef]
  89. Takami, K.M.; Mahmoudi, J.; Time, R.W. A simulated H20/CO2Condeser Design for Oxy-fuel CO2 Capture Process. Energy Procedia 2009, 1, 1143–1450. [Google Scholar] [CrossRef]
  90. Hohne, T.; Gasiunas, S.; Seporaitis, M. Numerical Modelling of a Direct Contact Condensation Experiment. In Proceedings of the 2nd World Congress on Momentum, Heat and Mass Transfer (MHMT’17), Paper No. ICMFHT 102. Barcelona, Spain, 6–8 April 2017. [Google Scholar] [CrossRef]
  91. Aya, I.; Nariai, H. Evaluation of heat-transfer coefficient at direct-contact condensation of cold water and steam. Nucl. Eng. Des. 1991, 131, 17–24. [Google Scholar] [CrossRef]
  92. Cocci, R.; Ghione, A.; Sargentini, L.; Damblin, G.; Lucor, D. Model assessment for direct contact condensation induced by a sub-cooled water jet in a circular pipe. Int. J. Heat Mass Transf. 2022, 195, 123162. [Google Scholar] [CrossRef]
Figure 1. Classification of condensers.
Energies 15 09312 g001
Figure 2. Parallel flow type condenser.
Energies 15 09312 g002
Figure 3. Low-level counter-flow jet type condenser.
Energies 15 09312 g003
Figure 4. High-level counter-flow jet type condenser.
Energies 15 09312 g004
Figure 5. Ejector-flow jet type condenser.
Energies 15 09312 g005
Figure 6. Suppression pool geometrical model [72].
Energies 15 09312 g006
Figure 7. Condensation rate contour in case of steam injection [73].
Energies 15 09312 g007
Figure 8. The model used for simulation [75].
Energies 15 09312 g008
Figure 9. Heat transfer coefficient for a typical cycle [77].
Energies 15 09312 g009
Figure 10. Condensing ejector scheme and pressure distribution [83].
Energies 15 09312 g010
Figure 11. Direct contact condenser—scheme [89].
Energies 15 09312 g011
Table 1. Main areas investigated in experimental studies on direct contact condensers.
Author(s)Fluid(s)CapacityOperating ConditionsRemarks
Zong et al. [32]Steam–waterWater mass flux at nozzle outlet 6–18 × 10−3 kg/m2 sPwater = 0.1−0.5 MPa, steam mass flux at nozzle throat 200–600 kg/m2 sThe flow field was filmed. Proposed an empirical correlation for the average heat transfer coefficient calculation
Xu et al. [33]Steam–waterMaximum steam flow rate is 0.03 kg/s.Steam inlet pressure 0.2–0.7 MPa
Steam inlet temperature 110–170 C
Five types of plume shapes were identified visually
Mahood et al. [34]Pentane, liquid-, vapour-waterMass flow rate < 0.38 kg/minTemperatures < 50 °C Mass flow rate ratio has a significant effect on the direct contact condenser output
Ma et al. [35]Pure steam, steam-Nitrogen and steam-ArgonCoolant mass flow rate: 0 to 8.5 t/hPressure in the primary loop 0.2–3.1 MPa
The temperature in the primary loop 123–237 °C
The condensation heat transfer coefficient increased with pressure,
Table 2. The equipment in the test rig of the TPG [36,37,38,39].
DeviceRating ParametersComments
Water pump0.75 kWCentrifugal
Recirculation pump0.33 kWCentrifugal
Water heater7.5 kWElectric
Air compressor capacity10 g/sMaximum
Table 3. Experimental conditions in [36,37,38,39].
QuantityRangeUnit
SystemAir-steam
Column diameter80mm
Column height200–1800 mm
Inlet air flow5, 7.5 and 10 g/s
Inlet water flow5, 7.5 and 10 g/s
Air temperature100, 200 and 300 °C
Column pressure3, 4, 5 bar
Table 4. The test rig equipment in the study of Zare et al. [40].
DeviceRating ParametersComments
Water pump1 kWCentrifugal
Water tank0.5 m3-
Water heater 6 kW-
Steam generator capacity90 kg/hMaximum
Steam generator pressure5 barMaximum
Table 5. The test conditions in [40].
ParameterValue/Unit
Cross section of the test section8 × 8 cm
Height of the test section50 cm
Water flow rate1–7 m3/h
Water temperature20–50 °C
Steam pressure0.05–0.4 MPa
Steam temperature108–146 °C
Steam mass flux200–540 kg/m2 s
Table 6. The test rig equipment in [41].
QuantityValueUnit
Test column diameter66.65mm
Test column length2050mm
Steam generator capacity200kg/h
Maximum steam pressure16bar
Steam tank length1070mm
Steam tank diameter343mm
Table 7. Operating conditions during experiments in the study of Chen et al. [44].
ParameterValue
Tcond (°C)47.5, 50.0, 52.5, 55.0, 60.0
Gin (kg/h)68.6, 74.6, 80.6, 86.6, 92.6
Tin (°C)22–32 (0.5 interval)
Lw (m3/h)2.40, 2.15, 1.90, 1.65
Table 8. The test conditions during experiments during pure steam condensation and steam condensation with Nitrogen/Argon.
ParameterSteamN/ArUnit
Pressure in the primary loop0.21–3.120.21–4.12MPa
Temperature in the primary loop123–23780–267°C
Pressure in the coolant loop2.01–2.460.40–3.2MPa
Temperature difference between the inlet and outlet of the condensing section9.0–12.610–20°C
Average temperature difference between the primary loop and the coolant loop45.1–80.627–83°C
Pressure in the primary loop0.21–3.120.21–4.12MPa
Temperature in the primary loop123–23780–267°C
Table 9. The test conditions during experiments in the study of Genic [45].
QuantityRangeUnit
SystemSteam-water
Column diameterDN 300, 323.9/309.7 mm
Water flow rates at the column inlet3.0–13.6m3/h
Steam flow rate203–1070 kg/h
Inlet water temperature20–30°C
Water outlet temperature39–98°C
Steam at the inlet102–117°C
Working pressure in a column100.1–101.8kPa
Table 10. The additional equipment in the test rig of Chen et al. [47].
DeviceRating ParametersComments
Test section length200 mm
Inner diameter of steam nozzle exit5 mm
Diameter of the restricted channel26 mm
Steam generator heater 90 kWMaximum
Steam generator capacity35 g/sMaximum
Steam generator pressure0.7 MPaMaximum
Table 11. The test conditions during experiments of Chen et al. [47].
ParameterValue/Unit
Steam inlet pressure0.16–0.55 Mpa
Steam inlet temperature115–155 °C
Steam mass fluxkg/(m2 s) 200–800
Water flow ratekg/s 0.13–0.80
Water inlet temperature50–70 °C
Table 12. The test conditions during experiments of Fei [48] and Xu [49].
QuantityRangeUnit
Column diameter480mm
Column height1500mm
Flow rate of HTF0–0.3kg/s
Refrigerant flow rate1−3×10⁴ m3/s
Table 13. The test conditions during experiments of Xu et al. [33].
QuantityRangeUnit
Height of the test sectionmm2000
Inner diameter of the test sectionmm80
Steam inlet pressure pMPa0.2–0.7
Steam inlet temperature Ts°C110–170
Steam mass flux Gekg/m2 s150–500
Water flow rate Qkg/s0.14–6.65
Water temperature Tw°C20–70
Table 14. The experimental conditions in [32,60].
ParameterValueUnit
Inlet steam pressure0.1–0.5MPa
Inlet water pressure0.1–0.5MPa
Steam mass flux at the nozzle throat 200–600kg/m2 s
Water mass flux at the nozzle outlet6–18 × 10−3kg/m2 s
Inlet water temperature [32]293–333K
Inlet water temperature [60]288–333K
Table 15. The experimental parameters of steam, water, and pressure in [63,64,65].
ParameterValueUnit
Steam inlet pressure140–220kPa
Steam inlet temperature382–396K
Water inlet pressure96kPa
Water inlet temperature290K
Ambient pressure96kPa
Table 16. The experimental conditions in [66].
ParameterValueUnit
Primary inlet pressure 350, 450, 550kPa
Secondary in let pressure50, 70, 90kPa
Nozzle throat diameter4.03, 4.23, 4.59, 5.09mm
Table 17. Sensors for temperature measurement are used in experimental rigs with direct-contact condensers.
Type Diameter [mm]AccuracyReference
Pt100n.a.±0.1 °C[47]
Pt100n.a.0.1 °C[46]
Pt100n.a.0.1 °C[69]
Kn.a.±1 K[50,51,52,53,54,55,56]
Kn.a.±1.5 K[39]
Tn.a.0.1 °C[42]
K1.00.5 K[62]
Pt1000.48 mm±0.1 °C[66]
Kn.a.1 °C[64]
Jn.a.0.5%[41]
K3.00.75%[35]
Table 18. Devices used in water flow measurements.
TypeRangeErrorReference
Rotameter1–7 m3/h0.1 m3/h[40]
Electromagnetic0.08–2.78 kg/s0.2%[60]
Electromagnetic0.88–17.66 m3/h0.5%[47]
Electromagnetic0–10 m3/h1.0%[41]
Rotameter-1.25%[56]
Turbine0.04–0.25 m3/h1.0%[47]
Turbine0.6–6 m3/h1.0%[47]
Rotameter1–10 m3/h1.5%[47]
Turbine0.9–13.6 m3/h0.15%[47]
Table 19. Devices used in steam flow measurements.
TypeRangeErrorReference
Orifice -1.0 Pa[64]
Vortex7.5–73.9 g/s1.0%[57]
Vortex30 to 300 m3/h1.5%[59]
Vortex0–40 m3/h0.75%[28]
Vortex0–120 m3/h0.75%[28]
Vortex0–150 kg/h1.0%[59]
Vortex-2.0%[61]
Orifice-1.5%[61]
Table 20. Simulation relaxation factor [71].
Solver FieldRelaxation Factor
Phase coupled velocity0.56
Pressure0.2
Volume Fraction0.1
Energy0.3
Turbulence0.3
Table 21. Operating parameters from Bergander et al. [83].
ParameterVapor Inlet Liquid Inlet
Temperature (°C)4334
Pressure(MPa)1.72.1
Massflow (kg/s)0.0160.077
Table 22. Simulation parameters from Zhang et al. [84].
ParameterGas InletLiquid InletOutlet
Temperature (°C)104.8 (steam)
20 (air)
9-
Pressure(kPa)120100100
Massflow (g/s)1.45 (steam)
0–0.14 g/s (inert gas)
34.7–37.3
Table 23. Assumed boundary conditions from Koirala et al. [88].
ParameterGas Inlet Liquid InletOutlet
Temperature (°C)10025-
Pressure(kPa)45, 60, 80, 1051000100
Table 24. Simulation results and assumptions [89].
ParameterGas InletGas OutletLiquid InletLiquid Outlet
Composition (%)CO2 = 92.30
H20 = 5.76
O2 = 1.94
CO2 = 97.88
H20 = 1.2
O2 = 0.92
H20 = 100H20 = 99.92
CO2 = 0.02
Temperature (°C)5027.82551
Pressure(Pa)100,000101,325150,000101,325
Massflow (kg/s)8.37.89.39.78
Table 25. Overview of direct contact condensation models.
AuthorsDevicePhasesSolution MetodMultiphase ModelTurbulence ModelDCC Model
Yi et al. [71]Suppression poolSteam-water (air)FVMVOFk-ω SST modelEvaporation/condensation
Hughes [73]Suppression poolSteam-waterFVMEulerian two-fluidStandard k-εInterface method
Jayachandran et al. [77]Suppression poolVapour-liquid (O2)FVMtwo-fluid
(particle-based)
k-ε (liquid)
0 eq. (vapour [79])
Thermal phase change model (two-resistance model)
Thiele [75]Suppression poolSteam-waterFVMVOF combustion method, interface method
Colarossi et al. [72]EjectorLiquid-vapor (CO2) Pseudo-fluidStandard k-εmodified HRM [82]
Bergander et al. [83]EjectorLiquid-vapor (R22) Pseudo-fluid modified HRM [82]
Zhang et al. [84]EjectorSteam(air)-waterFVMEulerian two-fluidk-ω SST modeltwo-resistance model [85]
Shah et al. [63]EjectorSteam-waterFVMEulerian two-fluidRealizable k-εtwo-resistance model [85]
Koirala [88]EductorWater-steamFVMEulerian two-fluidk-ωThermal phase change model (two-resistance model)
Takami et al. [89]Direct Contact CondenserWater-Steam (CO2)
Hohne et al. [90]PipesWater-steamFVMEulerian two-fluid Egorov model, Hughes-Duffey, Adapted Coste
Table 26. Overview of direct contact condensation simulation conditions.
AuthorsPhasesPhase 1Phase 2Main Conclusion
m [g/s]P [kPa]T [oC]m [g/s]P [kPa]T °C]
Yi et al. [71]Steam-Water(air)-101.348.9---It is possible to prevent the chugging flow
Hughes [73]Steam-water45.0197.0120.0--67.02D axisymmetric structured mesh was found to be the best for this type of calculation
Jayachandran et al. [77]Vapour-liquid (O2)5.1-−293.0-100−208.0Heat transfer coefficient is approximately 10 times higher than in film condensation
Thiele [75]Steam-water1.2, 4.9; 12.4110.0102.0-110.022.0Interface model better predict DCC phenomenon
Colarossi et al. [72]Liquid-vapor (CO2)------Turbulence modeling is the most challenging task in case of ejector modeling
Bergander et al. [83]Liquid-vapor (R22)77.02100.034.016.01700.043.0Prepared model can be used for flash-boiling and condensation modeling
Zhang et al. [84]Steam(air)-water1.45,
0–0.14 (air)
120.0104.8,
20 (air)
34.7–37.31009.0For the small amount of air, the performance of the ejector is improved
Shah et al. [63]Steam-water-140, 160, 180, 200, 220Satura-ted100–700-17.0Considering ejector allow to suck in the water from 2.12 m depth
Koirala [88]Water-steam-1000.025.045, 60, 80, 105 100.00Increasing a motive fluid temperature causes decreasing in the condensation
Takami et al. [89]Water-Steam (CO2)9.3150.025.08.310050.075% of water content from exhaust gas was condensed
Hohne et al. [90]Water-steam13.8 205.3 100.0All considering models are in good agreement with experimental data
Publisher’s Note: MDPI stays neutral with regard to jurisdictional claims in published maps and institutional affiliations.

