1. Introduction
In the current modern power system, a high-proportion renewable energy grid (HPREG) is inevitable. This HPREG is a power system with abundant integration of renewable energy resources under the presence of energy storage tools (ESTs). However, power generation from wind energy resources is variable, unpredictable and extremely fluctuating. This variable nature of wind energy generation affects the dynamics of the power system manifested in the form of power balance and frequency variation problems. In order to limit the adverse effect of this fluctuating wind energy system, many countries put a limit on the ramp rate level to the generation of energy from wind resources. Note that any power producer participating in the energy market, specifically a power producer from solar and wind energy sources, must satisfy the ramp rate rule described by the grid code of the system owner. If any of the power producers violate this ramp rate rule, a penalty is applied, or the power producer must curtail the extra generation from the wind or solar generation system. The following table,
Table 1, shows some of the ramp rate limits imposed by some of the national grid codes in selected countries [
1,
2,
3,
4,
5].
It can be seen from the table that the ramp rate limits have different meanings or interpretations depending on the national grid codes. For example, some countries express their ramp rate limits as percentage values of wind and solar installed capacity, while others represent their ramp rate limits as simple megawatt restrictions. Additionally, the ramp rate limit timing is also essential. For example, China used this technique to put the ramp rate limit in the national grid code. As a result, the limits are presented as per minute and as per ten-minute values. Therefore, it is the mandate of the power producer to respect and act according to the limits imposed in each national grid code.
In this paper, hybrid optimization-based optimal size determination and application of battery energy storage system (BESS) for ramp rate (RR) improvement of a wind farm is proposed. As presented in the next subtopics, the same technology was proposed, sized and tried for RR control by other researchers. However, most related research, as presented in the literature part, start their analysis of ramp rate improvement and control with an insufficient yet predetermined and preset value of wind energy generation profile. These sorts of data definitely impact the decision in the storage sizing procedure. Therefore, on the one hand, the use of these preset data will result in a smaller storage capacity that might not satisfy the RR demand for most of the points; or on the other hand, the use of preset data might result in a larger storage size that can satisfy RRs but would be too expensive. Moreover, the inclusion of the various cost components providing significance to the cost-effectiveness of power generation companies, such as energy curtailment cost, wind energy RR violation cost and levelized installation cost of storage units, should also be part of these studies. Therefore, in this study, we proposed hybrid optimization models consisting of dynamic smoothing technique (DST) initiated k-means clustering and particle swarm optimization (PSO) based computation algorithms to determine the capacity of the BESS for RR improvement and control of a wind power system. Initially, DST was applied to categorize the historical wind energy generation data for required RR improvement. Secondly, the k-means clustering technique was used to generate representative datasets. Finally, the PSO technique was applied to optimally determine the BESS size for RR control and improvement of the wind farm.
The remaining part of this paper is organized as follows:
Section 2 presents the literature review of the latest research and methods used in RR control of a wind energy system.
Section 3, on the other hand, presents the methodology followed in the paper consisting of the proposed smoothing methodology, the operation dynamics and the optimal capacity determination of the BESS. Similarly,
Section 4 presents the case study data and simulation results and discussion and validation results. Finally, the conclusion, novelty and future work suggestions are presented in
Section 5 of the paper.
2. Literature Review
The techniques for calculating the ramp rate of wind energy generation, as presented in some technical literature [
6], are presented as follows: (i) the difference between the production level of two endpoints of a 1 min interval, (ii) the difference between the minimum and maximum generation values of a considered interval and (iii) the difference between production level of two points at each second interval, as shown in
Figure 1 below.
Similar to the RR calculation methods, there are various techniques by which power producers practice to balance and control the RR in wind energy generation. For example, one of the techniques that use the energy generating operators are supposed to fulfill the national grid code ramp rate limits is by applying fast-acting storage units for RR compensation and control. Using the storage units not only helped the RR control but also had other functions in the power system, such as energy arbitrage, avoiding curtailment of renewable energy generation, frequency regulation, voltage support, and transmission and distribution network outage mitigation [
7,
8,
9]. In standalone systems, such as those working with diesel generator systems and solar energy generation, ESTs have an inevitable advantage towards leveling the solar generation by saving it during high generation time and supplying it during low generation time [
10]. In a similar configuration, BESS is applicable to supply a significant portion of loads during long-hour PV autonomy. In [
11], a microgrid configuration and a worst-case scenario simulation-based sizing of BESS to supply 75% of the loads (designated as essential loads) of a university campus for 3 h is presented. In the paper, the BESS was designed to present a power quality advantage of stabilizing PV fluctuation to the microgrid of the Ball State University Campus.
Accordingly, much research has been conducted on the application of ESTs for RR improvement and control. In [
3], multiple EST options for RR improvement are proposed to take advantage of the wider operating time scales of these multiple ESTs. The application of hybrid ESTs for RR control of a PV system is also proposed in [
4]. In such arrangements, the authors followed a scheduling strategy such that the faster-operating storage system would operate to its capacity limit first, and only then the slowest-operating storage system would operate later. In the capacity determination procedure, the energy capacity of the faster and slower operating units is selected from a range of capacities with discrete time steps. The authors in [
12,
13] proposed a modified version of the maximum power point (MPP) algorithm such that the PV plant will not operate at the point of MPP during fluctuation so as to limit the RR. ESTs such as zinc bromide flow batteries and ultra-capacitors connected directly to the wind turbines by power electronic converters are proposed to control the RR in the wind farm of an installed capacity of 48.3 MW [
14]. The researchers in [
15] proposed a GA-based optimization technique to determine the capacity of the energy storage unit to reduce the wind energy variability so as to minimize the overall grid power variability as the objective function. The authors in [
1] proposed the worst-fluctuation technique to determine the capacity of the storage unit to eliminate the RR problem. In others, researchers proposed conventional techniques consisting of moving average smoothing techniques, both simple moving average and exponential moving average, to smooth out the wind/PV power signals [
16]. Even though these techniques can reduce the RR to some degree, they introduce the memory effect problem, which allows the storage unit to work at unnecessary points in time. The drawback of this technique is that the smoothed signal may have a point at which the resulted data are more fluctuating than the original data and requires an unwanted operation for the storage unit. The unwanted fluctuation resulted from the memory effect of the moving average smoothing techniques. The picture below,
Figure 2, shows a pictorial representation of the disadvantages of SMA technique, as presented by [
17] for a realistic PV output from Oahu Island, Hawaii, on the 18th of March 2010, and its 20 min moving average value [
18]. As depicted in the picture, there are points at which the original signal was initially stable in its power generation. In contrast, the moving averaged signal had fluctuations that could force the ESTs to operate unnecessarily. Broken red-circled markers in
Figure 2 are used to show these points.
In addition, these techniques have the disadvantage of over-smoothing RRs, which eventually increases the size of the storage units and ultimately results in expensive storage units [
19]. Other techniques, comprising of filters, both first-order low pass filter (1-LPF) and second-order low pass filter (2-LPF), power electronic converters, generation curtailment, dumping loads and gas turbines are some of the mechanisms and devices also used in the RR control [
14,
15,
19,
20]. Likewise, the Gaussian-based smoothing technique is used in smoothing wind energy fluctuation. The Gaussian function, also known as the Gaussian filter-based smoothing technique, has been extensively applied in computer vision and image processing [
16,
21].
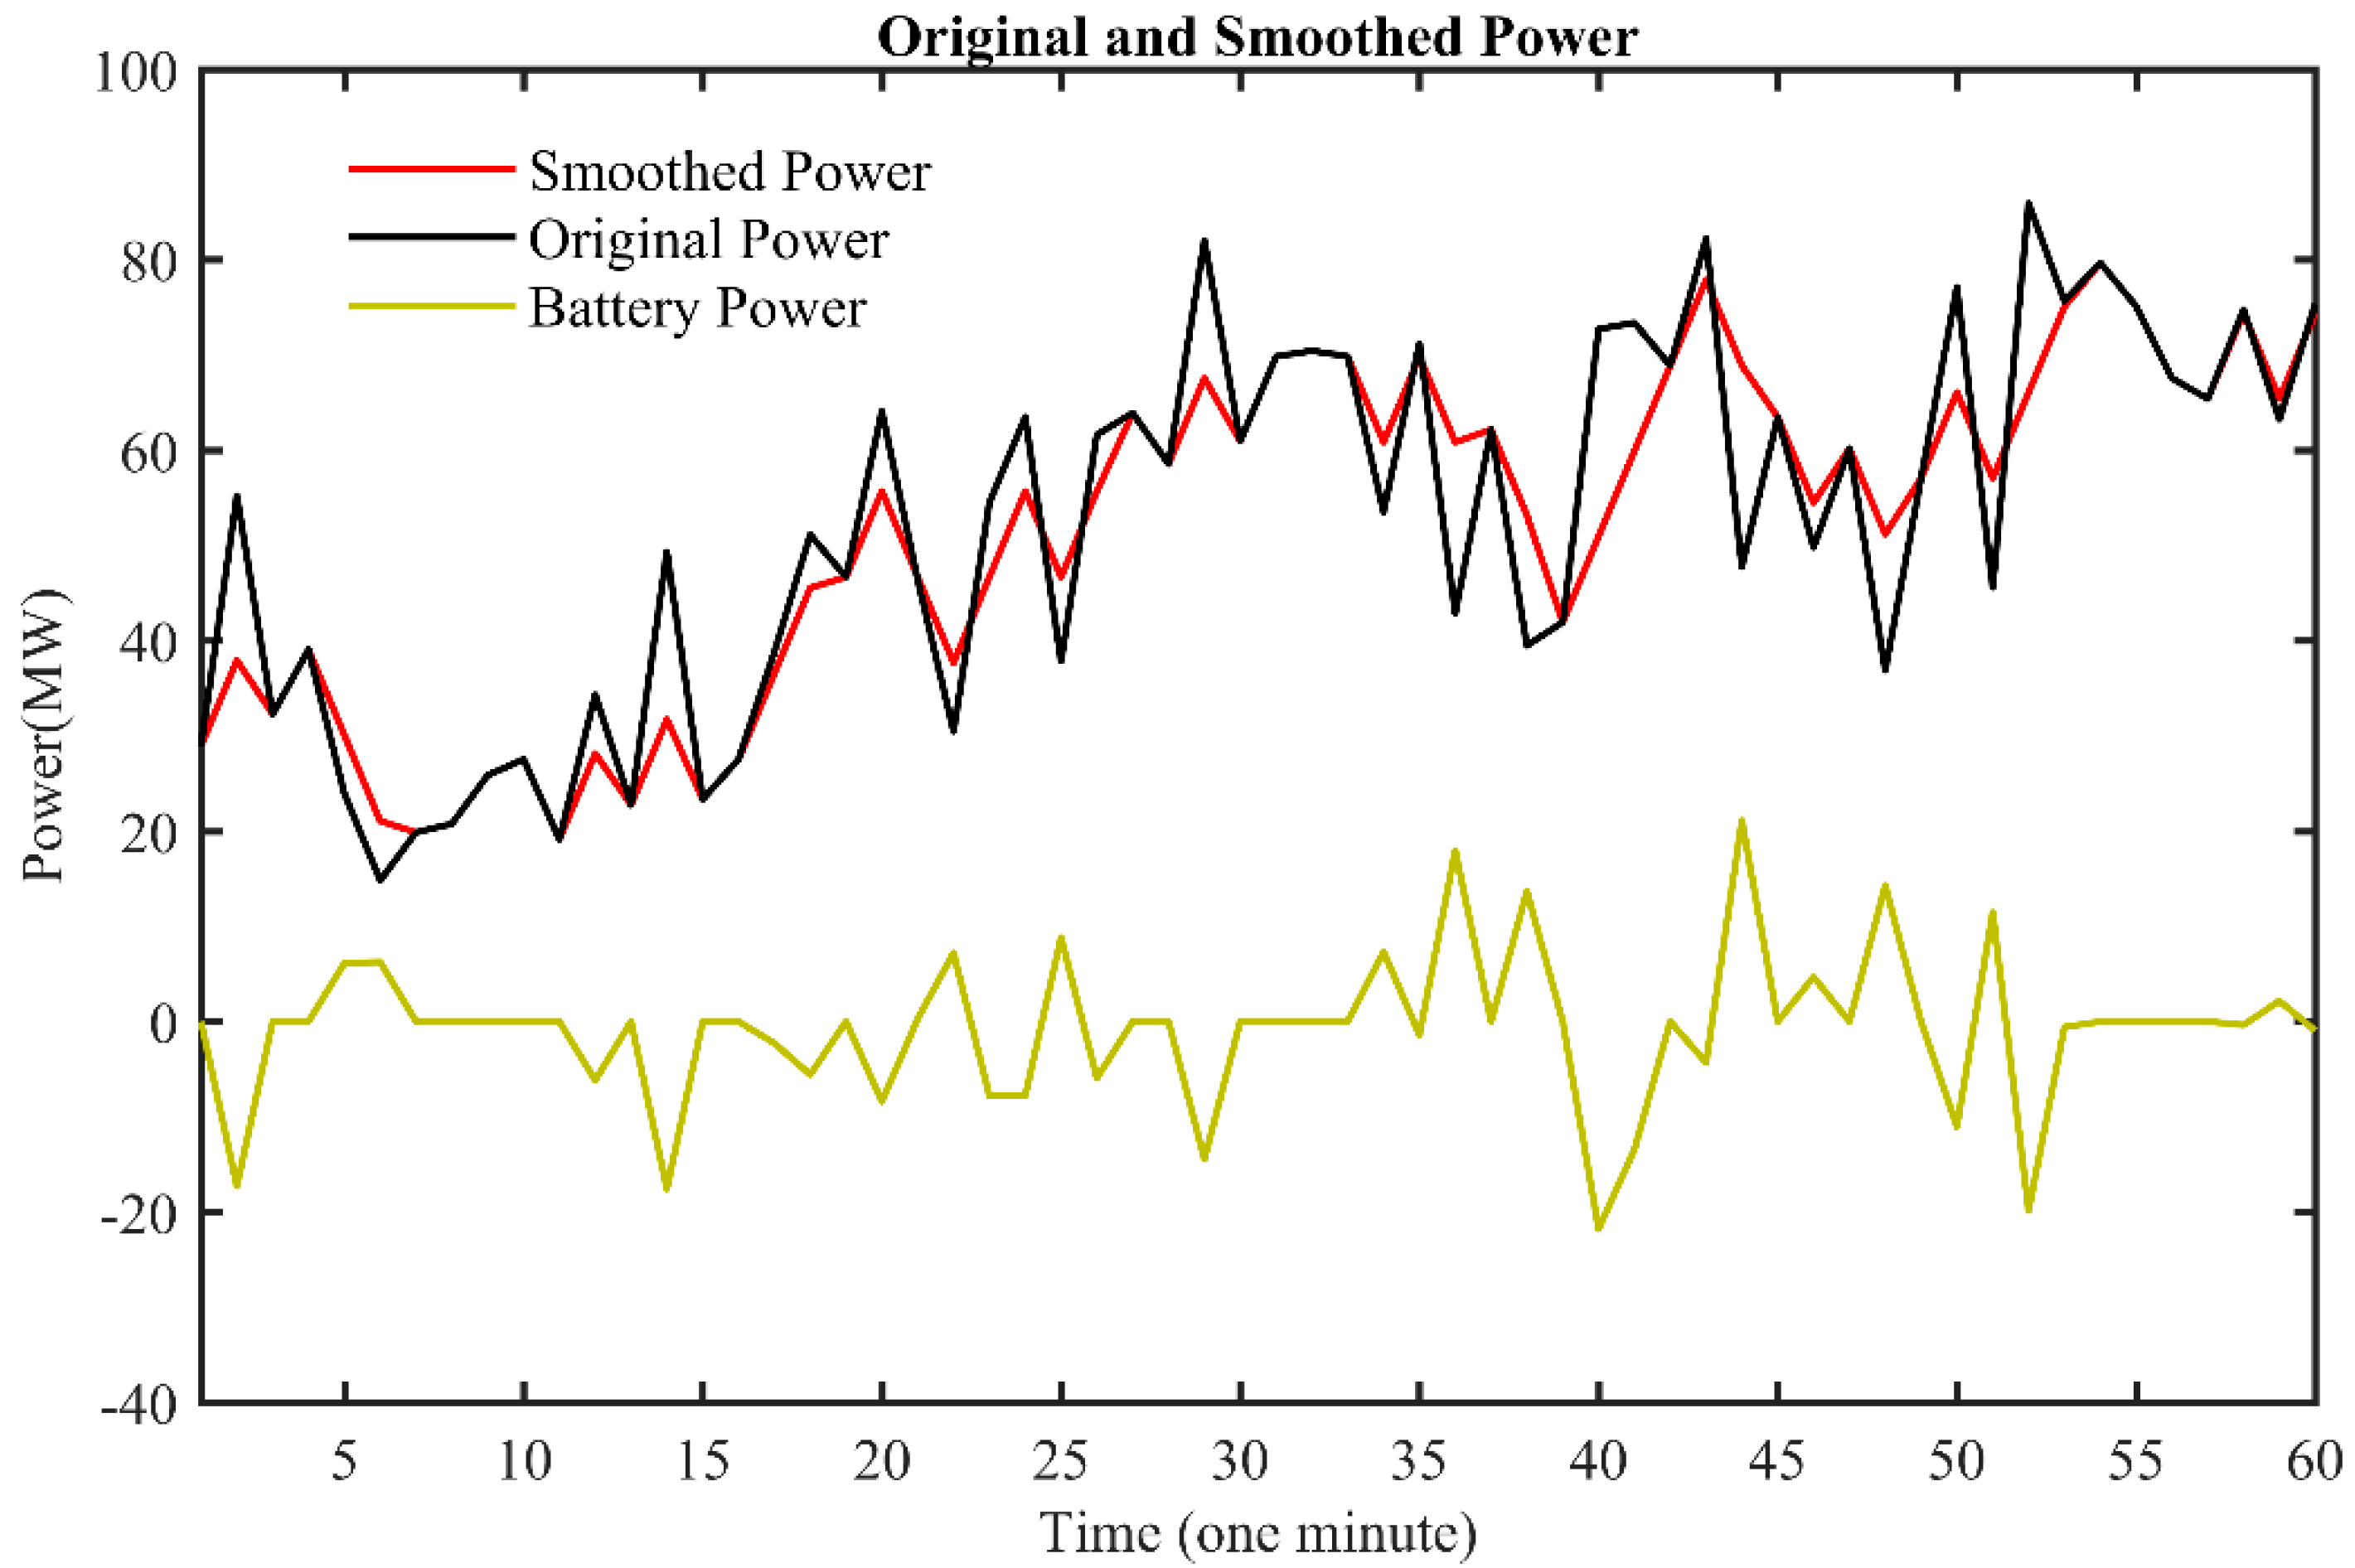
The basic principle of these techniques is to smooth the high fluctuations in the wind-generated power, which arise due to fluctuations in wind speed. These smoothing methods generate a battery power reference that opposes the wind power variations, as shown in
Figure 3. The result is an injected smooth grid power within the acceptable RR limits.
In [
22,
23], a comparative analysis and in-depth review of numerous PV power generation fluctuation smoothing methods and RR control strategies are presented. According to these research outputs, among all the techniques to counterbalance renewable energy variability, RR control based on ESTs is indicated as the best choice. This advantage of ESTs, particularly BESS, is supported by the wide range of capabilities they had, ranging from a few kilowatts to larger values of hundreds of kilowatts [
9].
Energy storage capacity determination for RR improvement of a PV system using rest recover and dynamic rest as controlling strategies is proposed by [
24]. The effect of time uncertainties and false forecasted signals for the increased operating cost of diesel generators and a comparative study of BESS for RR improvement of the PV plant is proposed in [
20]. Similar studies for determining the capacity of ESTs for RR improvement of a PV power plant are studied by [
25,
26]. The effect of PV panel arrangement for the system RR under predetermined storage capacity is studied in [
27] to investigate the parallel as well as the cascaded PV panel arrangement effect on the entire ramping characteristics of the PV plant. The worst fluctuation model of a PV plant is proposed in [
2] for RR improvement under the presence of storage systems. However, the drawback of these models is that the result is highly costly while providing the maximum storage capacity needed to limit RRs. In [
28], the authors tried to investigate the effect of large size of PV installations in countering the RR in one section of the array by the remaining parts of the array. A technical report in [
29] presented the study of wind energy fluctuation behavior for the Electric Reliability Council of Texas. In this technical report, the influence of the relative direction of change in generation and load to the power system is presented.
3. Methodology
In this part of the paper, the previously proposed smoothing technique, the DST technique, is explained, derived and presented. Similarly, the operation dynamics of the BESS and its optimal capacity determination will be discussed in detail.
3.1. The Dynamic Smoothing Technique
Contrary to some of the previous smoothing techniques, in this smoothing technique, the smoothing constant is continuously changing, dynamically changing constant and, hence, the name dynamic smoothing technique. Additionally, unlike the moving average smoothing techniques, in DST, the smoothing of the wind signal starts as soon as the second point signal is known, whereas, in some of the former methods, either n or n + 1 number of data points need to be recorded for the smoothed signal to be available. Therefore, in the DST algorithm, there is no delay in the operation of the EST for smoothing the wind energy signal, resulting in a good EST operating strategy.
In the DST algorithm, during the high production time, the energy produced from the wind energy system will either be injected into the power grid or directed to the battery or, during low production time, the previously battery-charged energy together with the latest wind energy production will be directed to the grid. In both instances, the capacity determination of the storage unit should be so that the overall injected power to the power system is well smoothed. The determination of the dynamic smoothing constant, the smoothed signal, and the EST reference signal is presented as follows.
In DST smoothing algorithm, the smoothed signal at time
is a function of the unsmoothed signal
, the previously smoothed signal
and the continuously changing smoothing constant
, as in Equation (1)
After incorporating a multiplying factor, also called the dynamically changing smoothing constant, between the original (unsmoothed) power and the previous time smoothed power signals, the formulation of the smoothed power at time
is presented as in Equation (2)
The determination of the value of the multiplying factor could follow after determining the RRs for the original signal and the smoothed signal. In this study, the RR for the original signal
at any instant of time
is defined as the time rate of change in two adjacent power measurements as in Equation (3)
where
is the time resolution between the two consecutive measurements. In this paper, the value of
is 60 s. Likewise, the RR for the smoothed signal,
is defined as the time rate of change in the unsmoothed signal and the previously smoothed signal, as in Equation (4)
DST dictates both the RR definitions given in Equations (3) and (4) must be satisfied. Suppose one of the two RR formulations violates the RR limit. In that case, a limit is assigned to that particular instance, and the storage system operates in charging or discharging modes based on the direction of RR. Therefore, the overall RR rule
is defined as in Equation (5)
After obtaining the newly defined RR, the smoothed power signal is rewritten, as in Equation (6)
By equating Equations (2) and (6), the value of the dynamic smoothing variable
is solved, as in Equation (7)
Once the dynamic smoothing variable is determined, a switching signal is generated to switch the storage unit ON or OFF. The expression for the switching function is given as in Equation (8):
After determining the switching signal, the smoothed power signal is represented, as in Equation (9). The expression in Equation (9) is called the DST function because it is based on a dynamically changing smoothing constant.
Once the smoothed wind energy signal is determined, the BESS reference signal is generated as in Equation (10).
where
is the power injected into or withdrawn from the storage unit.
When assuming a positive reference to the battery power, power absorbed by the battery will be considered positive, and the battery-supplied power will be considered negative. The DST algorithm demands the maximum possible EST to resolve the RR problem.
Figure 4 shows a sample DST-based battery power signal with the original wind data signal and the smoothed signal. According to this figure, the battery power required for worst-case scenario analysis was found to be 21.78 MW, as could be seen from the plot in orange color.
3.2. Operation Dynamics of the BESS
In this section, the possible operating dynamics of the storage unit will be discussed in reference to the wind energy production dynamics from one time slot to the other time slot. The BESS operation dynamics are determined according to the wind energy operation dynamics and also based on the storage unit status at different points in time and its power and energy capacity. For example, if the wind energy violates the upper RR limit, the storage unit might absorb some or all of the wind energy generation. However, based on the actual operating status of the storage unit, the absorbed wind energy amount could be variable. Similarly, the wind energy might blow such that it will violate the ramp down limit, or it may be within the ramp up and ramp down limits. Likewise, in these two cases, the BESS may absorb some energy, generate what it has stored or do nothing since the operation dynamics are also dictated by the BESS’s previous status and overall capacity. In situations where the BESS is not acting, the energy curtailment and penalty for violating the RR rule will be applied.
Suppose the wind energy
Pw(
t + 1) at time
t + 1 is such that it is beyond the ramp up limit specified in the grid code as in Equation (11)
where
Nt is the nominal power injected into the grid at time
t and
Ru is the ramp up limit specified in the grid code.
In this case, according to the storage operation
at time
, there are three possible operating cases for the BESS, which are presented as in Equations (12a)–(12c) (the three equations are dependent on one another) and shown in
Figure 5 below with circled numerals.
Mathematically, the operation dynamics of the BESS involving its energy and power components are given as in Equations (13)–(16)
E(
t) is the energy level available at time
t,
Pc(
t) is the charging power at time
t and
Pd(
t) is the discharging power at time
t. With a proper sign,
Pc(
t) and
Pd(
t) could be defined by a single variable
Pb(
t), battery power.
Uc and
Ud are state variables for charging and discharging assuming the value of {0, 1};
ηc and
ηd are charging and discharging efficiency of the storage device;
PcR,
PdR and
ER are rated charging power, discharging power and energy storage capacity, respectively; ∆
t is the time resolution between two measurement intervals. The formula in Equation (14) dictates that the storage unit could not charge and discharge at the same time.
3.3. Optimal BESS Capacity Determination
In the first stage of optimization involving the DST algorithm, the amount of BESS power and energy capacity required is broad and needs adjustment. Two scenarios could be used for this: one is the worst-case scenario. In such cases, the energy storage capacity will take the maximum value. The problem with this procedure is that the resulting storage size is too expensive. The second scenario is to apply the best case with minimal storage capacity. Again, the problem with this procedure is that the objective of smoothing the wind energy signal will not be satisfied. Therefore, the optimal storage sizing must find the appropriate size of energy storage so that the power producer is at the best economic point during the operation and the investment period.
Therefore, optimal capacity determination of the storage unit in the second stage is based on cost-benefit analysis through the PSO algorithm; PSO formulation can be found in [
30]. The objective function is such as to minimize the overall daily cost constituting the cost of violating the RR limit, energy curtailment cost and energy storage units investment cost as presented in Equation (17).
where
is the total cost representing the objective function,
is the EST installation (investment) unit cost,
is wind energy curtailment cost of curtailing a unit amount of power,
is the RR violation penalty unit cost,
is the time index and
is the entire duration of the optimization horizon. The above individual cost components of the objective function depending on the power rating and corresponding unit price, as in Equation (18).
where
is the unit cost of the storage unit,
is the unit cost of wind energy curtailment and
is the unit cost of RR violation. Likewise,
is the power capacity of the storage unit,
is the amount of the curtailed wind power and
is the magnitude of RR violation power. The power balance function, the RR function and penalty values are defined in Equations (19)–(21), respectively.
where
is the power injected to the grid at time
, it represents the power balance for the wind energy to the grid,
is the wind energy generation at time
,
is the storage (battery) power generated or absorbed by the battery at time
and
is the wind energy curtailed at time
.
where
is the RR limit as defined in the grid code.
5. Conclusions
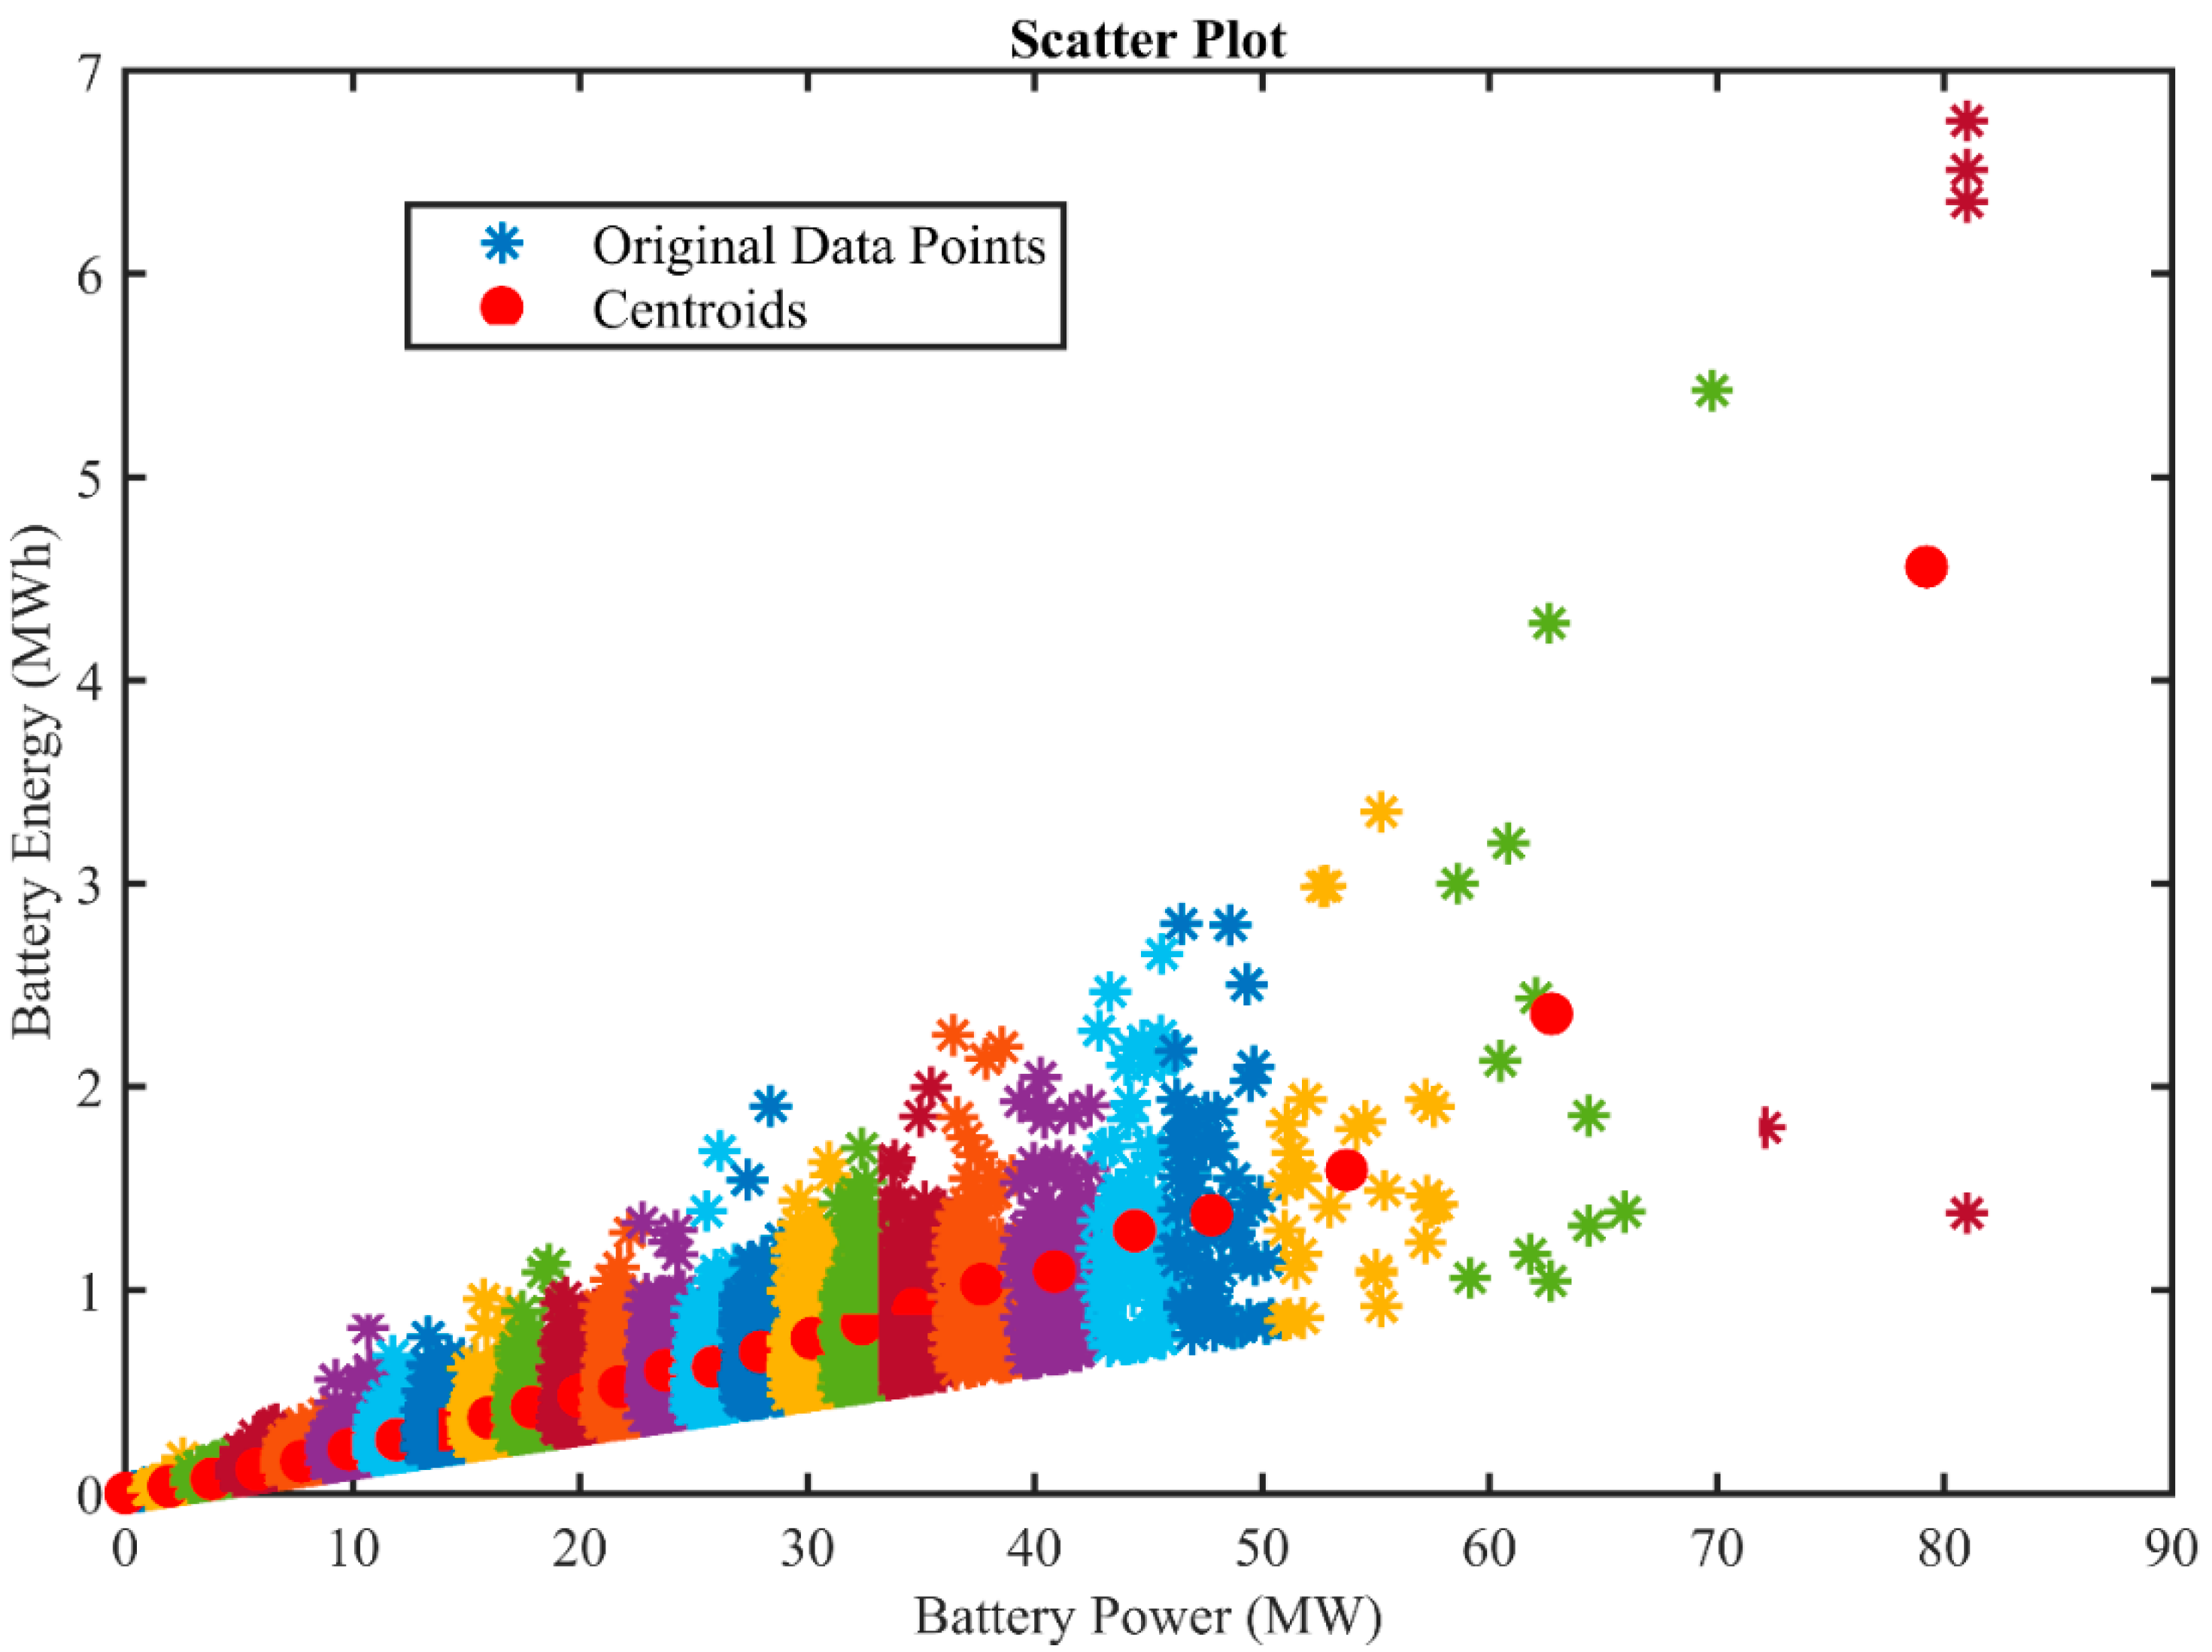
This paper presented the proposed hybrid optimization models constituting DST and PSO techniques to optimally size a BESS for two tasks of RR improvement and frequency regulation for an HPREG. The DST is used to characterize the long-recorded wind energy generation data and determine a sample BESS capacity for the individual data point. K-means clustering is used for three particular cluster sizes such that the whole data points are grouped to the number of cluster points. Later, representative datasets were generated. Finally, the PSO algorithm is used to determine the overall BESS capacity for the whole dataset assisted by the expectation equation. The resulting BESS capacity for RR improvement of the wind farm was verified for selected data points from the whole dataset. A RR track record for the selected data points was measured before and after the use of the optimal BESS. Similarly, the BESS VI significance was tested for their frequency regulation function. A multi-machine power system integrated into these BESS was simulated so that its frequency response in both the transient and steady-state time frames was recorded before and after the use of the BESS. Therefore, the conclusions from this work can be summarized as follows:
The work proved the significance of BESS for their advantage of RR improvement and control of an HPREG-based power system as well as their significance for frequency regulation (performance improvement) of a power system.
Similarly, the work showed a novel way of a hybrid optimization model of applying a huge dataset for planning and component sizing during data uncertainty.
The optimal result of the BESS showed a significant improvement in the RR level of the wind energy data injected into the grid. In the two verification stages, a ramp rate violation improvement of 91.21% and 91.26% of the orginal value is achieved, respectively. The RR capacity of the BESS from the optimal result satisfies the RR requirement of 99% of the data points, a very significant figure.
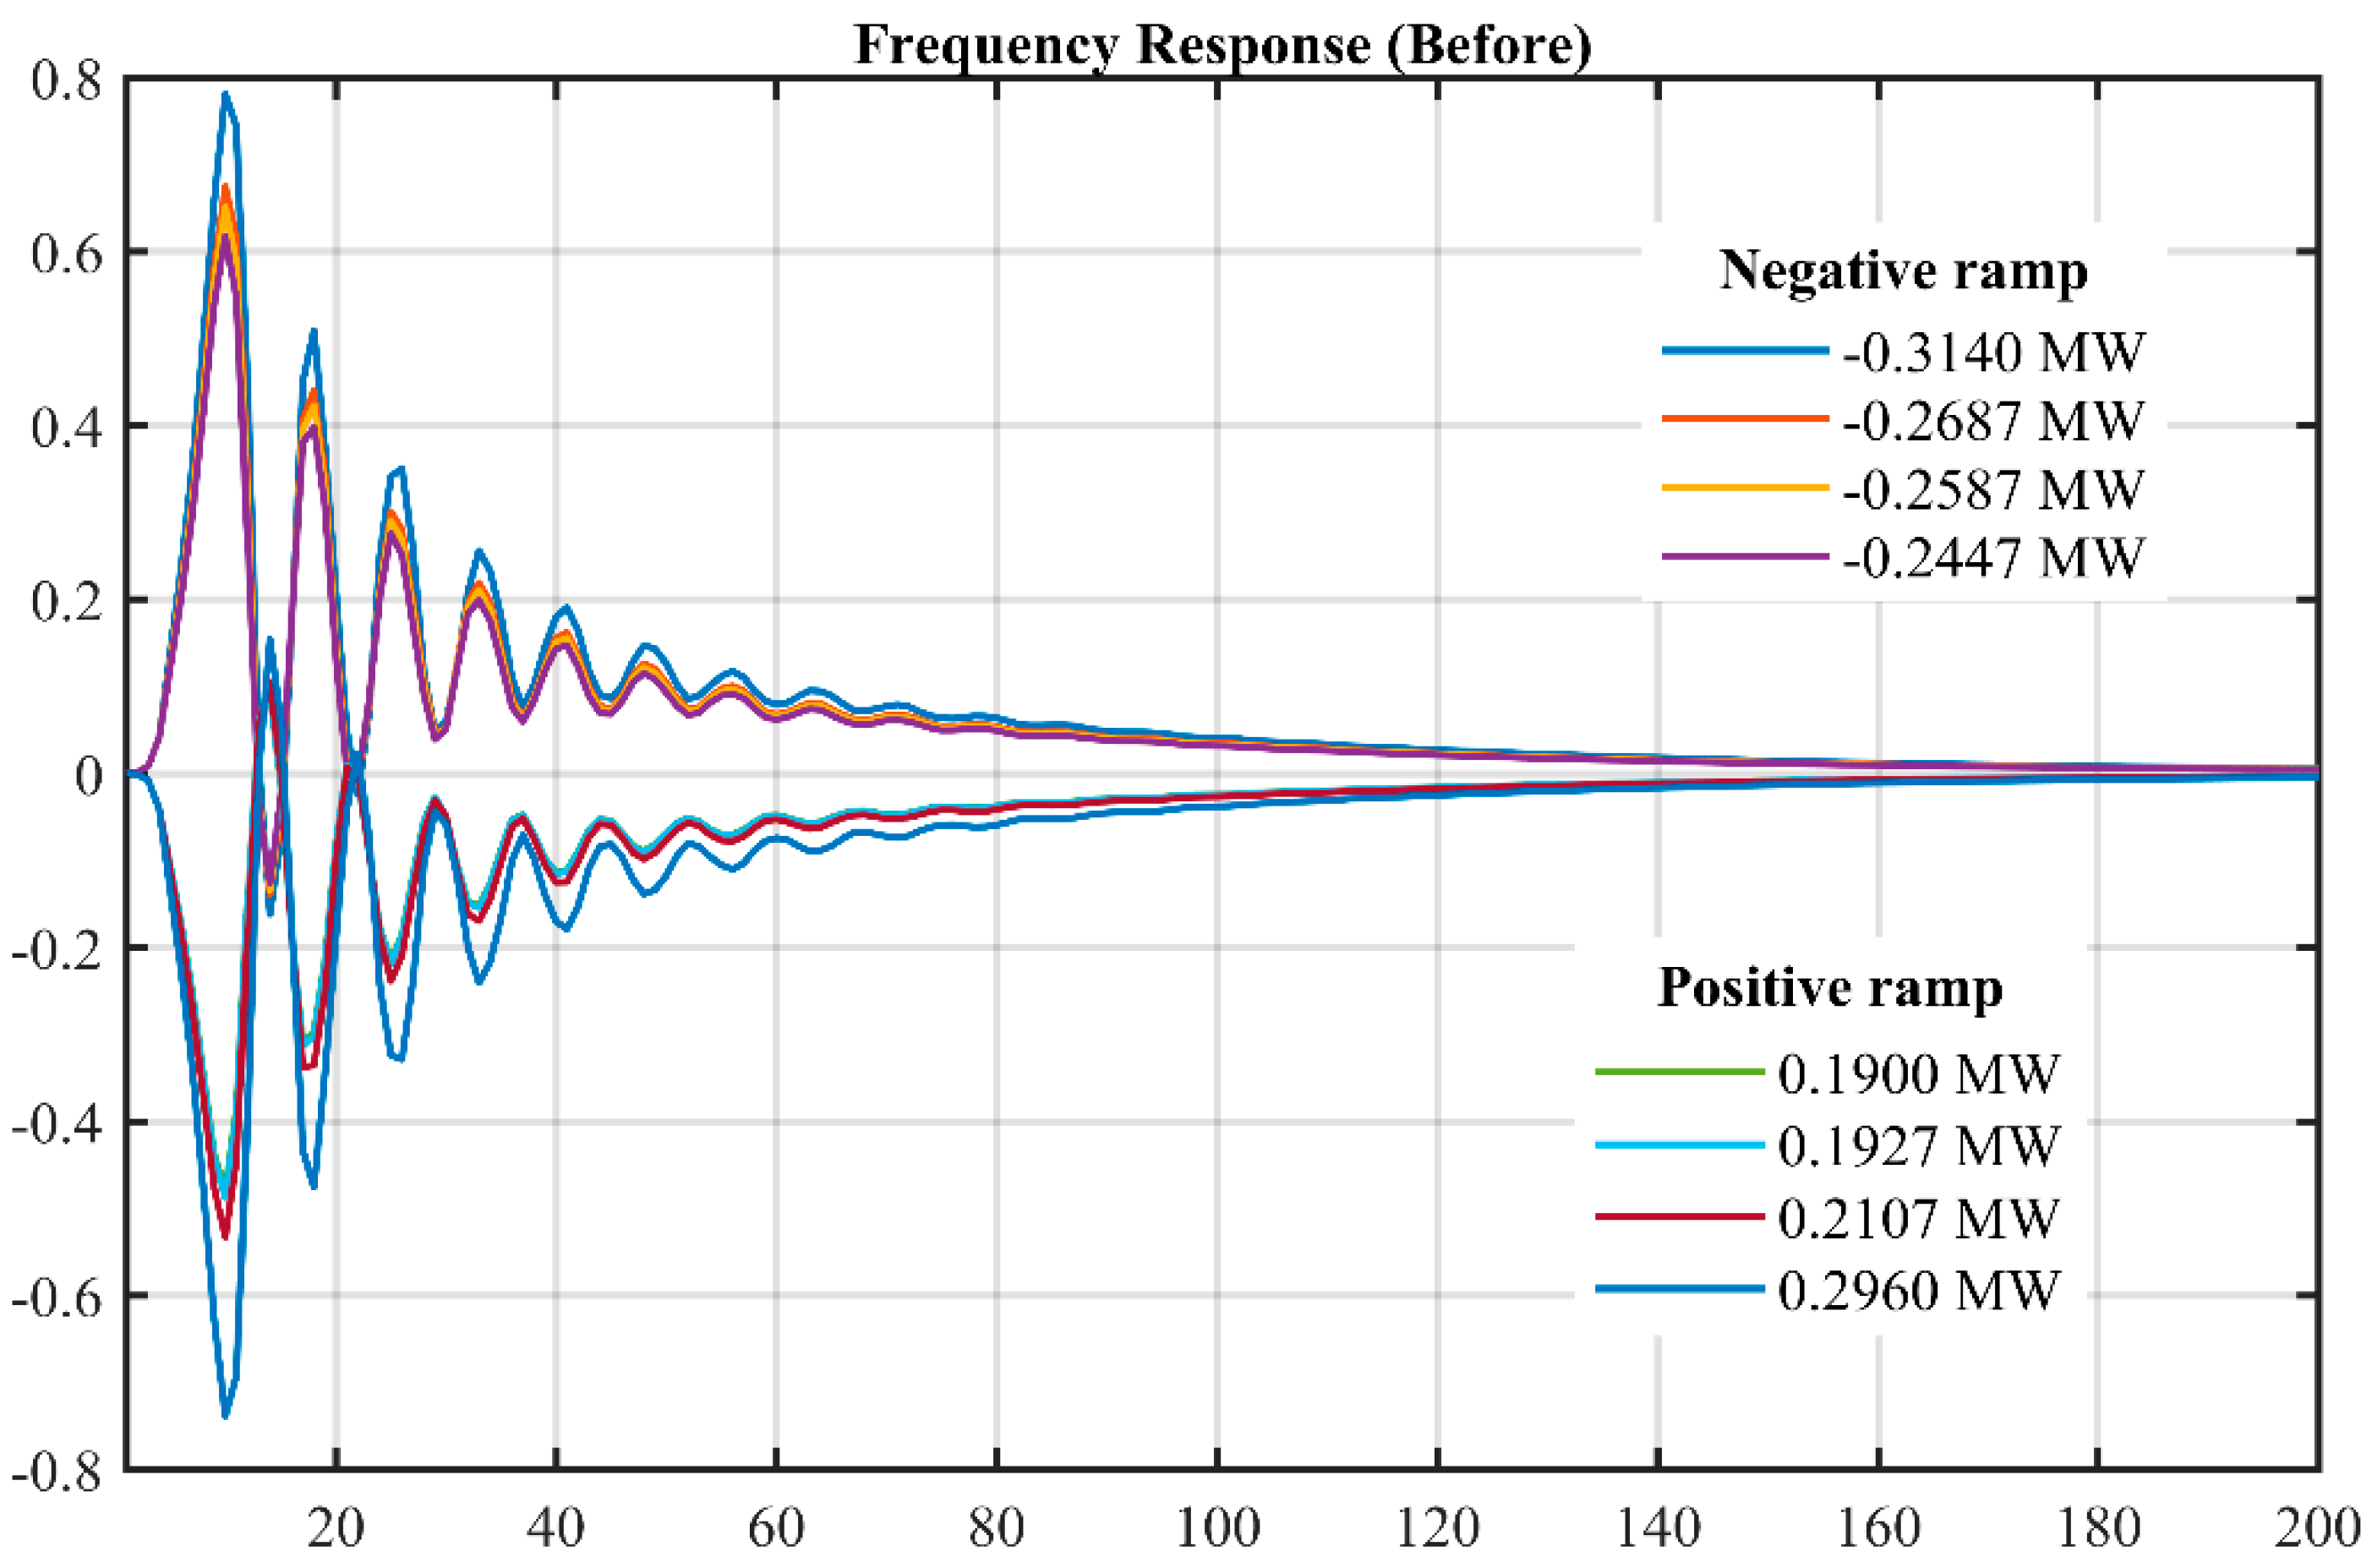
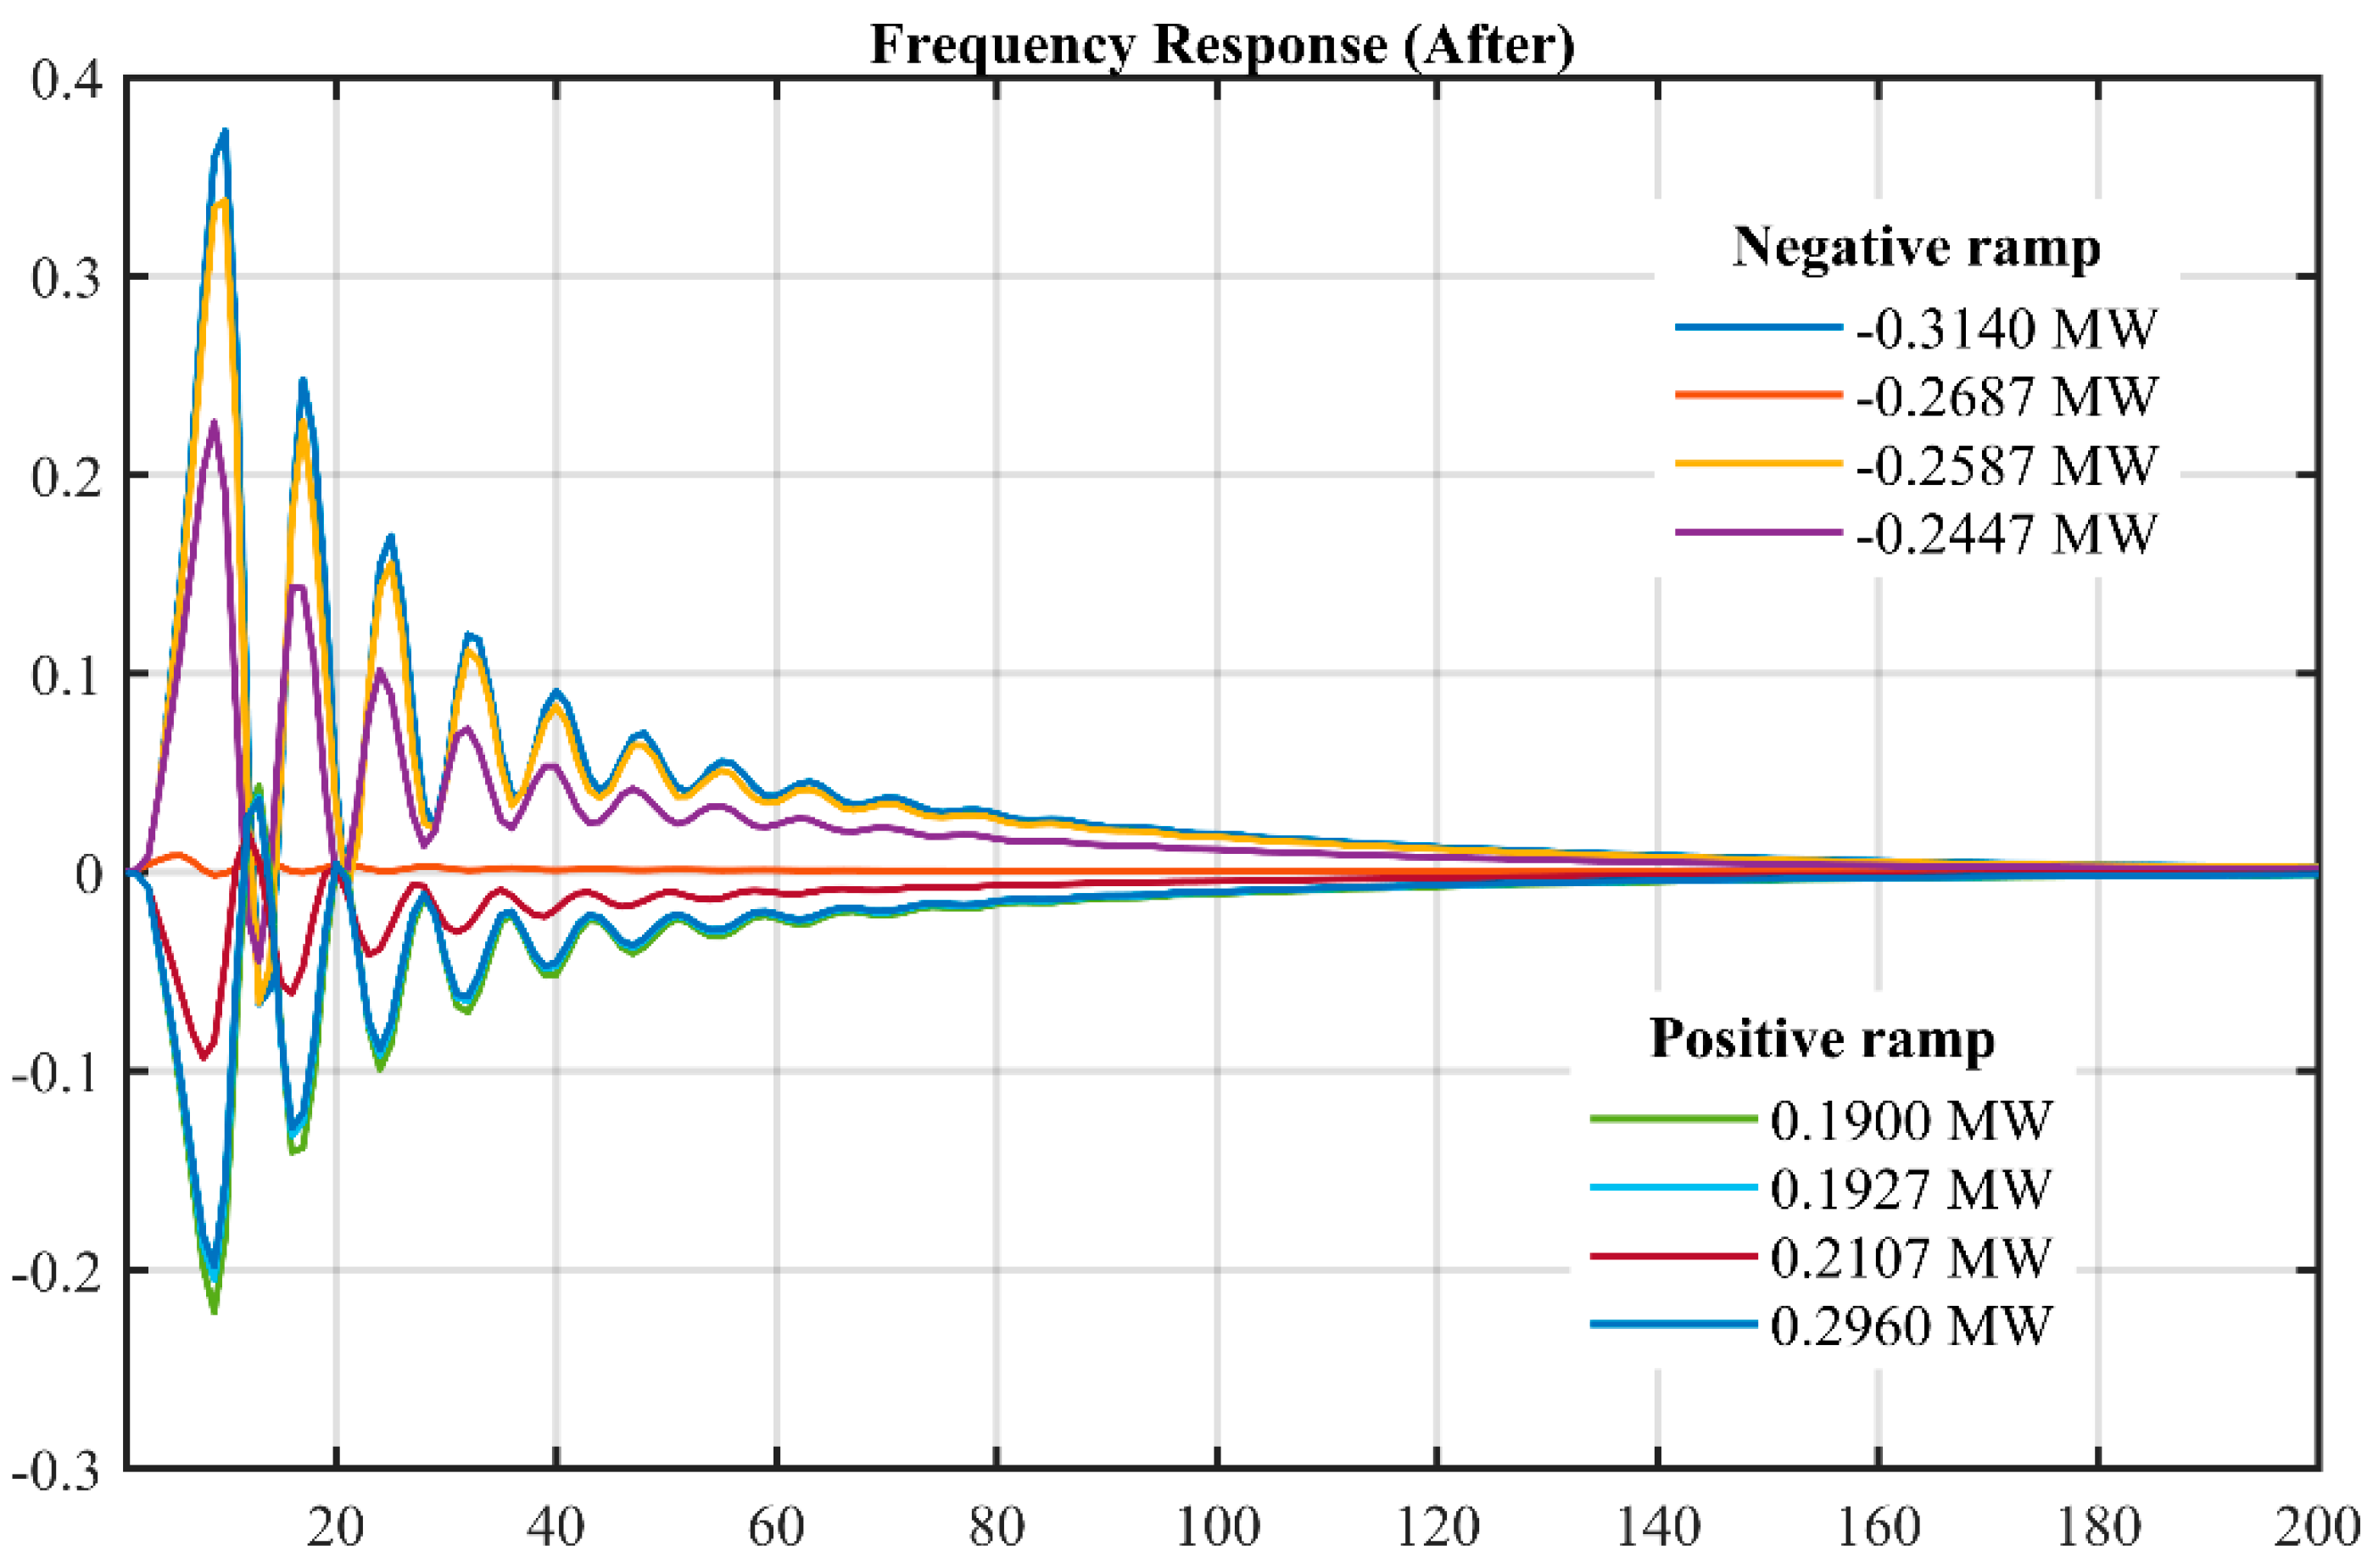
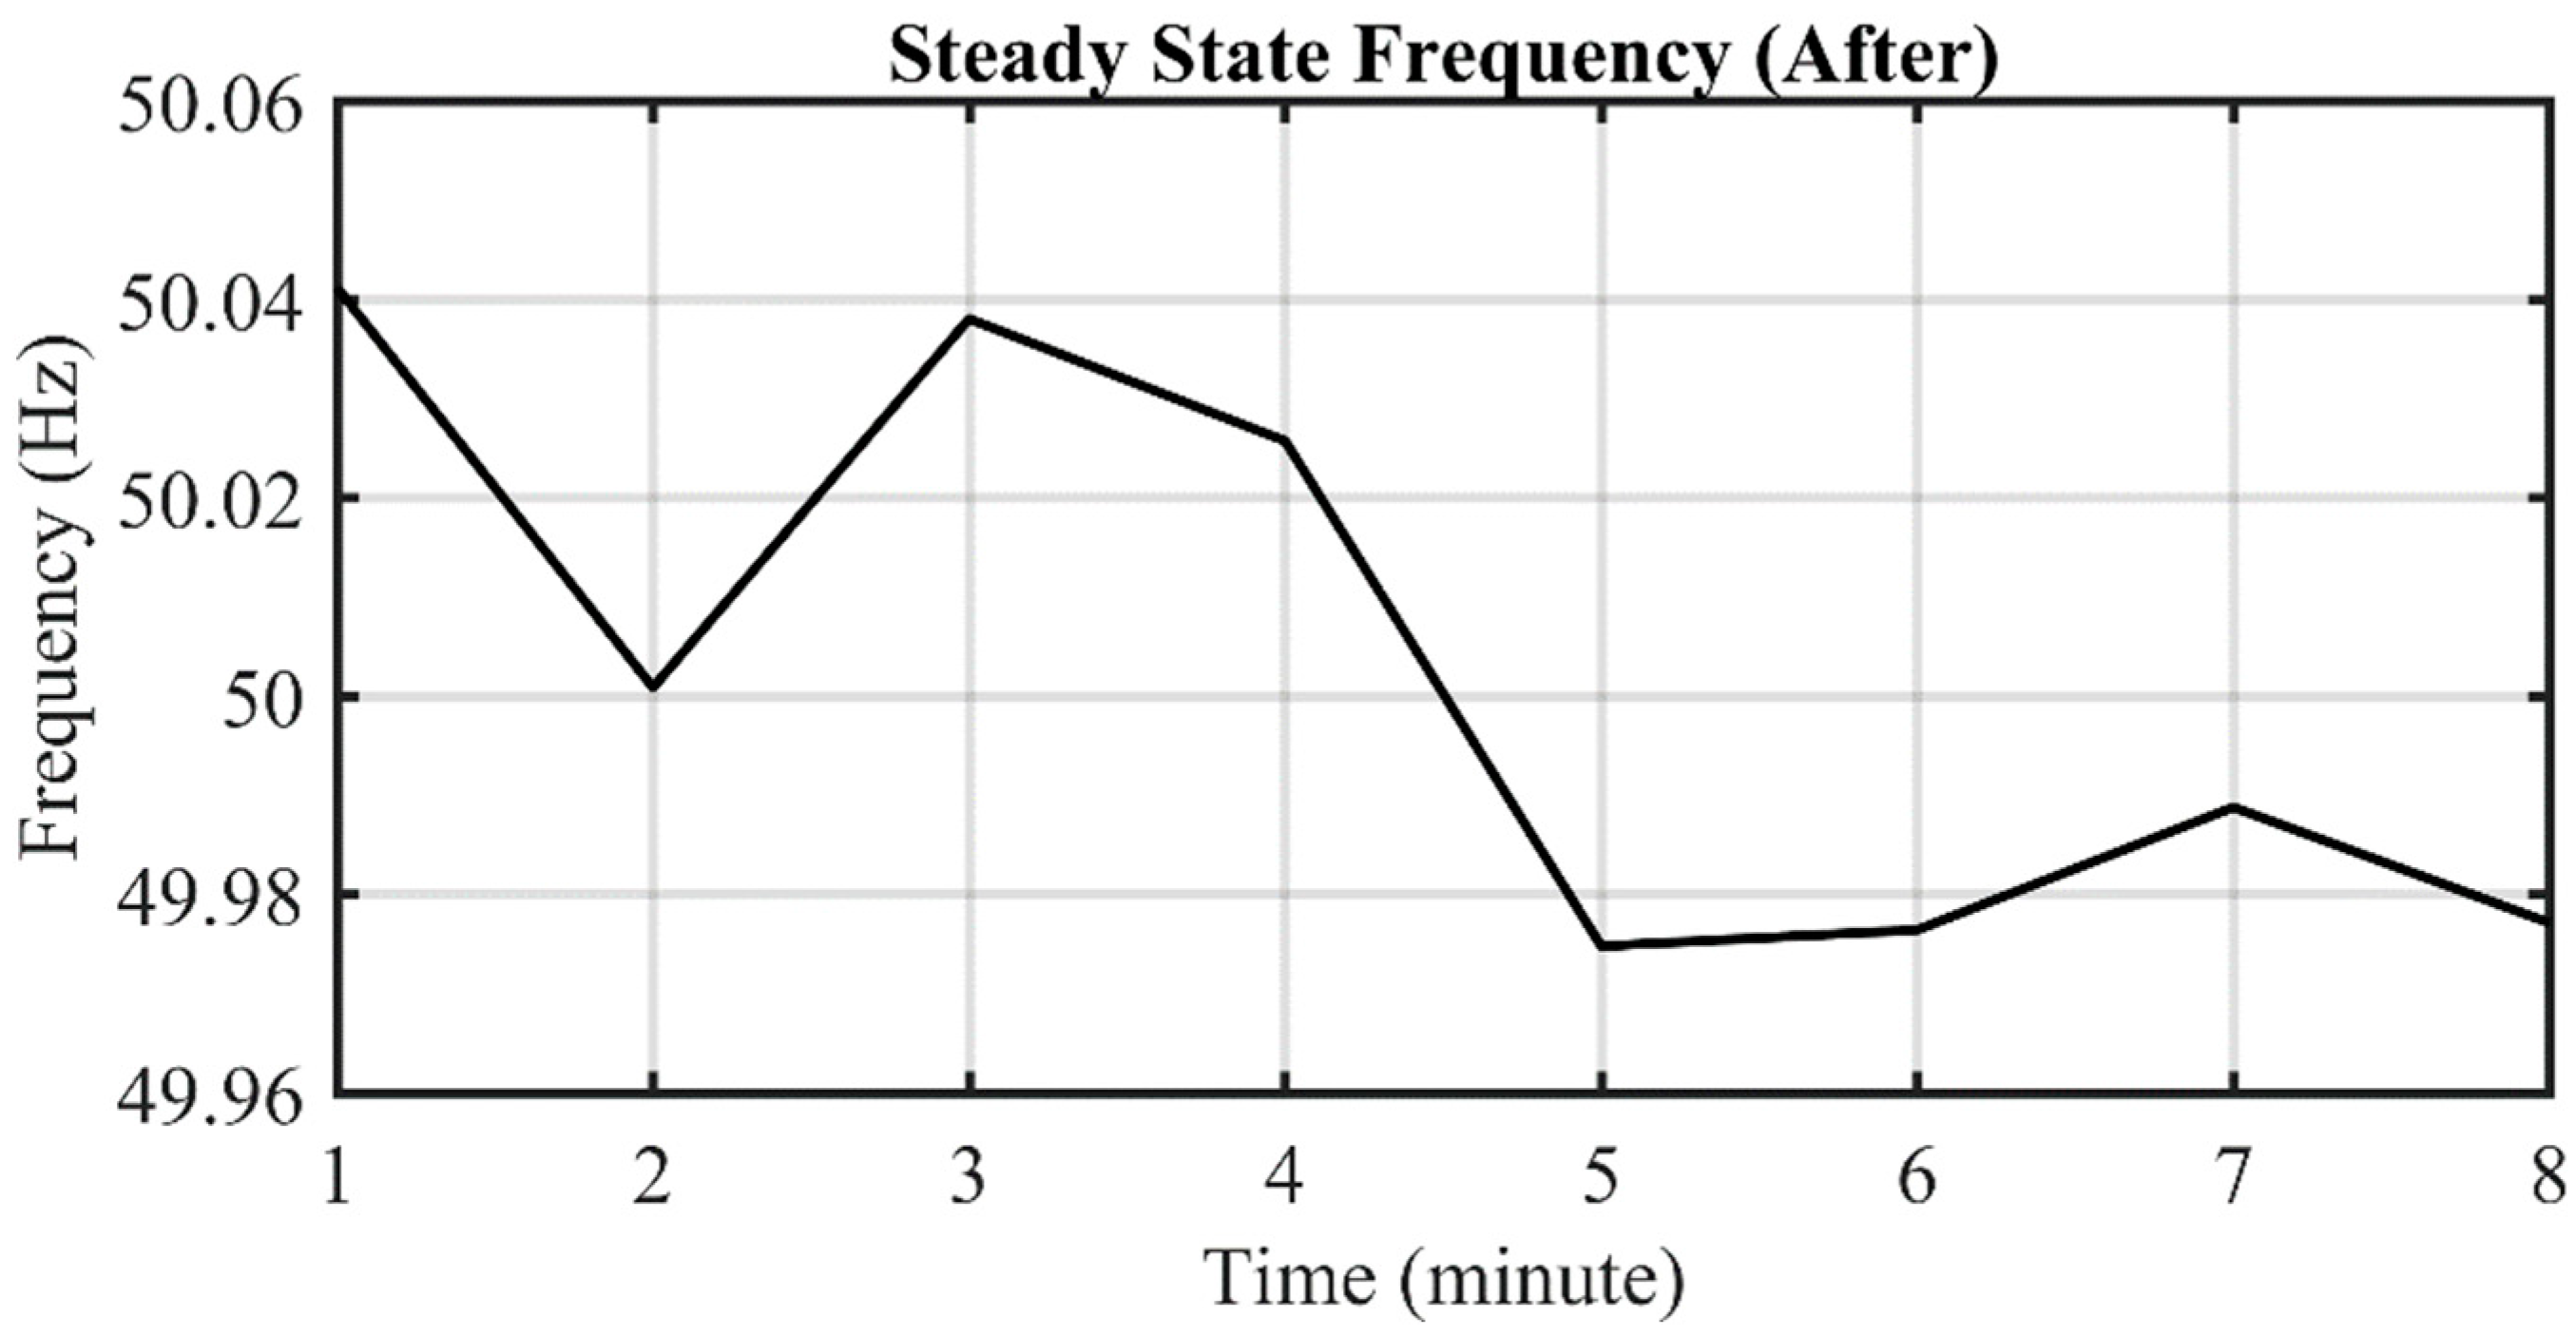
Similarly, the VI advantage of the BESS enabled the frequency performance of the test power system is improved. The transient frequency response is improved to a value of ±0.4 Hz after the integration of the BESS into the test power system. The steady-state frequency response of the test power system was improved to a maximum value of 50.04 Hz, while its minimum frequency was 49.97 Hz. Both of these extreme frequency ranges are within the healthy operation range of a power system.
The novelty of this work is the consideration of large datasets for the optimal capacity determination of the BESS for RR control and improvement of a wind farm, as well as for frequency regulation significance via its VI capability. Similarly, the paper includes energy curtailment cost to the objective function. This has the advantage of reducing the size of the BESS and, obviously, the overall cost of improving the RR.
As a future work, we recommend the optimal operation of the BESS be combined with demand-side management of some parts of the load. Loads on demand-side management could go ON and OFF based on the demand-side control strategy. This might help reduce the amount of abandoned wind energy and/or the capacity of the BESS.


