Article

Impact of Reverse Power Flow on Distributed Transformers in a Solar-Photovoltaic-Integrated Low-Voltage Network

by
Issah Babatunde Majeed
1,* and
Nnamdi I. Nwulu
2
1
Electrical and Electronic Department, University of Johannesburg, Auckland Park 2006, South Africa
2
Center for Cyber-Physical Food, Energy and Water Systems, University of Johannesburg, Auckland Park 2006, South Africa
*
Author to whom correspondence should be addressed.
Energies 2022, 15(23), 9238; https://doi.org/10.3390/en15239238
Submission received: 10 October 2022 / Revised: 27 November 2022 / Accepted: 1 December 2022 / Published: 6 December 2022
(This article belongs to the Special Issue Power System Dynamics and Renewable Energy Integration)

Abstract

:
Modern low-voltage distribution systems necessitate solar photovoltaic (PV) penetration. One of the primary concerns with this grid-connected PV system is overloading due to reverse power flow, which degrades the life of distribution transformers. This study investigates transformer overload issues due to reverse power flow in a low-voltage network with high PV penetration. A simulation model of a real urban electricity company in Ghana is investigated against various PV penetration levels by load flows with ETAP software. The impact of reverse power flow on the radial network transformer loadings is examined for high PV penetrations. Using the least squares method, simulation results are modelled in Excel software. Transformer backflow limitations are determined by correlating operating loads with PV penetration. At high PV penetration, the models predict reverse power flow into the transformer. Interpolations from the correlation models show transformer backflow operating limits of 78.04 kVA and 24.77% at the threshold of reverse power flow. These limits correspond to a maximum PV penetration limit of 88.30%. In low-voltage networks with high PV penetration; therefore, planners should consider transformer overload limits caused by reverse power flow, which degrades transformer life. This helps select control schemes near substation transformers to limit reverse power flow.

1. Introduction

The expanding worldwide need for energy necessitates the leverage of renewable energy technologies (RETs). Renewable energy technologies have the potential to become the dominant form of future energy technology, given the ease with which they can be deployed and the low cost at which they can be generated. They are also capable of mitigating global warming and enhancing energy sustainability [1]. One of these RETs, the photovoltaic (PV) solar system, is being widely used as a renewable energy source worldwide [2,3,4]. As a result, PV grid integration has advanced as a renewable energy technology that promises energy sufficiency and long-term sustainability. The benefits of PV grid integration include voltage support, improved power quality, loss reduction, postponement of new or upgraded transmission and distribution infrastructure, and increased utility system resilience [5].
Despite these advantages, there are some concerns and constraints that limit the use of PV in the grid. Some of these challenges include protective measures, problems with reverse power flow, and hosting capacity [6,7]. Additionally, variability and intermittency pose reliability challenges for PV grid integration [8]. These adverse challenges depend on the level of PV penetration into the grid and the network load demand response [9]. For instance, low-level PV penetration is known to benefit the distribution network by increasing bus voltages, reducing losses, and extending the transformer’s usable life [10,11]. On the other hand, high-level penetration challenges include power losses and problems with protection equipment [12,13]. Similarly, in high PV penetration networks, the development of reverse power flow (RPF), which can cause transformer overload, has been reported to increase network load, overvoltage, and losses [14,15,16].
The reverse power flow phenomenon occurs when the PV power generation in a grid-connected network exceeds the local load demand [17]. This is an indication that RPF is more likely to occur in network regions with lower peak loads. Likewise, the overgeneration of PV solar production may lead to the appearance of RPFs in low-voltage networks [7,18]. Reverse power flow in a low-voltage (LV) network can cause instability, such as in the line sections and distribution transformers [19,20]. The overloading of the distribution transformer is one consequence of a low-load, high-PV penetration network; higher voltages are also seen at low-voltage (LV) and medium-voltage (MV) levels. [21,22].
In [22], the authors address the effect of thermal loads on transformer technical life, as a result of an increase in PV penetration in an LV network.. Results revealed that significant reversed power flow can increase insulation degradation and shorten the technical life of a transformer. Similarly, reference [23] has demonstrated that, under reverse power flow, an increase in winding temperature in the transformer results in an increase in winding losses. The effect is insulation degradation that leads to a shortened lifetime and earlier breakdown of the transformer, a result which is also supported by [24]. This conclusion is supported by [25] who showed that increased excitation voltages due to RPF raise the transformer magnetizing current. Therefore, core losses are increased by increased winding temperature, which reduces the life of the transformer.
Reference [26] assesses how PV penetration levels impact utility transformers by altering the thermal stress to which the components are exposed. The authors demonstrated that overload periods cause losses and have a significant impact on the lifespan of transformers. They concluded that various simulation scenarios must be run to estimate the maximum PV penetration depth that the utility transformer can withstand.
To avoid transformer loss of life due to overload from solar PV production, control schemes can be implemented where the excess production is used to charge energy storage systems. Such is the case in [27] where the authors propose a smart charging scheme to coordinate electric vehicles (EVs) and battery energy storage systems (BESS) in the presence of PV generation. The scheme is designed to prevent the overloading of transformers above their nameplate capacities. Such a coordination scheme is shown to improve transformer life expectancy.
Reference [28] addresses the transformer overload issue caused by RPF, by including transformer constraints in their optimisation problem formulation to provide more accurate solar PV allocation. Notably, battery energy storage systems (BESS) are utilised to demonstrate how transformer overloads may be minimised in the presence of high solar PV penetrations into the grid. Similarly, Ref. [29] employed the BESS scheme in their study to prevent the progression of RPF in a real distribution network due to high PV penetration. They demonstrated how excess energy resulting from high PV penetration is used to charge energy storage systems (ESS) to upgrade the grid and enable network expansion. They concluded that storage capacity systems should be built next to LV-MV transformers to prevent overvoltage conditions and transformer overloads when RPF is present.
In their study of solar roof potential assessments, Ref. [16] used a deterministic approach to evaluate the maximum and minimum PV penetration levels in a medium voltage feeder in Ulm, Germany. To evaluate the minimum penetration level, RPF is used as a constraint for overloading the MV/LV transformers in the investigated feeders. The limitation of this study is that the analysis is performed at the secondary MV/LV substation. Reference [30] proposes smart transformers to control reverse power flow in the LV network. This analysis is performed and verified using the control-hardware-in-loop (CHIL) real-time simulation methodology. As a result, the proposed RPF limitation controller reduces the power output from the solar PV to avoid RPF in the MV grid.
Reference [25] demonstrates how RPF affects the performance of distribution transformers. Using analytical techniques, the authors showed that distribution transformer losses increase significantly during reverse power flow, resulting in a 25% reduction in the transformer’s lifespan. Similarly, In the presence of varying levels of grid-connected PV penetration, the main goal of [31] is to investigate the impact of ageing in overhead distribution transformers caused by reverse power flow and the impact on utilities’ permitted revenue. The methodology included a Monte Carlo simulation and depreciation rates, which depend on transformer ageing. According to the findings, many transformers are replaced after 40 per cent PV penetration because their degradation accelerates and their operational lifespan shortens, reducing utility revenue. In other research, the impact of high penetration PV on the ageing of distribution transformers in a PV grid network has been thoroughly established [26,32,33,34].
Most of the investigated cases of high PV penetration mainly focus on feeder representative metrics due to reverse power flow [2,30,35]. For instance, in [16] an overall system analysis due to PV penetration is carried out on the MV network. Certain studies also focus on distribution transformer constraints and strategies used to determine maximum PV penetration in the distribution system [28,36]. For instance, in [28] transformer constraints are applied to ensure that they are not loaded beyond their power rating due to reverse power flow caused by high PV impacts. However, these constraints are transformer power rating-tied and do not address the issue of critical operating conditions for reverse power to flow. To address this gap, we provide the needed insight into the backflow limits analysis of the operating conditions of the transformer. These limits are reached before the reverse flow can cause substantial overload on the transformer.
In addition, there are few studies on the assessments and impacts of PV penetration on the national grid in Ghana [37,38,39,40]. These investigations are carried out on grid-connected or isolated LV feeders on 33 kV/161 kV sub-transmission networks as case and feasibility studies. None of these publications demonstrate the relationship between transformer operating loads and PV penetration due to power flow dynamics in the distribution system. The study will fill the aforementioned gaps by deploying the methodologies on a solar PV-tied real urban ECG LV network. The motivation for the present study is to provide utilities with insights into substation transformer operating limits beyond which reverse power flows as a result of high solar PV penetration. The main objective of this study is to predict the reverse power flow and transformer backflow limits in a radial LV network under high solar PV penetration
Using the ETAP software, the study models and analyses the distribution network to quantify the effects of reverse power flow on transformer loading, which results in losses. In addition, the analysis establishes the maximum penetration depth at the margin of RPF in the substation transformer. This is a utility-based study aimed at assessing safety thresholds for substation transformers due to excessive PV installations in LV radial networks. The study provides a one-case scenario of high constant solar production in the presence of average real static loads in a radial LV network. The findings provided in this study would serve as a recommendation for utilities to set safe margins to safeguard the flow of reverse power into the substation transformer. This general framework is required for establishing pre-defined threshold parameters to protect LV networks from RPF caused by excessive solar PV installations.
The major contributions that will address the outlined gaps in the literature are as follows:
Statistical models are developed for threshold analysis to predict:
  • Transformer backflow limits due to high solar PV impacts;
  • The maximum depth of penetration of solar PV at the margin of RPF in the substation transformer.
The rest of the paper is organized as follows: The methodology is covered in Section 2, which includes a case study network, as well as modelling and simulation. Section 3 contains the results and discussion, including the determination of transformer backflow limits, and Section 4 contains the conclusion.

2. System Modelling and Power Flow Analysis

A mathematical analysis to consider the steady state output analysis of the inverter grid current injection is considered in this section.

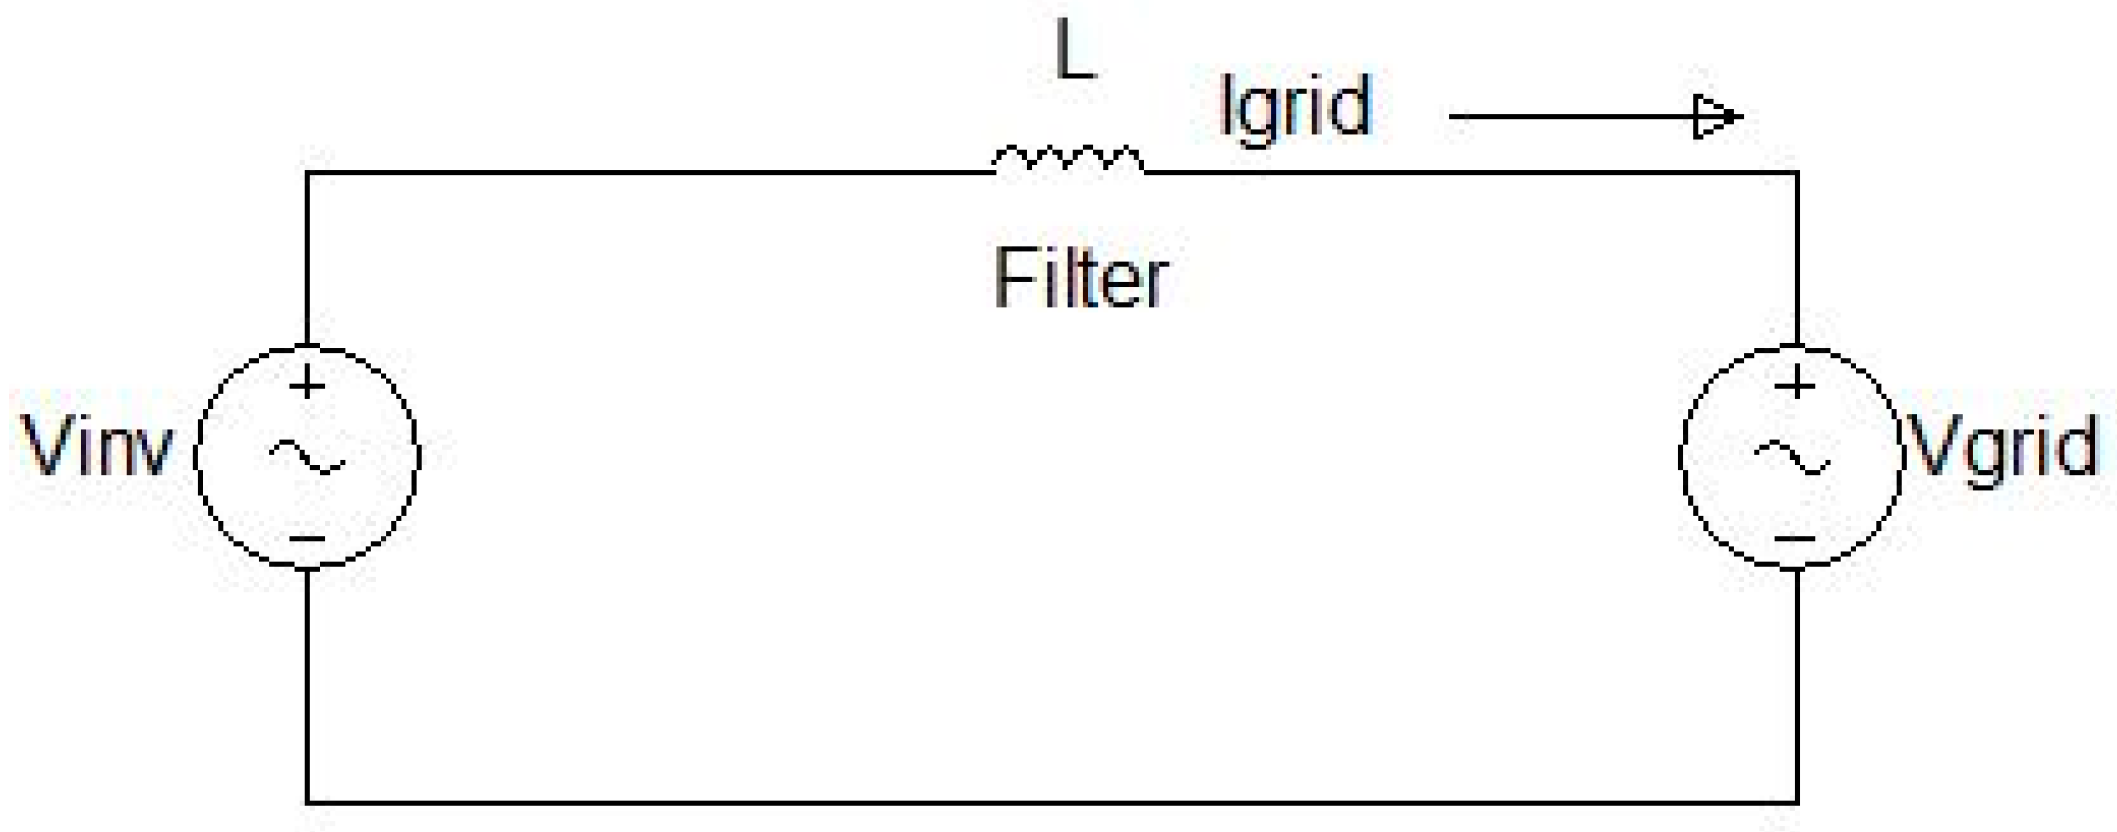
2.1. Equivalent Circuit of Inverter Grid Interphase

As seen in Figure 1, an equivalent inverter grid circuit is required to send active and reactive current into the grid [41]. At the point of connection into the grid, a current filter is used to mitigate harmonic current. Given the inverter voltage, V inv , the vector sum of the grid voltage, V grid , and the voltage across the filter, V L , can be obtained from Kirchoff’s voltage law.
V inv = V grid + V L
For active power transfer, at the point of connection, the condition in (2) must be satisfied.
V inv = V grid
In the power flow of the PV grid system, the output power of the PV power varies at random with light intensity [42]. Assuming constant inverter output, it follows from [43] that the active power injected into the grid, P active , is characterised by (3).
P active = V i n v V grid sin δ ω L
where δ is the angle between the inverter output voltage and the grid voltage, L is the inductance of the coupling inductor, and ω is the grid frequency. By varying the phase angle δ , the inverter’s active power flow into the grid can be controlled [41]. Additionally, grid-connected inverters are current sources and can deliver voltage output by synchronising with the grid voltage and frequency [44]. This condition is satisfied by (2). For maximum power output, the inverter is designed to operate at a power factor of unity, with no reactive power injection into the grid [44,45]. From Figure 1, the steady-state current injection into the grid is obtained from the expression in (4):
I inv = V inv V grid ω L

2.2. Solar PV Grid Load-Point Analysis

It is expected that the amount of solar energy produced in a grid system will fluctuate during the day. Likewise, the load profiles of the grid system are dynamic. Therefore, the instantaneous real power dynamics, defined at any given time, t, at a local load point is given in Equation (5):
P net   power   i t = P load   i t P PV   i   t     t
where, P net   power   i t and P load   i t are the net active power at the ith bus and load active power at the ith bus, respectively. P pv   i t is the active power of solar PV at the I th bus. For multiple transformers, the total net active power, P T t , in the following relation:
P T t = i = 1 N P net   power   i t   t
It follows from (5) and (6), that when
i = 1 N P load   i t > i = 1 M P PV   i t   t
conventional current flows, leading to a positive value of P T t , represent a power flow from the transformer to the loads (7). However, in the case of (8), a negative value of P T t represents a reverse flow of power into the substation transformer.
i = 1 N P load   i t < i = 1 M P PV   i t   t
In particular, when P T t = 0 , a critical point is reached, beyond which there is a reverse flow of power. This is the point where the transformer backflow limits can be determined. A major challenge is that RPF is not concurrent across the different parts of the network [46]. This means that different zones within the same grid may not experience RPF within the same period. However, the net flow of power is what is seen by the transformer. Neglecting energy losses on line components and inverters, the global net power contributions to the grid are represented by (9):
P T t = i = 1 N P load   i t i = 1 M P PV   i t   t
P min i = 1 N P load   i t i = 1 M P PV   i t P max   t  
Equation (10) places power flow limits on the transformer, defined as the transformer loading constraints, P min and P max . These limits protect the transformer from under-loading and overloading conditions, respectively, thereby preventing reverse power flow due to excess energy from solar PV, which can cause overloading in the transformer [29]. It should be noted that these limits are pre-defined, depending on the loading patterns in the network. However, the transformer loading constraint, P max , differs from the backflow limit due to reverse power flow, PT(t). So, while PT(t) sets the limit at the margin of reverse power flow, P max sets a limit beyond which the transformer is overloaded by reverse power flow due to increased PV penetration.
There is no absolute definition for PV penetration level. Various definitions are advanced from both the distribution system point of view and the bulk system point of view [47]. In this study, the depth of penetration, D, is defined for the system loadings connected to the substation transformer. Thus,
  D   = Aggregated   PV   rating   on   feeder   in   kVA   Transformer   full   load   kVA   rating
In (11), the depth of penetration is seen to be a function of the transformer’s net active power, expressed as
D = f ( P T t > 0 )   t
Equation (12) indicates that as long as the net active power flow is always greater than zero, no RPM will be established in the substation transformer for increasing levels of PV penetration. It follows from (12) that the maximum depth of penetration, D max , can be obtained at the margin of RPF in the substation transformer, as follows:
D max = lim P T t 0 D           t
It can be deduced from (13) that the maximum depth of penetration is obtained at the threshold of the RPF when the theoretical total net active power flow into the substation transformer is zero.

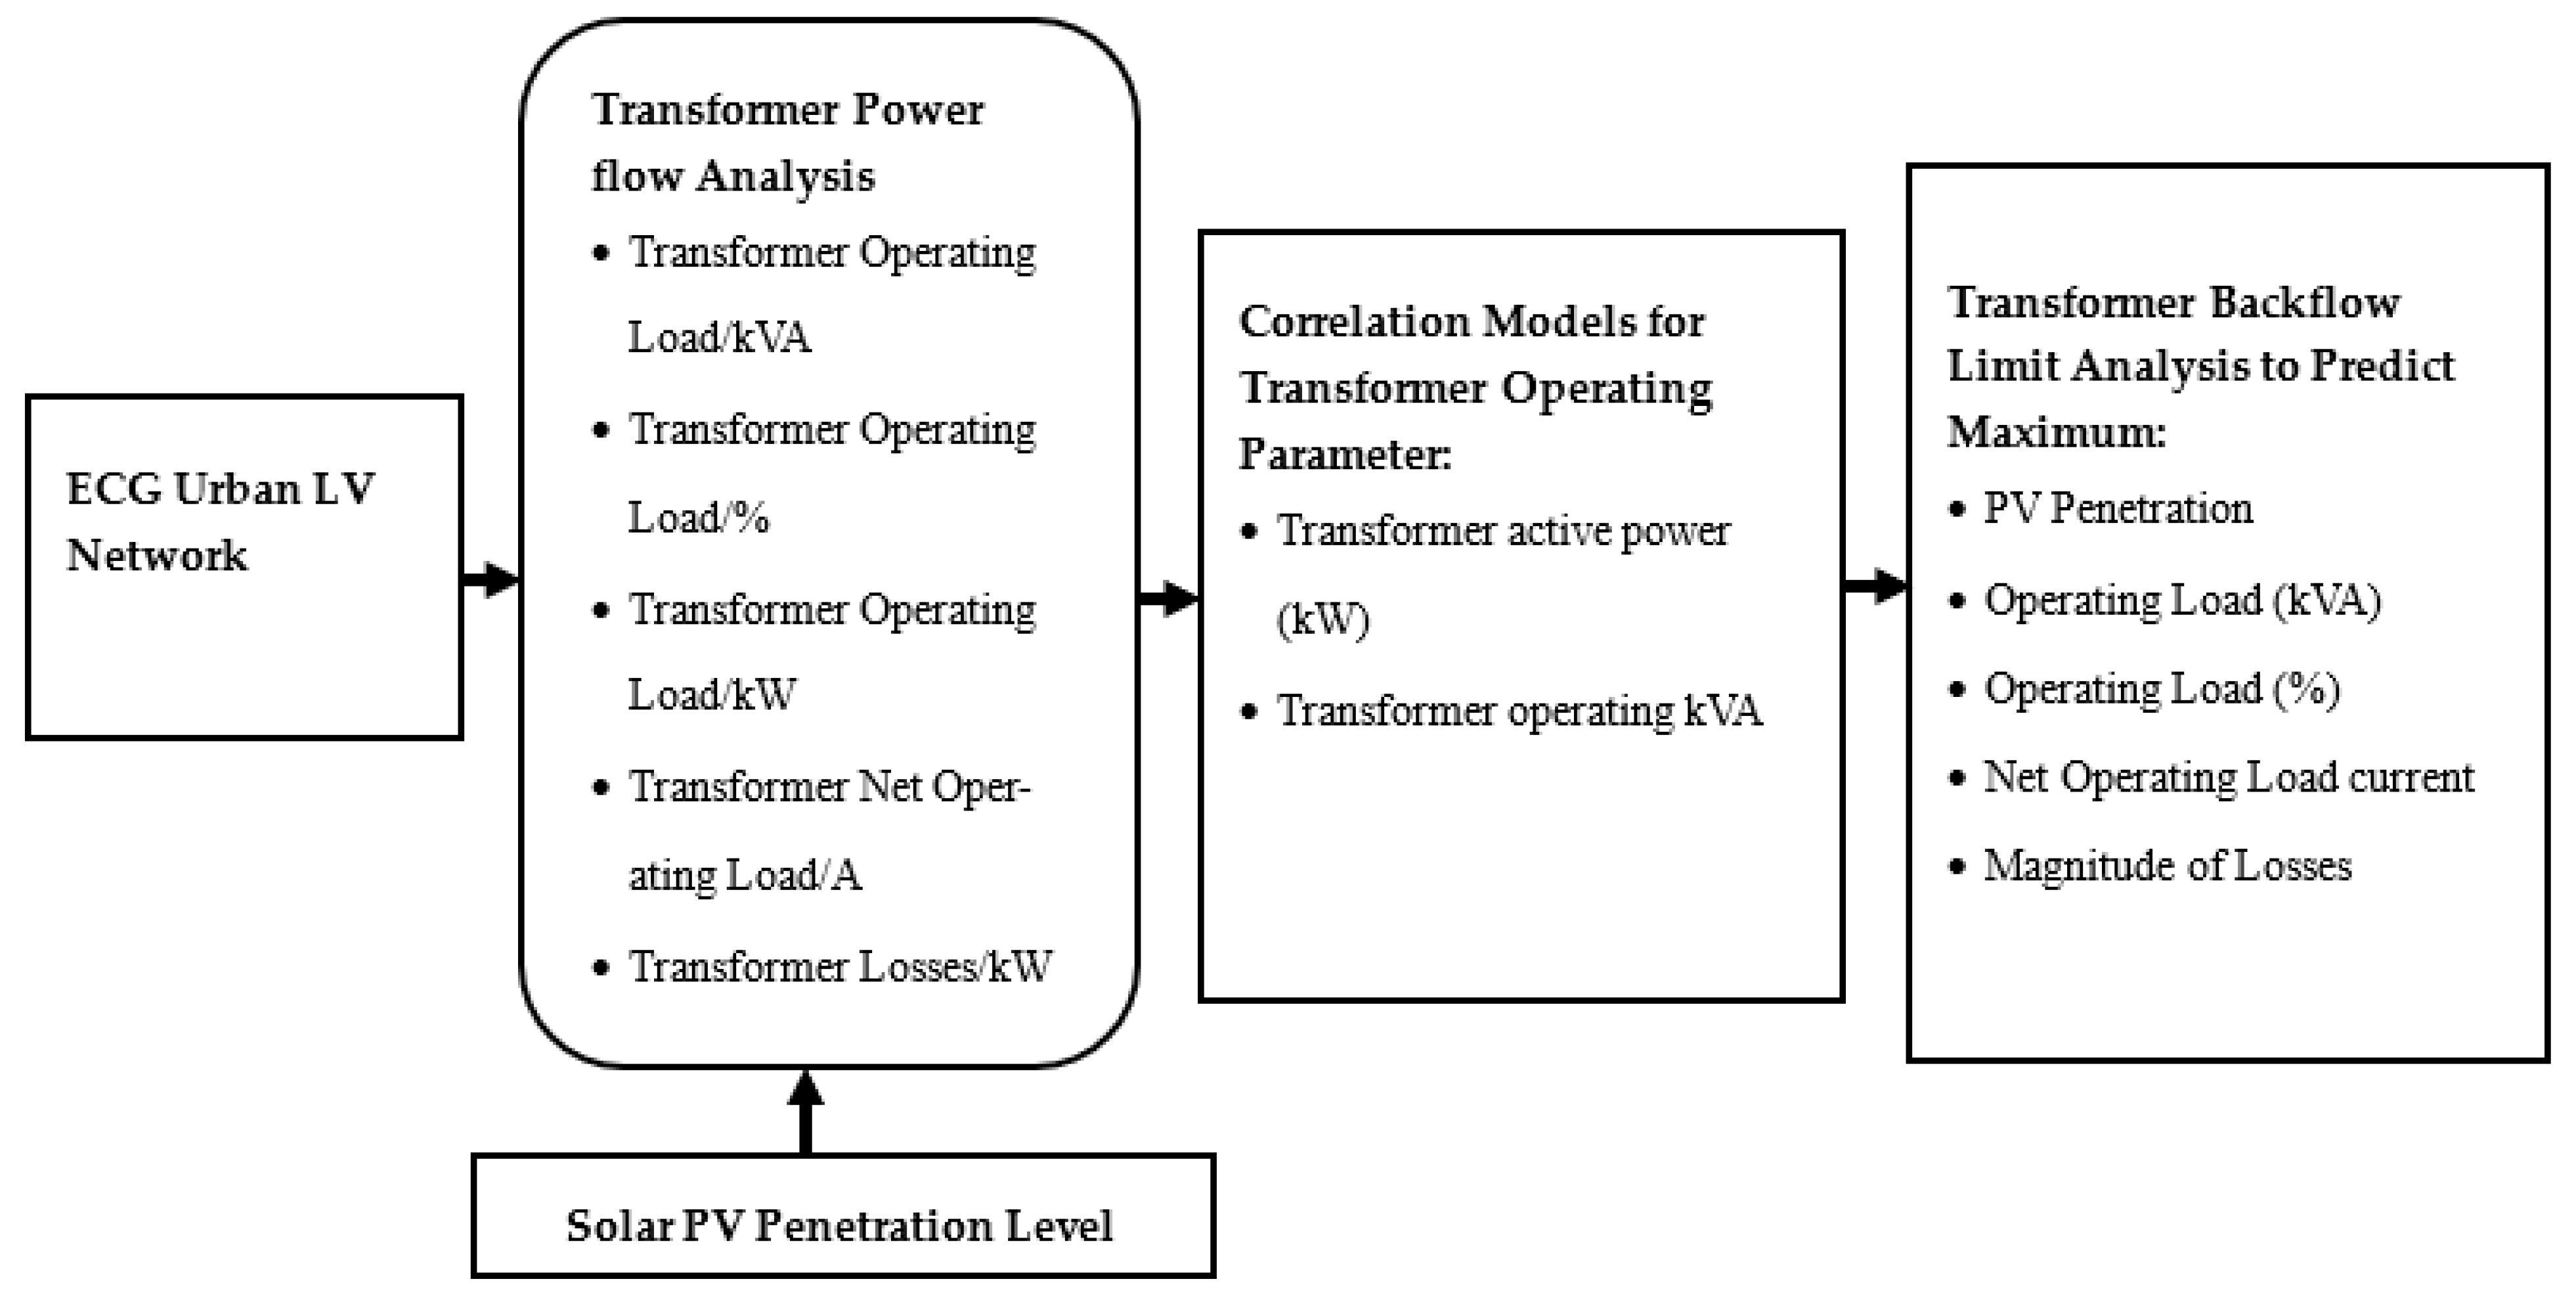
3. Materials and Methods

This is a utility-based study aimed at determining safety thresholds for substation transformers due to excessive PV installations in LV radial networks. In this simulation-based research design, a test model was developed with field data to represent a real LV network. Next, a solar PV inverter system was designed as the distributed generator in the LV network, which is powered by a single substation transformer. This study used the power flow calculation tool in ETAP software to model and simulate the LV network using field data [48]. In the base case, the network was simulated to determine the overload operating conditions of the substation transformer. In the second scenario, the network was reset to the normal loadings with the transformer operating without overload. Solar PV units were deployed to the grid cumulatively, based on a dispersion rule and transformer loading constraints. Simulation data were obtained at different levels of PV penetration to build correlation models, using the Excel data analysis tool. These correlation models were used to extrapolate transformer backflow limits. Figure 2 presents an overview of the design process of the study.

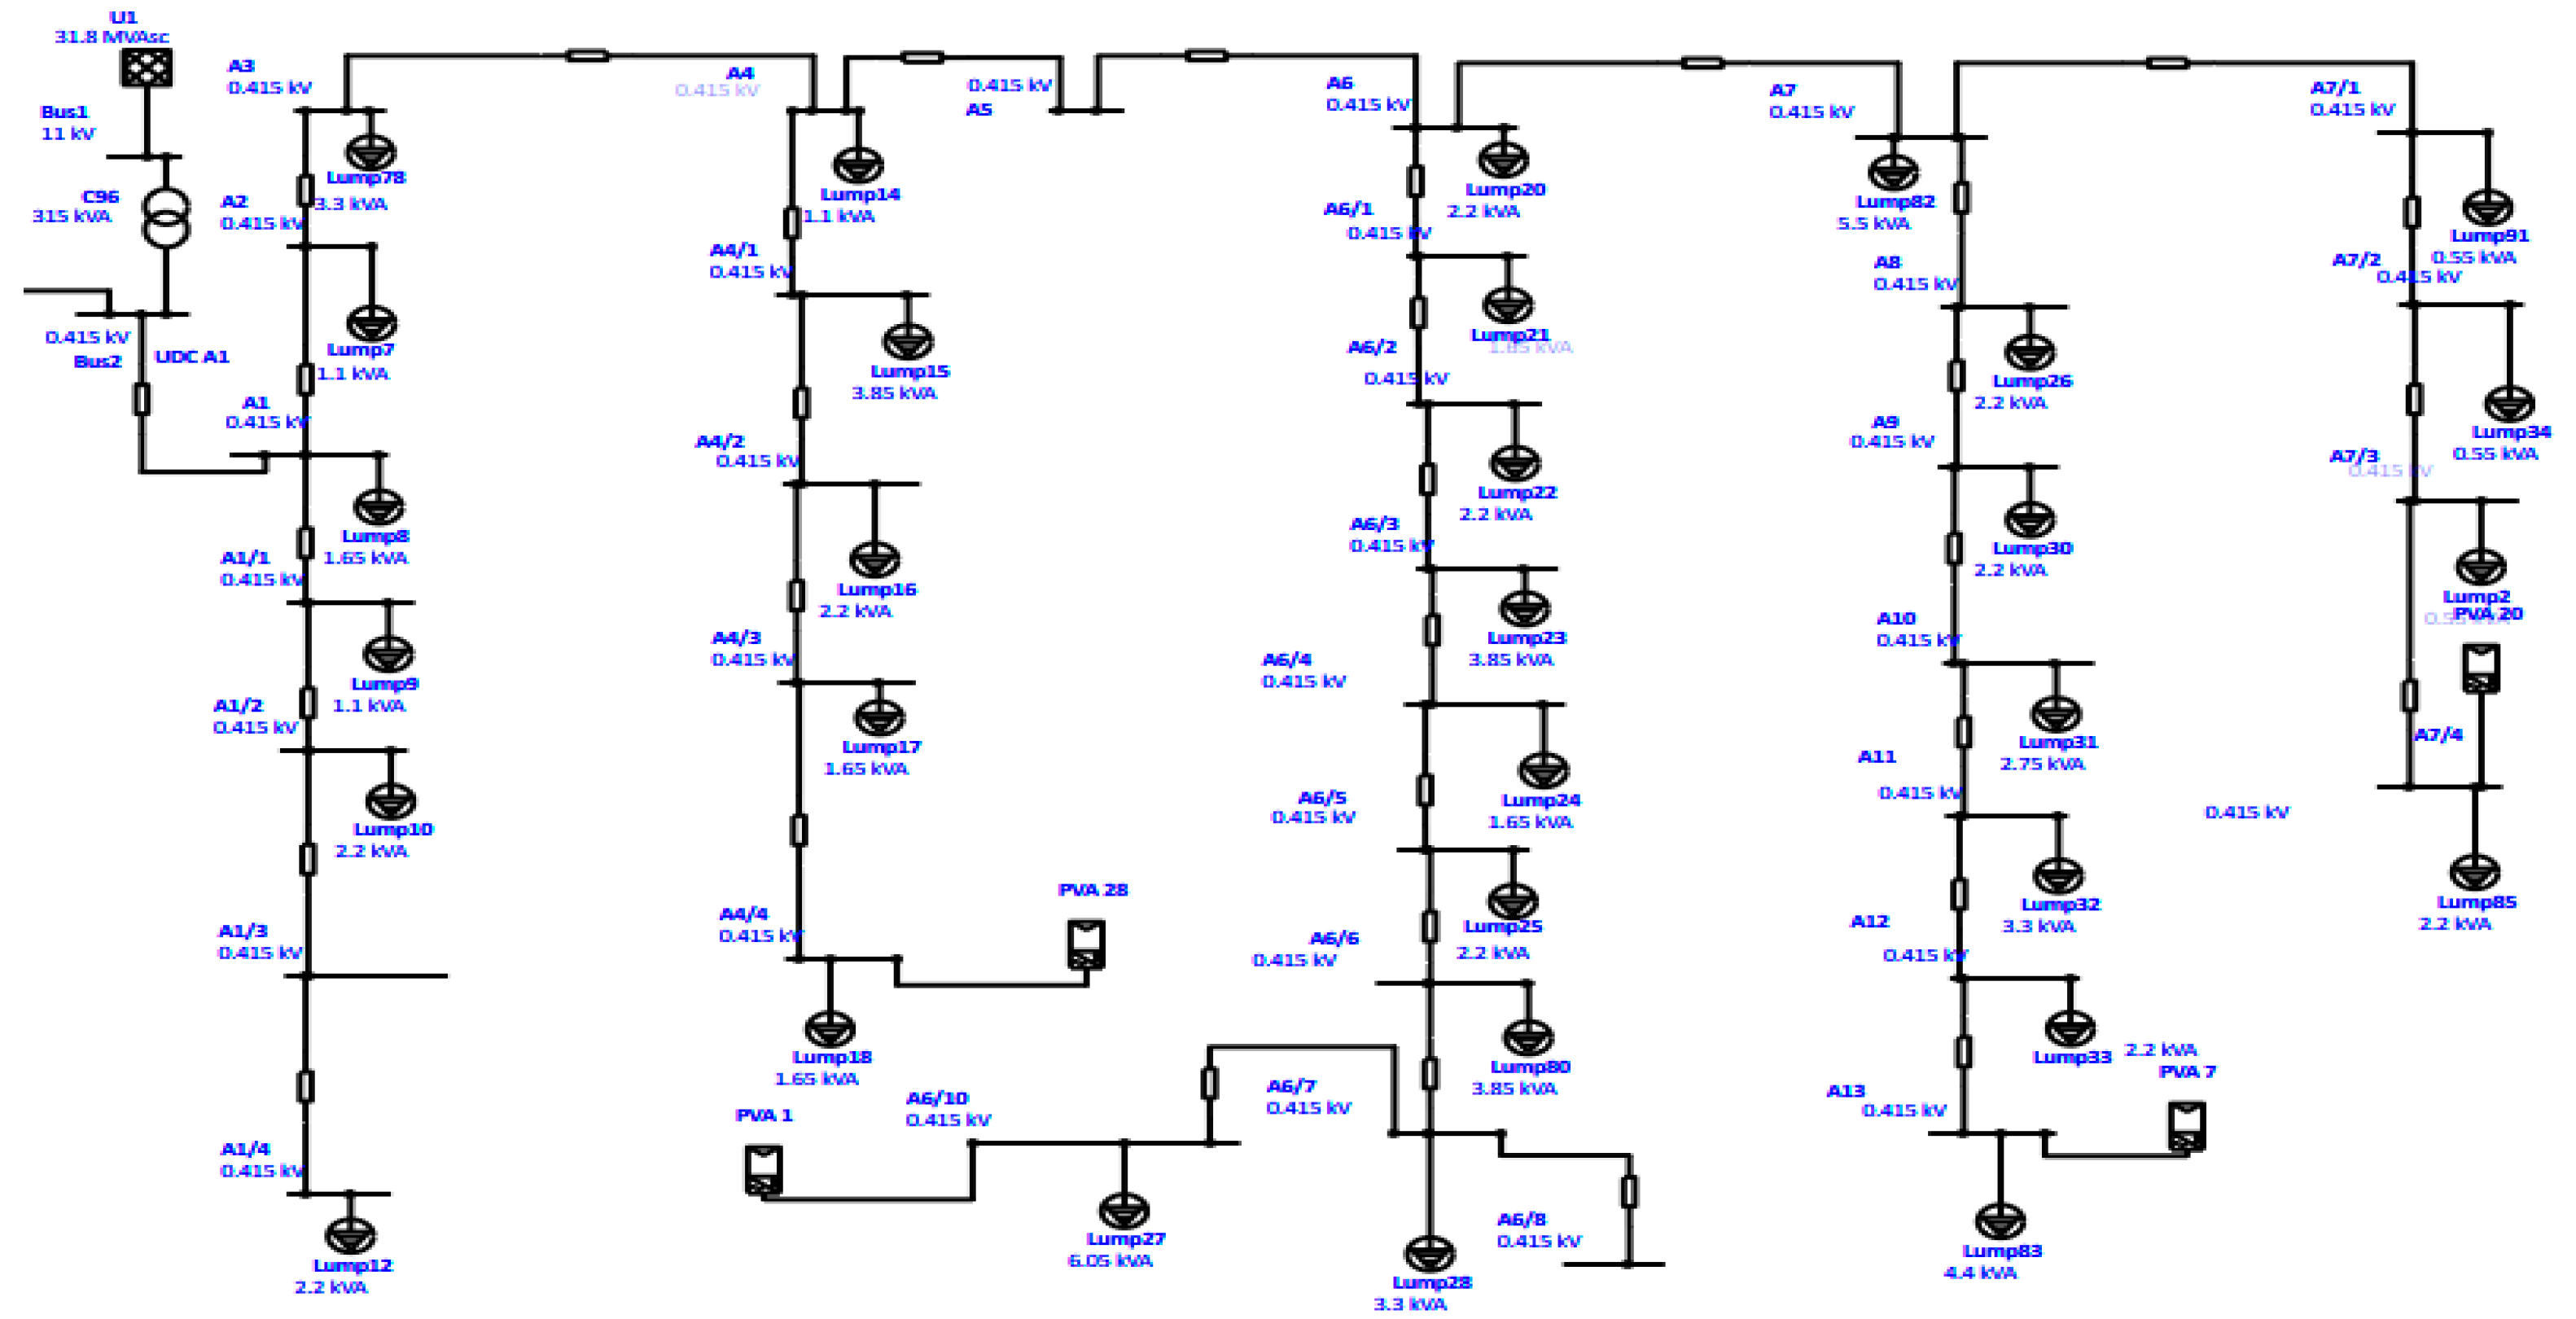
3.1. Case Study Network

This research considers a real urban ECG LV residential network in the western region of Ghana as a case study grid. The investigated network has a radial configuration and is connected to the medium voltage (MV) grid through a three-phase four-wire system with a 315 kVA, 11/0.415 kV, Delta-Y connected transformer (known as C96). The primary feeder lines of 50 mm2 aluminium bare conductor size are LV lines. For a pole height of about 8 m, the maximum span is about 50 m. Spur lines of the same material are sized 25 mm2. The network has one feeder and numerous laterals, most of which are single phases. It is characterised by poor bus voltages, registering as low as 208 V at the load points, typically because of load growth issues and an increase in load demand by existing customers. The usual practice used to improve these voltages requires the zoning of the LV network, stringing new lines to the customer vicinity, and injecting new transformers to upgrade the network. The above challenges justify the proposed introduction of solar PV to improve the voltage profile on the network.
To determine the peak load on the 11 kV C10 feeder, we used data from the load monitoring exercise carried out by ECG in 2019 on the C96 distribution transformer. The peak current obtained from the load current monitoring was 223 A. The total maximum operating load on the transformer is obtained as follows:
Total   kVA   on   C 96   transformer = 3   I l V l 1000 = 3 × 223 × 415 1000
Therefore, transformer full load kVA rating is 160.29 kVA, which is used to determine the depth of penetration for the solar PV rating according to (11).

3.2. Modelling of System Components

The existing LV network was modelled to exhibit the characteristics of the real network. Power flow components such as LV lines, loads, and transformers are modelled in the Etap environment using field data collected during load monitoring.

3.2.1. The 11 kV Source Feeder

A network usually begins from a source. This source is usually represented by the bus of a distribution substation. In a typical case, a substation transformer steps down 33 kV into an 11 kV source. From this source, the main feeder is run through the network. The source impedance is the equivalent impedance of the transformer, transmission lines, and generators supplying the 11 kV bus. The equivalent source used in this research is defined by the base power, source equivalent impedance, short-circuit power, etc.

3.2.2. Network Loads

Individual loads are attached to the bus bars and modelled as lumped loads consisting of three and single-phase loads with a total system load of 158.95 kVA. These residential loads were modelled as constant impedance, since they consist mostly of heating devices and lighting bulbs. Based on the results from the load monitoring exercise on ECG networks, loads on service poles were lumped as load points and shared unequally across the phases. These loads are modelled as lumped three-phase static loads with rated average loads of 1.5 kW.
The required data used for the modelling and simulation of the loads and 11 kV feeder source are presented in Table 1.

3.2.3. Substation Transformer

The transformer is modelled to exhibit the characteristics of the field substation transformer. Load monitoring was carried out on transformer legs to obtain the average maximum system loadings. In the Etap software, the two-winding transformer is modelled as 11 kV/0.415 kV with a rating of 315 kVA. Other modelling parameters are shown in Table 2.

3.2.4. Overhead Lines

In the model, the overhead lines are the primary feeder lines. The phase conductors are modelled as ACSR (aluminium conductor steel reinforced)-type with an ampacity of 209 A at a maximum operating temperature of 75 degrees Celsius. These LV lines have a maximum span of 50 m. Other modelling parameters are shown in Table 2. Table 3 gives the convergence criteria for the simulation.

3.2.5. Solar PV Dispersion Criteria

A three-phase solar PV inverter system was designed as an integral part of a solar PV system. The inverter was sized for constant output power and unity power factor using the LV network system loadings and ETAP software simulation data. The inverter size was based on network system loadings and simulation data provided by ETAP software. In the ETAP solar PV interface, the selection of Photowatt power plants for the grid-connected large-scale system was appropriate for the design. In this study, harmonics were not considered in the inverter design. The simulation data used for the solar PV design are shown in Table 4 and Table 5.
To maximise the depth of penetration based on network constraints, solar PV units have been installed in distribution networks using a variety of strategies [49,50,51,52]. In contrast with the customer-based randomised PV allocation, the utility-based PV allocation is well defined. This study adopts the latter approach, which is done systematically for future planning and to regulate customer allocation for injection into the network. In this study, the selection criteria for the next solar PV unit allocation involves prioritising the busbar with the worst voltage profile. Where the worst voltage bus is defined as any bus with under-voltage conditions below 0.95 per unit.
The following were the steps taken to allocate distributed solar PVs at the busbars on the modelled LV network.

3.2.6. Algorithm for Solar PV Dispersion in LV Network

  • Start;
  • Run a load flow calculation for the LV network without a solar PV unit;
  • Identify and place a solar PV unit at the load bus with the worst voltage profile;
  • Run a load flow calculation for the network;
  • Repeat steps 2 and 3 until transformer loadings (kW) register negative values;
  • End.
The PV penetration involves adding new PV generators at locations to the base case model by increasing the size of the potential PV generators until reverse current flows in the transformer. The simulation results obtained were used to set up correlation models using the least square method in Excel software [53]. The models for operating loads and PV penetration were analysed to determine transformer backflow limits.

4. Results and Discussions

Several studies [25,28,46] have investigated power backflow limits for grid upgrades in distribution networks. What is not so clear in the literature is the transformer-based backflow limits due to high-level solar PV grid penetration. The simulation results obtained in this study explain the relationship between transformer operating loads and solar PV depth of penetration due to power flow dynamics in the distribution system. The established casework also determined the maximum depth of penetration and the operational locations of the PV systems in the grid. These findings are significant because, as long as the distribution of loads and PV installations are known, restricting transformer backflows to pre-defined limits could prevent over-voltages in the network feeder [54].
Additionally, reverse power flow may violate voltage and line capacity margins as a result of excessive PV deployments in LV networks. This could be avoided by establishing pre-defined transformer backflow limits, above which surplus photovoltaic energy is exported back to energy storage devices [28].
The modelled network in Figure 3 shows the positions of the solar PV units dispersed in the LV network. They are incrementally placed at successive load points where the worst voltages are recorded after each iteration. Table 6 is a summary of the results of the simulations on the LV network.
The transformer kVA loading base case is 169 kVA without PV penetration for the period (Table 6). An initial PV penetration of 12% represents a 19.93 kVA inverter output. Additional inverter constant operating conditions are 147.3 kVA, 121.6 kW, and 2.75 kVA (losses) and 7.73 A. At this initial condition of no PV penetration, the worst bus voltage after the initial simulation is registered at location A6/10, as shown in Table 6. Therefore, the next solar PV injection is situated at A6/10, and the simulation is run to determine the next operating conditions of the distribution transformer. It is anticipated that any excess generation is fed back into the grid upstream of the transformer when the injected PV production exceeds the load requirement, as suggested in (8).

4.1. Analysis of Transformer Operating Loads

Simulation results from the ECG network were used to create statistical models and graphs to show how PV penetration and transformer operating parameters are correlated. The analysis of these models is presented.

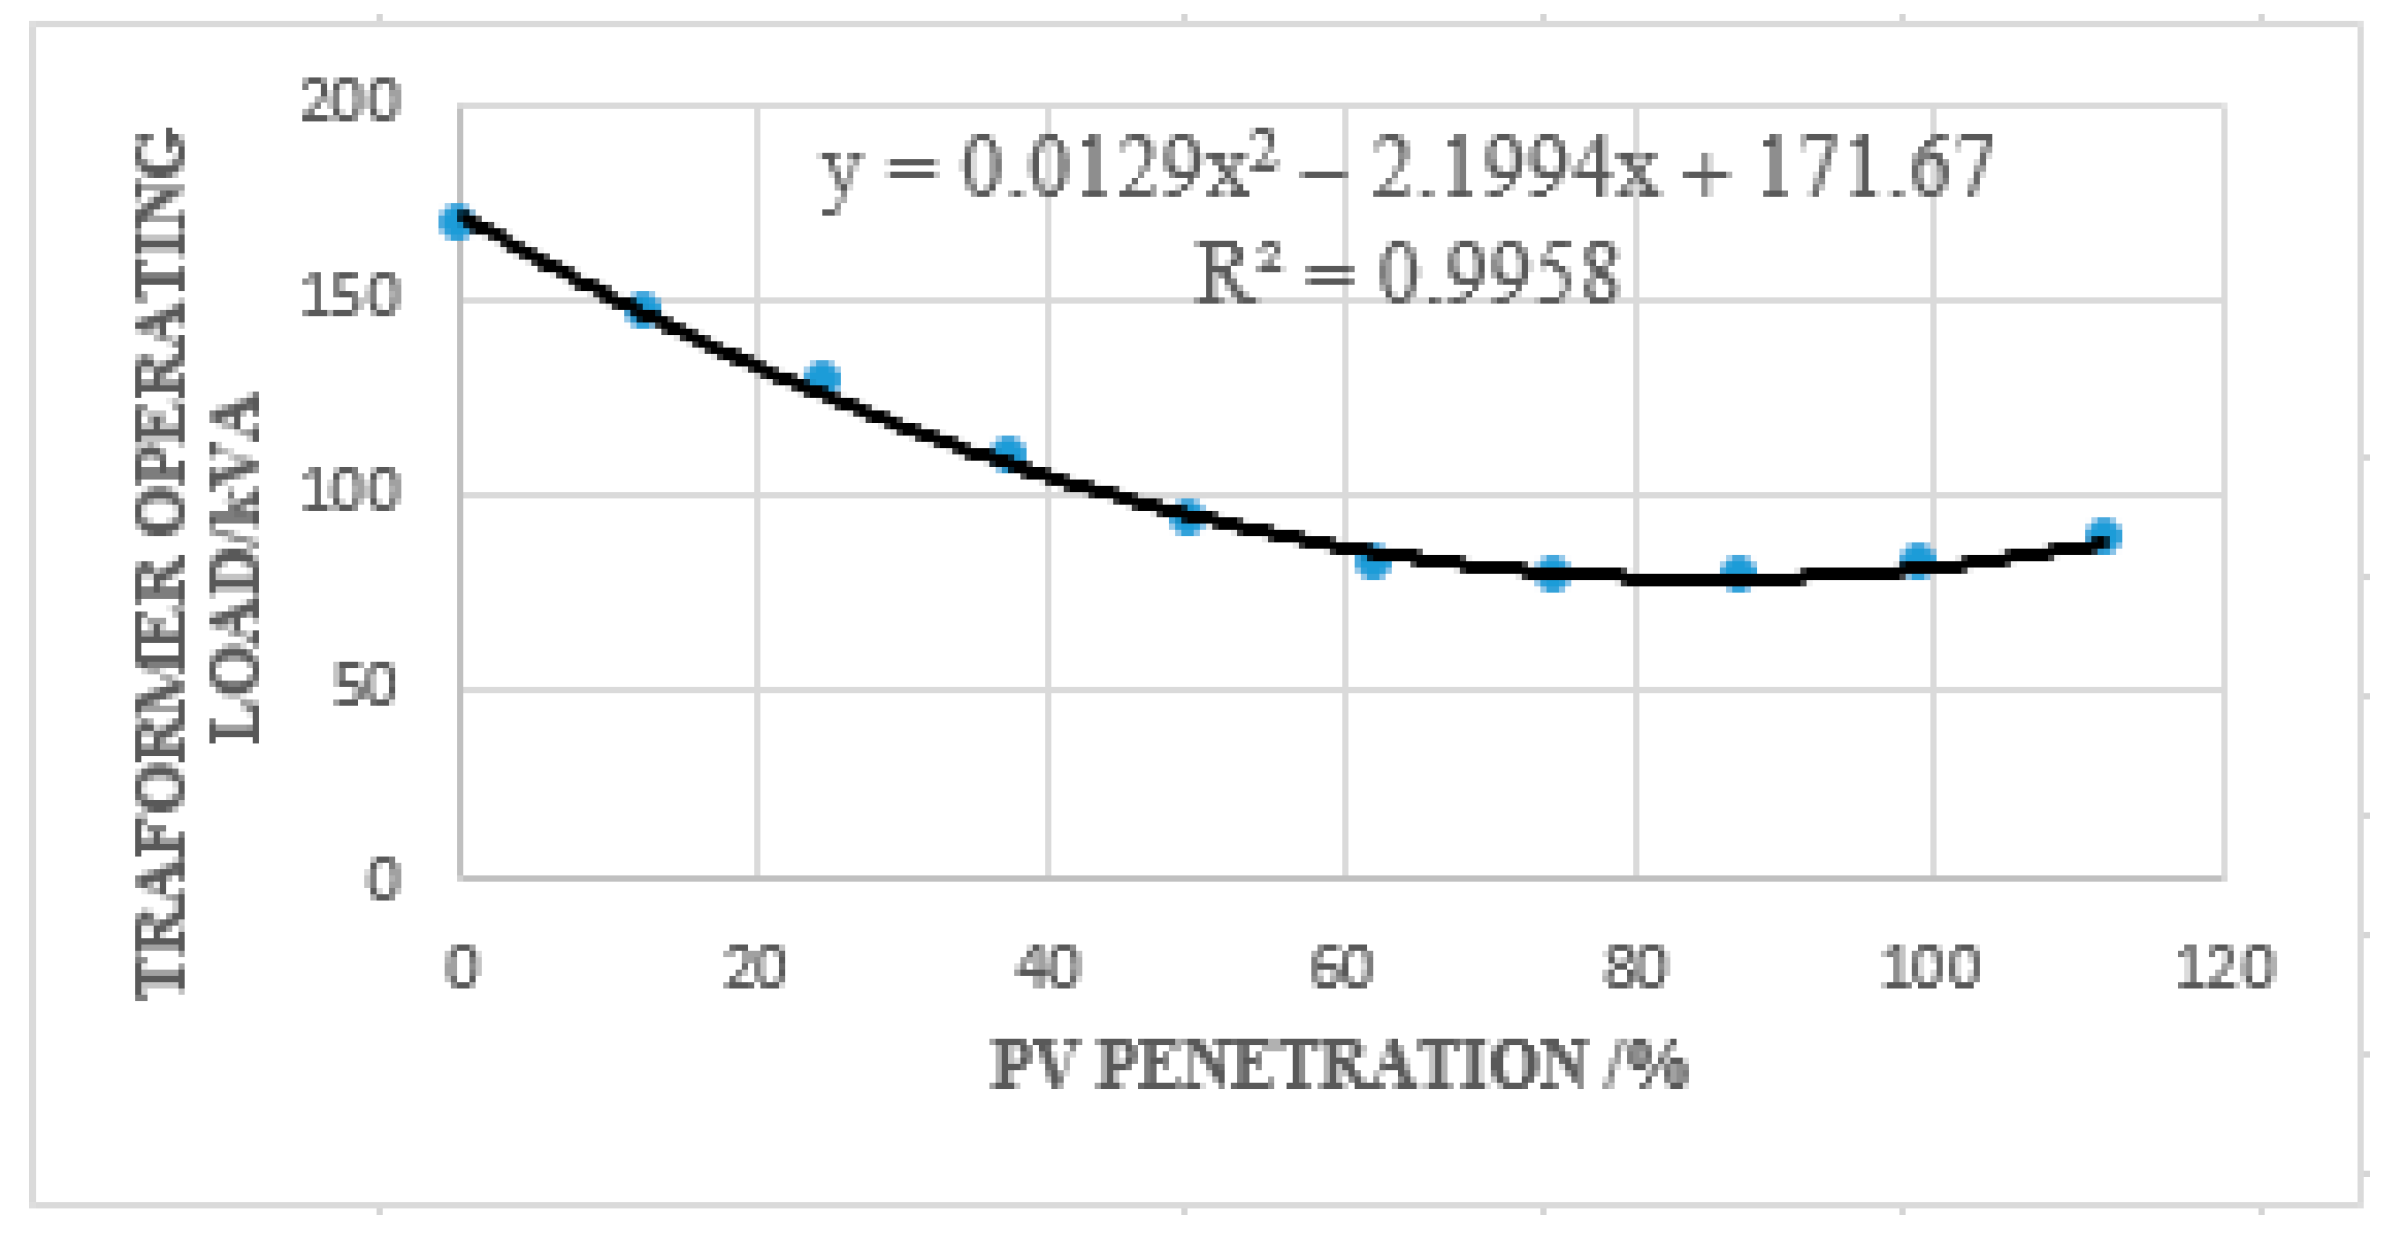
4.1.1. Transformer kVA Loading

As the PV penetration increases, the transformer operating load (kVA) decreases. In this case, capacity is freed at the transformer due to solar production in the network. Further PV penetration results in reversed power flow, leading to current reversal into the substation transformer. Figure 4 is the characteristic graph showing the transformer decreasing operating kVA loading with an increase in PV penetration. The turning point indicates current reversal into the substation transformer. The increased RPF increases the transformer operating load beyond full load conditions [23]. Reference [16] obtained similar results for impact studies in the MV/LV substation transformers.

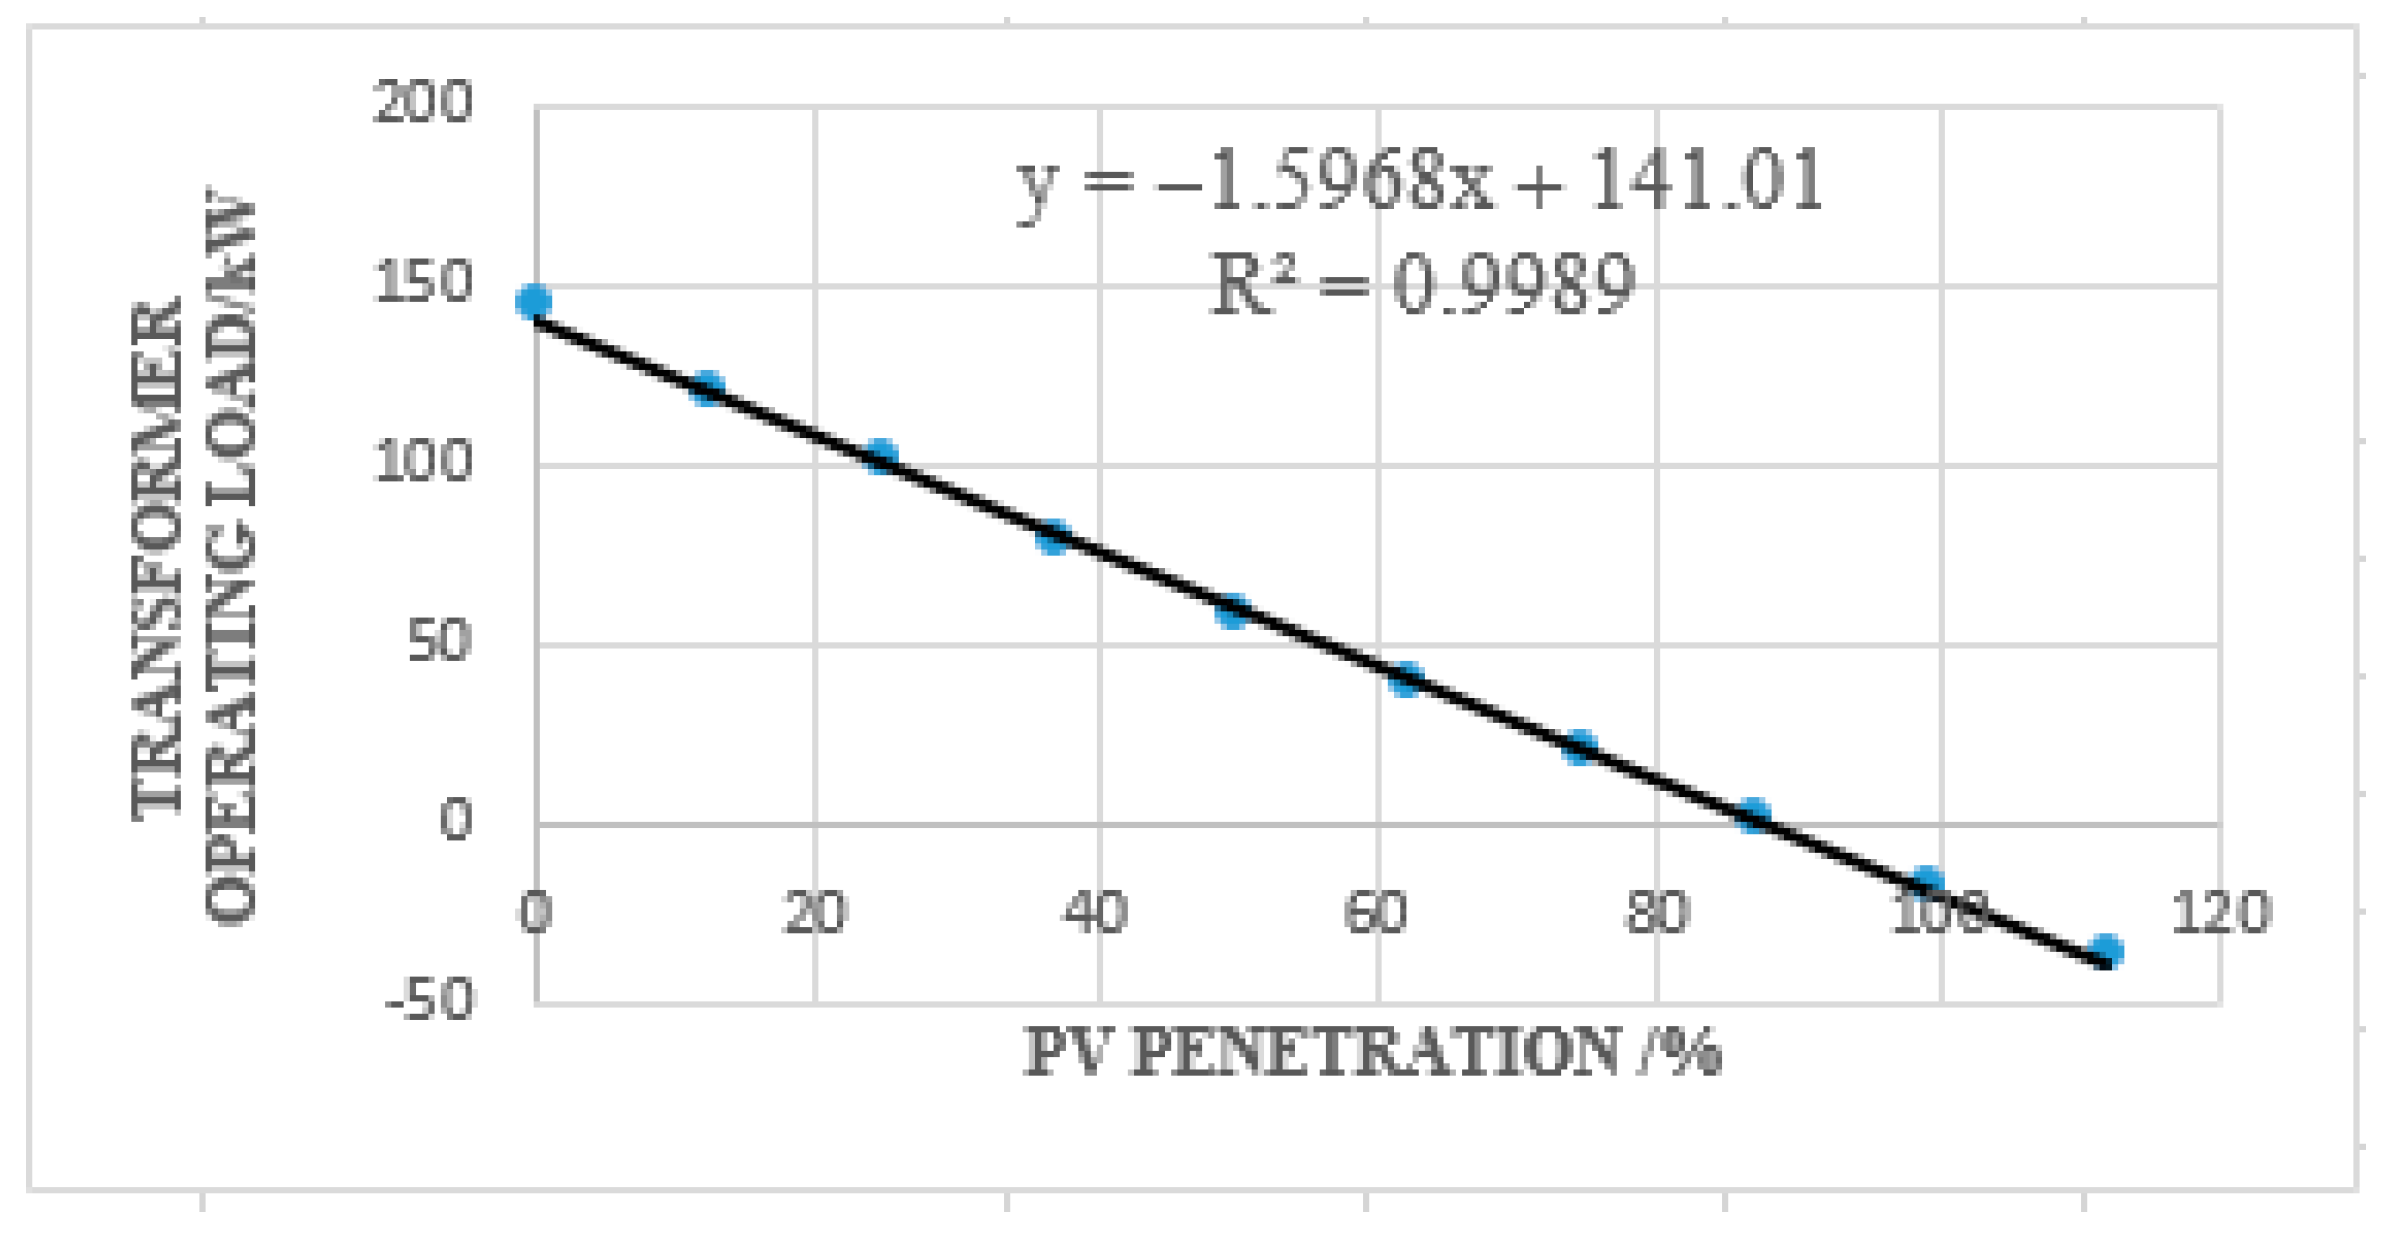
4.1.2. Transformer kW Loading

Figure 5 characterises the transformer’s active power flow per penetration, resulting from increased PV injection into the network. This shows a negative linear relationship between the active power operating load and the PV depth of penetration. The graph involves a sign change at the zero-crossing, beyond which reverse power flows. A similar result is obtained in [55] for the line real power in the IEEE 9-bus system under high PV impact. The maximum depth of penetration is determined at the zero-crossing point.

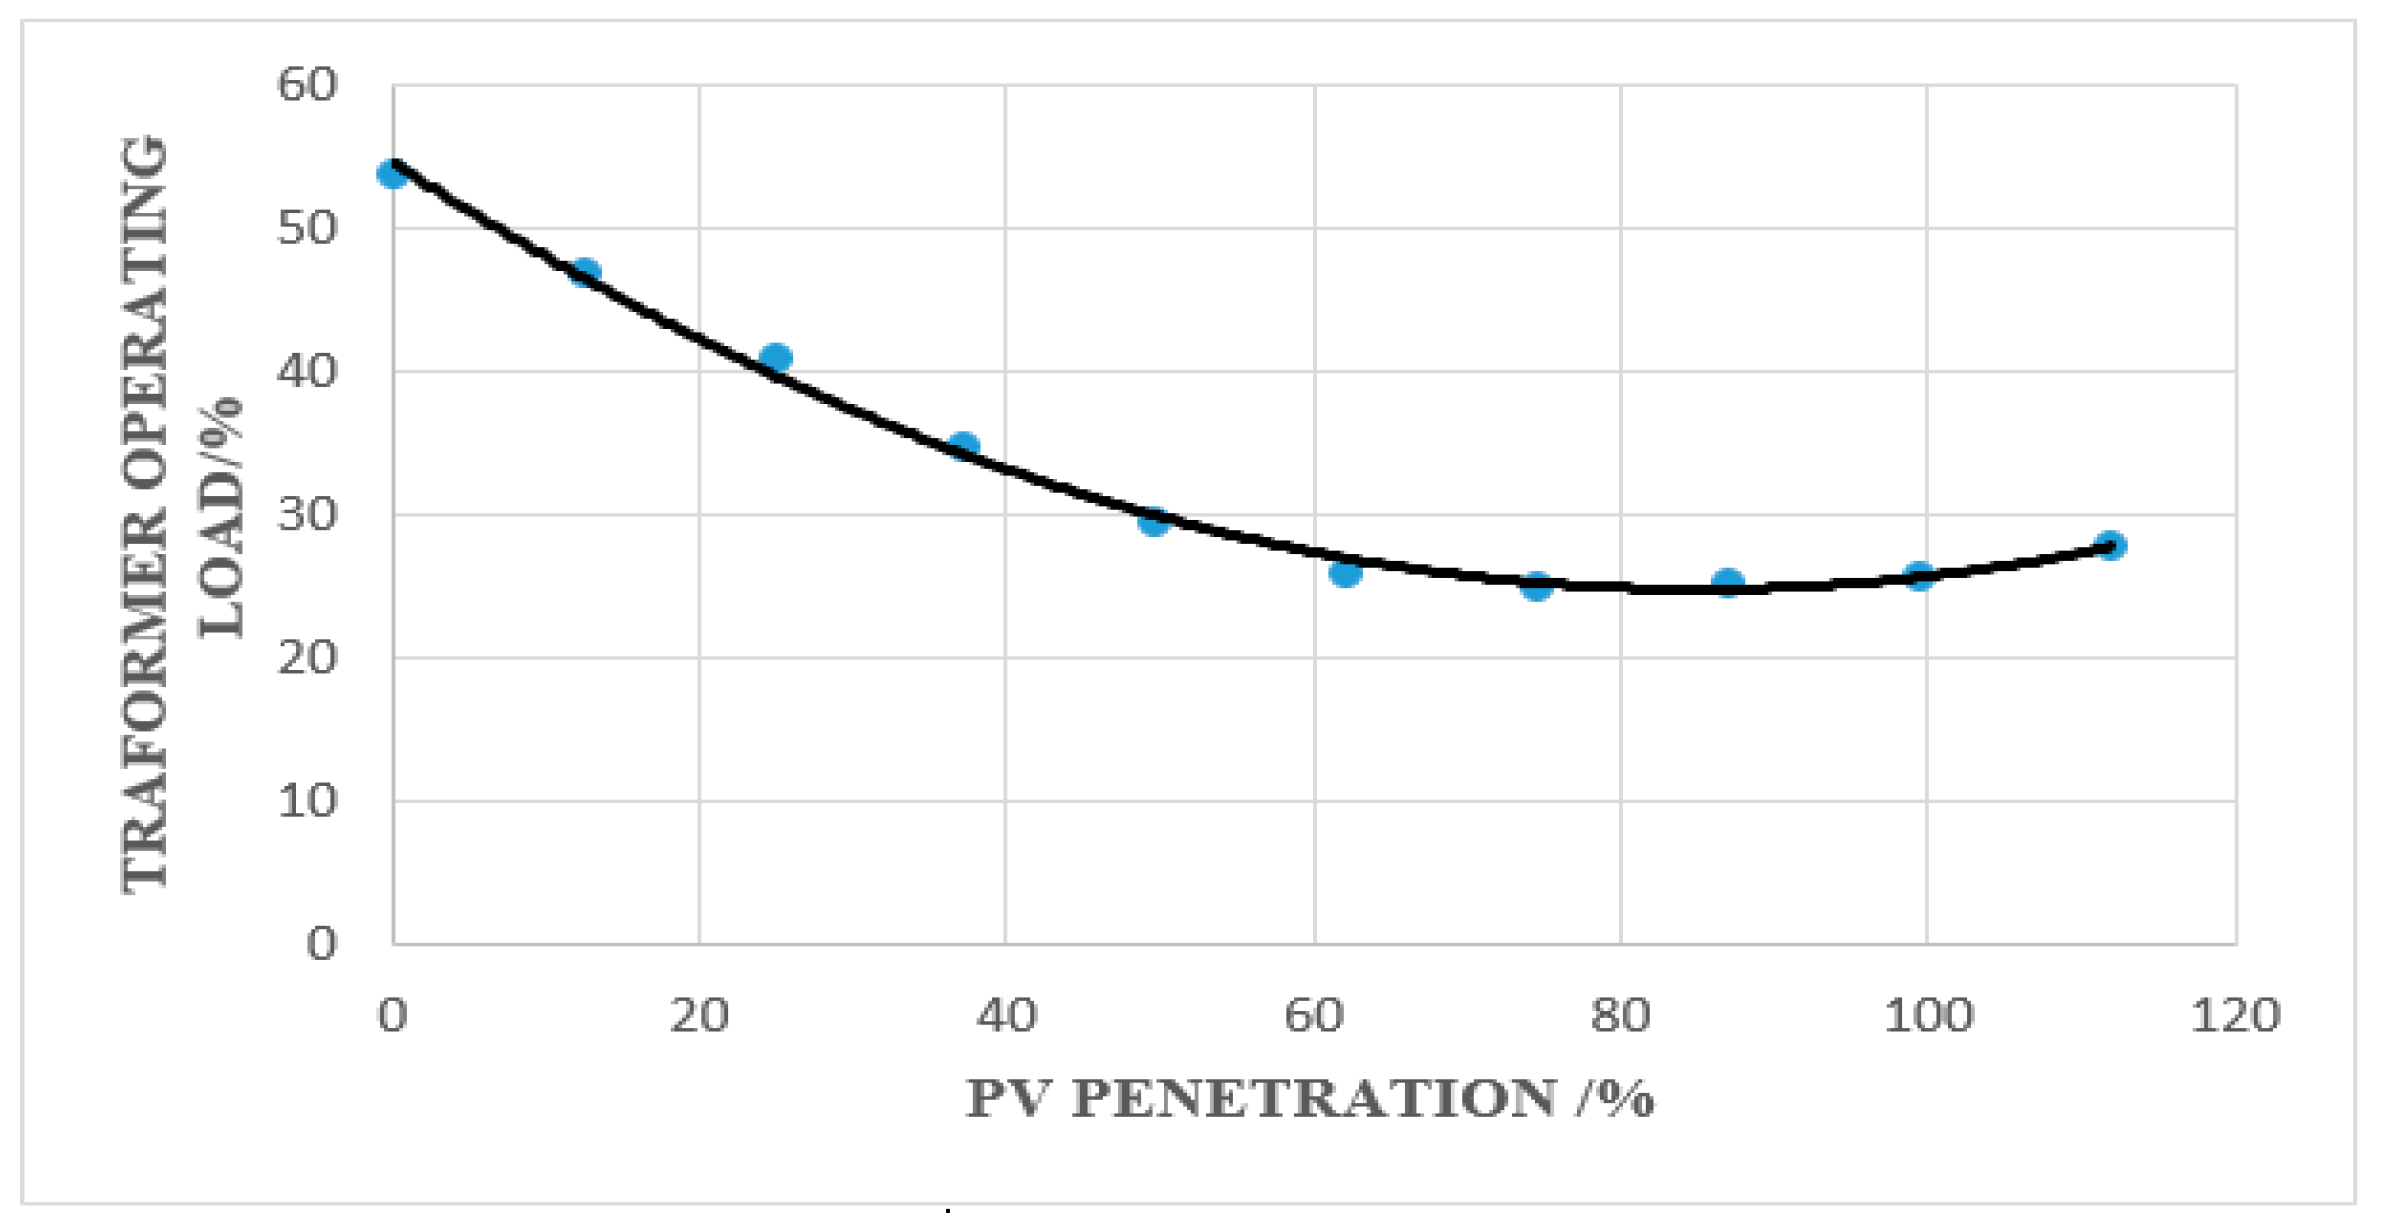
4.1.3. Transformer Percentage Loading

Transformer loadings are required to meet the requirement for loads and load growth in a distribution system. With the increased solar PV penetration, capacity is initially freed up to reduce the percentage loading on the substation transformer. In Figure 6, it is shown that beyond the maximum penetration level of 88.3%, the percentage loading increases.
Reference [1] obtained similar results on the effect of high-impact PV in an LV network transformer. It is also shown that the overload conditions increase the transformer load losses beyond the maximum depth of PV penetration.

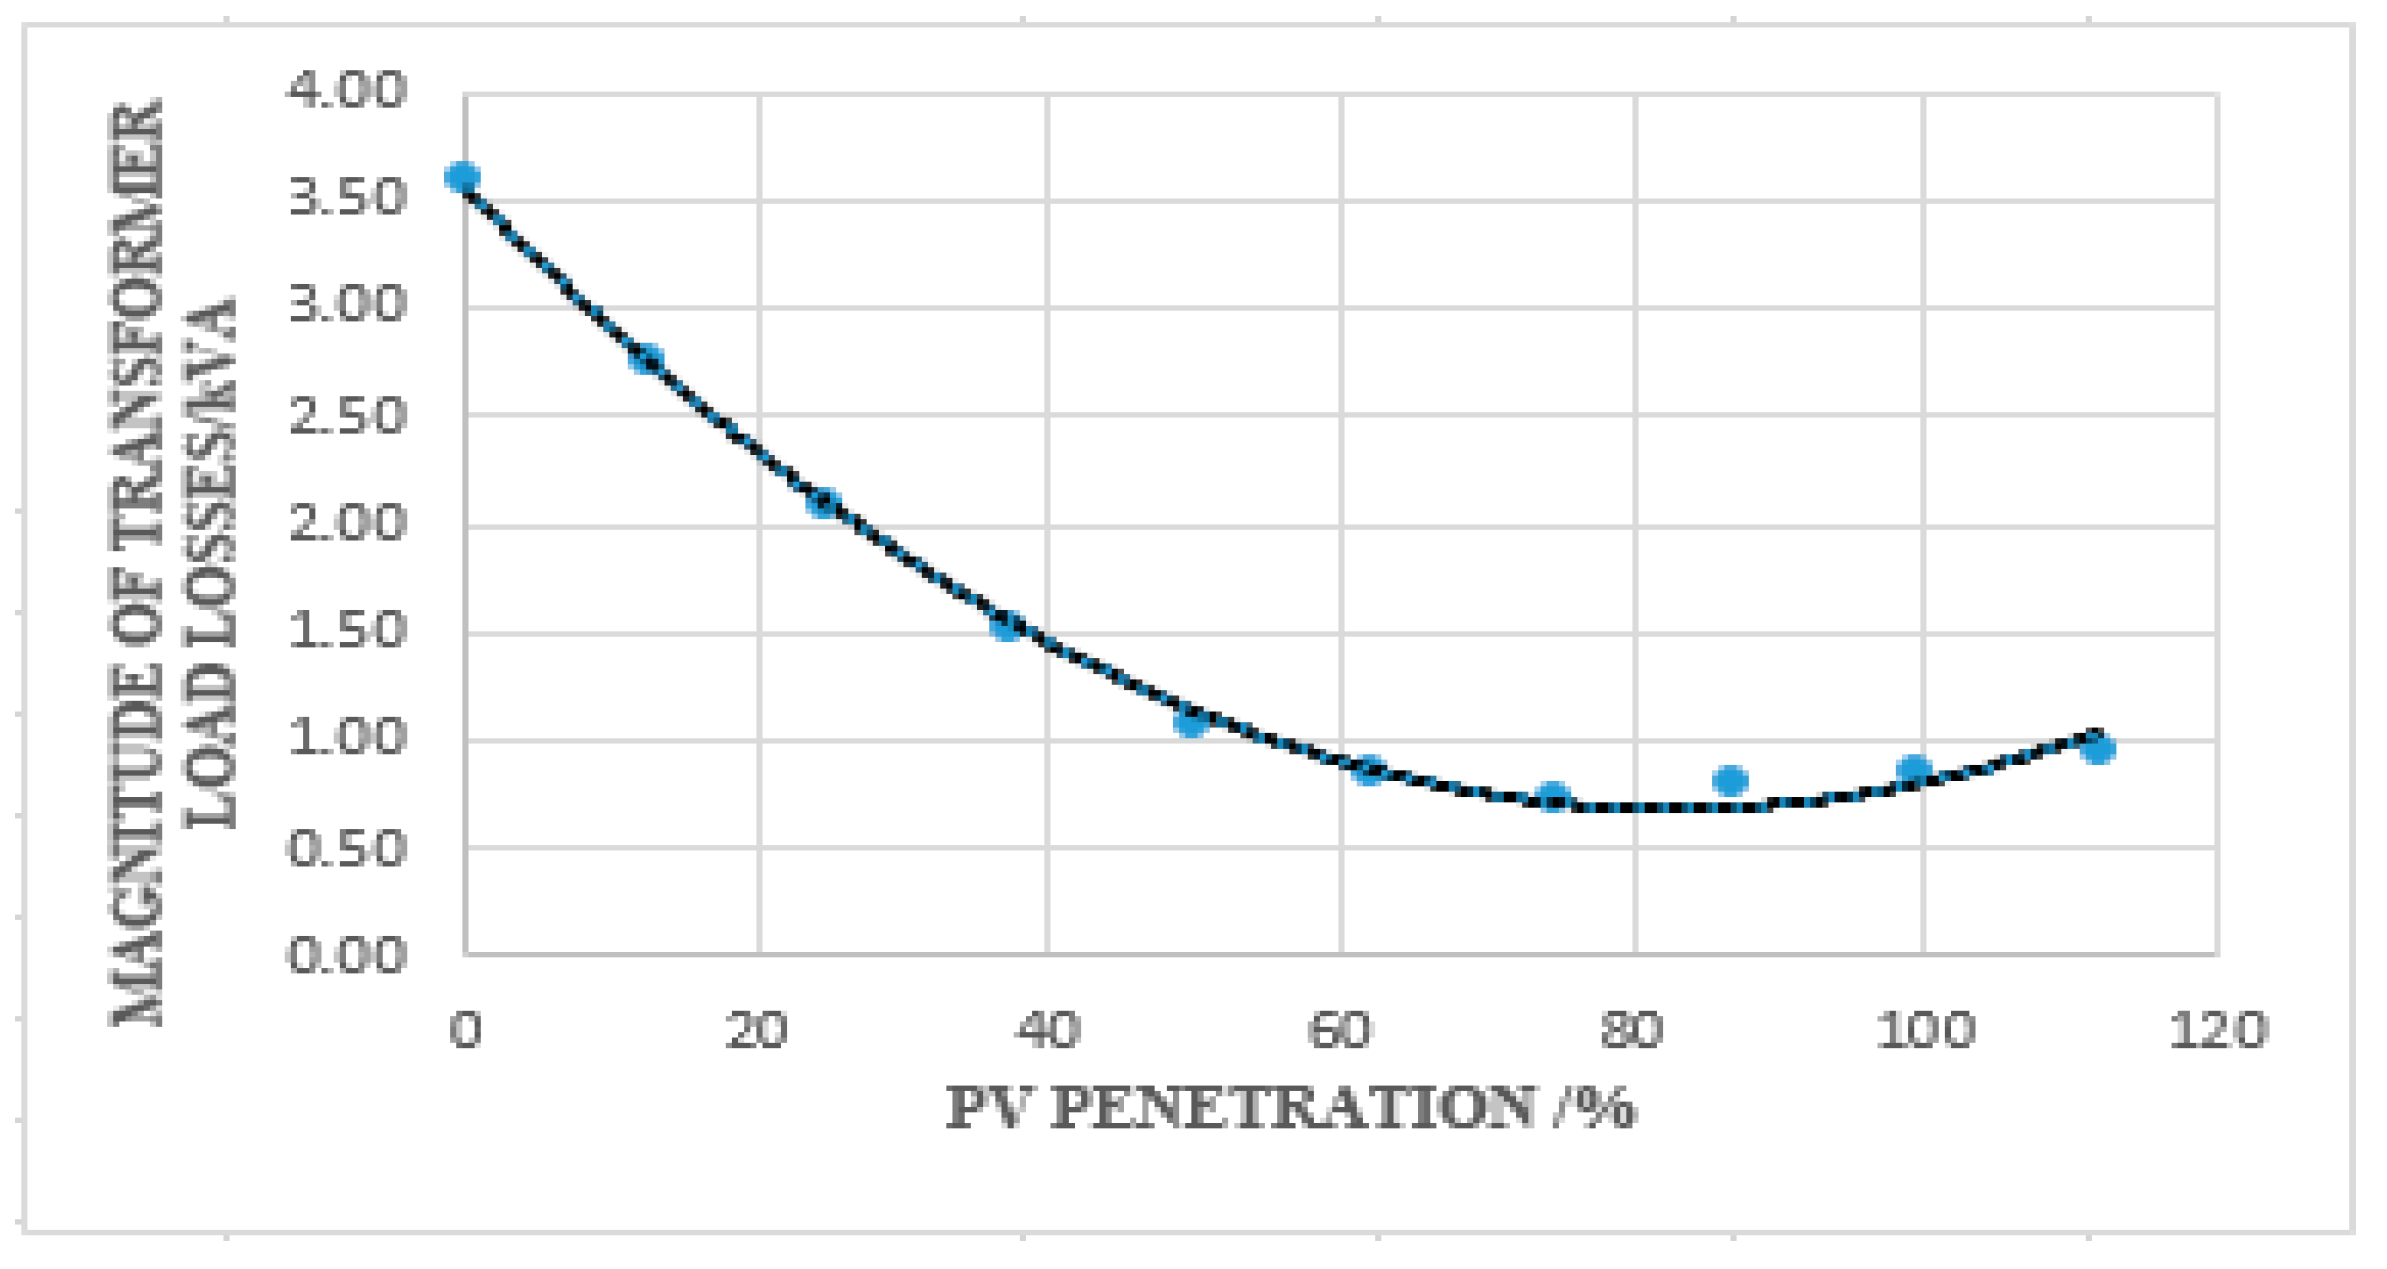
4.1.4. Transformer Load Losses

The impact of PV penetration on system losses is illustrated in Figure 6. The magnitude of the transformer load losses decreases when the PV penetration is increased. When the PV generation increases, capacity is freed on the grid, resulting in reduced losses in the transformer. At one particular point and beyond, the PV generation exceeds the local demand and RPF occurs, which could overload the transformer. Overloaded transformers incur more load losses as a result of increased active and reactive currents. In Figure 7, it is observed that the magnitude of the losses follows a U-shaped curve such that increasing the penetration level decreases energy losses; however, beyond 88.30% penetration the losses start to increase. Reference [55] obtained similar results for overall system losses for the IEEE 9-bus system. Using photovoltaic micro-installations in a low-voltage network, the authors in [56] obtained similar results for the system losses while considering variable weather conditions.

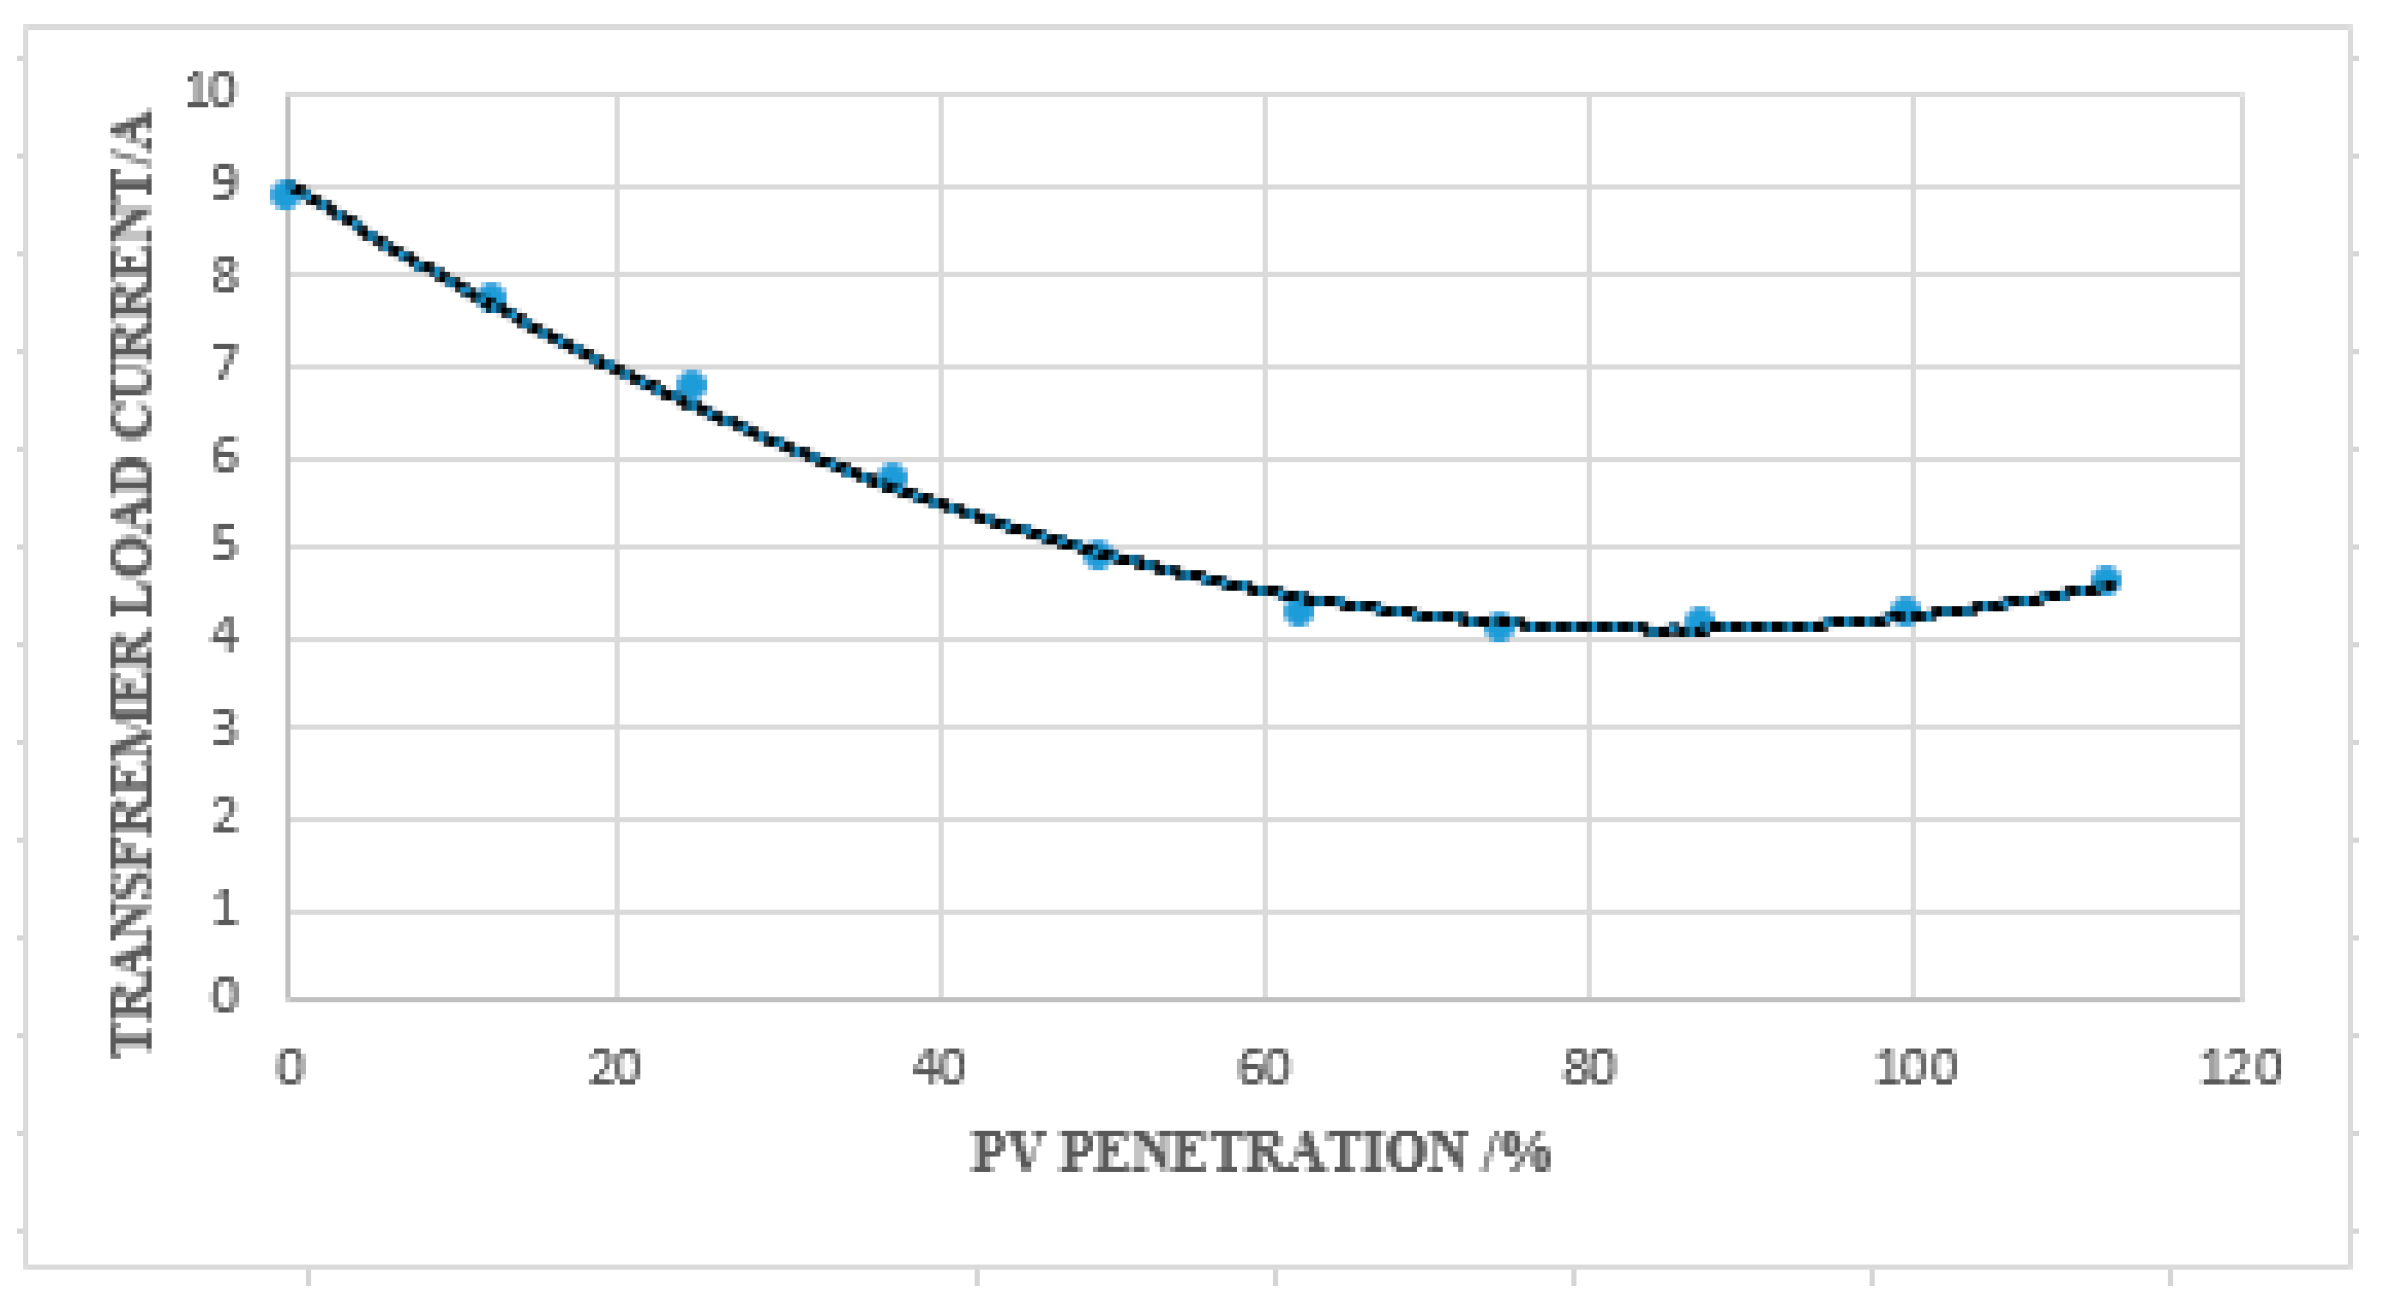
4.1.5. Transformer Load Current

The impact of PV penetration on transformer loading parameters must be considered while planning the network [57]. In general, the capacity of the substation transformer to accommodate power flow with the injection of solar PV is limited by the thermal current rating of the transformer [58]. It is observed in Figure 8 that the PV penetration initially reduces the load current, freeing up capacity on the transformer. As the penetration increases, resulting in RPF, the load current starts to increase. As the case shows, successive penetrations of the PV system would increase the load current beyond the full load current rating to damage the transformer.

4.1.6. Overloading of Distribution Transformers

In a continuous operation, distribution transformers should not be loaded beyond their power ratings. Overloading a transformer can reduce its lifespan [26]. In some cases, however, harmonics can cause a transformer to generate heat. This means that, though the transformer is not overloaded, harmonic loads in the network can cause high currents to overheat the transformer [59]. In the case of solar PV penetration into the LV network, reverse power flows into the substation transformer, overloading it beyond its rated power. Therefore, increased penetration must be limited to prevent cases of transformer overload due to reverse power flow. These limitations are different from the backflow limits due to reverse power flow in a PV-connected grid system considered in this study.

4.2. Transformer Backflow and Overload Limits

In this study, loading criteria are set for the substation transformer based on solar PV penetration. Base case limit criteria are, however, necessary for comparing the load limits of the transformer without PV injection and with PV injection. The base case requires that the transformer be loaded at its rated value to determine the maximum operating parameters for safe operations. In Table 7, the operating parameters for transformer overload at zero penetration are shown. A 100% operating load corresponds to 315.1 kVA and 265 kW operating apparent power and active power, respectively. Beyond these threshold values, the transformer is overloaded.
Sustained and increased reverse power flow can result in transformer overload beyond its rated value [57]. With solar PV injection, each distribution circuit should have a maximum capacity for accommodating distributed production. In the present study, this implies that when the installed generation on a circuit has reached its maximum, at a point just before RPF, no further applications can be accepted for a solar PV unit, regardless of size. This is the basic idea behind this research. Hence, the statistical models obtained from the simulation results are used to interpolate results for the critical backflow limits of the distribution transformer. At a critical state of current flow, the net power flow in the transformer is zero, referring to (6). The model for the transformer’s active power, P T kW , obtained from Figure 5, is presented as follows:
P T kW = 1.60 D + 141.01
Equation (15) predicts the active power flow at each solar PV depth of penetration. Hence, the maximum depth of penetration at the zero-crossing point, beyond which RPF exists, can be estimated. When this threshold is exceeded, RPF begins to develop and the active power component of the transformer loadings adopts negative values. In this scenario, the transformer net current decreases to a critical minimum value of 4.28 A and begins to rise in the reverse direction towards the medium voltage substation within the reverse power flow mode (Figure 8). The model in (16) obtained from Figure 4 predicts the transformer operating kVA at various PV depths of penetrations:
P T kVA = 0.0129 D 2 2.1994 D + 171.67
Using the models in (15) and (16), the maximum depth of penetration is estimated as 88.30%, which corresponds to transformer backflow limits of 78.04 kVA and 24.77%, respectively (Table 7). At the maximum depth of penetration, the predicted load current, beyond which reverse power flow can be found, is 4.28 A. It is observed that the loading limits with and without PV penetration are significantly wide apart. This is because the backflow limits are supposed to be the minimum operating conditions of the transformer just before reverse power flows. With increased PV penetration, these operating conditions approach the overload conditions of the transformer obtained in the base case scenario. This can be a result of sustained and increasing reverse power flow beyond the backflow limits.
From the above analysis, it follows that the advanced knowledge of these backflow limits necessitates control schemes to prevent damage to protection systems. In addition, the technique is necessary for system planning purposes, especially for the adoption of battery energy storage systems [28].
The implementation of the techniques in this study faces several challenges. We assumed lumped-distributed loads without regard to the load distributions in the phases. Loads were also modelled as static loads, which are not true representations of the constantly changing load patterns in a real network. The study does not consider the temporal and spatial variations in solar PV output across the network.
Furthermore, the PV production is dispersed across the grid, which minimises current violations more than if the PV production were concentrated in a single location. Additionally, the results obtained are tailored to the grid layout and load profiles for a typical urban network. Other regions with differing load patterns have to be explored on an individual basis. However, this should not have an impact on the case study’s applicability.

5. Conclusions

One of the concerns of utility planners is the loss or degradation of transformer life caused by an overload due to increased PV penetration. Studies show that reverse power flow due to increased PV penetration creates overload conditions in substation transformers. To mitigate this, researchers suggest utilising various control energy storage schemes to store excess PV production during peak load periods.
However, the methodology adopted in this study is to find transformer operating thresholds for reverse power flow, which can result in overload conditions as a result of excessive PV penetration. Using simulation results from a radial test LV network, a statistical approach is used to create correlation models between solar PV penetration depth and transformer operating loads.
The correlation models predict transformer backflow limits due to high solar PV grid penetration as follows: Based on the transformer loading threshold, a maximum depth of penetration of 88.30% is obtained. At this penetration limit, interpolations using correlation models indicate transformer backflow operating load limits of 78.04 kVA and 24.77% at an operating current of 4.28 A. These limitations are contrasted with the transformer overload criteria, determined without PV penetration to demonstrate how a sustained and increasing reverse power flow, which exceeds the backflow limits, can cause transformer overload.
The simulation studies’ results provide useful information not only on the impact of RPF on distribution transformer loadings but also on the depth of penetration in a solar PV-integrated LV network. The study determines a set of safe margins to safeguard the flow of reverse power into the substation transformer. Further studies to investigate the impacts of PV penetration should consider new mitigation techniques aimed at protecting substation transformers from overload conditions with high PV penetration. The backflow limitations must be established for the entire network heuristically by performing typical-year simulations.

Author Contributions

Conceptualization, I.B.M.; Formal analysis, N.I.N.; Methodology, I.B.M.; Software, I.B.M.; Supervision, N.I.N.; Writing—original draft, I.B.M.; Writing—review and editing, N.I.N. All authors have read and agreed to the published version of the manuscript.

Funding

This research received no external funding.

Data Availability Statement

Not applicable.

Acknowledgments

The authors would like to acknowledge the technical support provided by the Electricity Company of Ghana (ECG) in providing needed data for this research.

Conflicts of Interest

The authors declare no conflict of interest.

References

  1. Kenneth, A.P.; Folly, K. Voltage Rise Issue with High Penetration of Grid Connected PV. IFAC Proc. Vol. 2014, 19, 4959–4966. [Google Scholar] [CrossRef]
  2. Dondariya, C.; Porwal, D.; Awasthi, A.; Shukla, A.K.; Sudhakar, K.; Murali, M.M.; Bhimte, A. Performance Simulation of Grid-Connected Rooftop Solar PV System for Small Households: A Case Study of Ujjain, India. Energy Rep. 2018, 4, 546–553. [Google Scholar] [CrossRef]
  3. Panigrahi, R.; Mishra, S.K.; Srivastava, S.C.; Srivastava, A.K.; Schulz, N.N. Grid Integration of Small-Scale Photovoltaic Systems in Secondary Distribution Network—A Review. IEEE Trans. Ind. Appl. 2020, 56, 3178–3195. [Google Scholar] [CrossRef]
  4. Chathurangi, D.; Jayatunga, U.; Perera, S.; Agalgaonkar, A.P.; Siyambalapitiya, T. A Nomographic Tool to Assess Solar PV Hosting Capacity Constrained by Voltage Rise in Low-Voltage Distribution Networks. Int. J. Electr. Power Energy Syst. 2022, 134, 107409. [Google Scholar] [CrossRef]
  5. Kadir, A.F.A.; Khatib, T.; Elmenreich, W. Integrating Photovoltaic Systems in Power System: Power Quality Impacts and Optimal Planning Challenges. Int. J. Photoenergy 2014, 2014, 321826. [Google Scholar]
  6. Ismael, S.M.; Aleem, S.H.E.A.; Abdelaziz, A.Y.; Zobaa, A.F. Probabilistic Hosting Capacity Enhancement in Non-Sinusoidal Power Distribution Systems Using a Hybrid PSOGSA Optimization Algorithm. Energies 2019, 12, 1018. [Google Scholar] [CrossRef] [Green Version]
  7. Holguin, J.P.; Rodriguez, D.C.; Ramos, G. Reverse Power Flow (RPF) Detection and Impact on Protection Coordination of Distribution Systems. IEEE Trans. Ind. Appl. 2020, 56, 2393–2401. [Google Scholar] [CrossRef]
  8. Saad, S.N.M.; van der Weijde, A.H. Evaluating the Potential of Hosting Capacity Enhancement Using Integrated Grid Planning Modeling Methods. Energies 2019, 12, 3610. [Google Scholar] [CrossRef] [Green Version]
  9. Afonaa-Mensah, S.; Wang, Q.; Uzoejinwa, B.B. Investigation of Daytime Peak Loads to Improve the Power Generation Costs of Solar-Integrated Power Systems. Int. J. Photoenergy 2019, 2019, 5986874. [Google Scholar] [CrossRef]
  10. Cohen, M.A.; Callaway, D.S. Effects of Distributed PV Generation on California’s Distribution System, Part 1: Engineering Simulations. Sol. Energy 2016, 128, 126–138. [Google Scholar] [CrossRef]
  11. Agah, S.M.M.; Abyaneh, H.A. Quantification of the Distribution Transformer Life Extension Value of Distributed Generation. IEEE Trans. Power Deliv. 2011, 26, 1820–1828. [Google Scholar] [CrossRef]
  12. Von Appen, J.; Braun, M.; Stetz, T.; Diwold, K.; Geibel, D. Time in the sun: The challenge of high PV penetration in the German electric grid. IEEE Power Energy Mag. 2013, 11, 55–64. [Google Scholar] [CrossRef]
  13. Jahangiri, P.; Aliprantis, D.C. Distributed Volt/VAr Control by PV Inverters. IEEE Trans. Power Syst. 2013, 28, 3429–3439. [Google Scholar] [CrossRef]
  14. Ameur, A.; Berrada, A.; Loudiyi, K.; Aggour, M. Analysis of Renewable Energy Integration into the Transmission Network. Electr. J. 2019, 32, 106676. [Google Scholar] [CrossRef]
  15. Mulenga, E.; Bollen, M.H.J.; Etherden, N. Distribution Networks Measured Background Voltage Variations, Probability Distributions Characterization and Solar PV Hosting Capacity Estimations. Electr. Power Syst. Res. 2021, 192, 106979. [Google Scholar] [CrossRef]
  16. Ebe, F.; Idlbi, B.; Morris, J.; Heilscher, G.; Meier, F. Evaluation of PV Hosting Capacities of Distribution Grids with Utilisation of Solar Roof Potential Analyses. CIRED—Open Access Proceedings Journal 2017, 2017, 2265–2269. [Google Scholar] [CrossRef]
  17. Sharma, V.; Aziz, S.M.; Haque, M.H.; Kauschke, T. Effects of High Solar Photovoltaic Penetration on Distribution Feeders and the Economic Impact. Renew. Sustain. Energy Rev. 2020, 131, 110021. [Google Scholar] [CrossRef]
  18. Guo, Y.; Wu, Q.; Gao, H.; Shen, F. Distributed Voltage Regulation of Smart Distribution Networks: Consensus-Based Information Synchronization and Distributed Model Predictive Control Scheme. Int. J. Electr. Power Energy Syst. 2019, 111, 58–65. [Google Scholar] [CrossRef]
  19. Daher, N.A.; Saliba, L.; Mougharbel, I.; Kanaan, H.Y.; Saad, M. Hybrid Algorithm for Monitoring Reverse Power Flow & Ause G E\Distributed Renewable Energy Sources. In Proceedings of the 2020 5th International Conference on Renewable Energies for Developing Countries (REDEC), Marrakech, Morocco, 29–30 June 2020; Volume 5, pp. 8–11. [Google Scholar]
  20. Torres, I.C.; Negreiros, G.F.; Tiba, C. Theoretical and Experimental Study to Determine Voltage Violation, Reverse Electric Current and Losses in Prosumers Connected to Low-Voltage Power Grid. Energies 2019, 12, 4568. [Google Scholar] [CrossRef] [Green Version]
  21. Aziz, T.; Ketjoy, N. PV Penetration Limits in Low Voltage Networks and Voltage Variations. IEEE Access 2017, 5, 16784–16792. [Google Scholar] [CrossRef]
  22. Hajeforosh, S.F.; Khatun, A.; Bollen, M. Enhancing the Hosting Capacity of Distribution Transformers for Using Dynamic Component Rating. Int. J. Electr. Power Energy Syst. 2022, 142, 108130. [Google Scholar] [CrossRef]
  23. Awadallah, M.A.; Xu, T.; Venkatesh, B.; Member, S.; Singh, B.N. On the Effects of Solar Panels on Distribution Transformers. IEEE Trans. Power Deliv. 2016, 31, 1176–1185. [Google Scholar] [CrossRef]
  24. Wang, X.; Dsouza, K.; Tang, W.; Baran, M. Assessing the Impact of High Penetration PV on the Power Transformer Loss of Life on a Distribution System. In Proceedings of the 2021 IEEE PES Innovative Smart Grid Technologies Europe (ISGT Europe), Espoo, Finland, 18–21 October 2021; pp. 8–12. [Google Scholar] [CrossRef]
  25. Upadhyay, P.; Kern, J.; Vadlamani, V. Distributed Energy Resources (Ders): Impact of Reverse Power Flow on Transformer. CIGRE Sci. Eng. 2020, 19, 99–107. [Google Scholar]
  26. Manito, A.R.A.; Pinto, A.; Zilles, R. Evaluation of Utility Transformers’ Lifespan with Different Levels of Grid-Connected Photovoltaic Systems Penetration. Renew. Energy 2016, 96, 700–714. [Google Scholar] [CrossRef]
  27. Affonso, C.D.M.; Kezunovic, M. Technical and Economic Impact of Pv-Bess Charging Station on Transformer Life: A Case Study. IEEE Trans. Smart Grid 2019, 10, 4683–4692. [Google Scholar] [CrossRef]
  28. Novoa, L.; Flores, R.; Brouwer, J. Optimal Renewable Generation and Battery Storage Sizing and Siting Considering Local Transformer Limits. Appl. Energy 2019, 256, 113926. [Google Scholar] [CrossRef]
  29. Rafael, F.; Sevilla, S.; Knazkins, V.; Korba, P.; Kienzle, F. Limiting Transformer Overload on Distribution Systems with High Penetration Limiting Transformer Overload on Distribution Systems with High Penetration of PV Using Energy Storage Systems. Int. J. Emerg. Technol. Adv. Eng. 2016, 6, 294–303. [Google Scholar]
  30. De Carne, G.; Buticchi, G.; Zou, Z.; Liserre, M. Reverse Power Flow Control in a ST-Fed Distribution Grid. IEEE Trans. Smart Grid 2018, 9, 3811–3819. [Google Scholar] [CrossRef] [Green Version]
  31. Baroni, B.R.; Uturbey, W.; Costa, A.M.G.; Rocha, S.P. Impact of Photovoltaic Generation on the Allowed Revenue of the Utilities Considering the Lifespan of Transformers: A Brazilian Case Study. Electr. Power Syst. Res. 2021, 192, 106906. [Google Scholar] [CrossRef]
  32. Uçar, B.; Bağrıyanık, M.; Kömürgöz, G. Influence of PV Penetration on Distribution Transformer Aging. J. Clean Energy Technol. 2017, 5, 131–134. [Google Scholar] [CrossRef] [Green Version]
  33. El Batawy, S.A.; Morsi, W.G. On the Impact of High Penetration of Rooftop Solar Photovoltaics on the Aging of Distribution Transformers. Can. J. Electr. Comput. Eng. 2017, 40, 93–100. [Google Scholar] [CrossRef]
  34. Pezeshki, H.; Wolfs, P.J.; Ledwich, G. Impact of High PV Penetration on Distribution Transformer Insulation Life. IEEE Trans. Power Deliv. 2014, 29, 1212–1220. [Google Scholar] [CrossRef]
  35. Pollock, J.; Hill, D. Overcoming the Issues Associated with Operating a Distribution System in Reverse Power Flow. IET Conf. Publ. 2016, 2016, 2–7. [Google Scholar] [CrossRef]
  36. Liu, H.; Guo, Y.; Ge, S.; Zhao, M. Impact of DG Configuration on Maximum Use of Load Supply Capability in Distribution Power Systems. J. Appl. Math. 2014, 2014, 136726. [Google Scholar] [CrossRef] [Green Version]
  37. Anto, E.K.; Frimpong, E.A.; Okyere, P.Y. Impact Assessment of Increasing Solar PV Penetrations on Voltage and Total Harmonic Distortion of a Distribution Network. J. Multidiscip. Eng. Sci. Stud. 2015, 1, 116–127. [Google Scholar]
  38. Obeng, M.; Gyam, S.; Sarfo, N.; Kabo-bah, A.T. Technical and Economic Feasibility of a 50 MW Grid-Connected Solar PV at UENR Nsoatre Campus. J. Clean Prod. 2020, 247, 119159. [Google Scholar] [CrossRef]
  39. Kwofie, E.A.; Mensah, G.; Anto, E.K. Determination of the Optimal Power Factor at Which DG PV Should Be Operated. In Proceedings of the 2017 IEEE PES PowerAfrica, Accra, Ghana, 27–30 June 2017; pp. 391–395. [Google Scholar]
  40. Kwofie, E.A.; Mensah, G.; Antwi, V.S. Post Commission Grid Impact Assessment of a 20 MWp Solar PV Grid Connected System on the ECG 33 KV Network in Winneba. In Proceedings of the IEEE PES/IAS PowerAfrica Conference: Power Economics and Energy Innovation in Africa, PowerAfrica 2019, Abuja, Nigeria, 20–23 August 2019; pp. 521–526. [Google Scholar]
  41. Paghdar, S.; Sipai, U.; Ambasana, K.; Chauhan, P.J. Active and Reactive Power Control of Grid Connected Distributed Generation System. In Proceedings of the 2017 Second International Conference on Electrical, Computer and Communication Technologies (ICECCT), Coimbatore, India, 22–24 February 2017; pp. 1–7. [Google Scholar] [CrossRef]
  42. Sadeghian, H.; Athari, M.H.; Wang, Z. Optimized Solar Photovoltaic Generation in a Real Local Distribution Network. In Proceedings of the 2017 IEEE Power and Energy Society Innovative Smart Grid Technologies Conference, ISGT 2017, Washington, DC, USA, 23–26 April 2017; pp. 1–5. [Google Scholar]
  43. Alsafasfeh, Q.; Saraereh, O.A.; Khan, I.; Kim, S. Solar PV Grid Power Flow Analysis. Sustainability 2019, 11, 1744. [Google Scholar] [CrossRef] [Green Version]
  44. Gnanadass, B.M.R. Solar Integrated Time Series Load Flow Analysis for Practical Distribution System. J. Inst. Eng. Ser. B 2021, 102, 829–841. [Google Scholar] [CrossRef]
  45. Vinayagam, A.; Aziz, A.; PM, B.; Chandran, J.; Veerasamy, V.; Gargoom, A. Harmonics Assessment and Mitigation in a Photovoltaic Integrated Network. Sustain. Energy Grids Netw. 2019, 20, 100264. [Google Scholar] [CrossRef]
  46. Thomson, M.; Infield, D.G. Impact of Widespread Photovoltaics Generation on Distribution Systems. IET Renew. Power Gener. 2007, 1, 33–40. [Google Scholar] [CrossRef]
  47. Zain, M.; Ellabban, O.; Refaat, S.S.; Abu-rub, H.; Al-fagih, L. A Novel Methodology to Determine the Maximum PV Penetration in Distribution Networks. In Proceedings of the 2019 2nd International Conference on Smart Grid and Renewable Energy (SGRE), Doha, Qatar, 19–21 November 2019; pp. 1–6. [Google Scholar] [CrossRef]
  48. Kirui, K.P.; Murage, D.K.; Kihato, P.K. Fuse-Fuse Protection Scheme ETAP Model for IEEE 13 Node Radial Test Distribution Feeder. Eur. J. Eng. Res. Sci. 2019, 4, 224–234. [Google Scholar] [CrossRef]
  49. Setiawan, A.; Qashtalani, H.; Pranadi, A.D.; Ali, F.C.; Setiawan, E.A. Determination of Optimal PV Locations and Capacity in Radial Distribution System to Reduce Power Losses. Energy Procedia 2019, 156, 384–390. [Google Scholar] [CrossRef]
  50. Broderick, R.; Williaams, J.; Munoz-Ramos, K. Clustering Methods and Feeder Selection for PV System Impact Analysis. Available online: https://www.epri.com/research/products/000000003002002562 (accessed on 28 June 2022).
  51. Al-Saadi, H.; Zivanovic, R.; Al-Sarawi, S.F. Probabilistic Hosting Capacity for Active Distribution Networks. IEEE Trans. Ind. Inform. 2017, 13, 2519–2532. [Google Scholar] [CrossRef]
  52. Hoke, A.; Butler, R.; Hambrick, J.; Kroposki, B. Steady-State Analysis of Maximum Photovoltaic Penetration Levels on Typical Distribution Feeders. IEEE Trans. Sustain. Energy 2013, 4, 350–357. [Google Scholar] [CrossRef]
  53. Tsamaase, K.; Moyo, U.; Zibani, I.; Ngebani, I.; Mahindroo, P. Approximate Mathematical Model for Load Profiling and Demand Forecasting. IOSR J. Electr. Electron. Eng. (IOSR-JEEE) 2017, 12, 29–34. [Google Scholar] [CrossRef]
  54. Li, X.; Borsche, T.; Andersson, G. PV Integration in Low-Voltage Feeders with Demand Response. In Proceedings of the 2015 IEEE Eindhoven PowerTech, Eindhoven, The Netherlands, 29 June–2 July 2015. [Google Scholar] [CrossRef] [Green Version]
  55. Khan, M.A.; Arbab, N.; Huma, Z. Voltage Profile and Stability Analysis for High Penetration Solar Photovoltaics. Int. J. Eng. Work. 2018, 5, 109–114. [Google Scholar]
  56. Korab, R.; Połomski, M.; Smołka, M. Evaluating the Risk of Exceeding the Normal Operating Conditions of a Low-Voltage Distribution Network Due to Photovoltaic Generation. Energies 2022, 15, 1969. [Google Scholar] [CrossRef]
  57. Datta, U.; Kalam, A.; Shi, J. Smart Control of BESS in PV Integrated EV Charging Station for Reducing Transformer Overloading and Providing Battery-to-Grid Service. J. Energy Storage 2020, 28, 101224. [Google Scholar] [CrossRef]
  58. Raouf Mohamed, A.A.; Best, R.J.; John Morrow, D.; Cupples, A.; Bailie, I. Impact of the Deployment of Solar Photovoltaic and Electrical Vehicle on the Low Voltage Unbalanced Networks and the Role of Battery Energy Storage Systems. J. Energy Storage 2021, 42, 102975. [Google Scholar] [CrossRef]
  59. Yaghoobi, J.; Alduraibi, A.; Martin, D.; Zare, F.; Eghbal, D.; Memisevic, R. Impact of High-Frequency Harmonics (0–9 KHz) Generated by Grid-Connected Inverters on Distribution Transformers. Int. J. Electr. Power Energy Syst. 2020, 122, 106177. [Google Scholar] [CrossRef]
Figure 1. Equivalent circuit of a PV grid interphase.
Energies 15 09238 g001
Figure 2. Design framework for distribution transformer assessment due to the impact of reverse power flow in a PV solar-photovoltaic-integrated low-voltage network.
Energies 15 09238 g002
Figure 3. ETAP one-line diagram for a section of the PV-solar-integrated real urban ECG network.
Energies 15 09238 g003
Figure 4. Graphical analysis of transformer kVA loading.
Energies 15 09238 g004
Figure 5. Graphical analysis of transformer kW loading.
Energies 15 09238 g005
Figure 6. Graphical analysis of transformer percentage loading.
Energies 15 09238 g006
Figure 7. Graphical analysis of total transformer losses.
Energies 15 09238 g007
Figure 8. Graphical analysis of transformer load current.
Energies 15 09238 g008
Table 1. Data of a typical residential customer and an 11 kV source representing the primary substation used in the simulation.
Parameter Value
LoadSection IdLump 76
Load typeConstant kVA = 80% constant Z = 20%
Nominal voltage230 V/415 V
Typical Connected load1.5 kW
ConfigurationDelta
Power factor0.85
Customer typeResidential
Load factor0.9
Load distributionlumped load, unbalanced
11 kV Feeder SourceNominal voltage11.5 kV
Operating voltage11 kV
Base Power100 MVA
Short-circuit rating31.8 MVA (three-phase)
Source ConfigurationWye
Table 2. Data on overhead line showing conductor type and nominal data on windings of distribution transformer for the LV network.
Parameter Value
Overhead LineEquivalent ImpedancePositive sequence
Zero sequence, 21 ohms
Conductor TypeLV, 50 mm2 ACSR
Maximum SpanLV, 50 m
Nominal AmpacityLV, 209 A
Maximum Temperature75 °C
Distribution Transformer Windings Section IdC96
Frequency50 Hz
TypeThree-phase core
Nominal Rating315 kVA
Primary Voltage11 kVline
Secondary Voltage0.415 kVline
Sequence ImpedanceZ1 = 4%, Z0 = 4%
X1/R1 = 1.5%, X0/R0 = 1.5%
ConfigurationPrimary, delta
Secondary, star
Phase ShiftDyn11
Table 3. Data for load flow simulation convergence criteria.
Convergence Criteria ParameterValue
Calculation MethodAdaptive Newton–Raphson
Convergence Parameters0.0001 tolerance
99 iterations
Calculation OptionsAssume line transposition
Include line charging
Table 4. Solar PV parameters used for modelling PV panel obtained from ETAP software.
PV Panel
ManufacturerPhotowatt
ModelPW6-110
TypeMulti-crystalline
Size110
Number of cells36
Maximum Vdc1000
Power factor1
Watt/Panel110.3
Number in series20
Number in Parallel10
Irradiance/W/m21000
Ta (Ambient temperature)/degree Celsius30
Tc (Cell temperature)/degree
Celsius
5
MPP (Maximum power point)/kW21.69
Amps, dc64.2
Table 5. Data for three-phase inverter unit for solar PV system obtained from ETAP software.
DC Rating
kW22.06
V343.6
FLA (Full load Ampere)64.2
%Efficiency90.34
AC rating
kVA19.93
kV0.415
FLA27.73
%PF100
Imax150%
Table 6. Summary of simulation results of PV-solar-integrated real urban ECG network.
PV Peak Inverter Output/KVAPV Location with Worst Bus VoltagePV Penetration/%Transformer Operating Load/kVATransformer
Operating Load/KW
Magnitude of
Transformer Losses (kVA)
Transformer Operating Current/A
0A6/100169144.53.618.87
19.93A1312147.3121.62.757.73
39.86D7/425128.6101.12.086.75
59.79D8/337109.579.551.535.75
79.72C125092.7359.041.084.87
99.65A7/46281.7639.570.864.29
119.58D6/47578.3121.080.724.11
139.51C6/38779.142.130.814.15
159.44A1/49981.3−16.420.864.27
179.37-11287.5−35.510.944.59
Table 7. Summary of transformer overload and backflow limits.
Transformer Loading
Limits
PV Penetration/%Transformer Operating Load/kVATransformer Operating Load/%Transformer Operating Load/kWTransformer Net
Operating Load/A
Transformer Load Losses/kW
Without PV Injection0315.110026516.546.99
With PV
Injection
88.3078.0424.7704.280.55
Publisher’s Note: MDPI stays neutral with regard to jurisdictional claims in published maps and institutional affiliations.

