Article

Analysis of Heat Source System Degradation Due to Aging and Evaluation of Its Effect on Energy Consumption

1
Department of Refrigeration and Air-Conditioning Engineering, Pukyong National University, Yongso-ro 45, Nam-gu, Busan 48513, Republic of Korea
2
Department of Mechanical and Shipbuilding Convergence Engineering, Pukyong National University, Yongso-ro 45, Nam-gu, Busan 48513, Republic of Korea
3
Department of Architectural Engineering, ERI, Gyeongsang National University, Jinju daero 501, Jinju City 52828, Republic of Korea
*
Author to whom correspondence should be addressed.
Energies 2022, 15(23), 9217; https://doi.org/10.3390/en15239217
Submission received: 1 November 2022 / Revised: 28 November 2022 / Accepted: 30 November 2022 / Published: 5 December 2022
(This article belongs to the Topic Building Energy Efficiency)

Abstract

:
The performance of air conditioning systems deteriorate due to the natural aging and wear caused by operating the devices. This is termed “aging degradation,” and it results from a lack of appropriate maintenance which accelerates the degree of performance degradation. The performance degradation of an air conditioning system can cause problems such as increased energy consumption, deteriorated indoor heating environment, and shortened lifespan of air conditioning equipment. To prevent such problems, it is important to establish a long-term maintenance plan to recover degraded performance, such as predicting an appropriate maintenance time by identifying the real-time performance degradation rate based on a system’s operation data. In this study, the performance degradation rate, according to the operating time, was estimated using long-term operation data for devices constituting a heat source system, and the effect of performance degradation of the heat source system’s operation and energy consumption was reviewed using a simulation. The performance degradation rate of the target device was estimated by analyzing the variation trend of the calibration coefficient, which was calculated when the initial performance prediction model was calibrated through operating data. Using this approach, it was confirmed that the annual performance degradation rate was 1.0–1.4% for the heat source equipment, 0.4–1.2% for the cooling towers, and 0.8–1.3% for the pumps. In addition, a heat source system energy simulation calculated the 15-year performance degradation of the heat source equipment to be 34–52% and 7–19% for both the cooling towers and pumps. Due to the equipment performance deterioration, the number of operating heat source equipment and cooling tower fans, and the pump flow rate gradually increased every year, thus accelerating the performance deterioration even further. As a result, energy consumption in the 15th year increased by approximately 41% compared with the initial energy consumption.

1. Introduction

More than 40 countries were involved in the online “Leaders’ Summit on Climate” meeting on Earth Day in April 2021. In the meeting, many countries including the United States, European Union, and Japan raised the carbon reduction target for the year 2030. Considering this as an opportunity, South Korea also revised their 2030 Nationally Determined Contribution (NDC), which is a carbon-neutral intermediate goal, aiming to reduce it by 40% compared with 2018. In the construction sector, the target of reducing carbon emissions in comparison to 2018 is 32.8% (from 52.1 million tons of CO2eq in 2018 to 35.0 million tons of CO2eq) [1]. To reduce carbon in the building sector, establish a building management system for each life cycle based on the data that measure the energy performance of buildings. Using this system, net zero emissions of new buildings and green remodeling of existing buildings will be expanded [2].
To reduce building energy consumption, it is essential to ensure air conditioning systems are being operated efficiently and maintained regularly as these systems account for about 40% of the total building’s energy. The performance of all devices, including the air conditioning systems, deteriorates due to natural aging and wear caused by operation and is called aging degradation. Furthermore, the lack of appropriate maintenance can accelerate the degree of aging degradation. The performance degradation of air conditioning systems can cause problems such as increased energy consumption, deteriorated indoor heating environment, and shortened equipment lifespan. To prevent such problems, it is important to estimate the degree of real-time performance degradation using operation data and establish a long-term maintenance plan to recover the degraded performance.
Griffith B. et al. [3] predicted the performance degradation rates of air conditioning equipment including the Direct Expansion (DX) coil, central chiller, boiler, heat pump, constant volume fan, variable volume fan, and gas heating coil. The annual performance degradation rate was calculated for each of these components with and without maintenance, and the performance degradation values were presumed by approximating the trends observed across historical versions of Standard 90.1. Table 1 shows the performance degradation rate used in this paper. They proposed a linear model that calculates the performance degradation rate at the time according to the age of use and the annual performance degradation rate. Waddicor D. et al. [4] reported that 30% performance degradation occurs over 30 years for fans and pumps and that this value ranges from 6–10% for boilers, depending on maintenance conditions. These results agree with that typically provided by air conditioning manufacturers. M. Bannai et al. [5] found that the performance of the chiller decreases by 2.4% per year due to mechanical deterioration, however, can be reduced to 1% per year when the appropriate chemical cleaning and maintenance are performed. Karen Fenaughty et al. [6] report the first-ever long-term empirical measurement of the degradation of residential air conditioner/heat pump (AC/HP) performance. From 2012–2016, FSEC monitored 56 homes in Florida as a retrofit project which gathered detailed HVAC end-use energy data. Within the analysis, cooling system performance at many sites was found to worsen over the baseline period, typically degrading 5%, and ranging from −8% to 40%, per year. Using these data, an algorithm was developed to automatically evaluate AC/HP performance against the weather. Some researchers examine the influence of degradation on an entire building’s thermal performance while also taking climate change into account [7,8]. Georgios Eleftheriadis et al. [8] considers the impacts of this deterioration on the building energy performance with accuracy improving long-term performance calculations. Simplified degradation equations are applied to selected envelope elements and heating system components of a single-family house in Germany. The calculation results show that the building consumes 18.4% to 47.1% more primary energy over 20 years compared with a scenario without degradation.
Recently, in Korea, the building energy management system (BEMS) has been actively promoted and the operation data are being measured and stored. In particular, BEMS is an integrated system of measurement, control, management, and operation that provides an optimized building energy management plan by monitoring energy usage required to maintain a comfortable indoor environment [9]. In the Energy Use Rationalization Act, the government stipulates that “When a public institution builds a building with a total floor area of 10,000 m2 or more, efforts should be made to establish and operate a BEMS for efficient building energy use”. Moreover, the standards included Zero Energy Building (ZEB) certification for BEMS installation. In addition, BEMS installation guidelines have been prepared to describe in detail the roles and functions of BEMS, such as collected data items, display and inquiry methods, and analysis methods [10].
To estimate the aging deterioration in real-time for air conditioning systems, it is necessary to measure the input and output values of all devices constituting the system and conduct a performance evaluation for comparison with the initial performance. To achieve this, various sensors need to be installed increasing the initial investment cost, which air conditioning clients are reluctant to do. This, therefore, makes it difficult to conduct research on estimating aging deterioration based on real-life operating data. The purpose of this study is to predict the performance degradation rate of air conditioning equipment according to operation time by using the model calibration method based on long-term operation data accumulated in BEMS. Based on the obtained results, the effect of aging degradation on the energy consumption of the heat source system was examined by using simulation. First, four-year operation data for heat source equipment, open cooling towers, and inverter-type pumps that were installed in a university building were acquired from BEMS and a model predicting initial performance was built using the data provided by the manufacturer. The initial performance prediction model includes a calibration coefficient for correcting the performance difference between the initial performance and the operating performance. The calibration coefficient was calculated using operation data, and the performance degradation rate compared with the initial performance was predicted by analyzing the changing trend of the calibration coefficient according to the cumulative operation time. In addition, a simulation model was developed for a heat source system comprising heat source equipment, a cooling tower, a chilled water pump, and a cooling water pump. We studied the effect of the predicted performance degradation rate on the operation method and energy consumption change when the heat source system was operated for a long time.

2. Development of the Performance Prediction Model

A performance prediction model was developed for heat source equipment, open cooling towers, and inverter-type pumps installed in the university building and completed in October 1993. After constructing a model to predict the initial performance of the device using the initial device specifications, performance data, and the physical equations provided by the manufacturer. The model was calibrated using the operation data, from which a calibration coefficient was calculated by considering the difference. The difference between the predicted initial performance and the current performance was minimized by adding this calibration coefficient to the predictive model. The calculation of the calibration coefficient and analysis of the variation trend is discussed in Section 4.

2.1. Heat Source Equipment

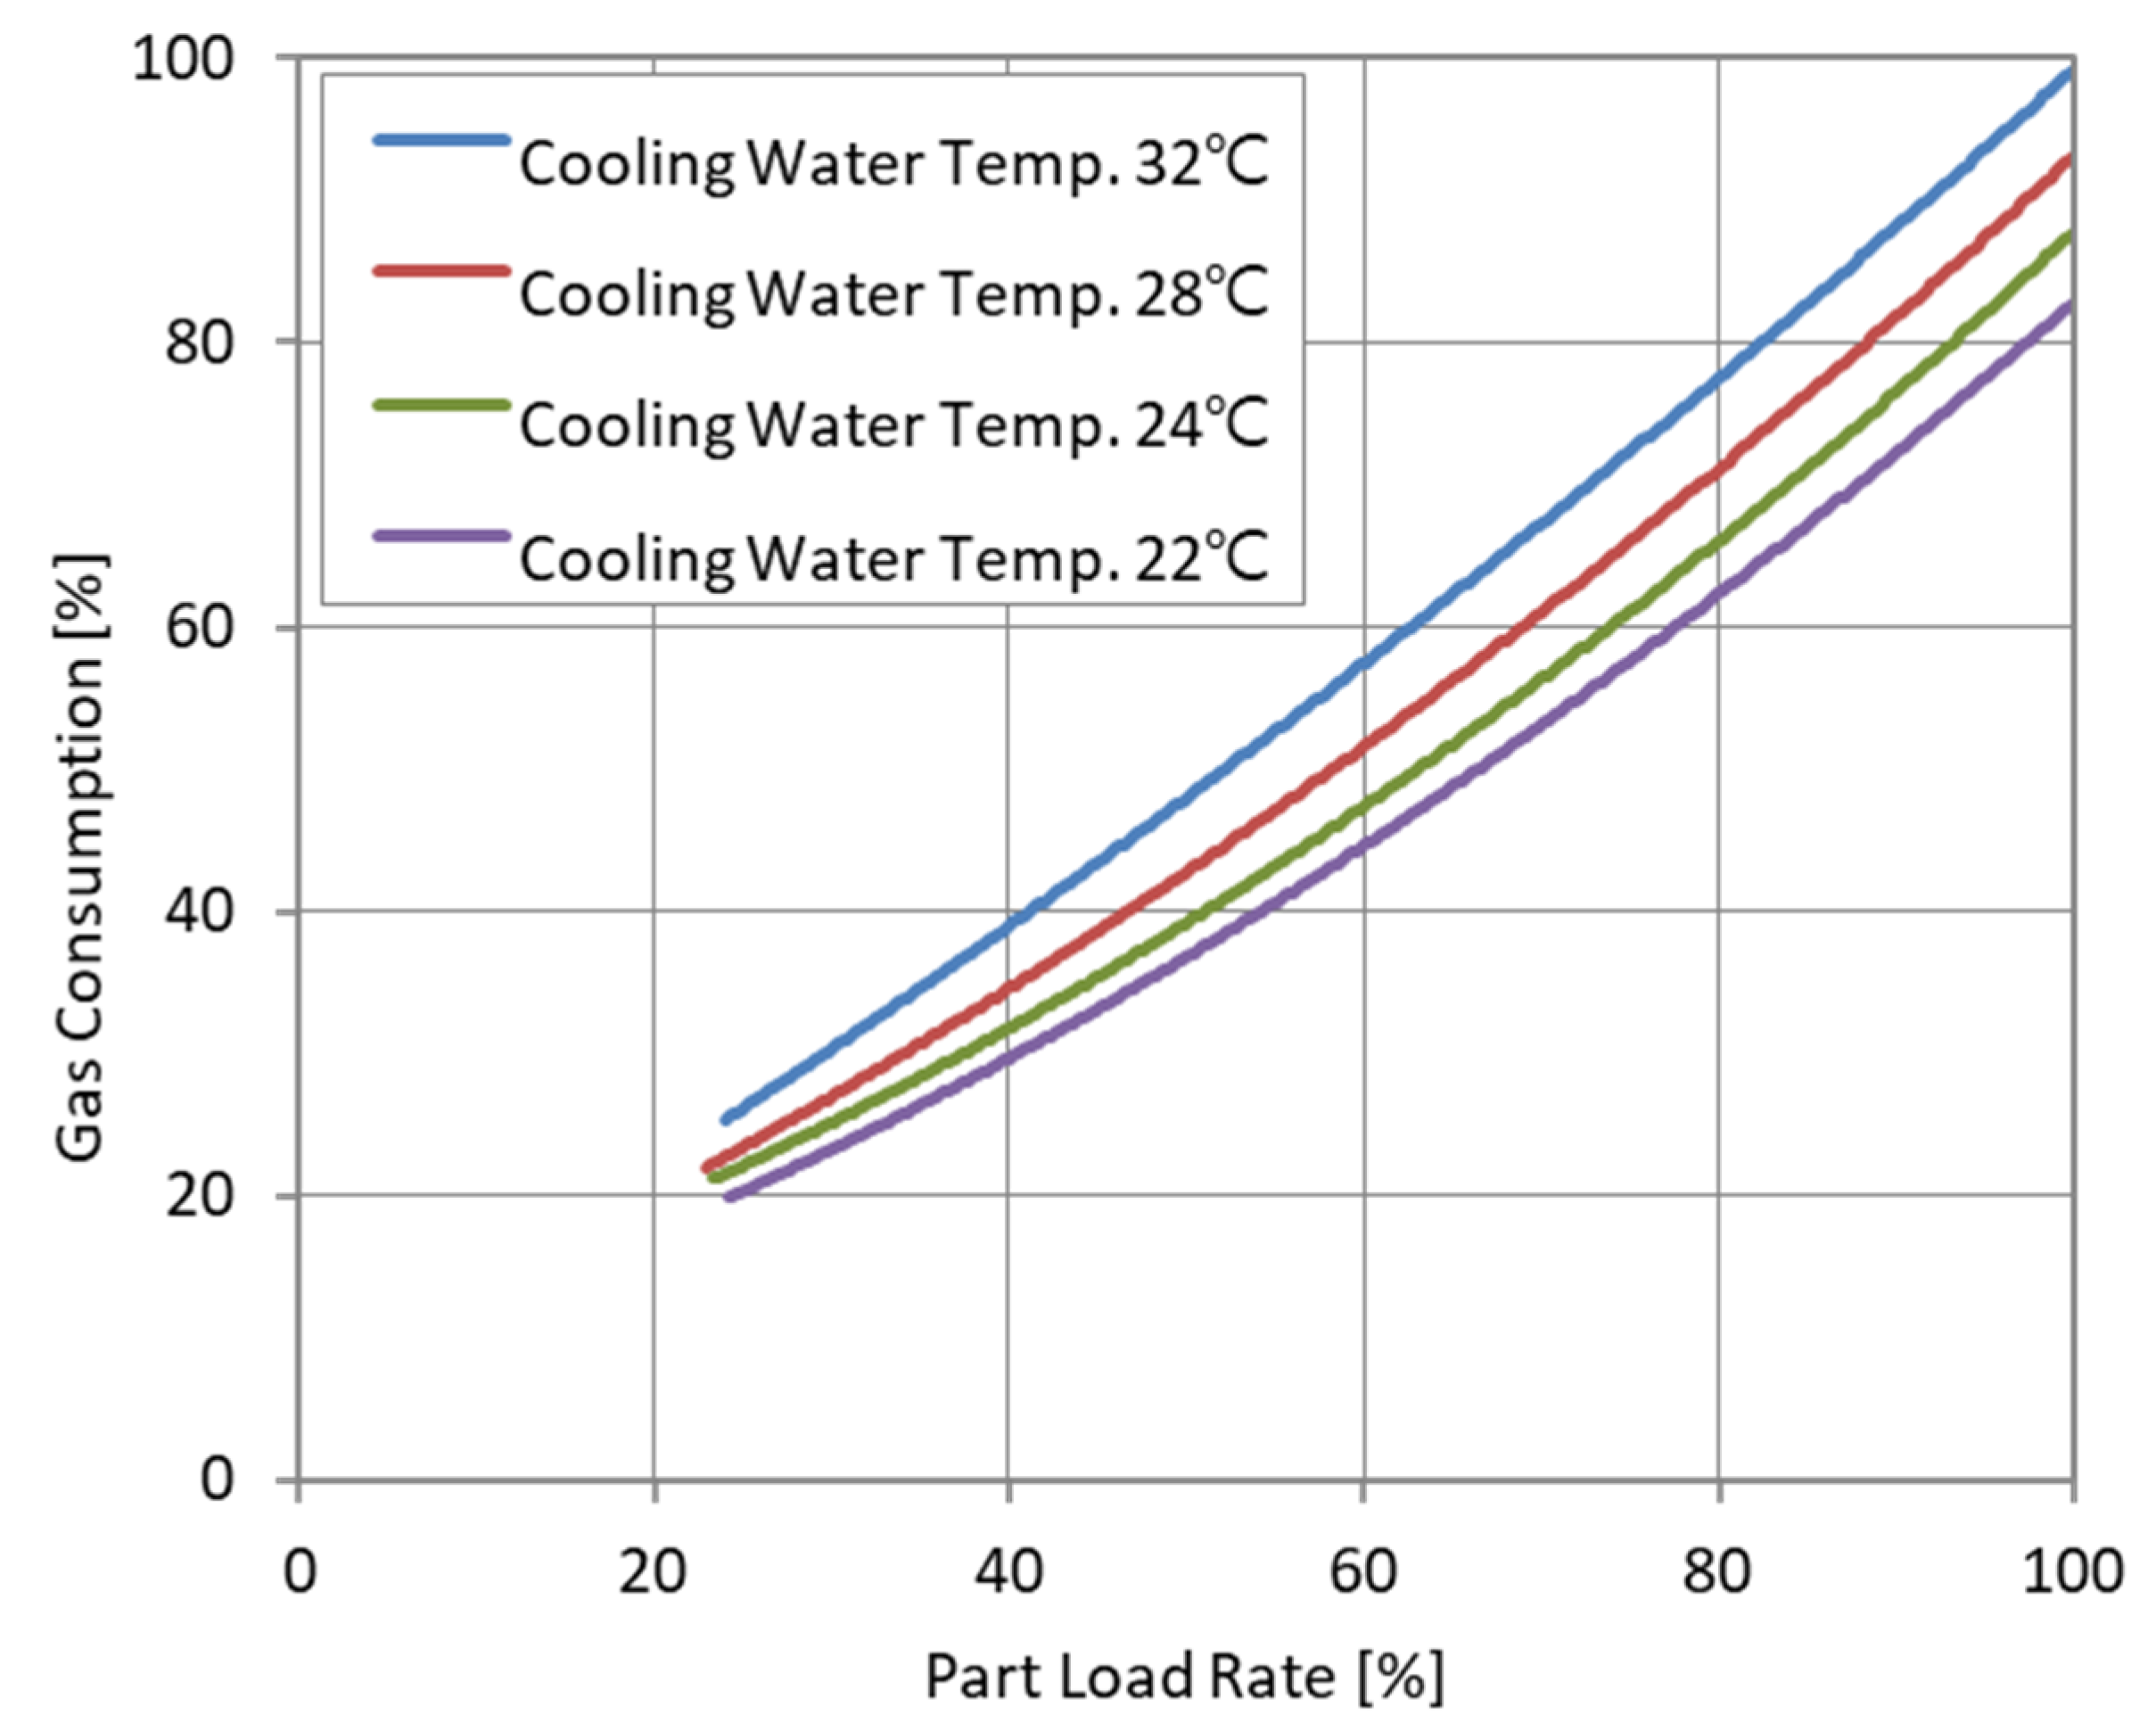
In this study, three gas absorption chiller-heater (Ch-1, Ch-2, Ch-3) were targeted as heat source equipment. Table 2 shows the specifications for these devices as provided by their manufacturer, and their performance curve is shown in Figure 1. Based on the performance curve, a gas consumption rate calculation model based on the partial load rate and the cooling water temperature was constructed; the model expression is shown in Equation (1). In order to reduce the effect of chilled water temperature and cooling water flow on gas consumption, only data obtained in the range of 6.5–7.5 °C for chilled water temperature and 450–500 m3/h for cooling water flow were used. After calculating the partial load factor using the difference between the inlet and outlet temperatures of the heat source equipment the flow rate of chilled water, the rate of cooling capacity, and the gas consumption rate can be calculated by inputting the partial load factor and the cooling water temperature into the model.
Egas = Cgas∙(a0 + a1∙X + a2∙X2 + a3∙Y + a4∙Y2 + a5∙X∙Y)
Here, Egas denotes the gas consumption rate [%], X is the partial load rate [%], Y is the cooling water temperature [°C], a0, a1, a2, a3, a4, and a5 are the model parameters [-], Cgas is the calibration coefficient [-]. The model parameters were calculated using a least-squares method based on the performance curve data. The calculation results are provided in Table 3.

2.2. Open Cooling Tower

Table 4 lists the equipment specifications for the three target open cooling towers (CT-1, CT-2, CT-3). The cooling tower model is a counter-current type wherein cooling water and outside air flow are in opposite directions, and the filling material is assumed to be a water film type. The model expressions are given in Equations (2)–(4) [11]. Equation (2) provides the formula to calculate the amount of heat exchanged in the cooling tower, Equation (3) is the empirical formula of the coefficient of mass transfer (ka) for the water film filler of a counter-current cooling tower, and Equation (4) is an expression for calculating the logarithmic mean enthalpy difference (LMED). The input values required for the cooling tower model are: the inlet and outlet water temperatures of the cooling tower, cooling water flow rate, cooling tower fan air volume, and outside air temperature and humidity, whereas the output value is the cooling tower heat quantity.
Q = C CT · ka · A · Z · LMED
ka = 7.5 · λ g d e 2 · C s · L A · d e γ l · ν l 0.45 · G A · d e · C s λ g 0.46 · d e Z 0.74
LMED = h w 1 h 2 h w 2 h 1 log h w 1 h 2 / h w 2 h 1
Here, Q denotes the heat exchange in the cooling tower [kcal/h], CCT is the calibration coefficient [-], ka is the overall mass transfer coefficient [kcal/m3h (kcal/kg)], A is the cooling tower filler cross-sectional area [m2], Z is the cooling tower filler height [m], LMED is logarithmic mean enthalpy difference [kcal/kg], λg is air thermal conductivity [kJ/ms∙K], de is equivalent diameter of cooling tower filler [m], Cs is the specific heat of wet air [kJ/kg’s∙K], L is the quantity [kg/s], γl is the specific gravity of water [kg/m3], vl is the kinematic viscosity of water [m2/s], and G is the cooling tower fan air volume [m3/s].

2.3. Inverter Type Pump

Model construction was carried out targeting three pumps (P-1, P-2, P-3) capable of controlling the flow rate and were equipped with an inverter. Table 5 and Equation (5) show the specifications of the target device. The pump model calculates the power consumption of the pump based on the relation between shaft power and flow and it is given as,
E P = C P · E rated η P · F P F r 3
where Ep denotes the power consumption of the pump [kW], Cp is the calibration coefficient [-], Erated indicates the pump-rated power consumption [kW], ηp is the pump efficiency [%], Fp is the cooling water flow [m3/h], and Fr is the pump rated flow [m3/h].

3. Diagnosis of Aging Deterioration

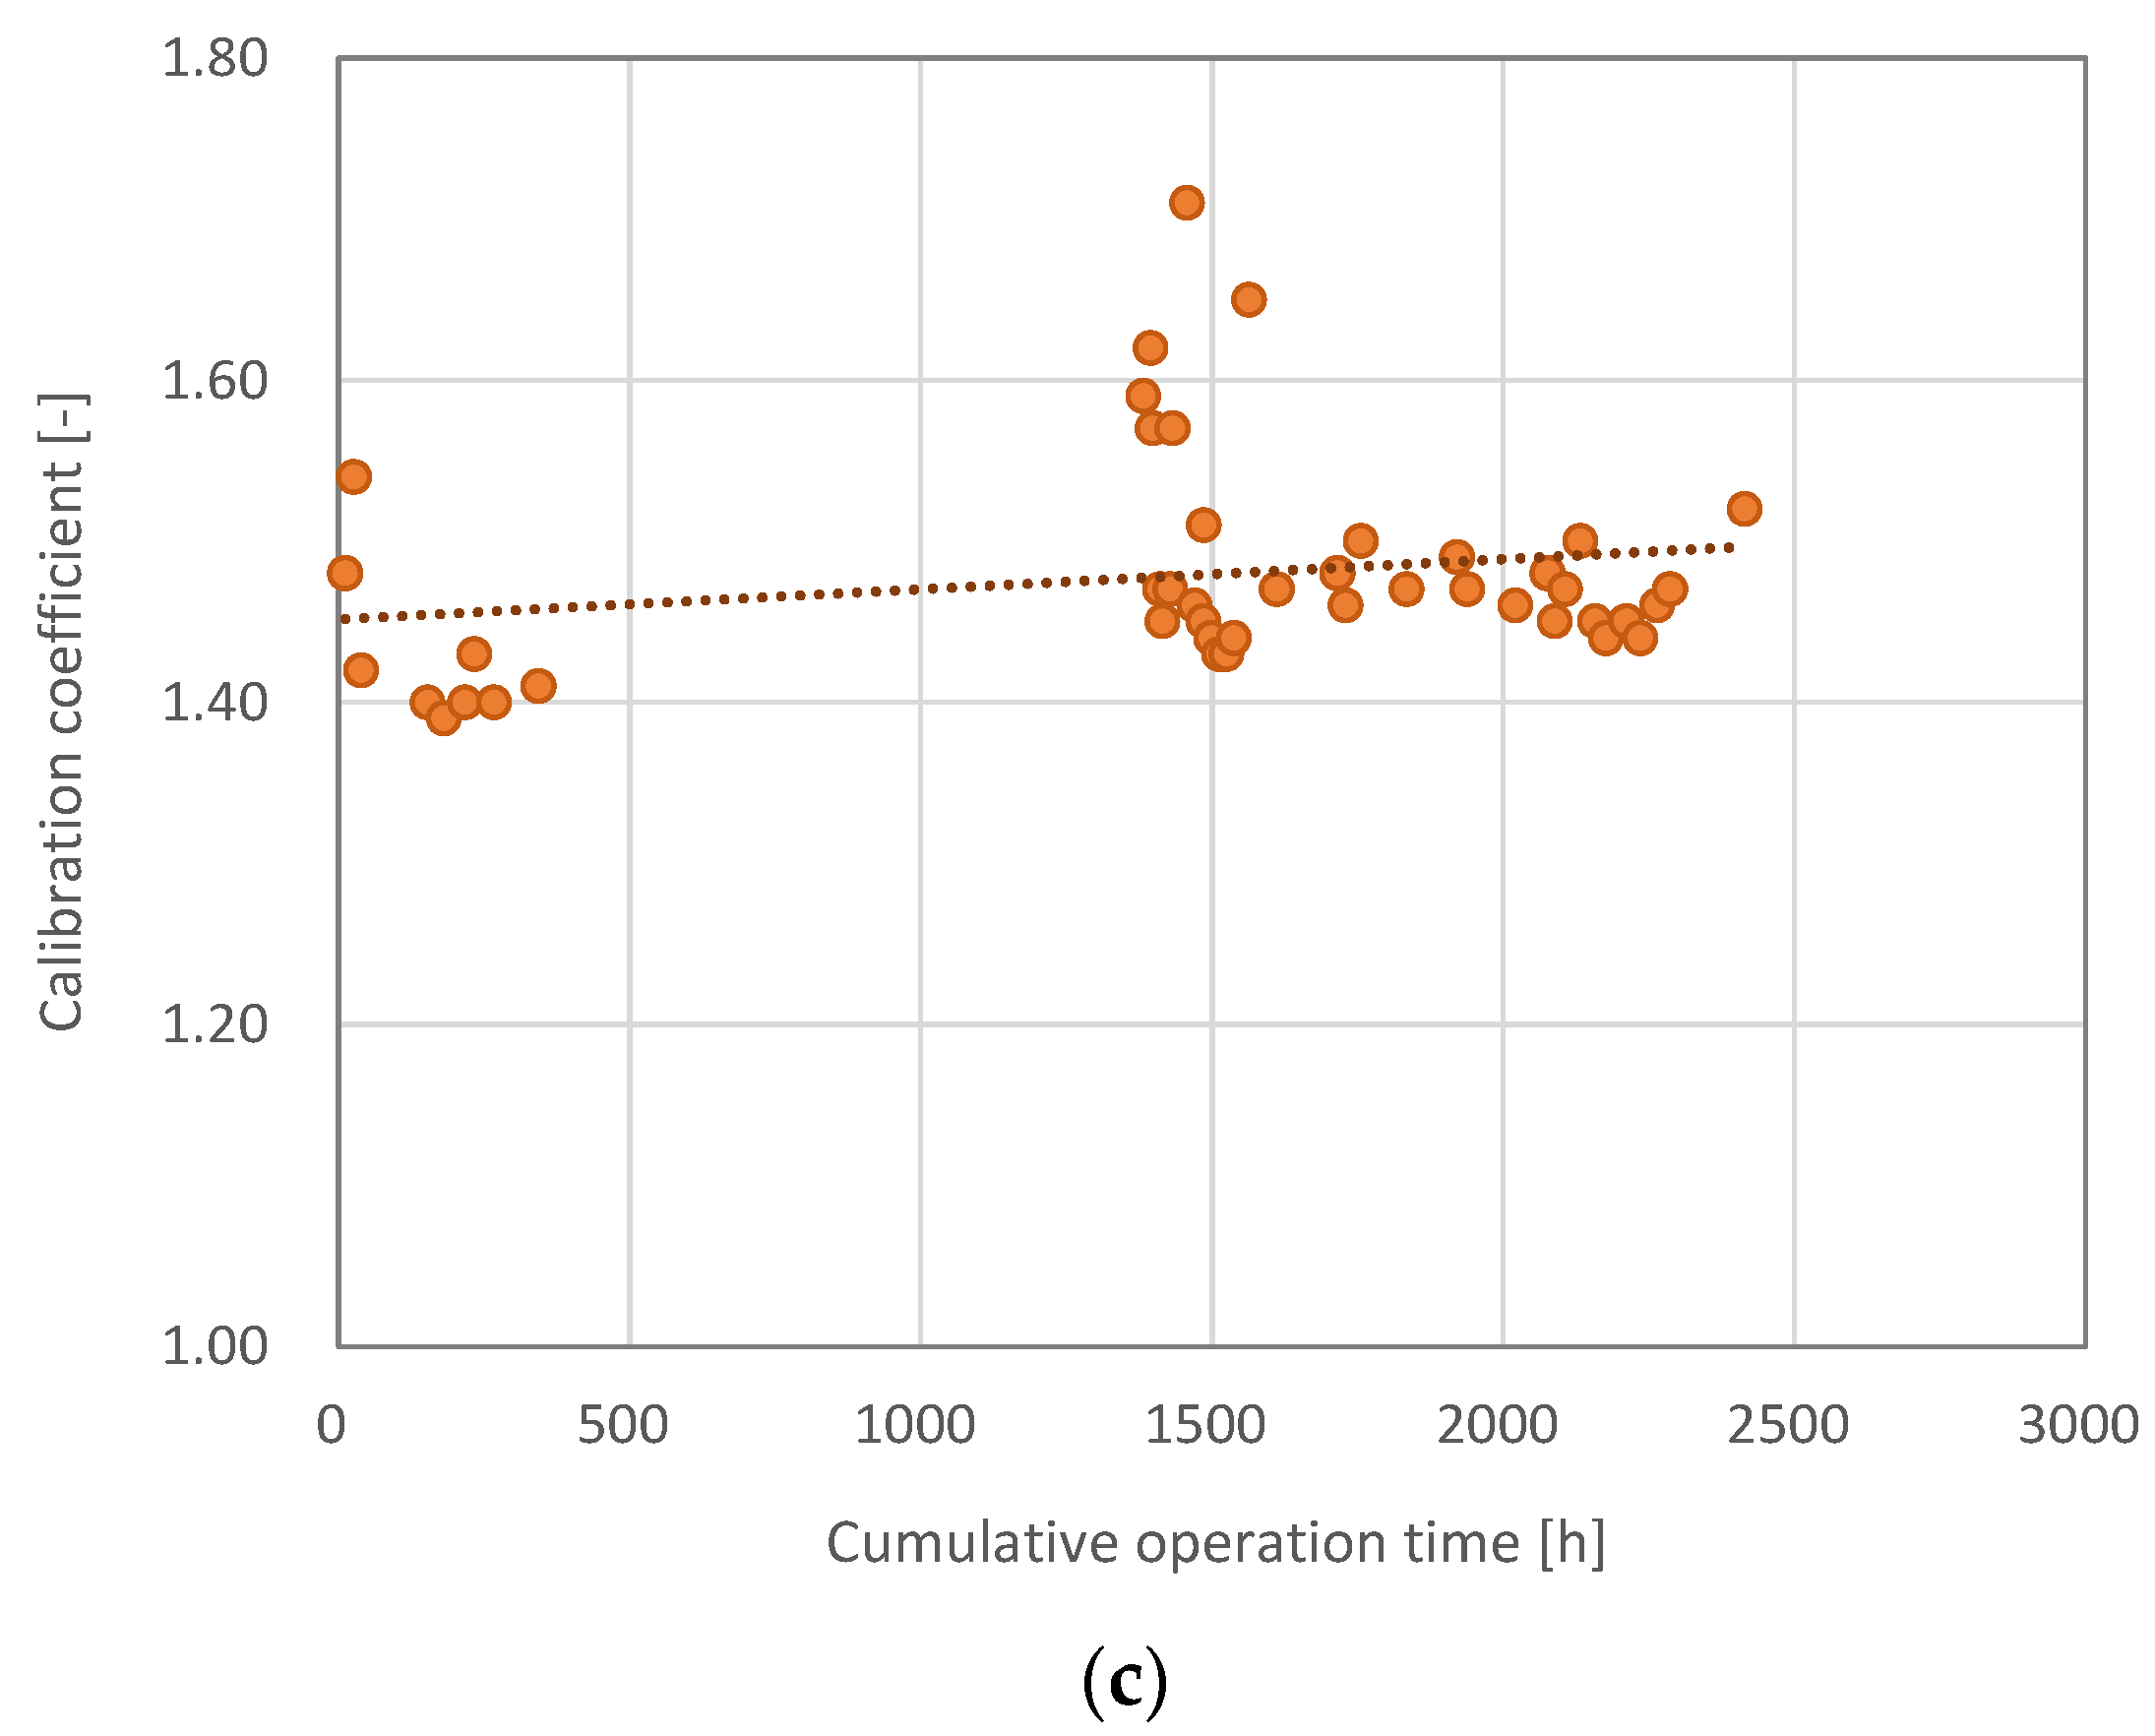
In this study, the calibration coefficient was calculated using operation data measured at 1 min intervals over a 4-year period. Calibration coefficients were calculated at 1-day intervals using the least-squares method. The calibration coefficient indicates the difference between the initial performance predicted from the performance data provided by the manufacturer and the current performance calculated from the operation data. In this study, the degree of performance degradation with respect to operation time was predicted by analyzing the variation of the calibration coefficient with respect to the cumulative operation time. The heat source equipment model and the pump model provide values for the gas consumption rate and power consumption, respectively. When the calibration coefficient increases with the cumulative operating time, both gas and power consumption increase under the same boundary condition, indicating that performance degradation occurs. The cooling tower model determines the amount of heat treated, and when the calibration coefficient decreases with the cumulative operating time, the amount of treated heat decreases under the same boundary condition, indicating a degraded performance.
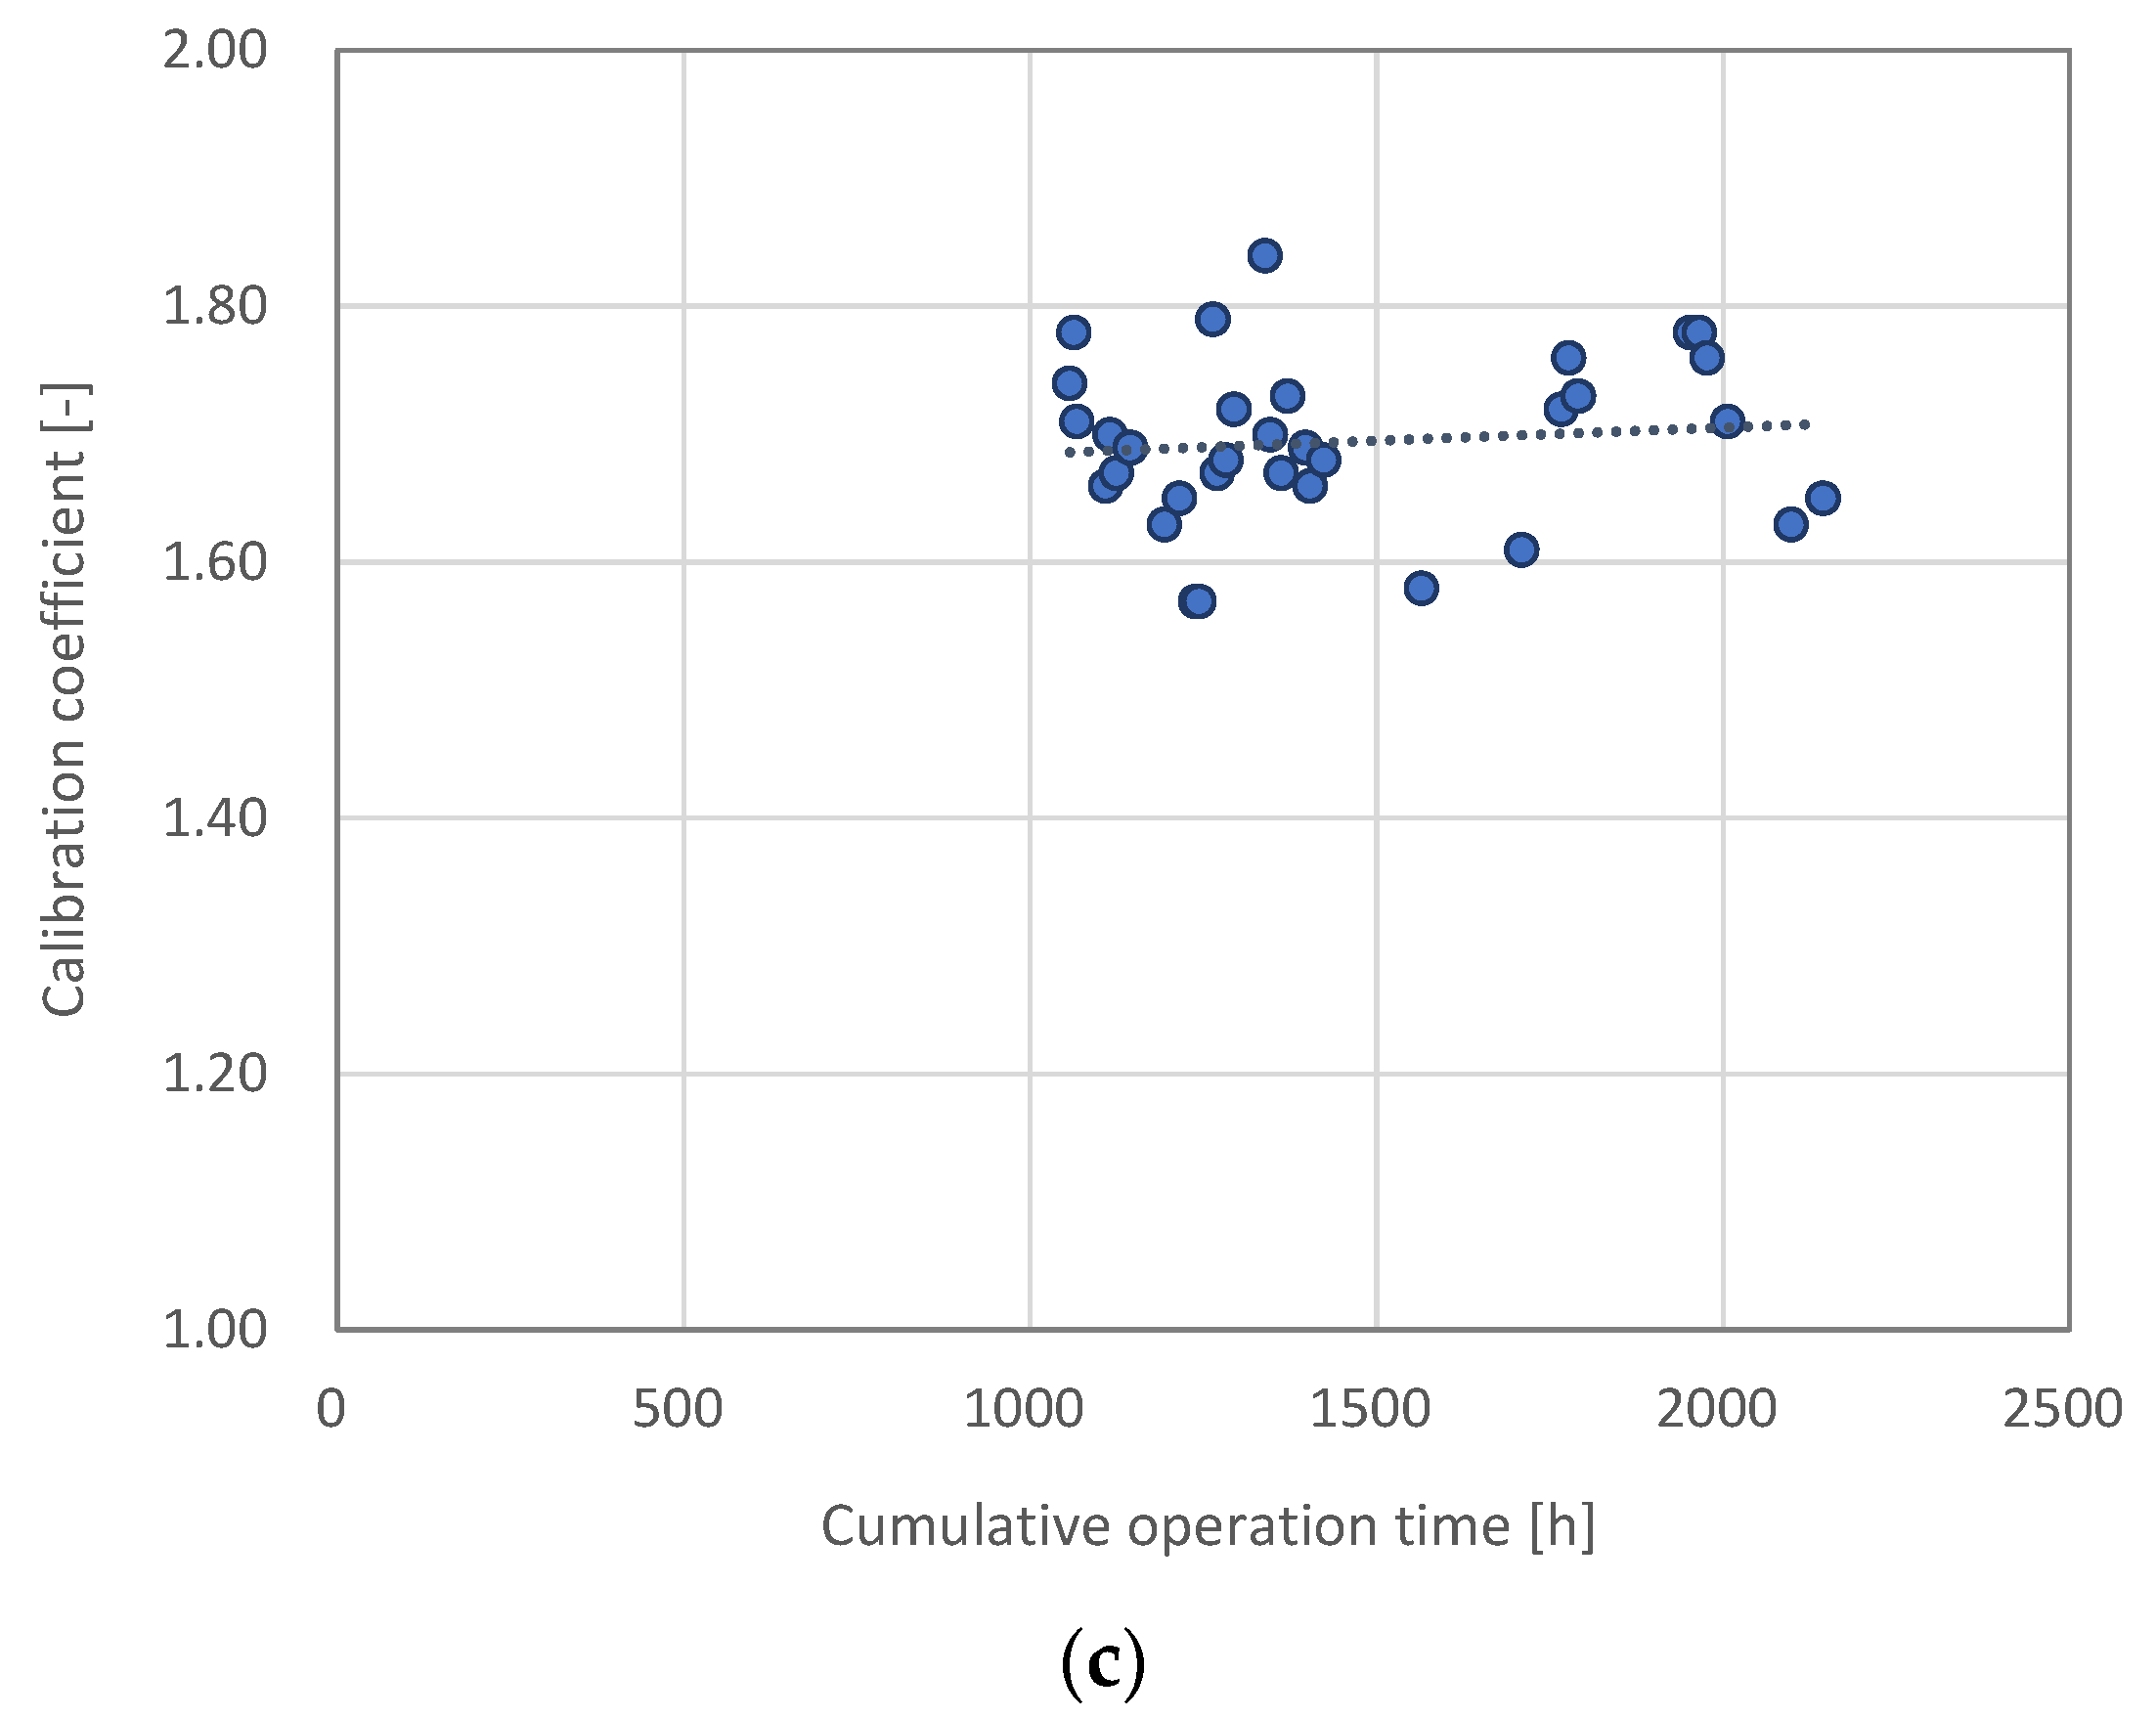
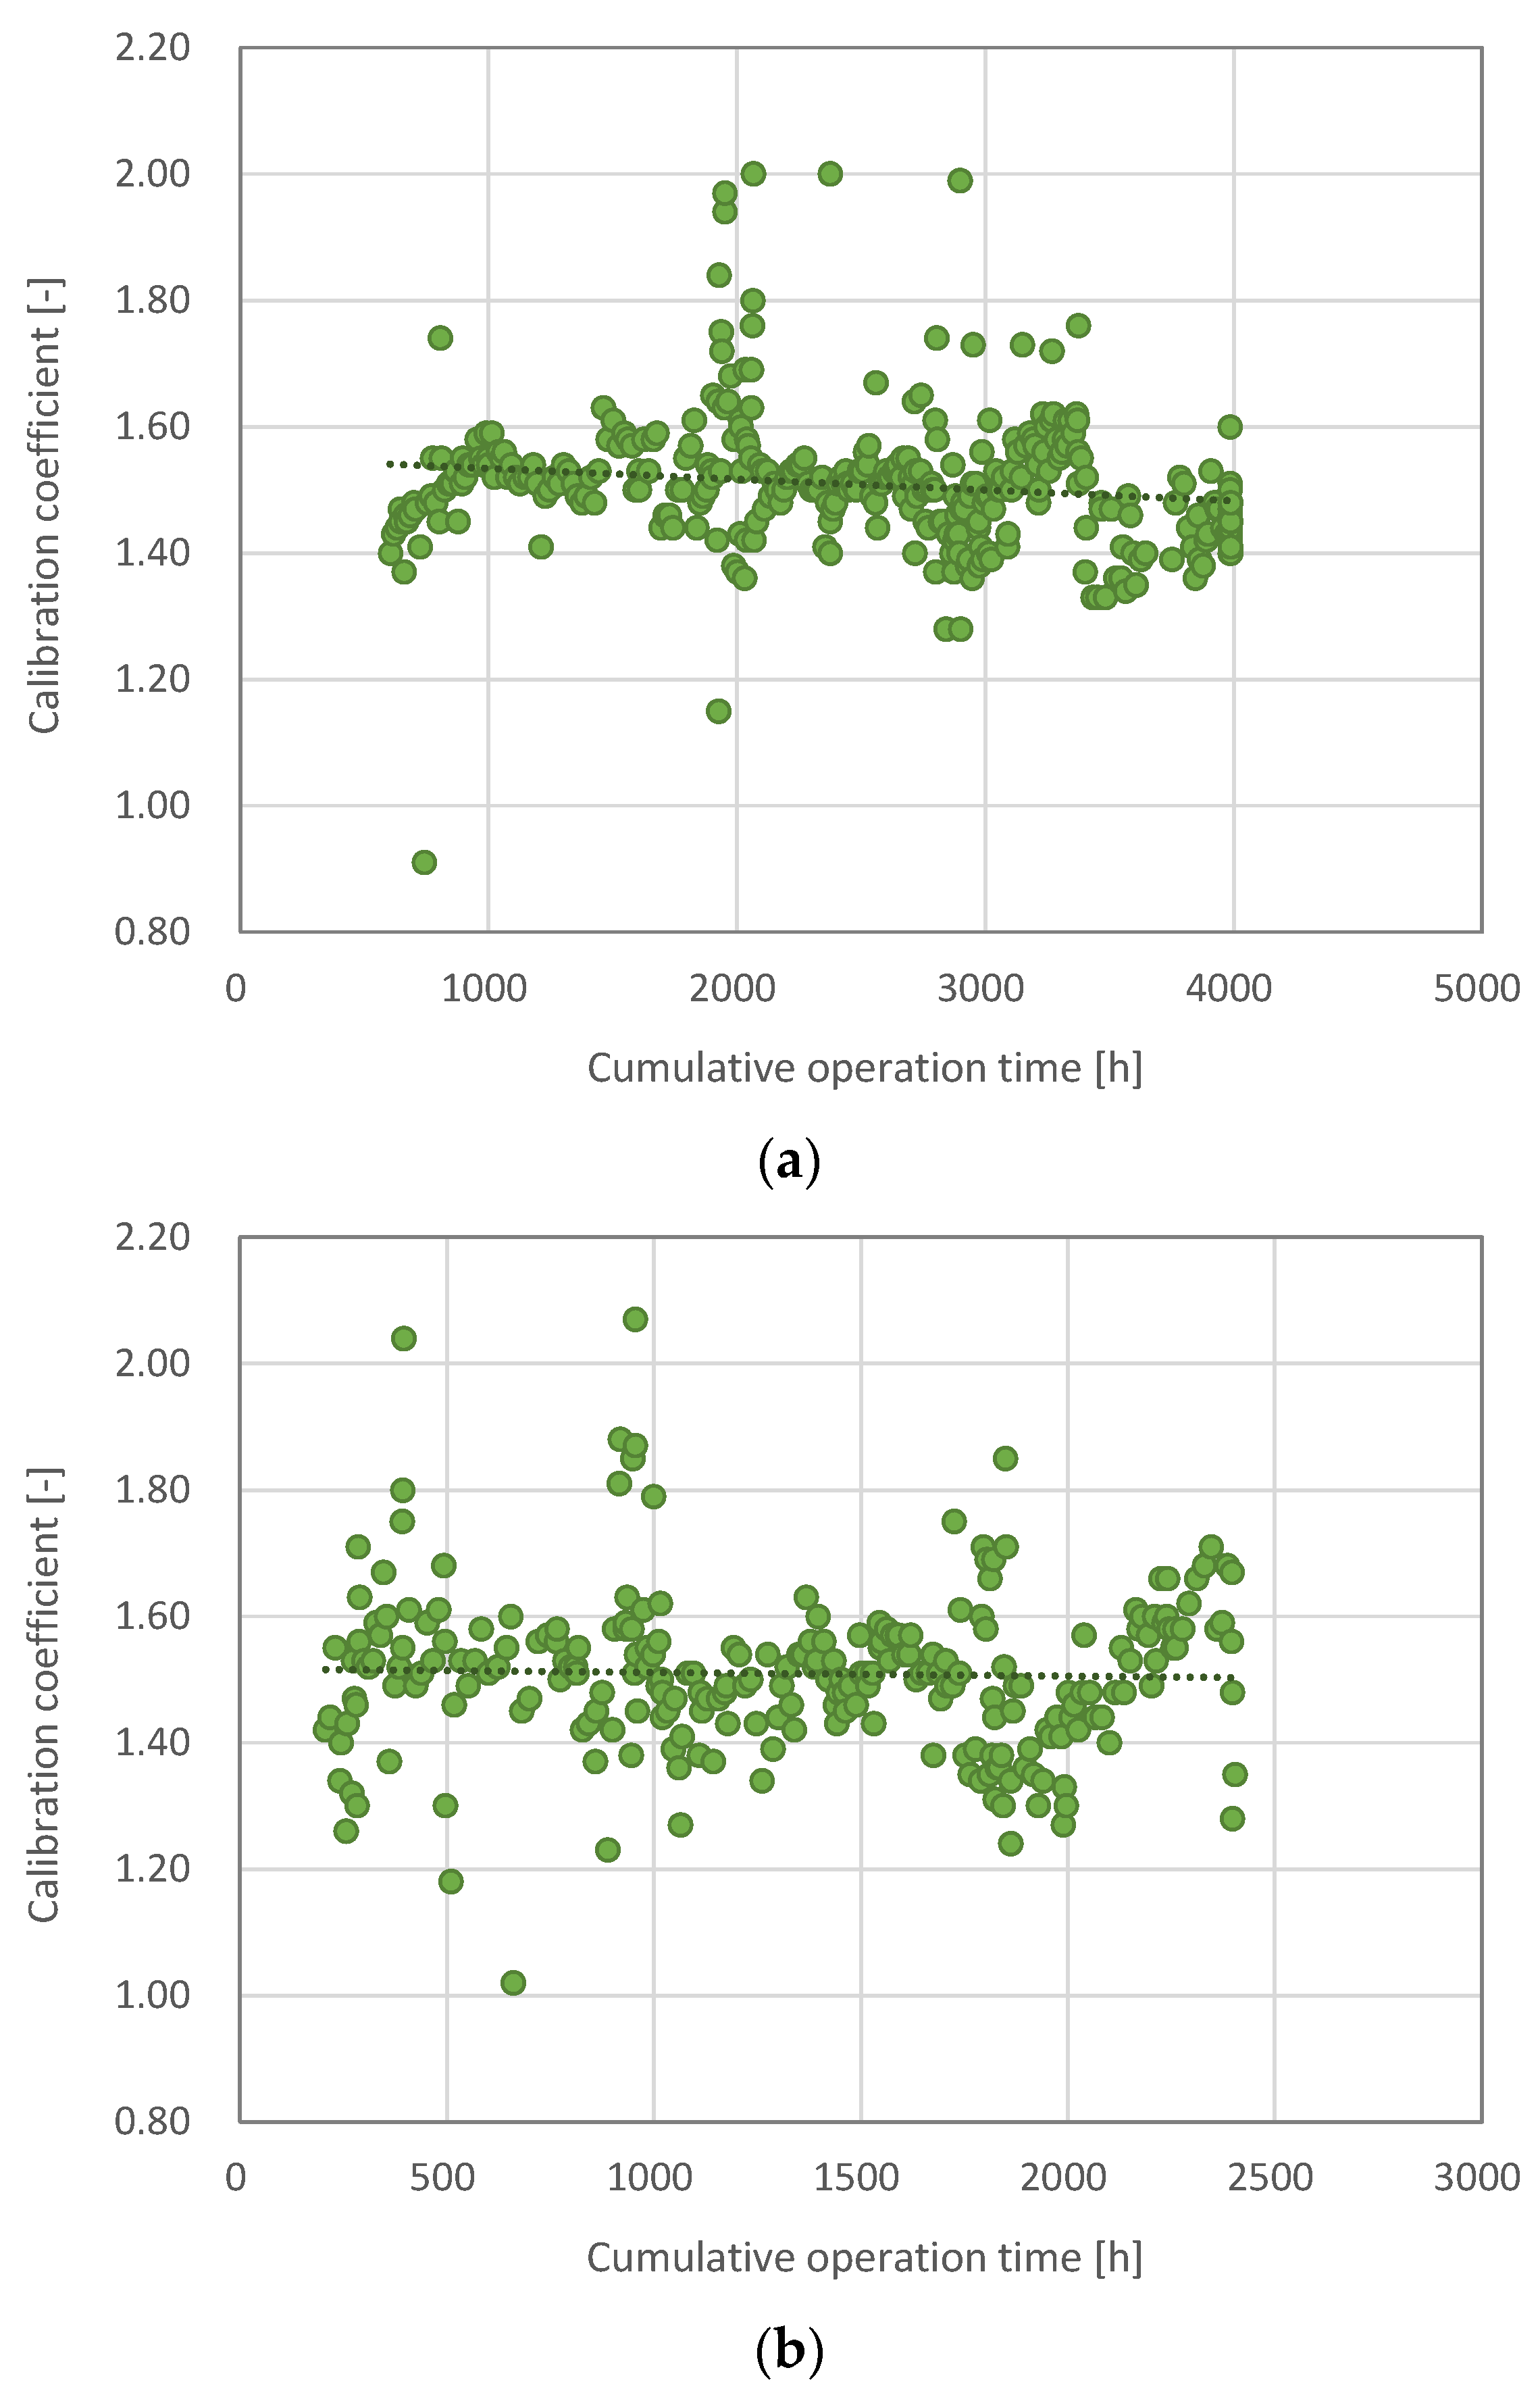
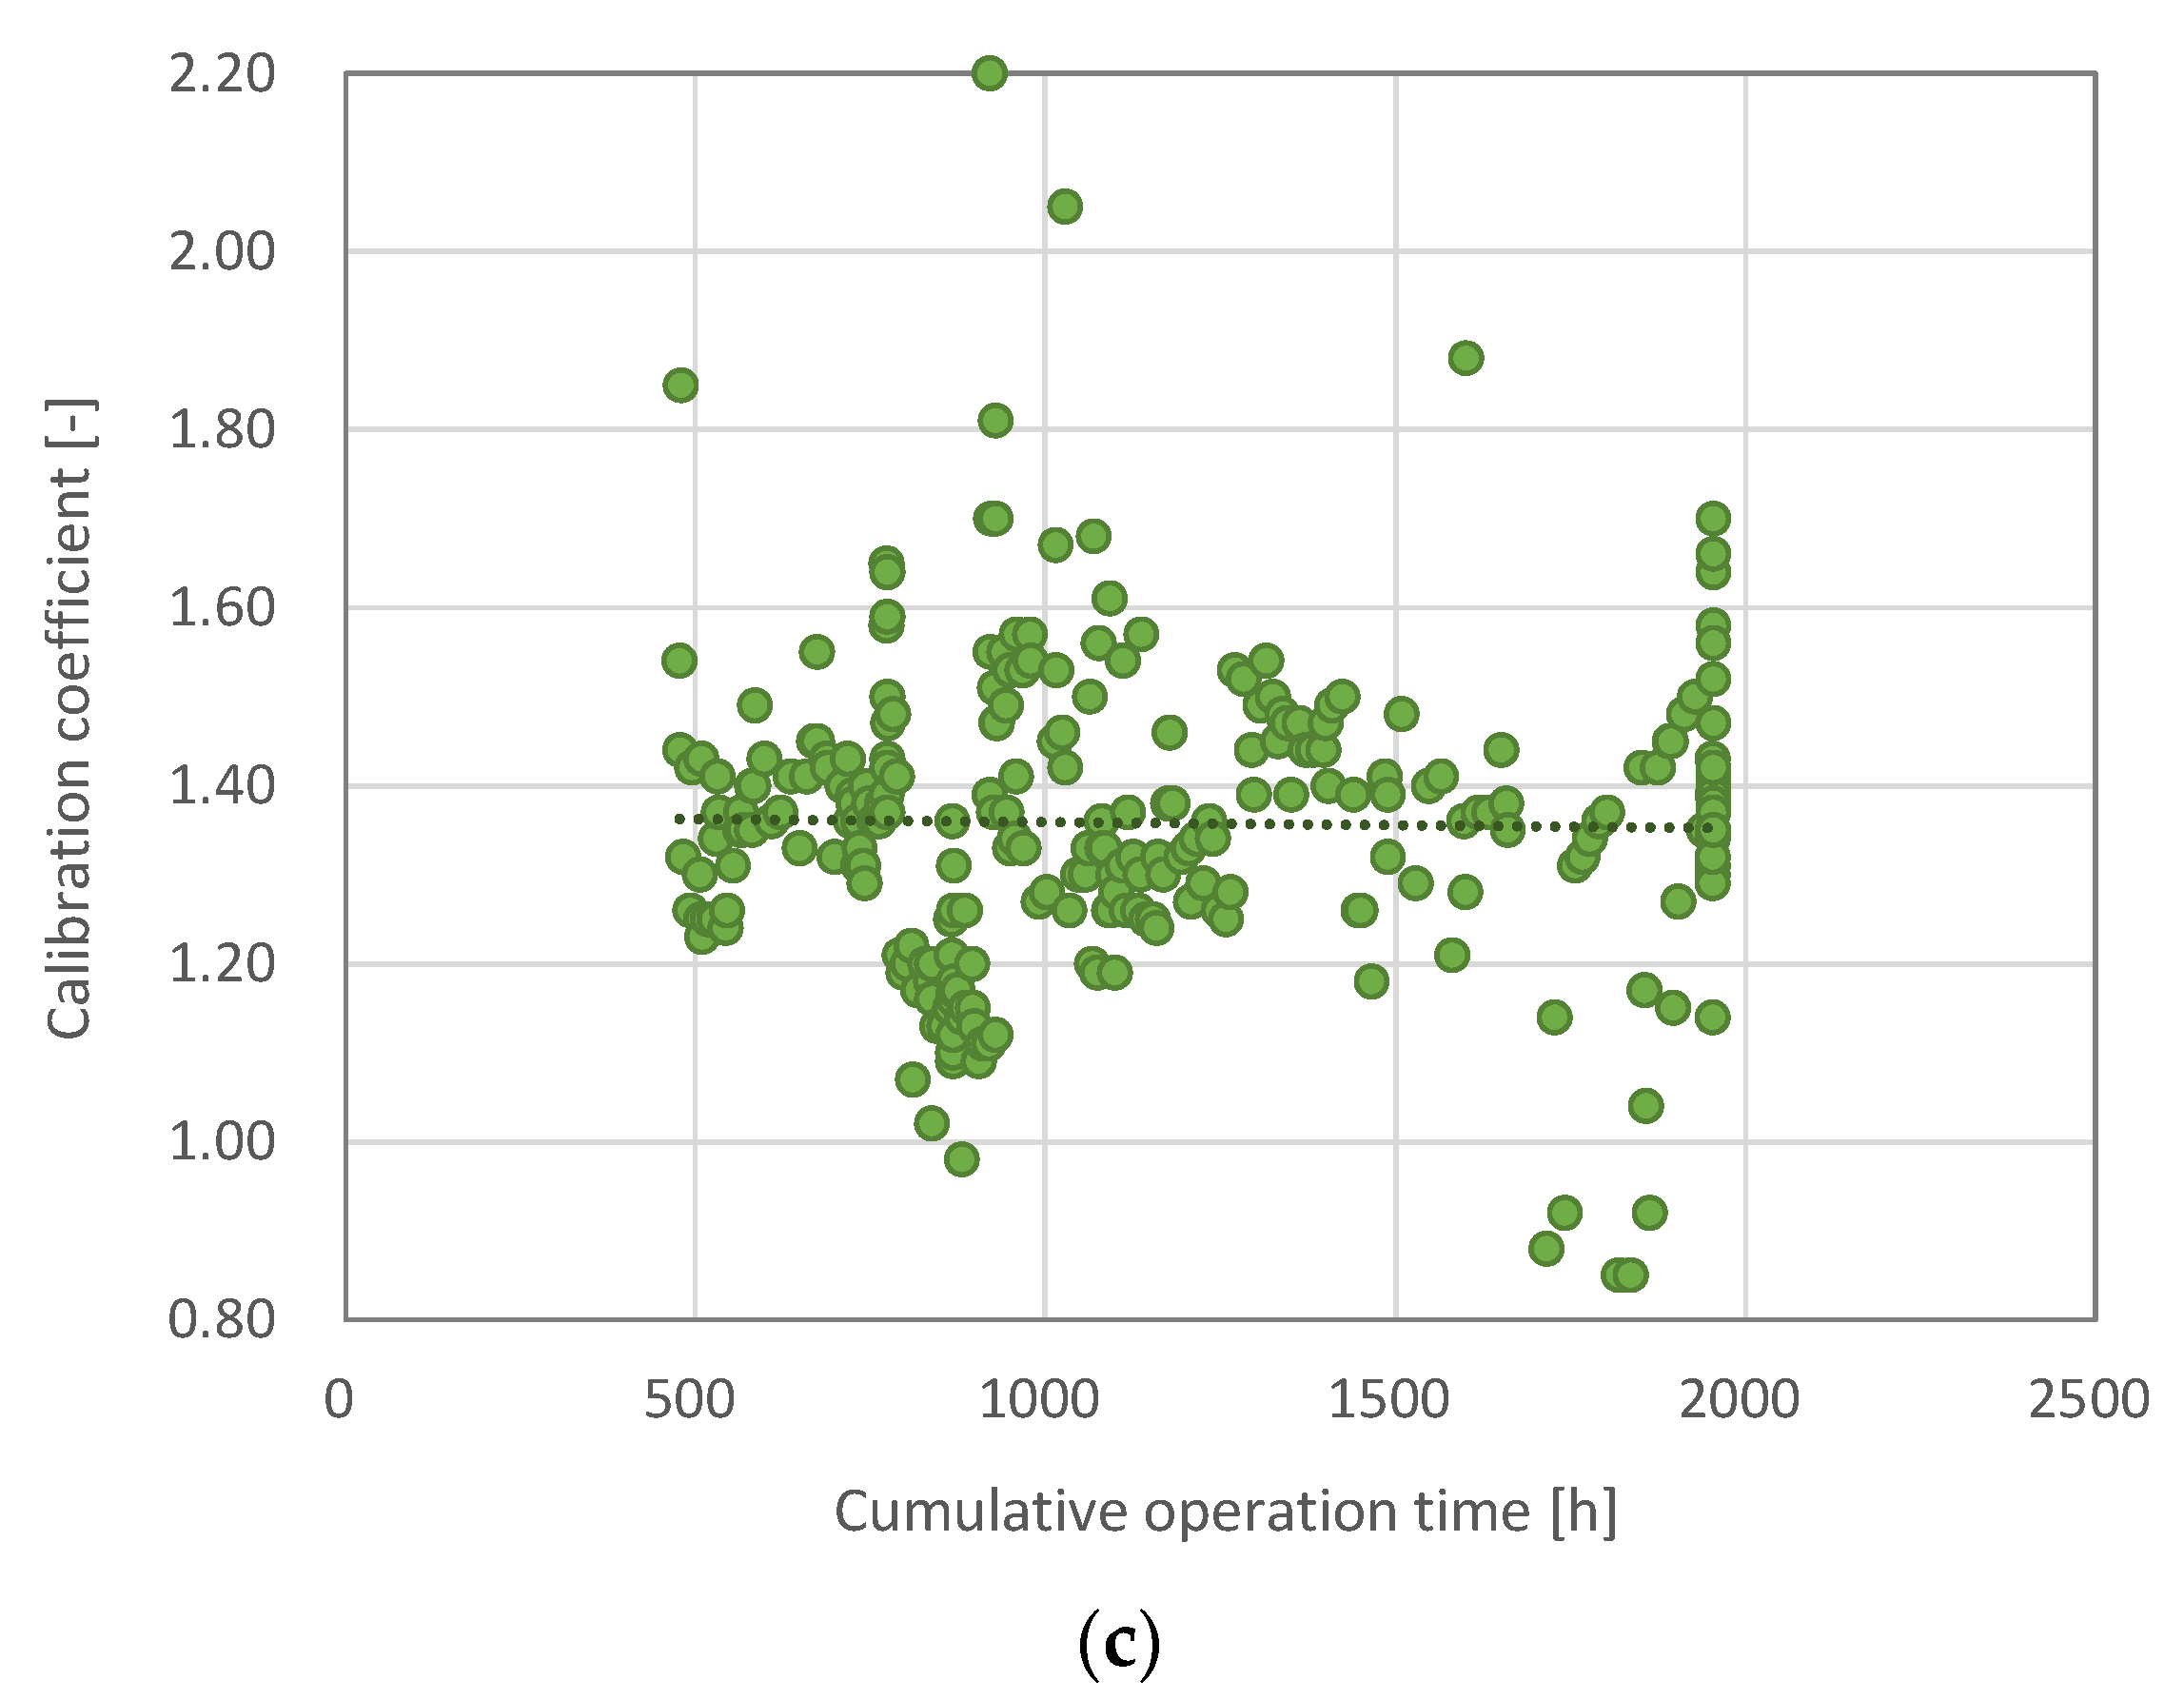
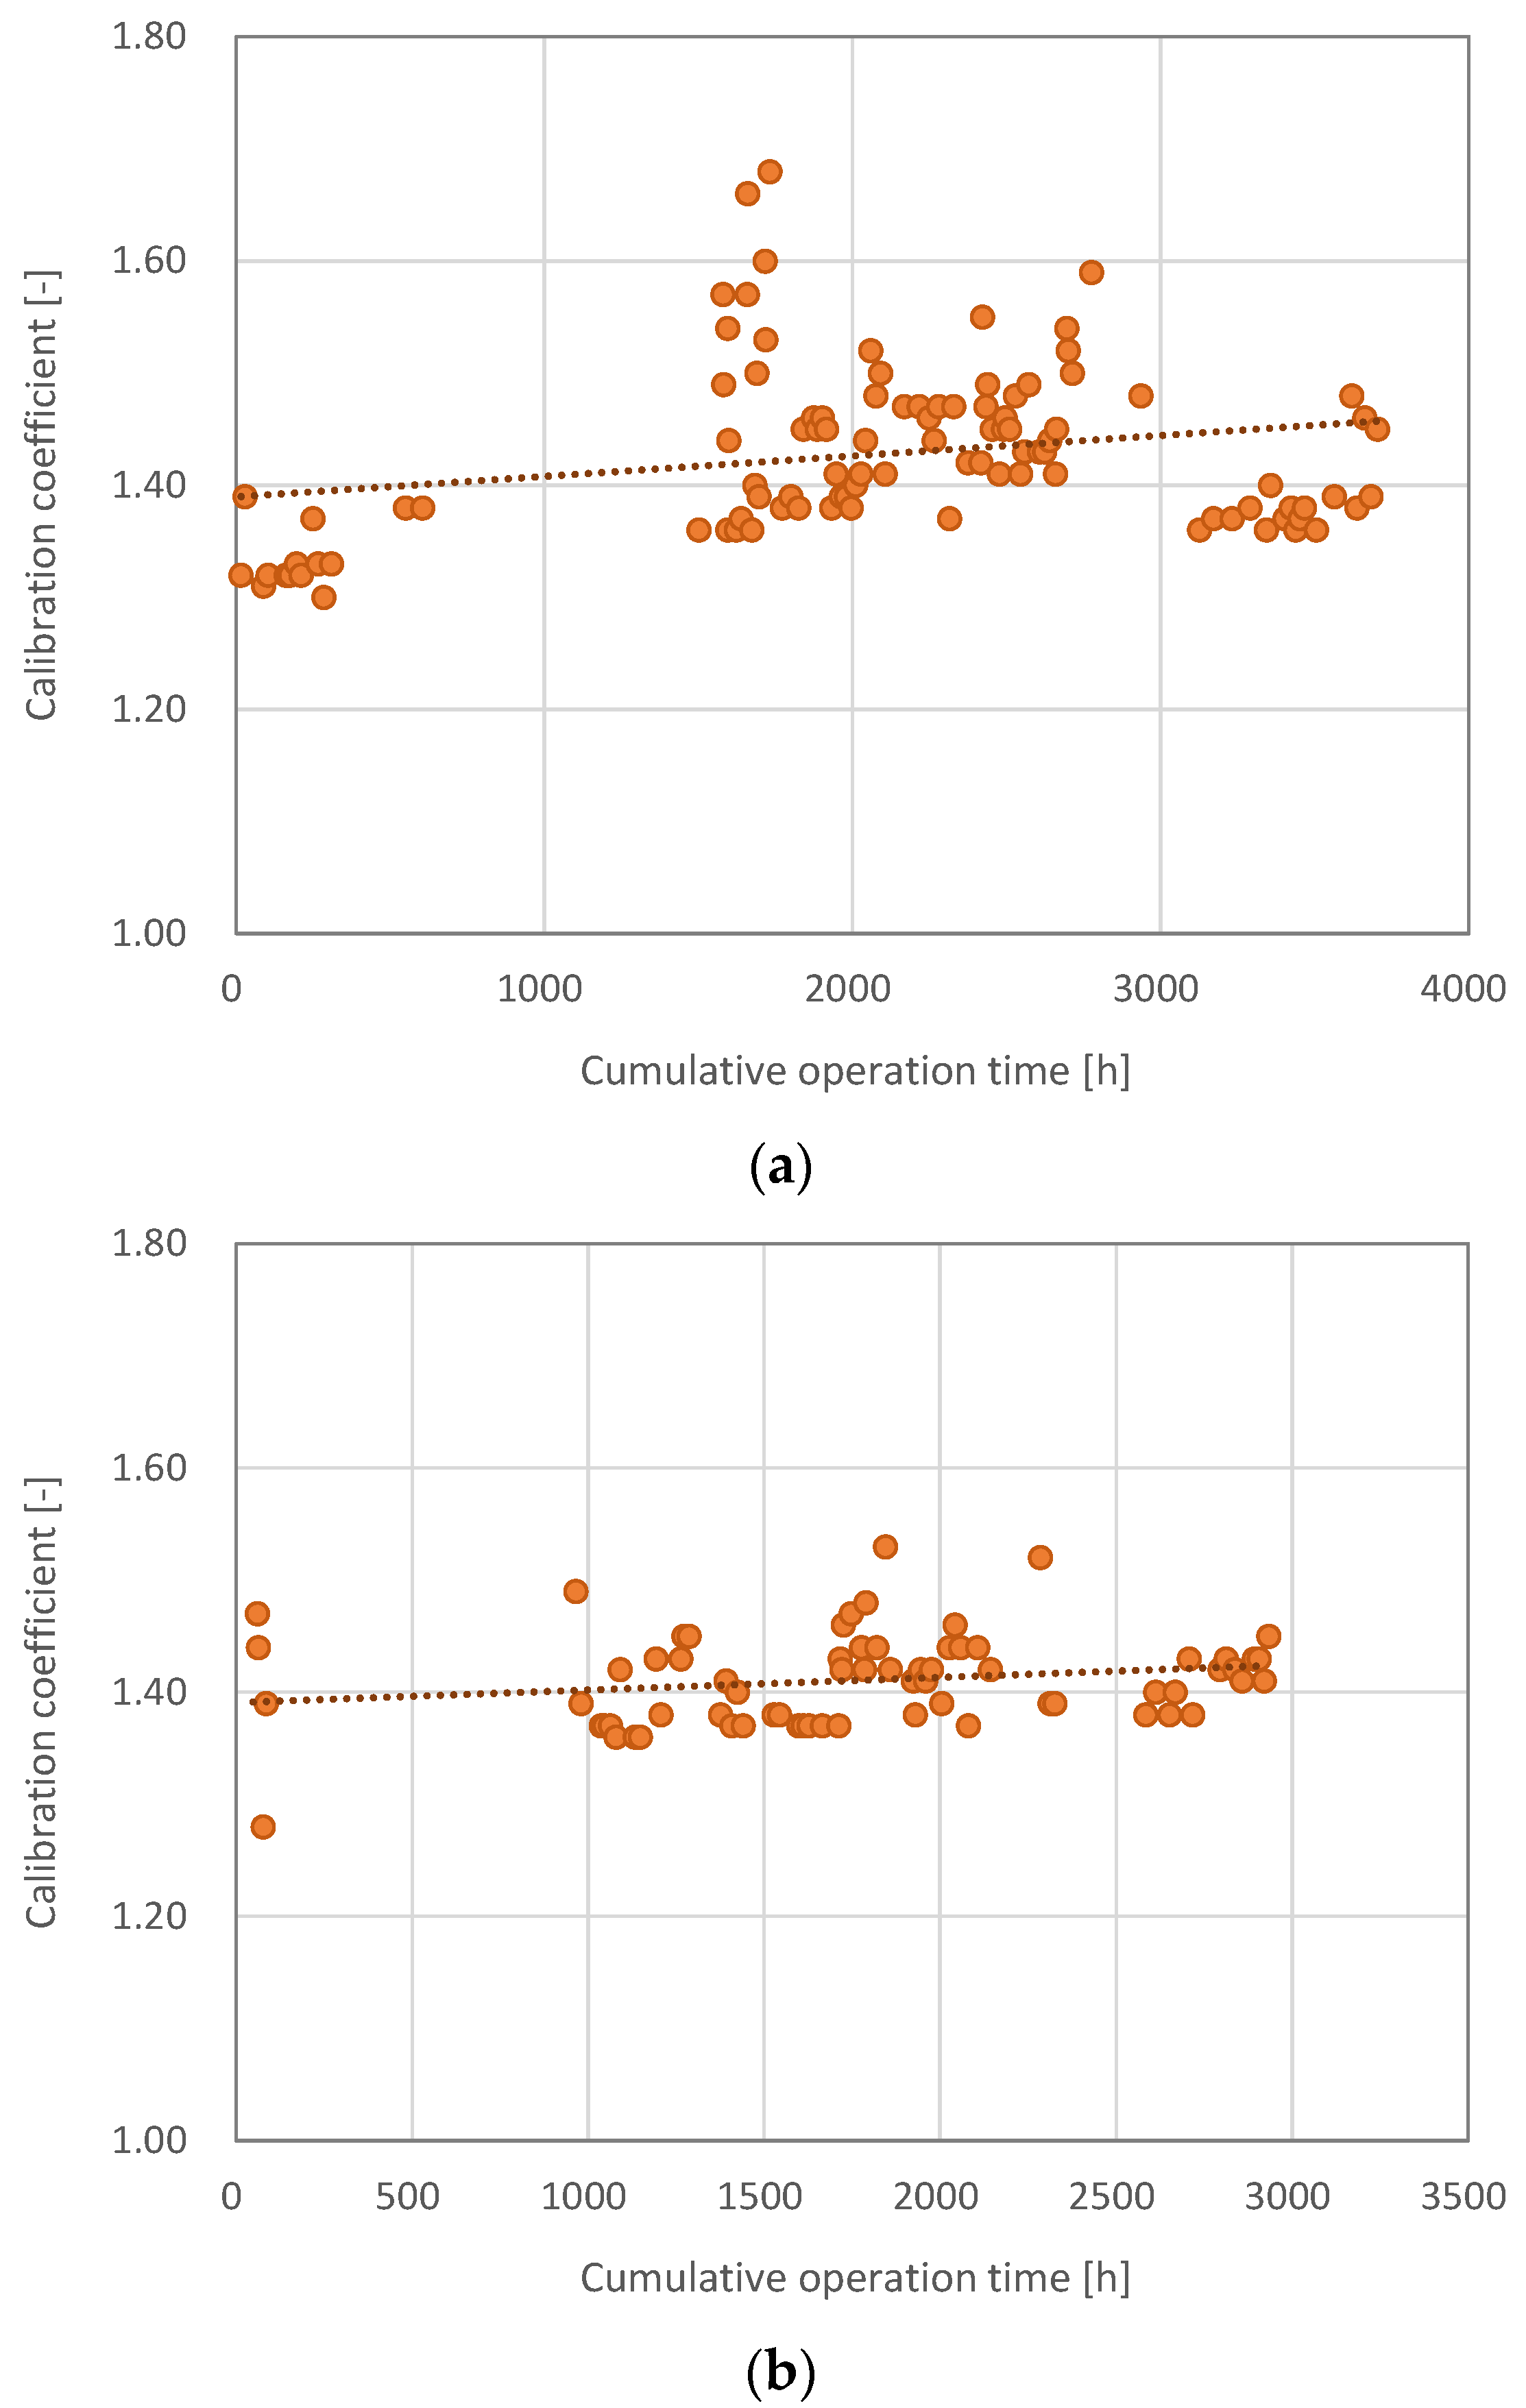
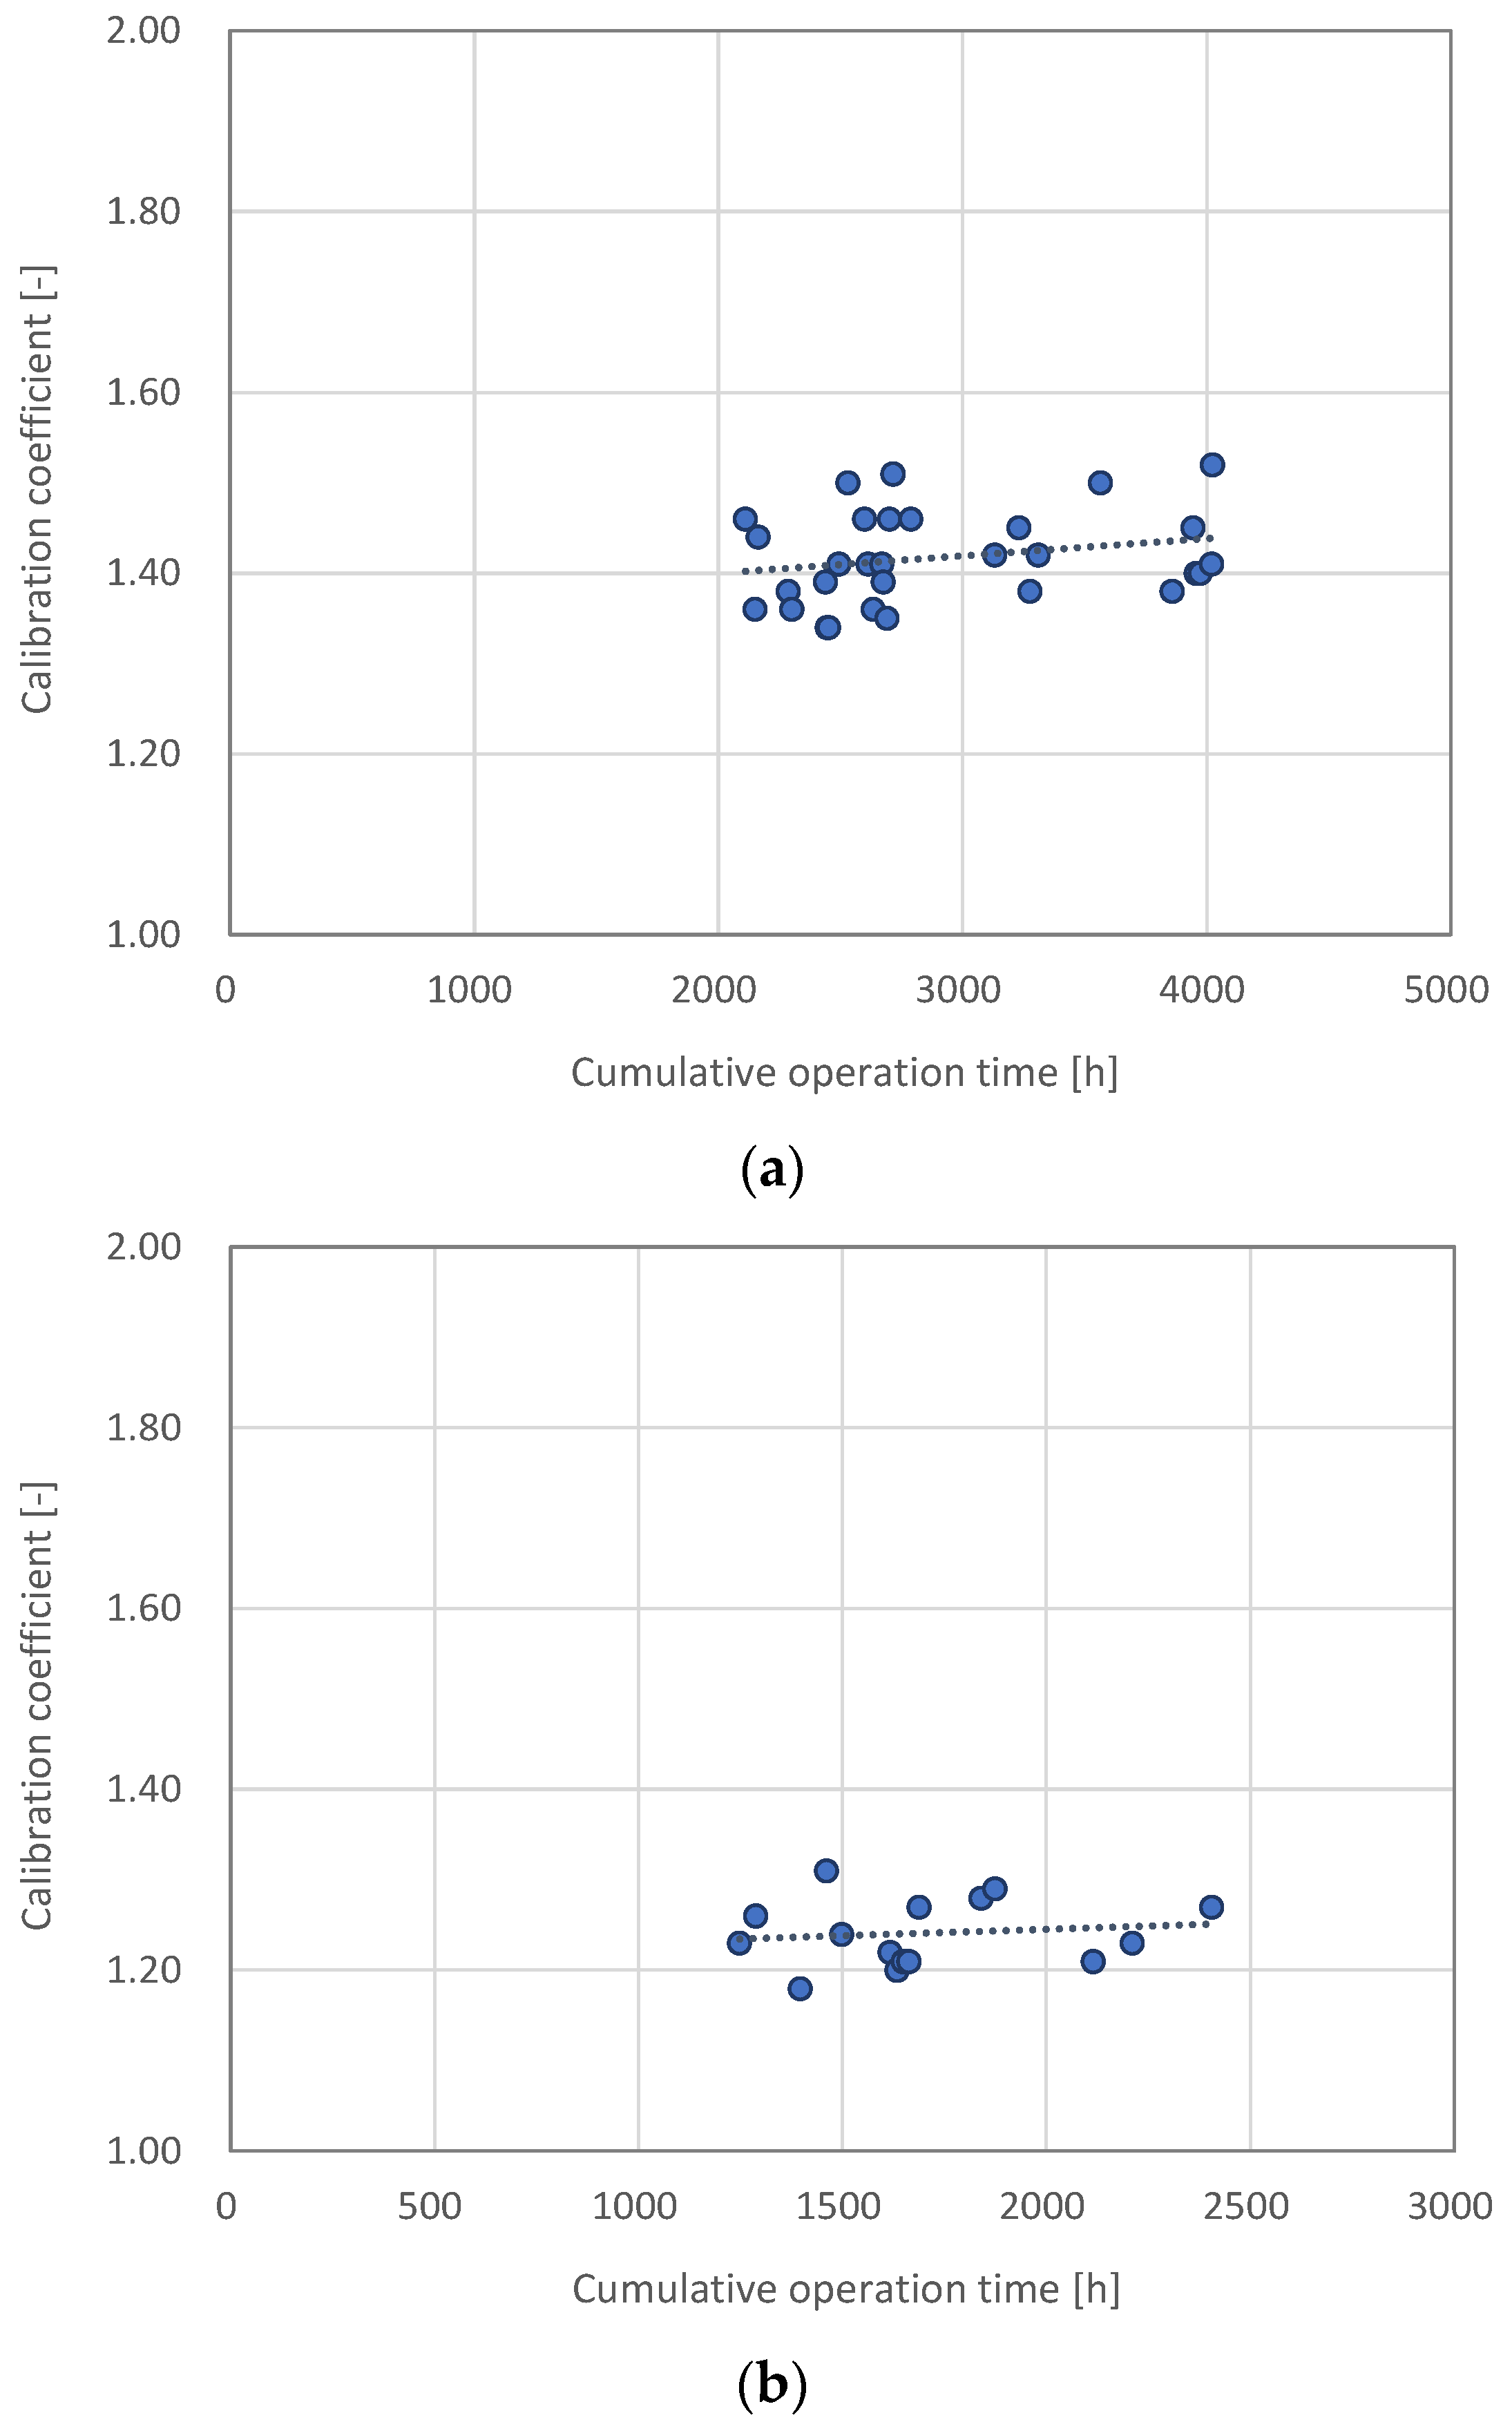
Figure 2, Figure 3 and Figure 4 show the results of calculating the calibration coefficient according to the accumulated operating time for the target device. The results show that the calibration coefficients of all devices are scattered, but the heat source equipment and pump tend to increase and the cooling tower to decrease according to the cumulative operating time. This implies that the energy consumption in the cases of the heat source equipment and the pump is increasing under the same boundary condition, and the amount of heat processed by the cooling tower is decreasing. In addition, it is possible to predict the deterioration rate, defined as the progress of deterioration per unit operation time, using the gradient of the calibration coefficient. Table 6, Table 7 and Table 8 describe the progress rate of degradation of each device. Considering the annual operating hours of these devices to be 700 h, it can be predicted that the annual performance degradation rates have the range of 1.0–1.4% for heat source equipment, 0.4–1.2% for cooling towers, and 0.8–1.3% for pumps.
4. Evaluation of Aging Deterioration Impact Using Simulation

4.1. Development of Heat Source System Simulation

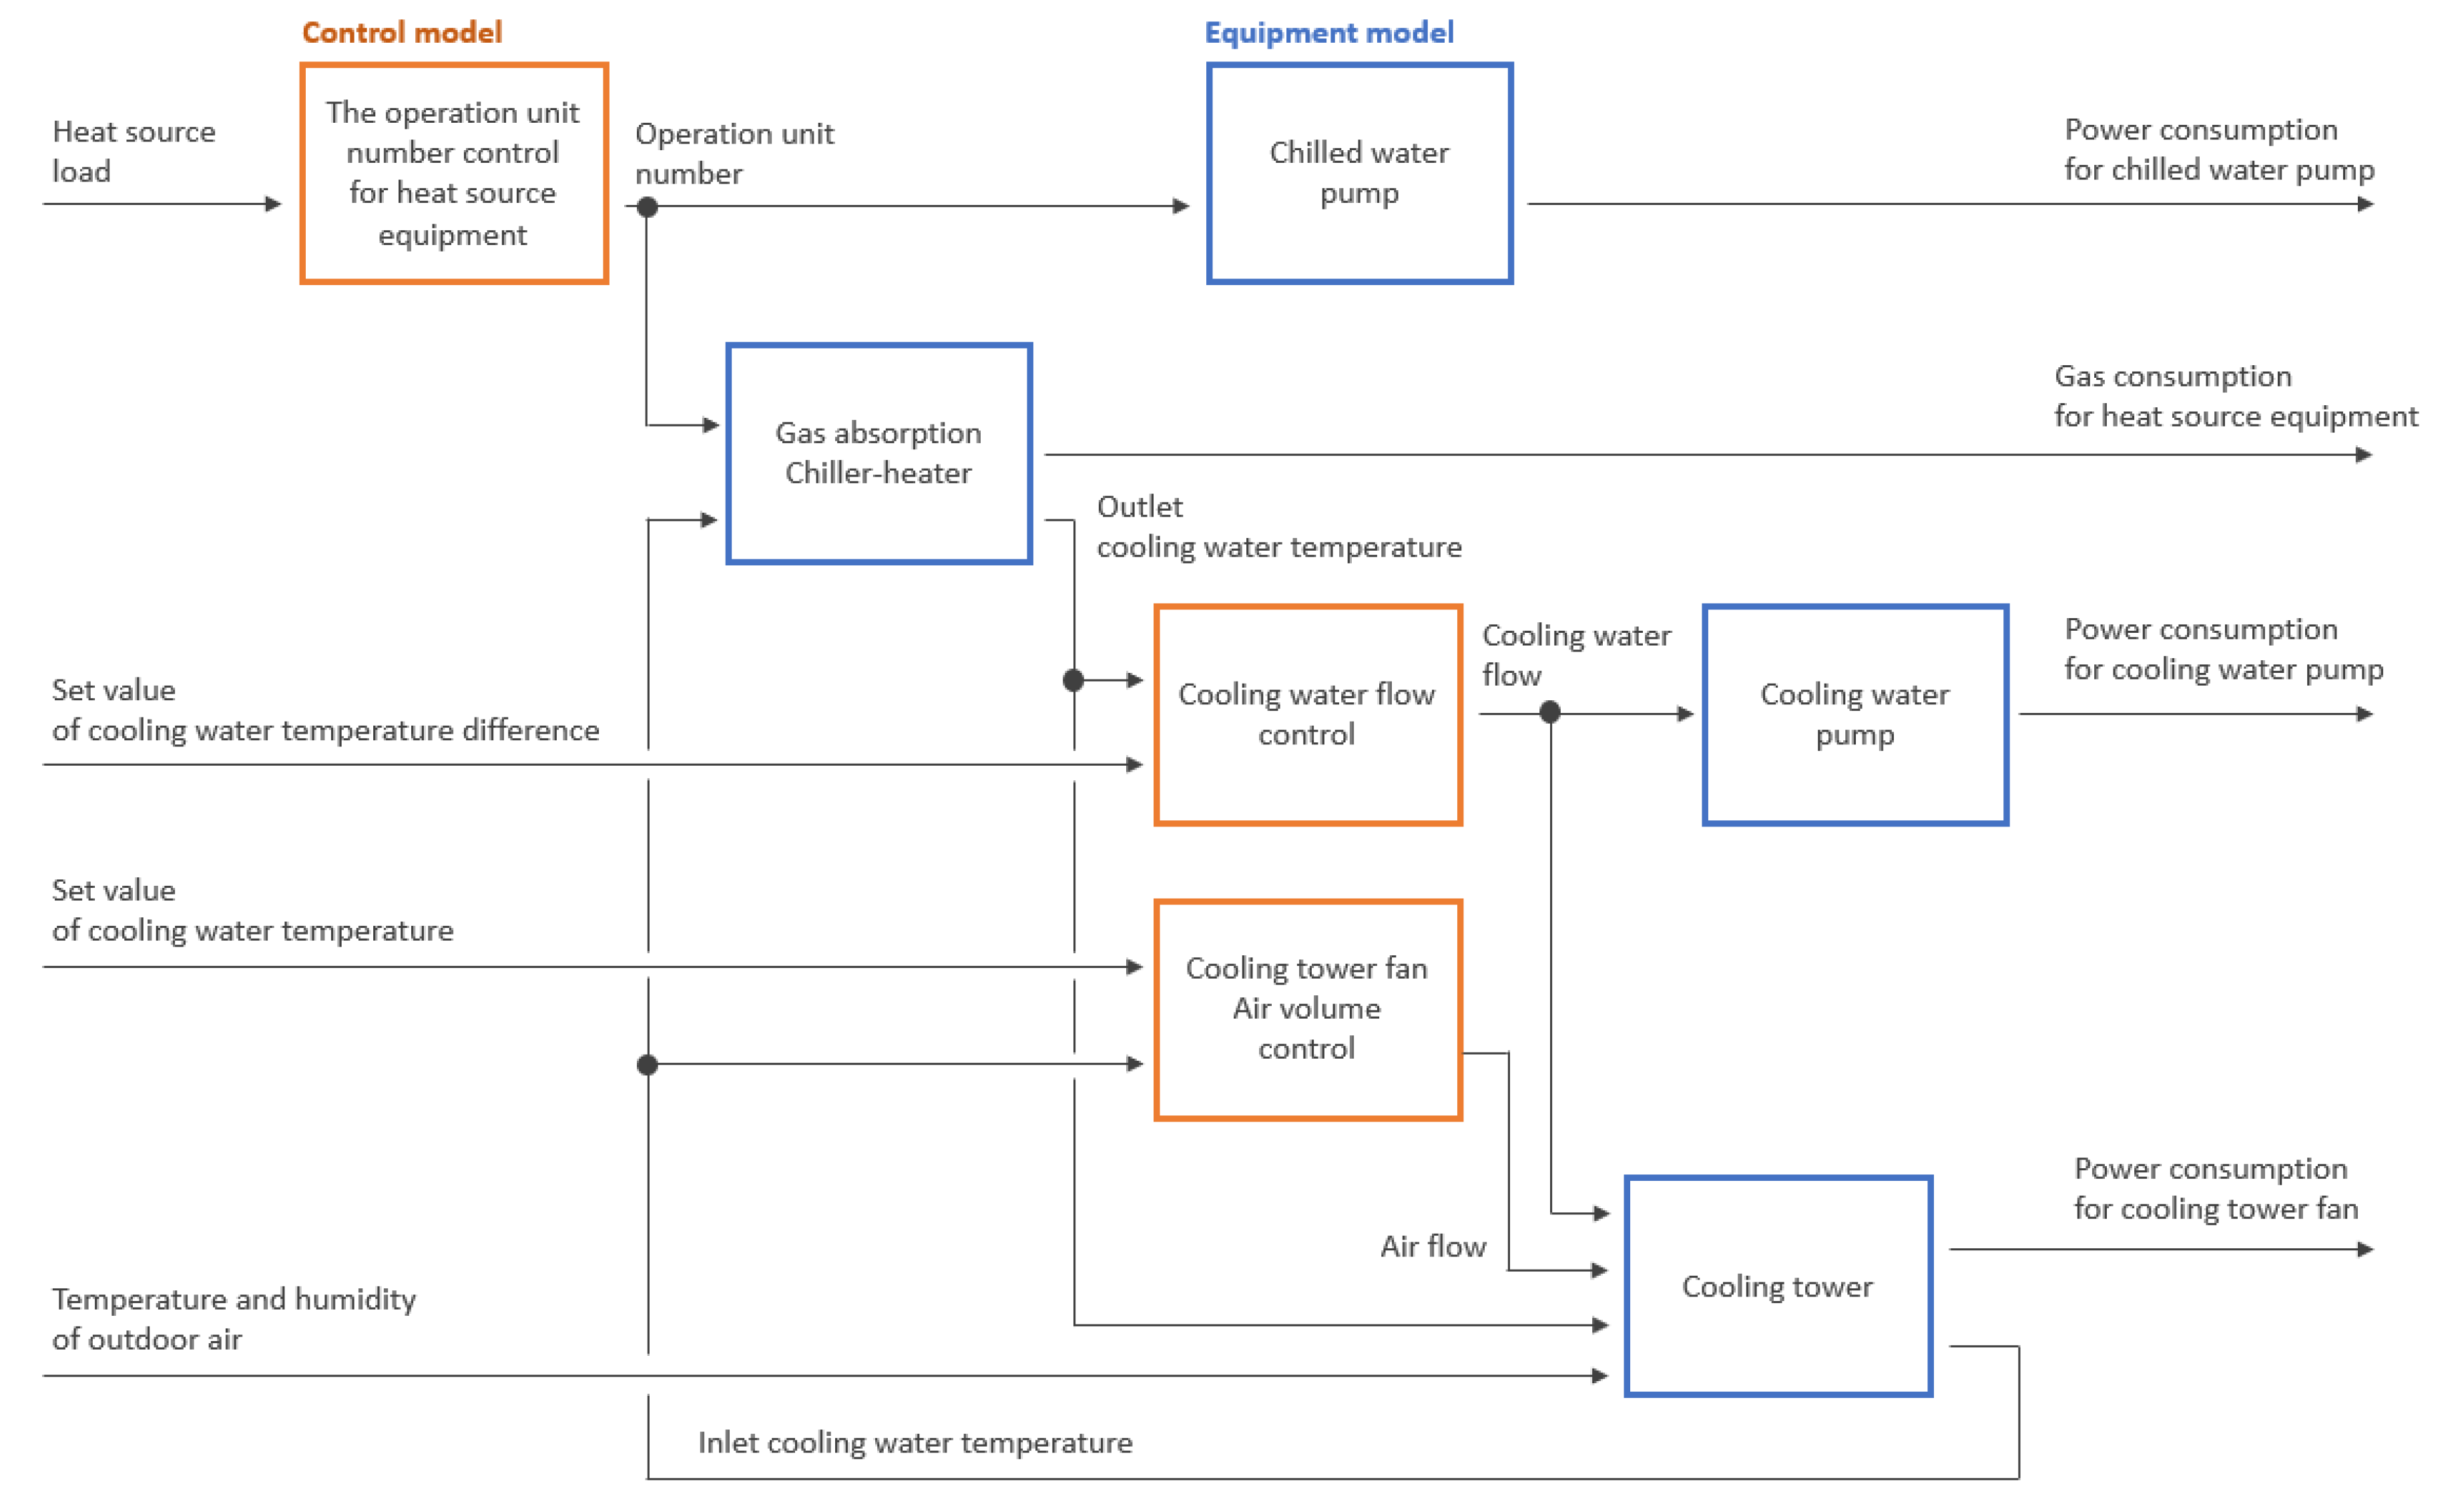
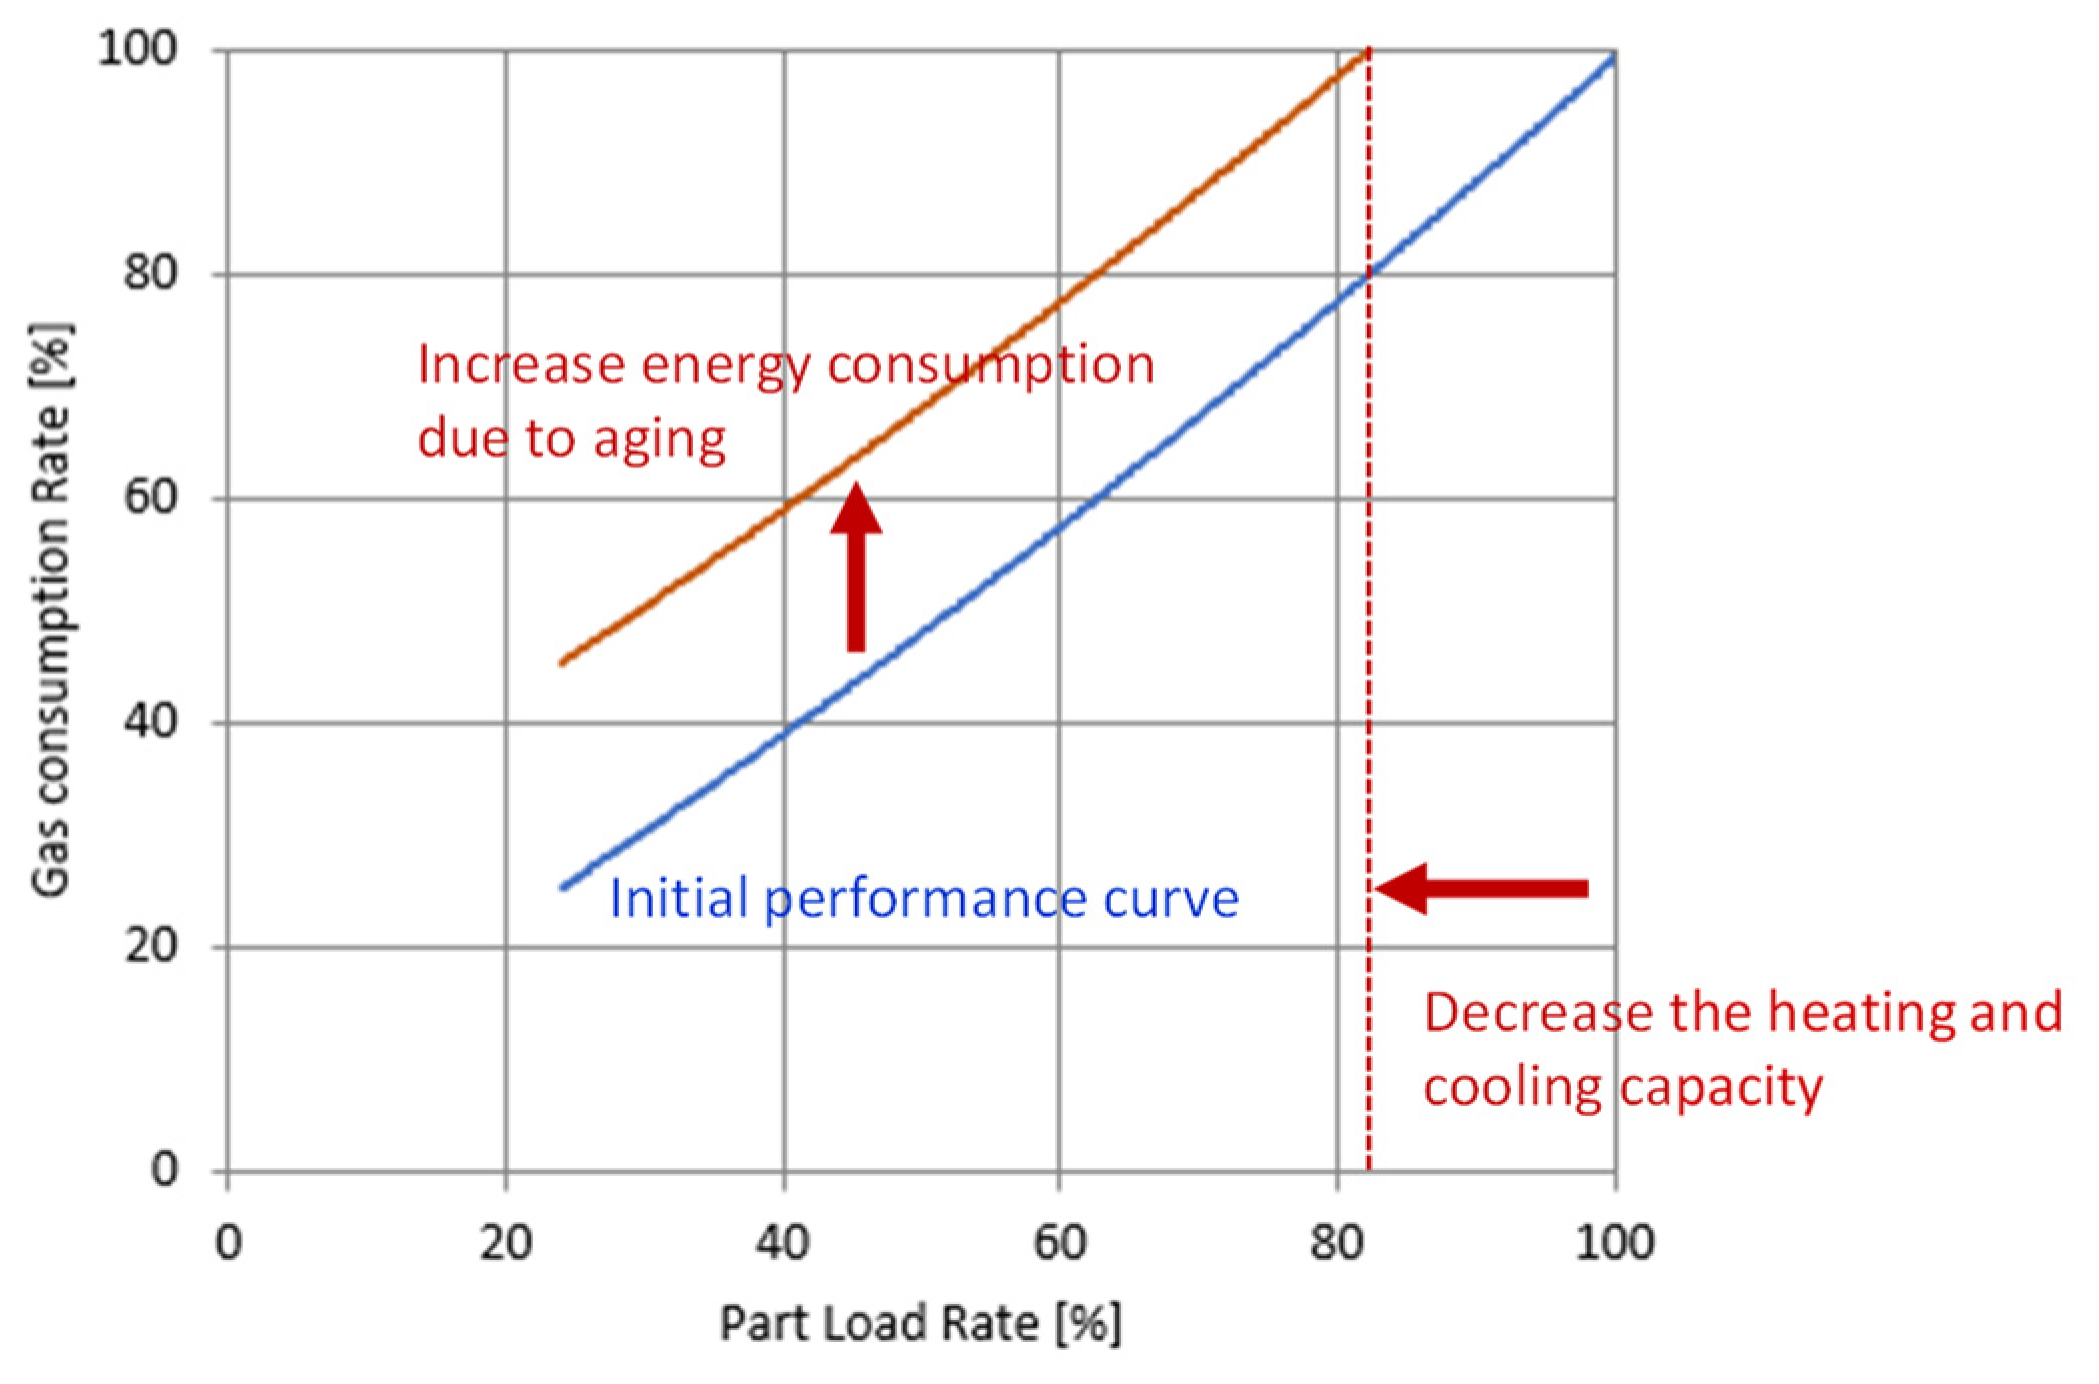
By developing a simulation of the previously diagnosed equipment, the effect of aging deterioration on the heat source system operation and energy consumption was analyzed. The target was a heat source system with 3 units each of a gas absorption chiller-heater, a chilled water pump, a cooling water pump, and a cooling tower. The energy simulation consisted of 4 device models (gas absorption chiller-heater, cooling tower, chilled water pump, cooling water pump) and 3 control models (Operation unit number control for heat source equipment, cooling tower fan air volume control, cooling water flow control), and by connecting these the heat source system simulation was constructed. The simulation flow chart is shown in Figure 5. In the flowchart, it is possible to check the connection status of the models and the main input/output data. The input values of the system simulation are shown on the left side and the output values are on the right side. Input values are heat source load, temperature and humidity of outdoor air, set values of cooling water temperature difference and cooling water temperature. The output value is the energy consumption of each piece of equipment. For the gas absorption chiller-heater and the cooling water pump models, the logic to decrease the heating and cooling capacity and flow according to the increased energy consumption due to aging is added to the energy consumption calculation model developed in Section 2 (Figure 6). For example, if energy consumption increases due to aging, and the energy consumption at the partial load factor of 85% reaches the rated consumption, the rated value of the cooling/heating capacity of the gas absorption chiller-heater is limited to 85%. For the cooling tower model, we used that developed in Section 2. The chilled water pump is a device that operates at a rated flow. When the number of operating chilled water pumps is determined according to the operating number of the gas absorption chiller-heater, the flow rate and power consumption are calculated based on the corresponding rated values, which are 348 m3/h and 26 kW, respectively. The specifications for the control model are as follows.
(1)
Operation unit number control for heat source equipment
The number of operating gas absorption chiller-heaters, which is a heat source equipment, is controlled according to the heat source load. When the heat source equipment heats up to 90% or more, the number of operating units is increased by one, and when it is below 80%, one unit is decreased. For the number of units, the minimum and maximum values are one and three, respectively.
(2)
Cooling tower fan air volume control
The cooling tower fan controls the number of operating units such that the outlet cooling water temperature reaches a set value of 32 °C. When the cooling water temperature is over 34 °C, the number of cooling tower fans is increased by one, and when it is below 30 °C, this number is decreased by one. Once the required number of operating fans is determined, the air volume is calculated by multiplying the fan’s rated air volume by 72,000 m3/h. For the number of cooling tower fans, the minimum and maximum values are zero and five, respectively.
(3)
Cooling water flow control
The cooling water flow rate is controlled by adjusting the pump frequency with PI control so that the temperature difference between the inlet and outlet of the cooling tower is maintained at 5 °C.
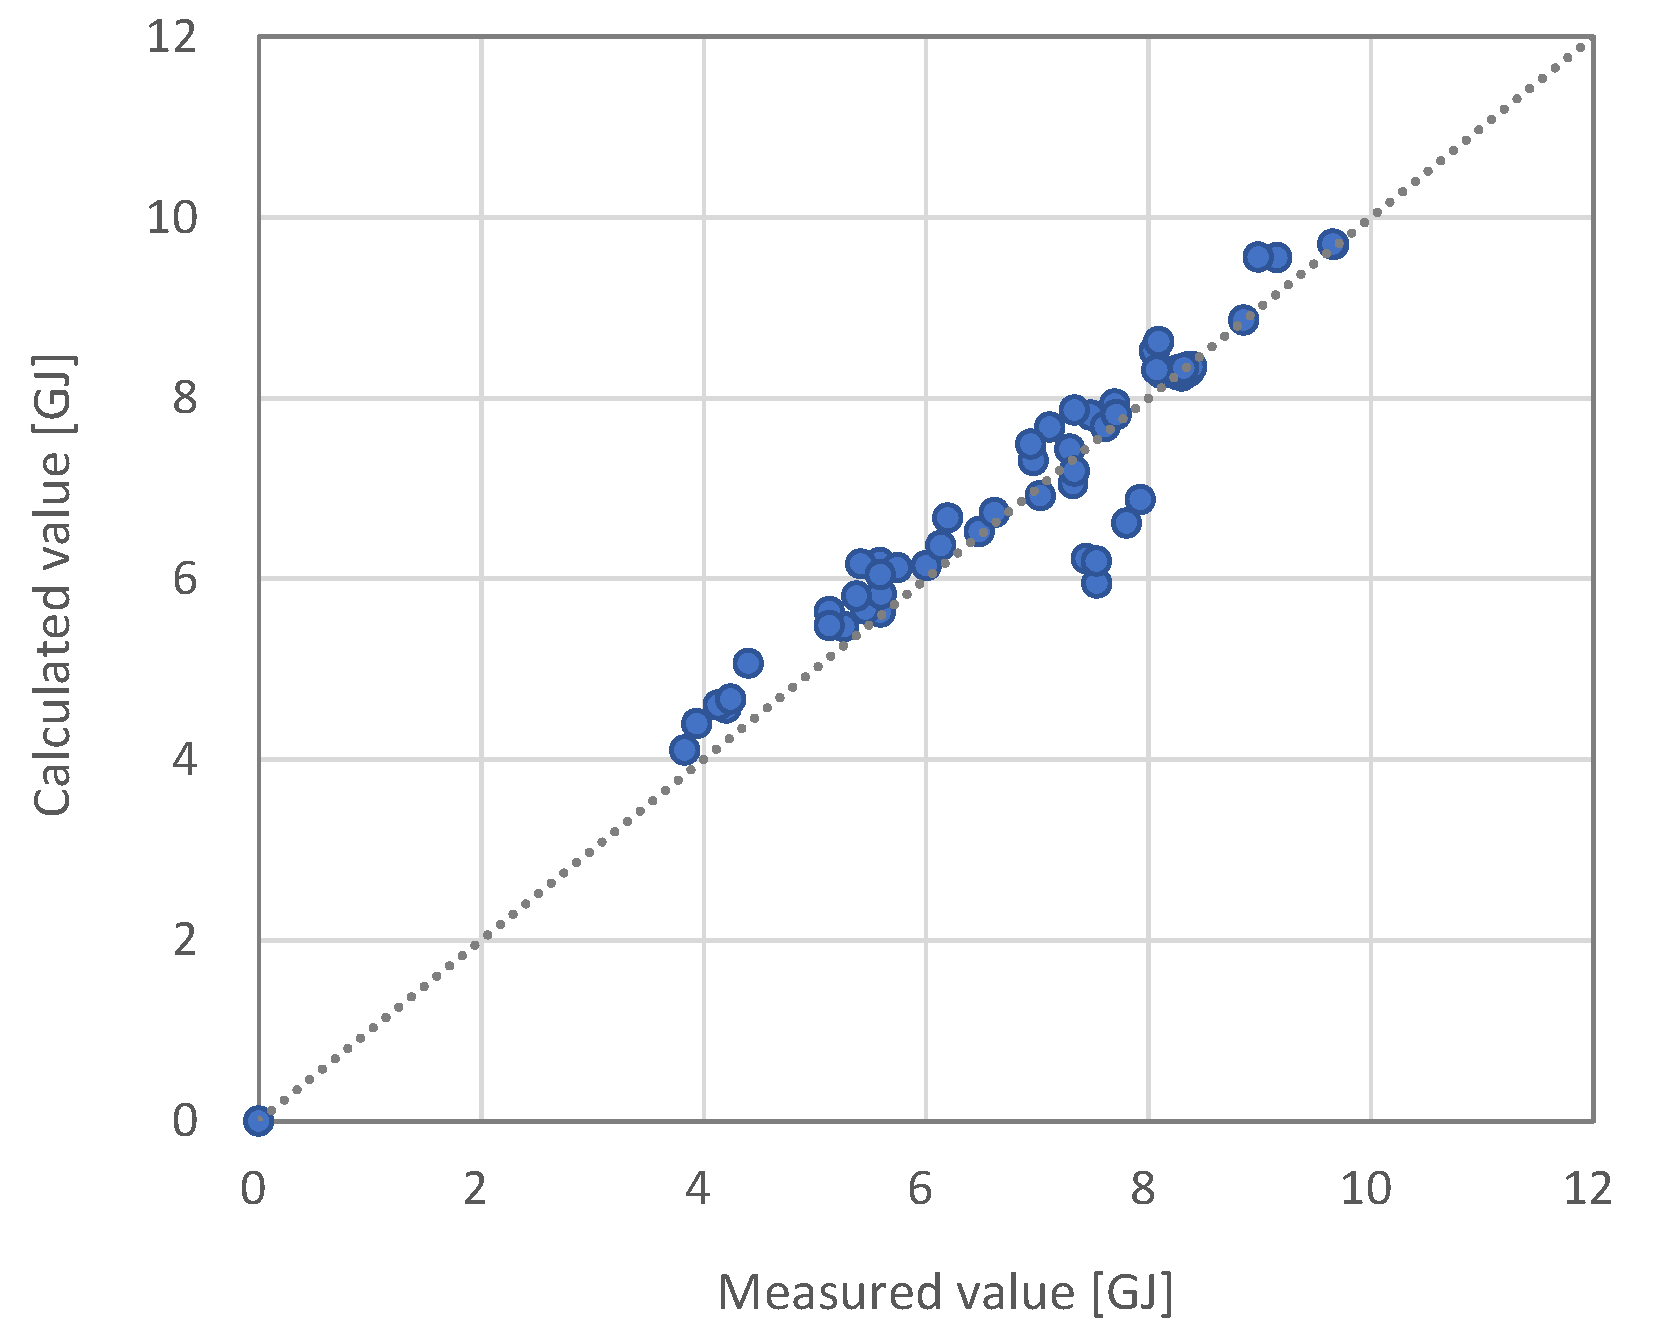
The input parameters of the heat source system simulation are the heat source load, outdoor temperature and humidity, and control set values (cooling water temperature = 32 °C, cooling water temperature difference = 5 °C), and its output is the energy consumption of each device. The accuracy of the simulation was verified by comparing that to the true cooling operation data of the university building. After calibrating each device model using data from 1 June to 21 June, the measured and calculated values were compared with the data collected between 22 June and 29 June. The energy sources of the target system consisted of gas and electricity and were converted into primary energy consumption for comparative evaluation. The primary energy conversion factors used were 1.1 for gas and 2.75 for electricity [12]. Between the measured and calculated values, the mean bias error (MBE) was −1.0% and the coefficient of variation of the root mean square error (CV_RMSE) was 8.6% (as shown in Figure 7), therefore verifying the accuracy of the heat source system simulation. ASHRAE Guideline 14, a representative measurement and verification (M&V) guide, international performance measurement and verification protocol (IPMVP), and federal energy management program (FEMP) set the error tolerance standard for simulations calibrated at time intervals MBE ± 10% and CV_RMSE ± 30%. Therefore, it can be confirmed that our designed simulation has sufficient accuracy [13,14,15].

4.2. Variation in Energy Consumption of Heat Source Systems due to Aging Deterioration

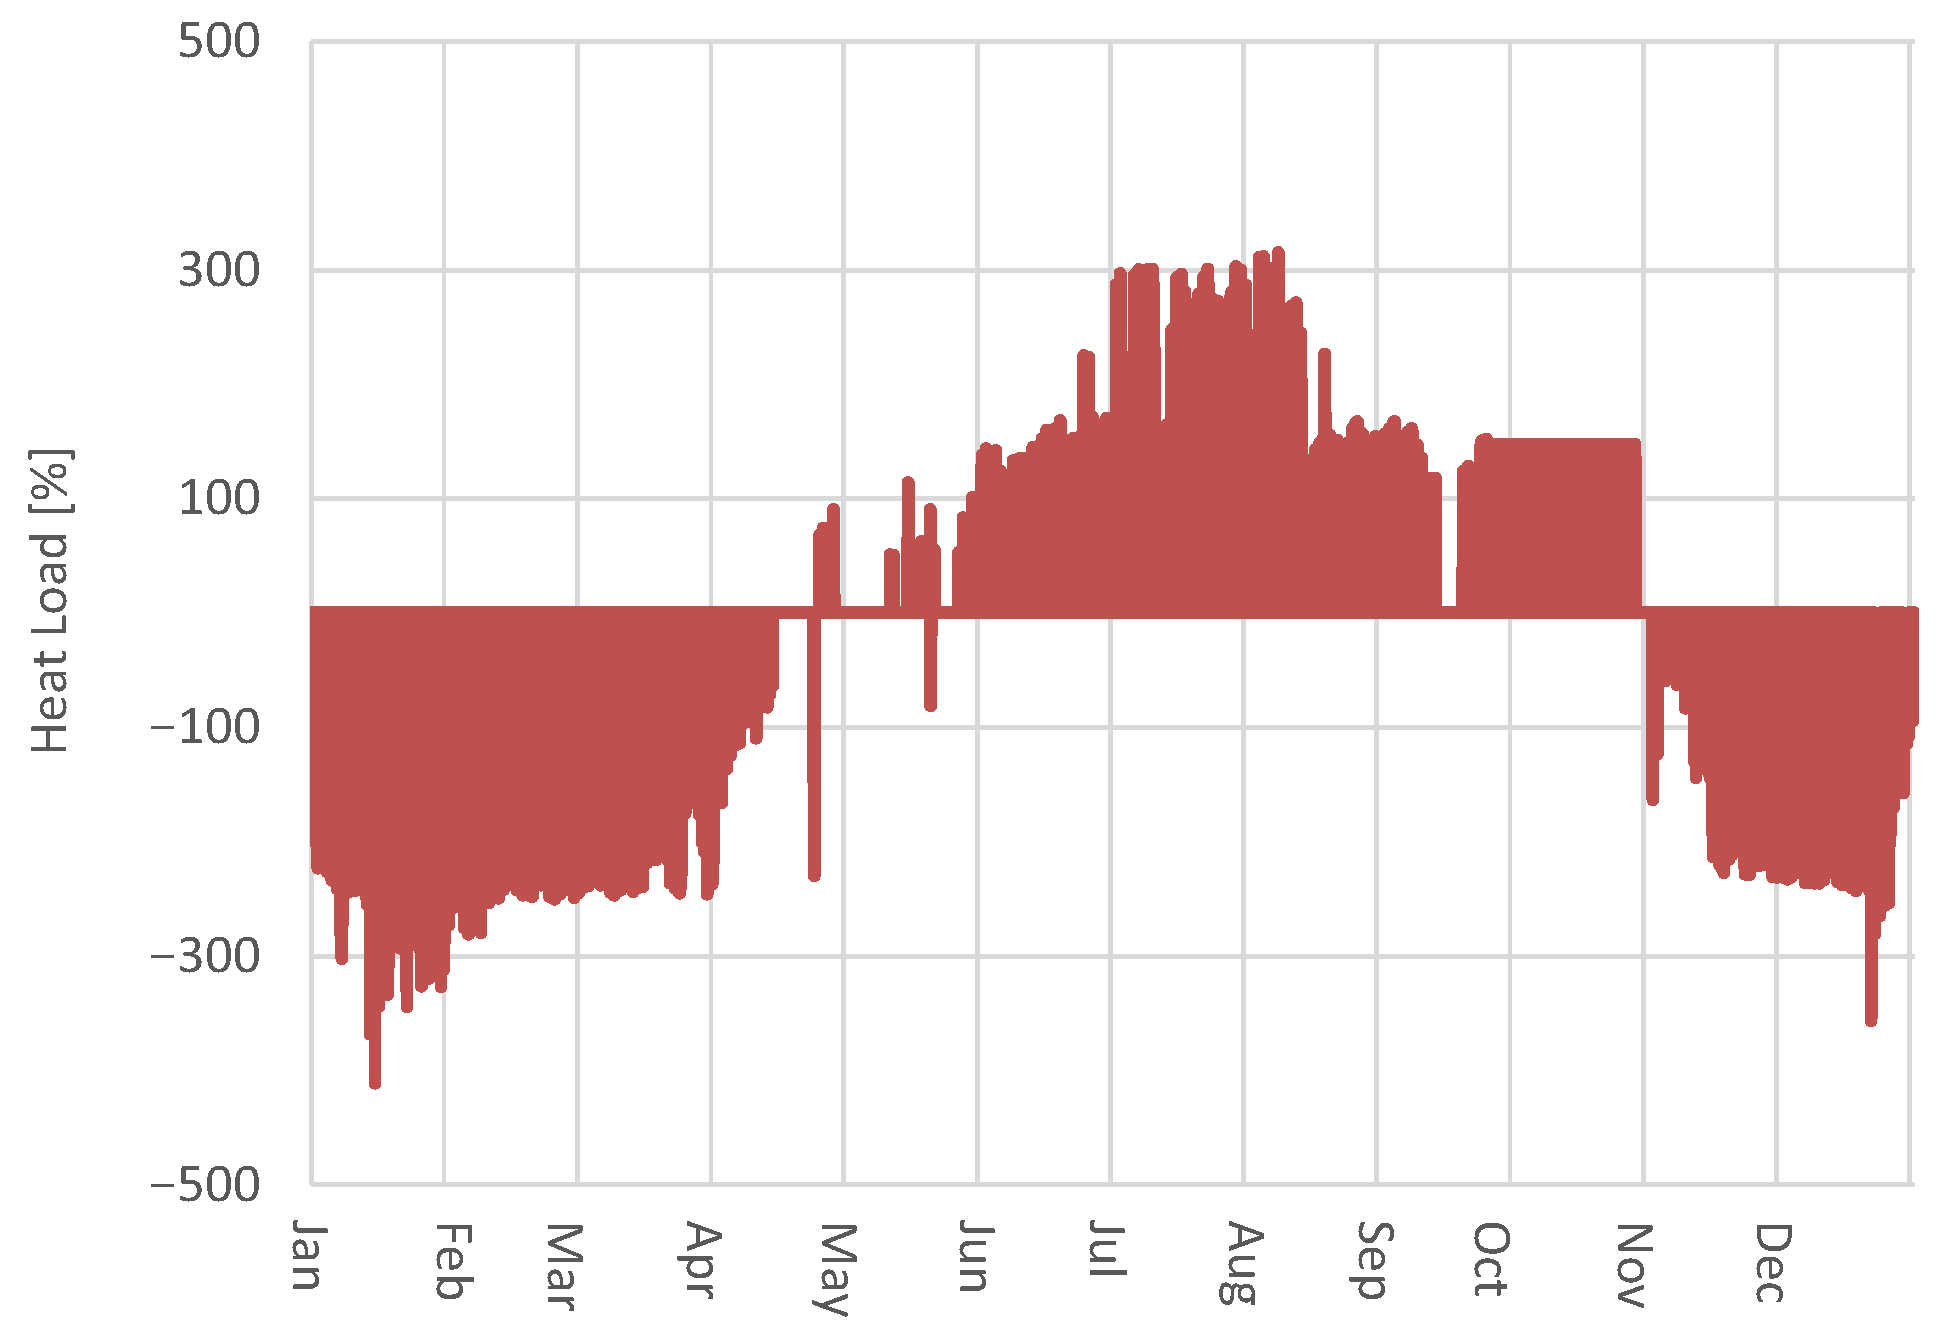
In the case of long-term operation of the heat source system, the effects of aging on the system’s energy efficiency were reviewed using the above-described simulation. The simulation period was set to 15 years of the legal service life of the heat source system. the operating data for 1 year of the university building was used as the boundary conditions such as weather data and heat source load for the simulation. For the case of cooling operation, the chilled water temperature at the outlet of the heat source equipment was 7 °C, the cooling tower outlet cooling water temperature was 32 °C, and the cooling tower inlet/outlet cooling water temperature difference was 5 °C. In the case of the heating operation, the hot water temperature at the outlet of the heat source equipment was set to 60 °C. The heat source load and the corresponding boundary conditions are shown in Figure 8, where the positive and negative numbers indicate cooling and heating loads, respectively.
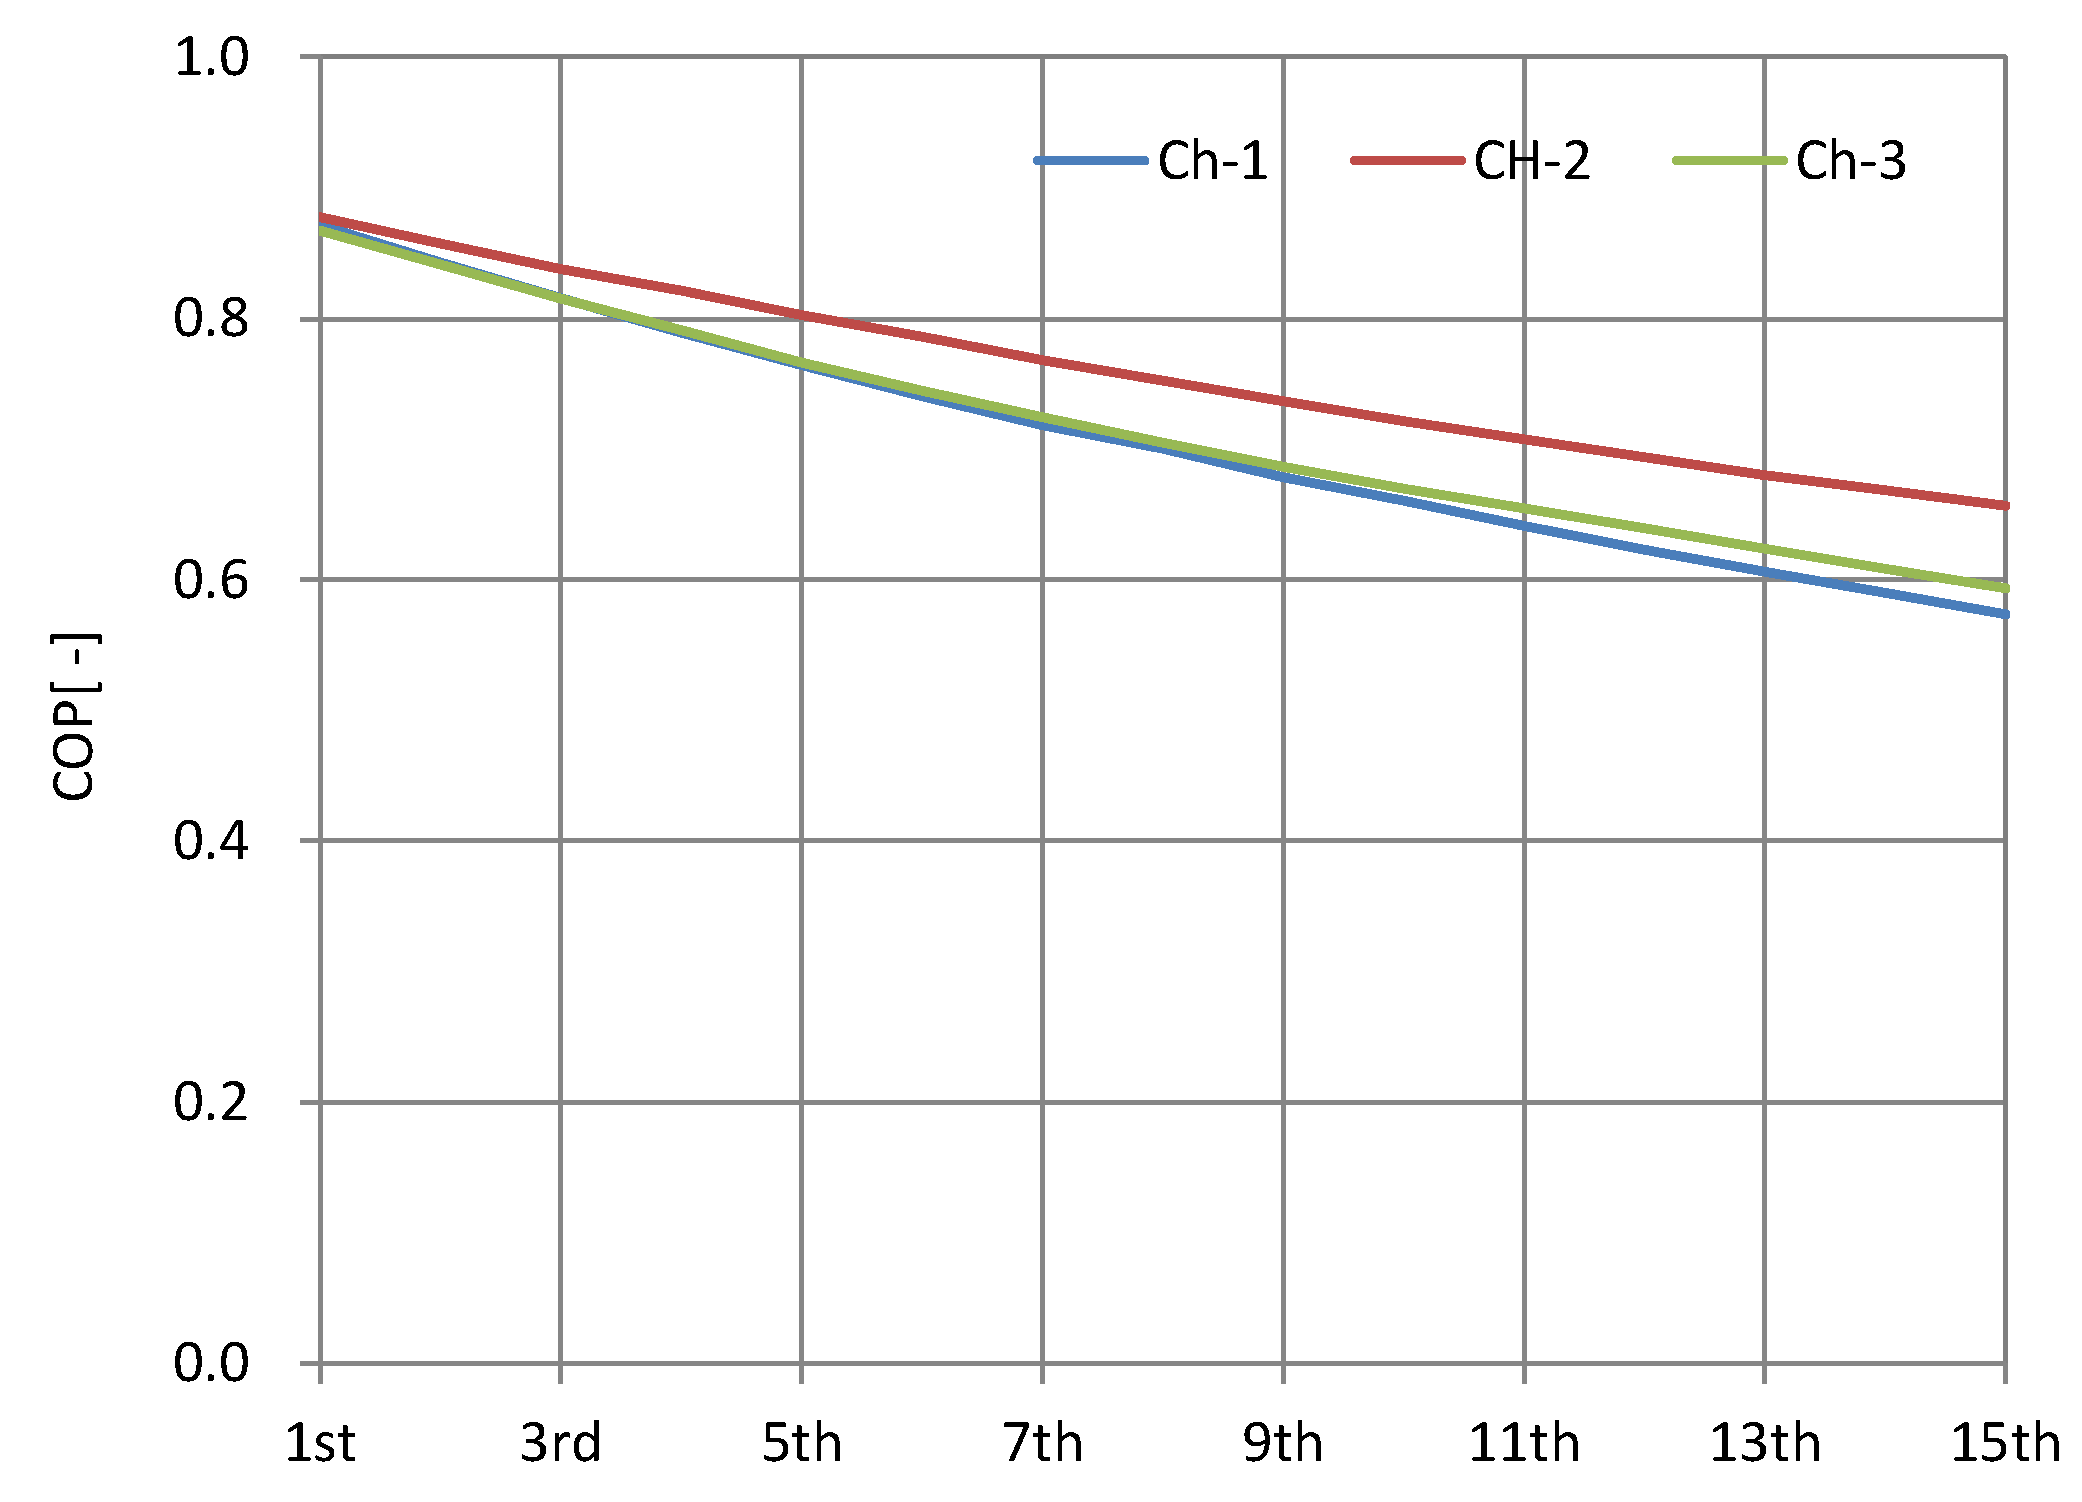
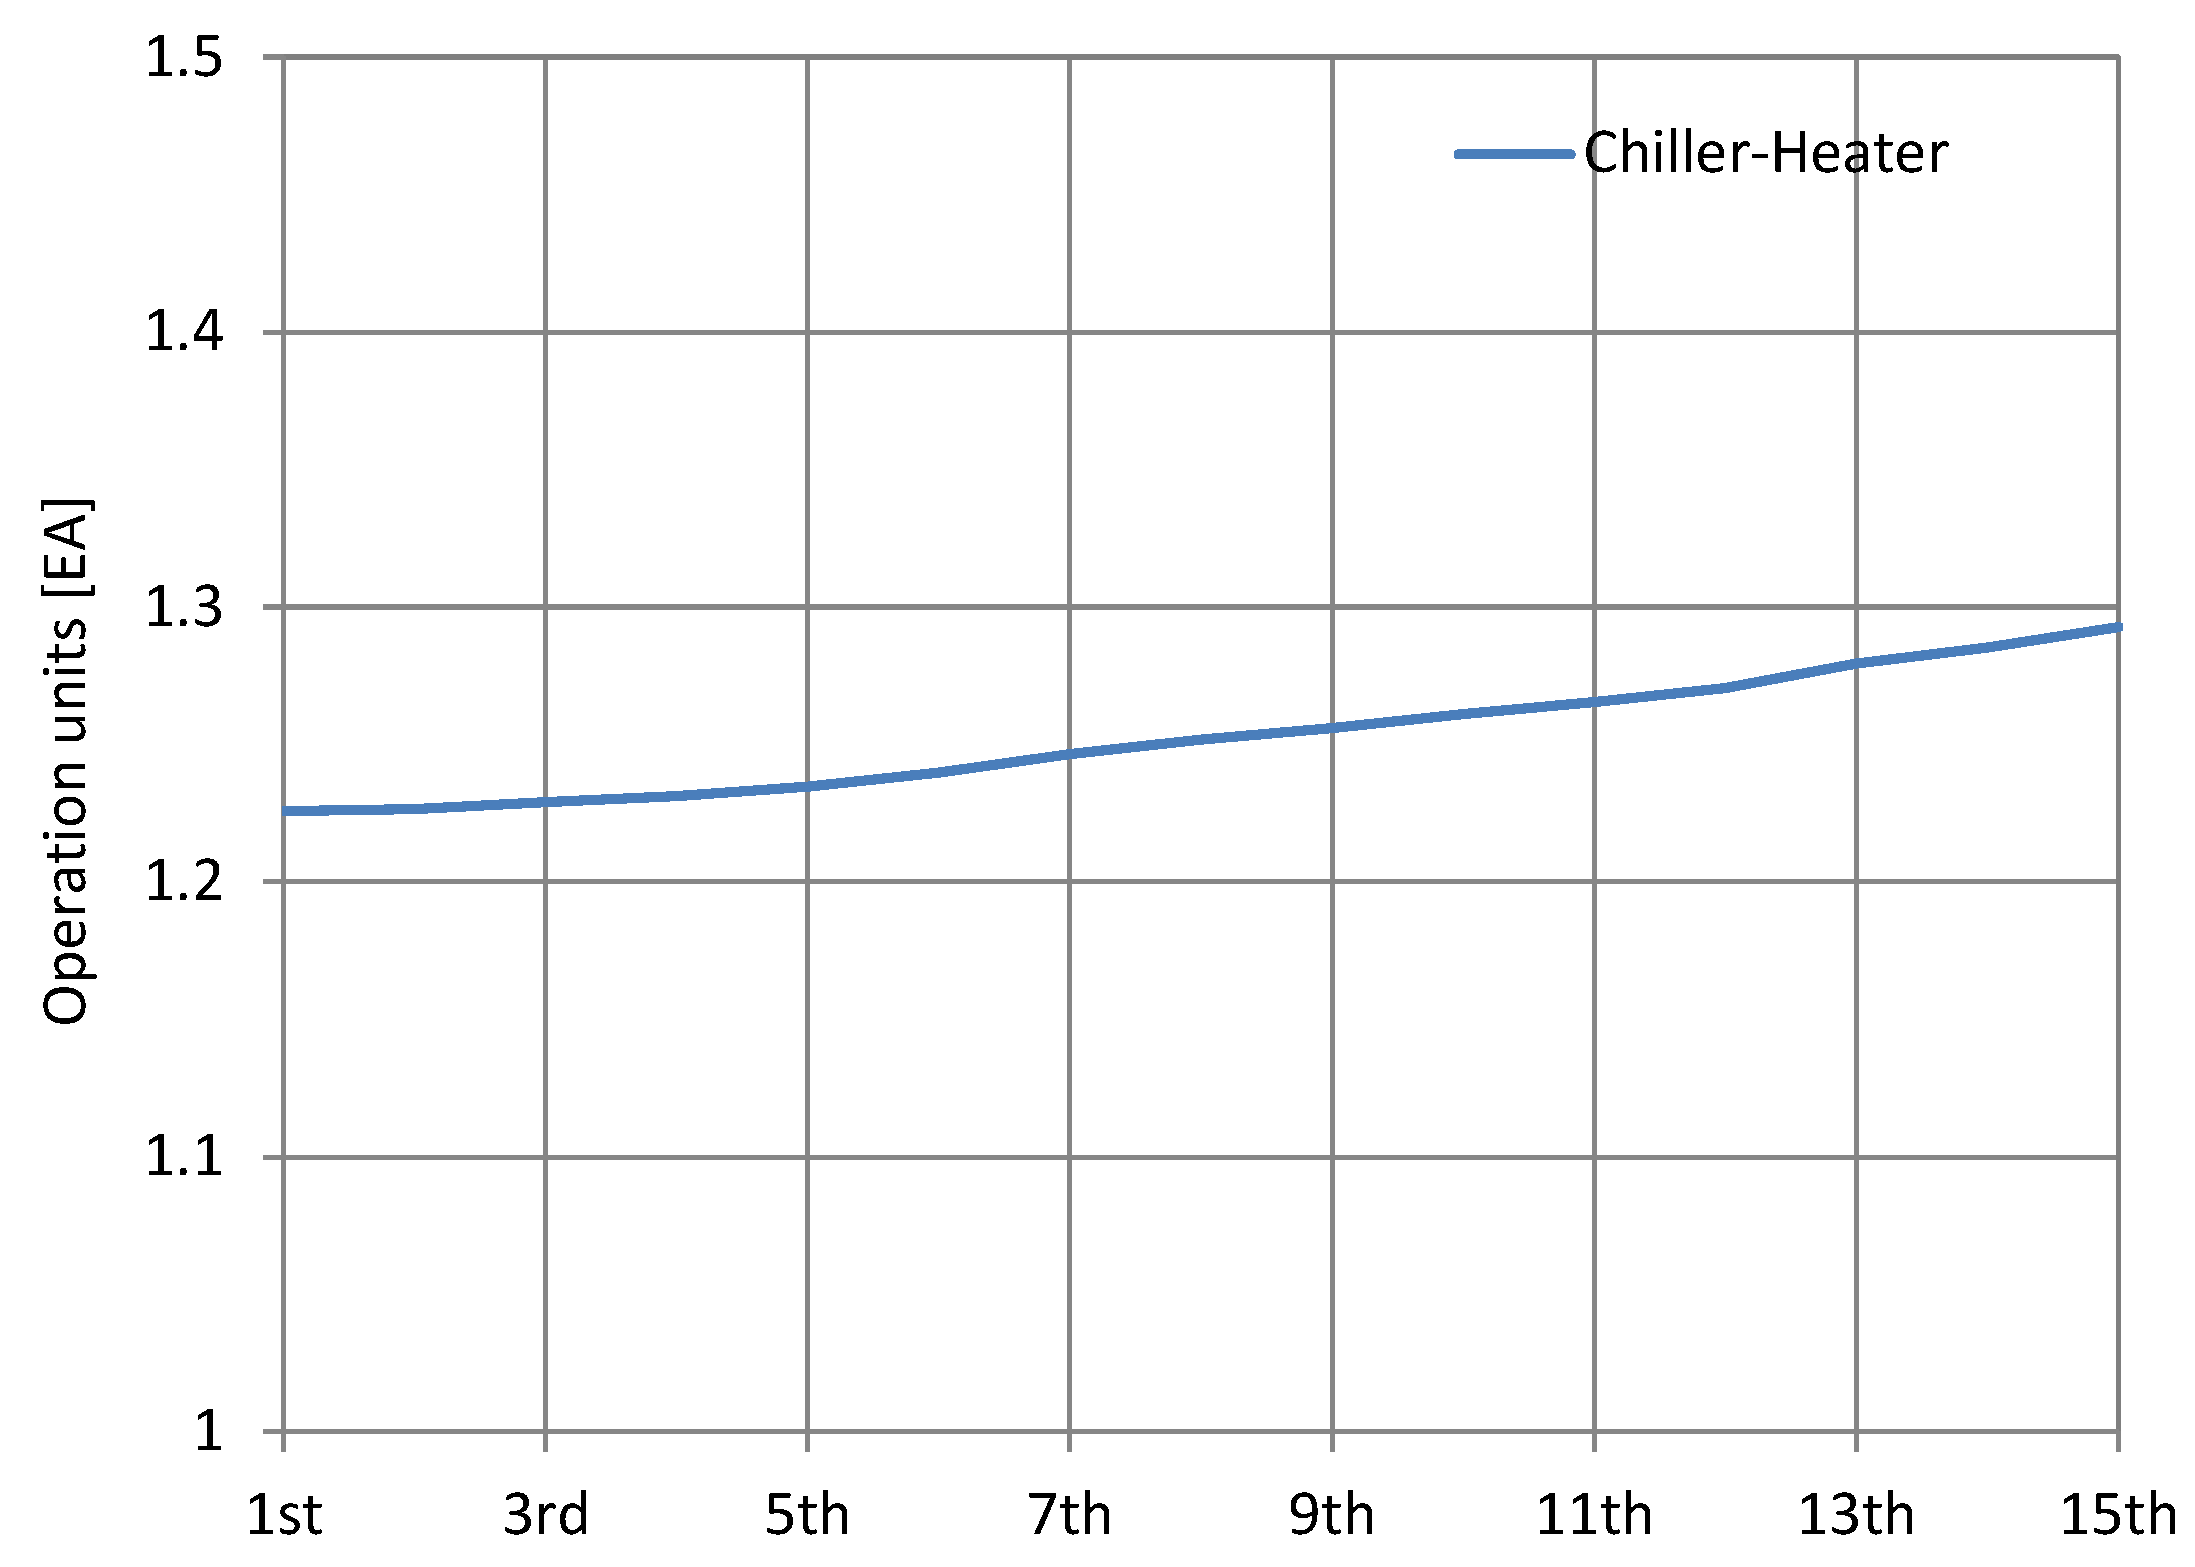
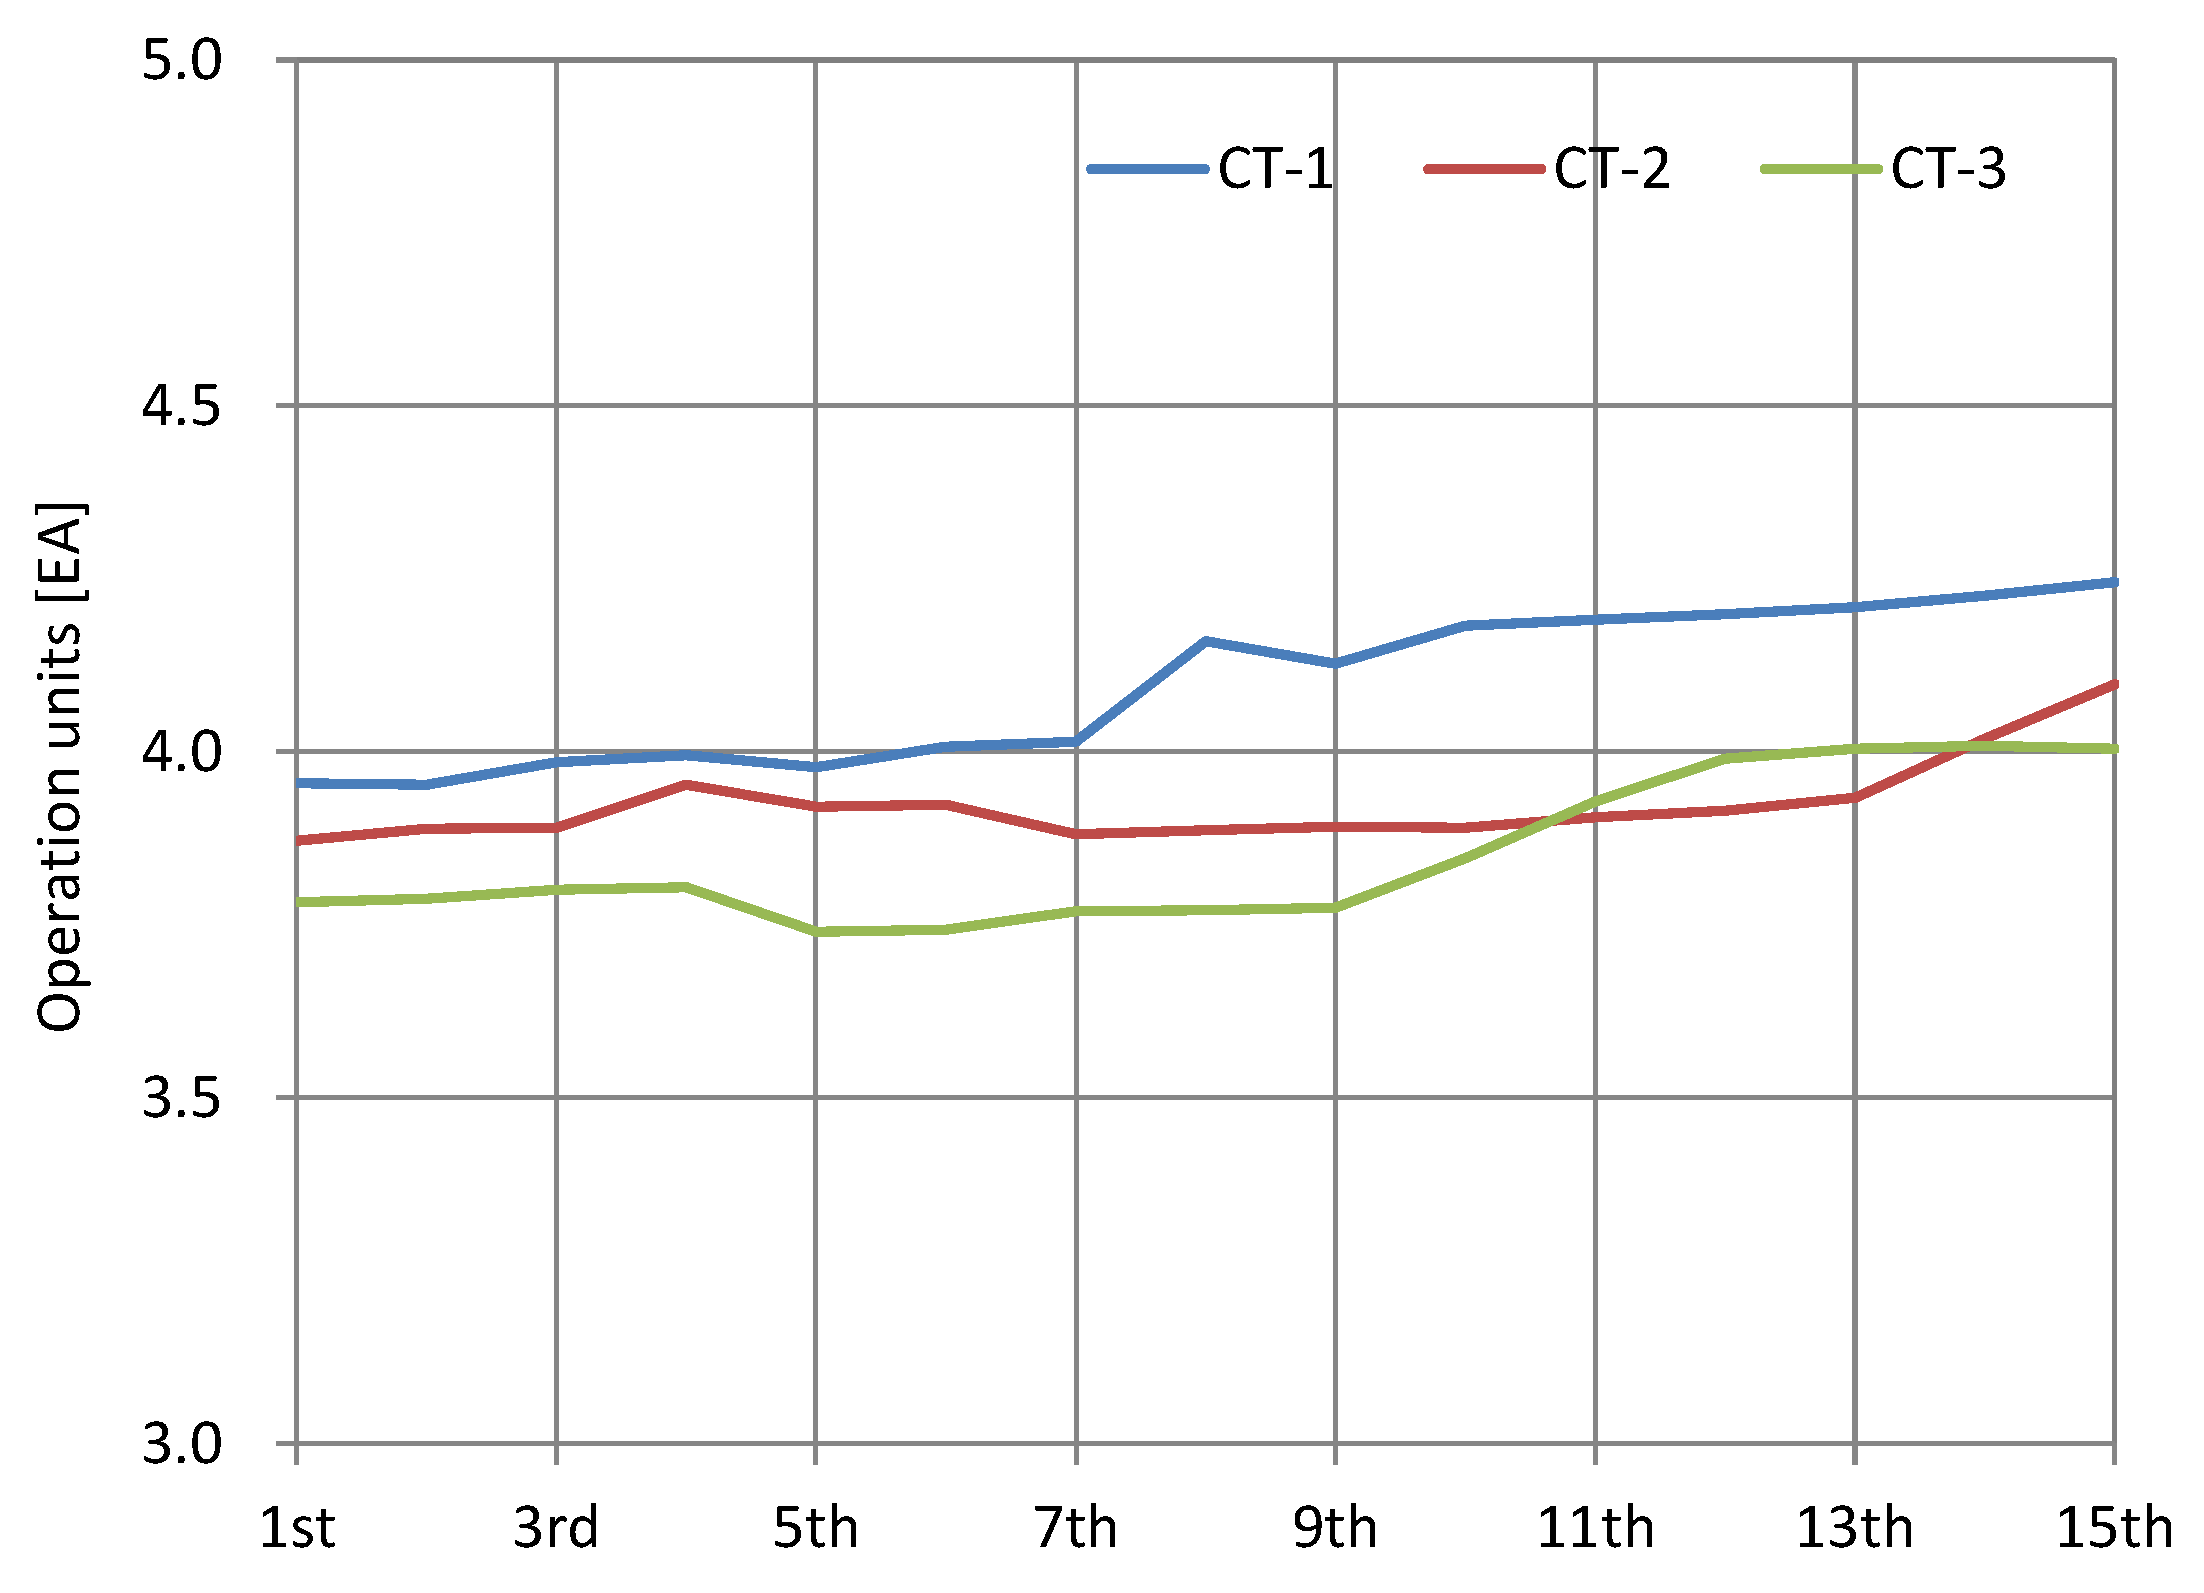
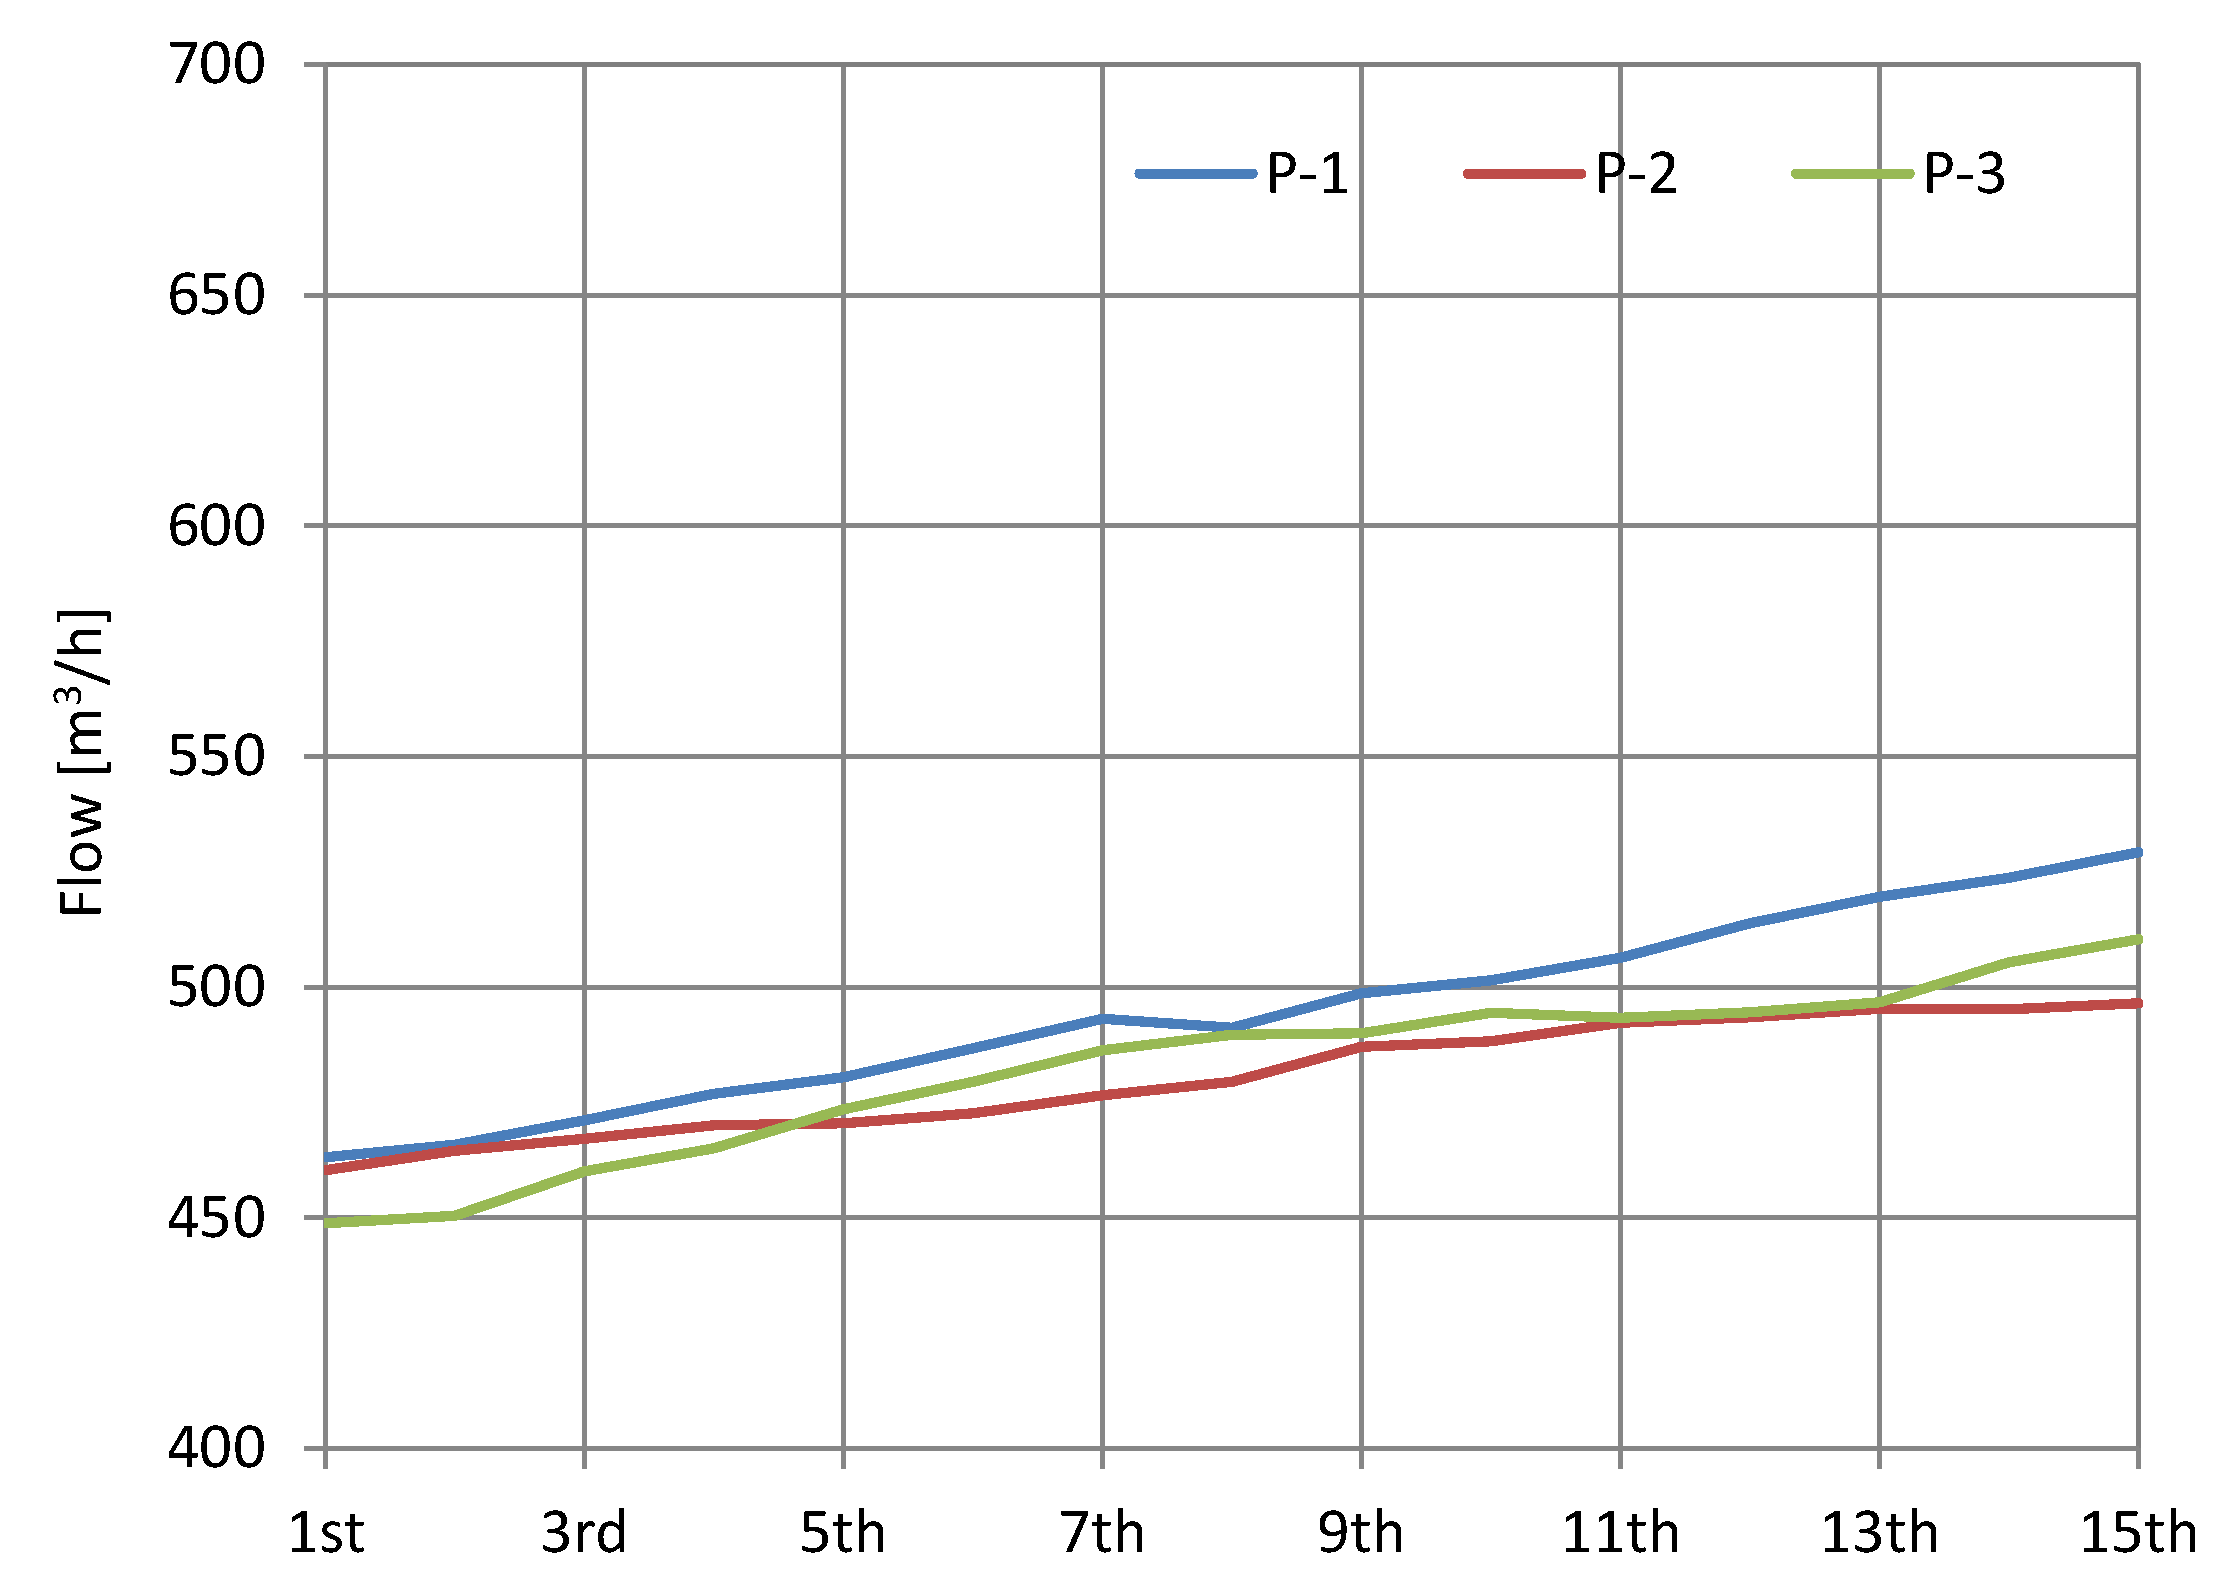
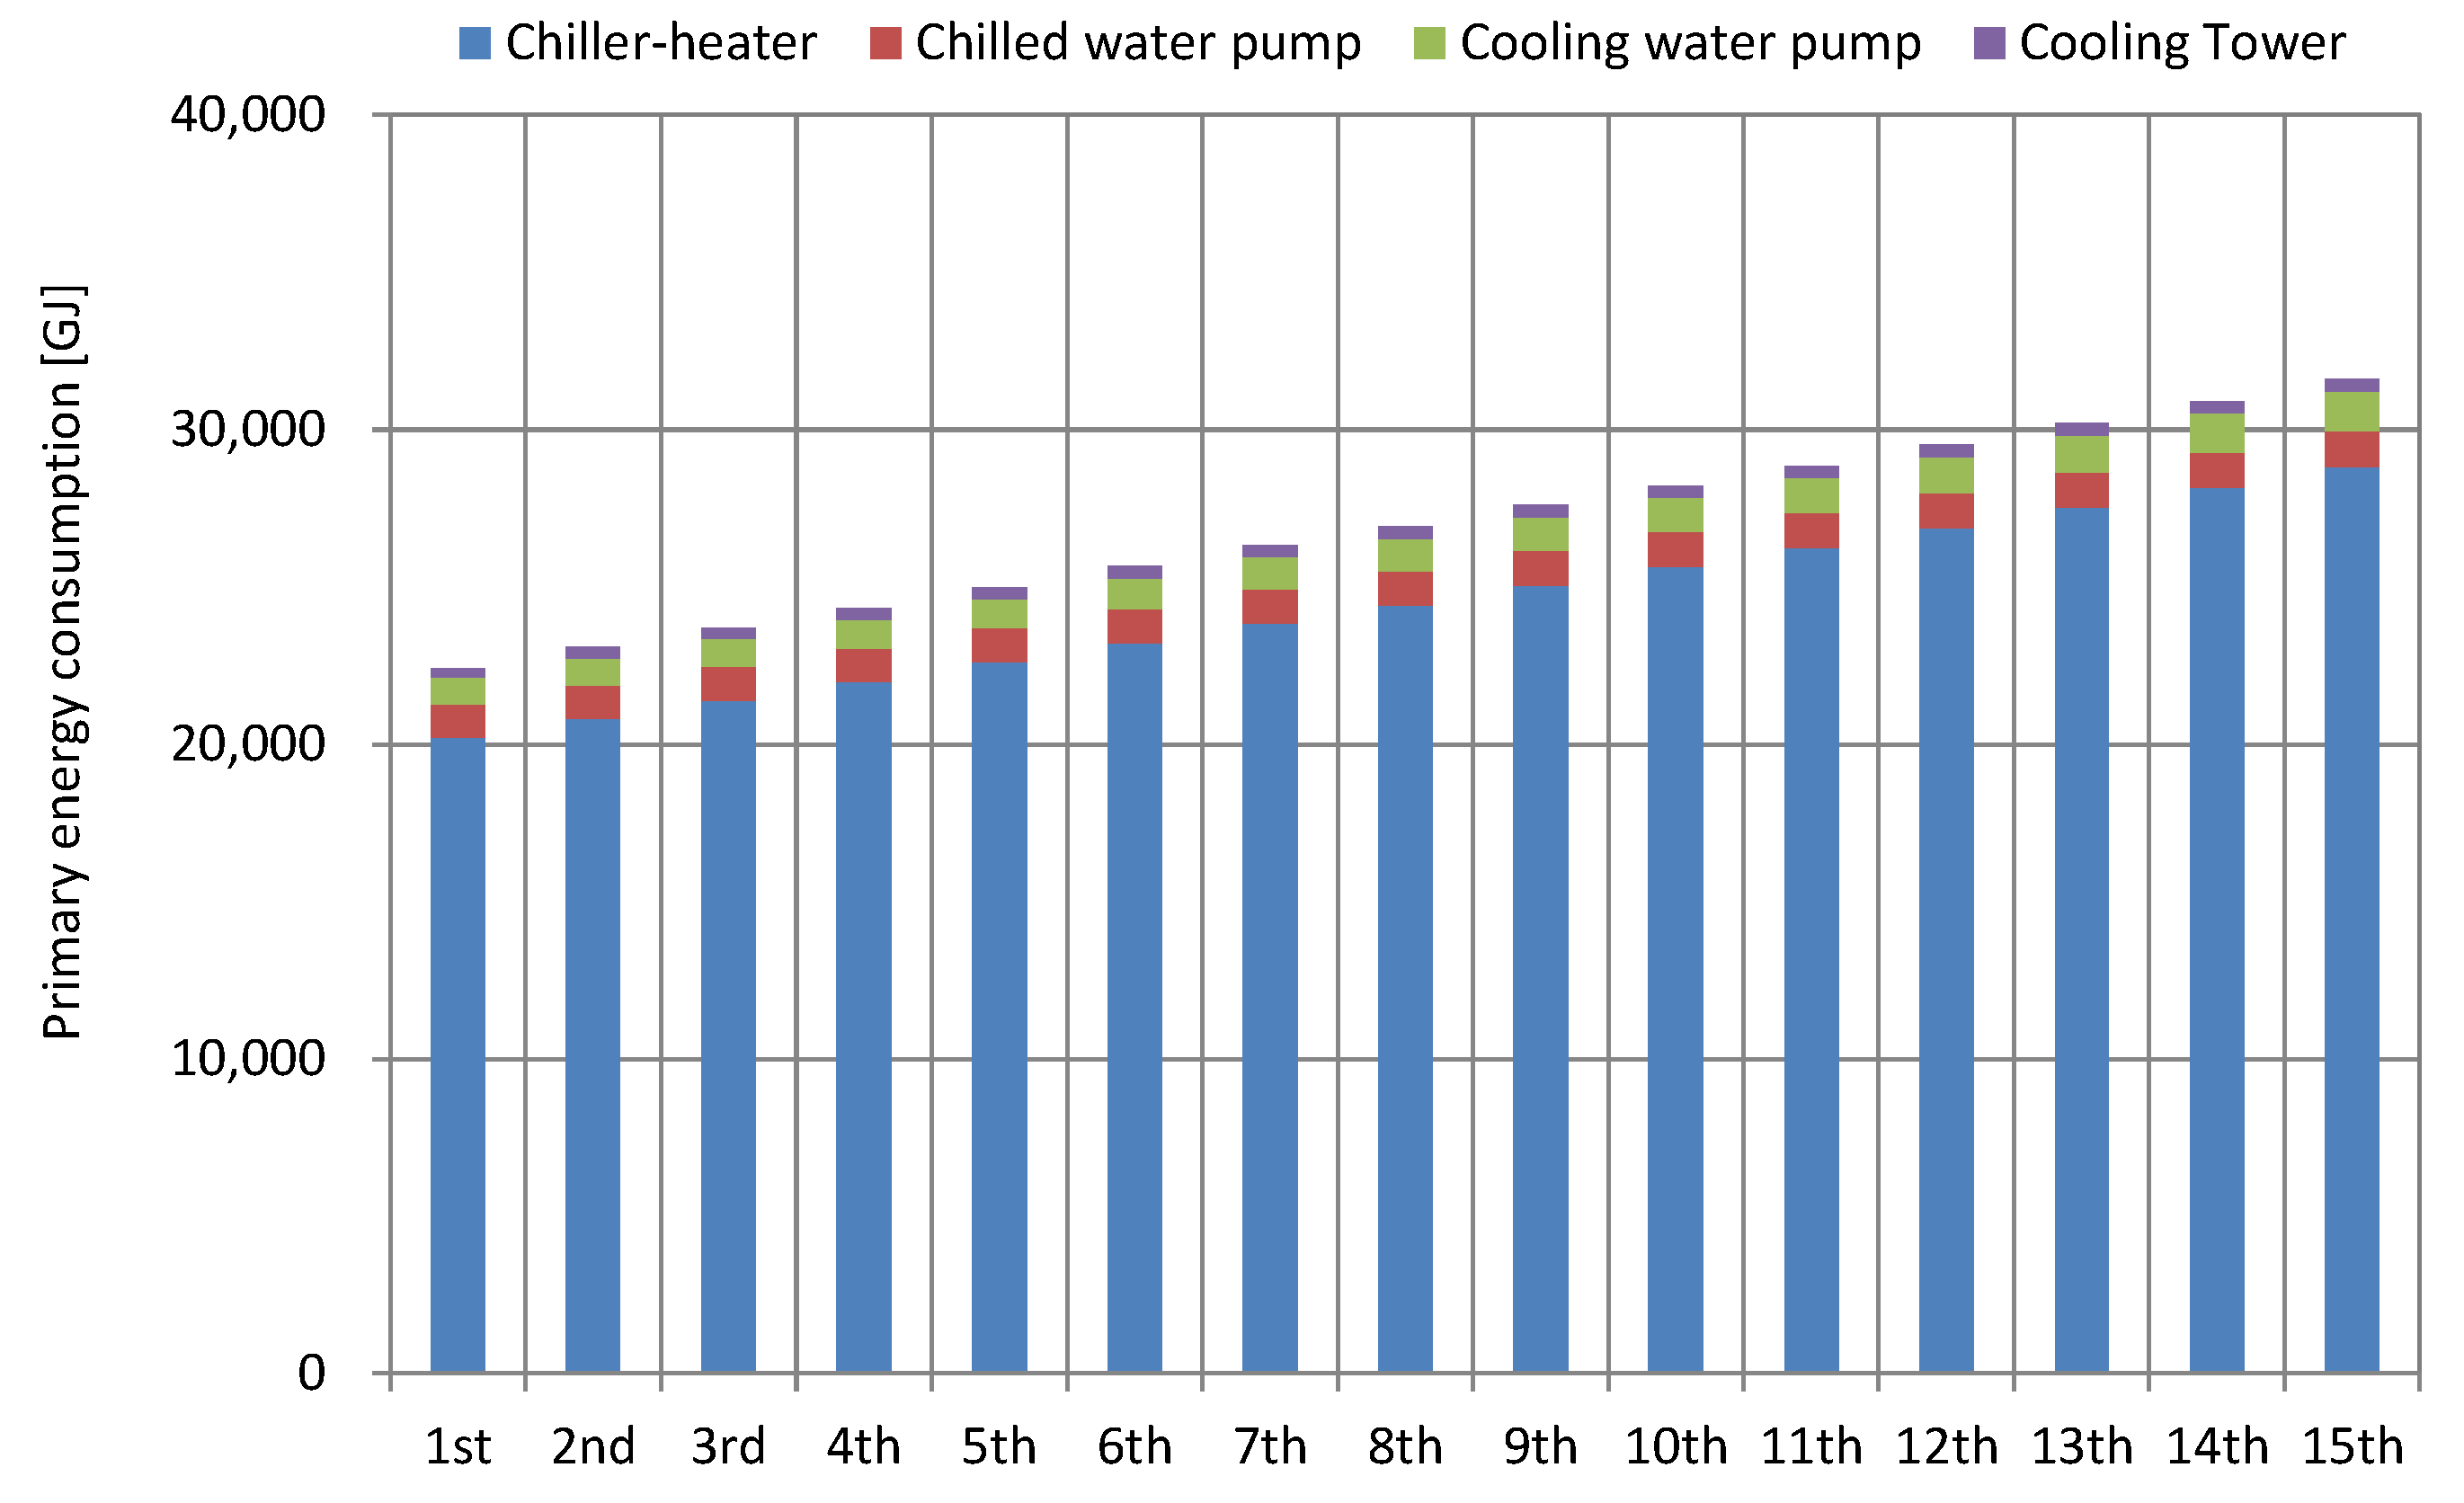
The simulation results are shown in Table 9 and Figure 9, Figure 10, Figure 11, Figure 12 and Figure 13. Table 9 shows the average performance degradation rate of each device by year of operation. After 15 years of operations, the performance of the heat source equipment decreased by 34–52% and that of the cooling tower and pump decreased by 7–19%. The heat source equipment was operated during both cooling and heating, so it was found to be higher than the performance degradation rate of cooling towers and pumps that were operated only for cooling. Figure 9 shows that the average annual Coefficient of Performance (COP) of three heat source equipment for the first year of operation was 0.87, whereas in the 15th year it was 0.61, which resulted in a 30% decrease in efficiency. Moreover, due to aging, the processing capacity of heat source equipment decreased, whereas the annual average number of operating units gradually increased (Figure 10). Furthermore, due to aging, the processing capacity of heat source equipment decreased, whereas the annual average number of operating units gradually increased (Figure 10). An increase in the number of operating heat source equipment led to an increase in the number of operating cooling tower fans and the pump flow rate, further accelerating the deterioration of the cooling tower and pump performance (Figure 11 and Figure 12). The annual primary energy consumption increased by 9194.7 GJ from 22,413.7 GJ in the first year to 31,608.4 GJ in the 15th year, which is an approximately 41% increase in energy consumption (Figure 13). Considering individual devices, the percentage increase for heat source equipment, cooling water pumps, and cooling towers were calculated as 42.6%, 51.7%, and 30.9%, respectively. The increase in energy consumption of cooling water pumps is mainly caused by the increase in the number of operating cooling water pumps, which is due to the increase in the number of operating heat source equipment. The increase in the cooling water pump flow rate is due to the increase in the amount of heat processed by the cooling tower due to the reduced heat source equipment performance.

5. Conclusions

In this study, we estimated the performance degradation rate of air-conditioning equipment, according to the accumulated operating time, using the operation data collected by the BEMS and the air-conditioning equipment performance prediction model. The effect of the performance degradation rate on the operation and energy consumption of the heat source system was examined using simulation. The contents and results of this study are as follows:
(1)
Based on the initial design data and physical formulas provided by the manufacturer for heat source equipment, open cooling towers, and inverter-type pumps installed in the university building, a device model was developed to predict the initial performance.
(2)
By using the developed device model and 4 years of operation data collected by the BEMS, the calibration coefficient representing the difference between the initial performance and the current performance is calculated at daily intervals and by analyzing the trend of change in the calibration coefficient. The performance degradation rate of each device was estimated. The performance degradation rate according to operating hours and annual operating hours was considered and the decrease in performance of the heat source equipment, cooling tower, and pump was in the ranges of 1.0–1.4%, 0.4–1.2%, and 0.8–1.3%, respectively.
(3)
A heat source system simulation was established by developing four device models and three control models for the heat source system of a university building and connecting them. The simulation prediction accuracy was MBE = −1.0% and CV_RMSE = 8.6%, which satisfies the acceptance criteria for simulation provided by the representative M&V guidelines.
(4)
After 15 years of operating the heat source system, the performance degradation rate of the previously diagnosed device was reflected in the heat source system simulation, and the variations in operation and energy consumption due to device performance degradation were analyzed. Over 15 years, without maintenance, the performance of heat source equipment decreased by 34–52%, and that of cooling towers and pumps decreased by 7–19%. In addition, the number of operating heat source equipment, the number of cooling tower fans, and the pump flow rate gradually increased every year due to the degradation of the devices, thus accelerating the performance degradation. As a result, energy consumption in the 15th year increased by approximately 41% compared with the initial energy consumption.

Author Contributions

Conceptualization and methodology, J.-H.L. and Y.-h.S.; software, J.-H.L.; validation, D.-G.K., S.-K.J. and Y.-h.S.; formal analysis, J.-H.L., Y.-h.S.; investigation, J.-H.L., Y.-h.S.; writing—original draft preparation, J.-H.L.; writing—review and editing, D.-G.K., S.-K.J. and Y.-h.S.; supervision, project administration and funding acquisition, J.-H.L., Y.-h.S.; All authors have read and agreed to the published version of the manuscript.

Funding

This research was funded by the Ministry of Health and Welfare, Republic of Korea. This research was supported by a grant for the project for Infectious Disease Medical Safety, funded by the Ministry of Health and Welfare, Republic of Korea (HG22C0044).

Acknowledgments

This research was supported by Pukyong National University Development Project Research Fund, 2022.

Conflicts of Interest

The authors declare no conflict of interest, the funders had no role in the design of the study; in the collection, analyses, or interpretation of data; in the writing of the manuscript, or in the decision to publish the results.

Nomenclature

BEMSbuilding energy management systemCsspecific heat of wet air [kJ/kg’s∙K]
NDCnationally determined contributionLQuantity [kg/s]
DX coildirect expansion coilγlspecific gravity of water [kg/m3]
ZEBzero energy buildingvlkinematic viscosity of water [m2/s]
Chheat source equipmentGcooling tower fan air volume [m3/s]
Egasgas consumption rate [%]Ppump
Xpartial load rate [%]Eppump power consumption [kW]
Ycooling water temperature [°C]Cpcalibration coefficient for pump [-]
a0, a1, a2,
a3, a4, a5
heat source equipment model parameters [-]Eratedpump rated power consumption [kW]
Cgascalibration coefficient for heat source equipment model [-]ηppump efficiency [%]
CTtarget open cooling towersFpcooling water flow [m3/h]
Qheat exchange in the cooling tower [kcal/h]Frpump rated flow [m3/h]
CCTcalibration coefficient for cooling tower model [-]MBEmean bias error [%]
Kaoverall mass transfer coefficient [kcal/m3h (kcal/kg)]CV_RMSEcoefficient of variation of the root mean square error [%]
Acooling tower filler cross-sectional area [m2]ASHRAEAmerican Society of Heating, Refrigerating and Air-Conditioning Engineers
Zcooling tower filler height [m]M&Vmeasurement and verification
LMEDlogarithmic mean enthalpy difference [kcal/kg]IPMVPinternational performance measurement and verification protocol
λgair thermal conductivity [kJ/ms∙K]FEMPfederal energy management program
deequivalent diameter of cooling tower filler [m]COPcoefficient of performance [-]

References

  1. The 2050 Carbon Neutrality and Green Growth Commission. Available online: https://2050cnc.go.kr (accessed on 29 November 2022).
  2. South Korea Ministry of Land, Infrastructure and Transport, Carbon Neutral Roadmap. Available online: https://unfccc.int/sites/default/files/resource/LTS1_RKorea.pdf (accessed on 29 November 2022).
  3. Griffith, B.; Long, N.; Torcellini, P.; Judkoff, R.; Crawley, D.; Ryan, J. Methodology for Modeling Building Energy Performance across the Commercial Sector; National Renewable Energy Laboratory: Golden, CO, USA, 2008. [Google Scholar]
  4. Waddicor, D.; Fuentes, E.; Sisó, L.; Salom, J.; Favre, B.; Jiménez, C.; Azar, M. Climate change and building aging impact on building energy performance and mitigation measures application: A case study in Turin, northern Italy. Build. Environ. 2016, 102, 13–25. [Google Scholar] [CrossRef]
  5. Bannai, M.; Yoshida, T.; Kimura, Y.; Fujii, T.; Sekiguchi, T.; Sawa, S. Energy Solution in the Industrial and Commercial Sectors. Hitachi Rev. 2008, 57, 220–225. [Google Scholar]
  6. Fenaughty, K.; Parker, D.; Center, F.S.E. Evaluation of Air Conditioning Performance Degradation: Opportunities from Diagnostic Methods. In Proceedings of the 2018 ACEEE Summer Study on Energy Efficiency in Buildings, Pacific Grove, CA, USA, 17 August 2018. [Google Scholar]
  7. De Wilde, P.; Tian, W.; Augenbroe, G. Longitudinal prediction of the operational energy use of buildings. Build. Environ. 2011, 46, 1670–1680. [Google Scholar] [CrossRef]
  8. Eleftheriadis, G.; Hamdy, M. The Impact of Insulation and HVAC Degradation on Overall Building Energy Performance: A Case Study. Buildings 2018, 8, 23. [Google Scholar] [CrossRef] [Green Version]
  9. KOREA Energy Agency. Available online: https://www.energy.or.kr/web/kem_home_new/ener_efficiency/building_09.asp (accessed on 29 November 2022).
  10. Korea Energy Agency. Building Energy Management System (BEMS) Installation Guidelines; Korea Energy Agency: Yongin-si, Republic of Korea, 2021. [Google Scholar]
  11. Building Services Commissioning Association WG, The Society of Heating, Air-Conditioning and Sanitary Engineers of Japan, HVACSIM+(J) User Manual. 1998. Available online: https://www.jstage.jst.go.jp/browse/shase/32/126/_contents/-char/en (accessed on 29 November 2022).
  12. Korea Energy Agency. Building Energy Efficiency Rating Certification System Operational Regulations; Korea Energy Agency: Yongin-si, Republic of Korea, 2015. [Google Scholar]
  13. ASHRAE. Guideline 14-2014. Measurement of Energy and Demand Savings; Technical Report; American Society of Heating, Ventilating, and Air Conditioning Engineers: Atlanta, GA, USA, 2014. [Google Scholar]
  14. IPMVP Committee. International Performance Measurement and Verification Protocol: Concepts and Options for Determining Energy and Water Savings; Technical Report; Efficiency Valuation Organization: Washington, DC, USA, 2012; Volume I. [Google Scholar]
  15. Webster, L.; Bradford, J.; Sartor, D.; Shonder, J.; Atkin, E.; Dunnivant, S.; Frank, D.; Franconi, E.; Jump, D.; Schiller, S.; et al. M&V Guidelines: Measurement and Verification for Performance-Based Contracts, Version 4.0; Technical Report; U.S. Department of Energy Federal Energy Management Program: Washington, DC, USA, 2018. [Google Scholar]
Figure 1. Performance curve of heat source equipment.
Energies 15 09217 g001
Figure 2. Calibration coefficient values according to cumulative operation time of heat source equipment: (a) Ch-1; (b) Ch-2; (c) Ch-3.
Energies 15 09217 g002aEnergies 15 09217 g002b
Figure 3. Calibration coefficient values according to cumulative operating time of cooling towers: (a) CT-1; (b) CT-2; (c) CT-3.
Energies 15 09217 g003aEnergies 15 09217 g003b
Figure 4. Calibration coefficient values according to the cumulative operation time of the pumps: (a) P-1; (b) P-2; (c) P-3.
Energies 15 09217 g004aEnergies 15 09217 g004b
Figure 5. Simulation flow chart.
Energies 15 09217 g005
Figure 6. Concept of performance degradation of heat source equipment.
Energies 15 09217 g006
Figure 7. Verification of simulation accuracy.
Energies 15 09217 g007
Figure 8. Annual heat source load.
Energies 15 09217 g008
Figure 9. Annual average COP change for heat source equipment.
Energies 15 09217 g009
Figure 10. Changes in the annual average number of heat source equipment.
Energies 15 09217 g010
Figure 11. Changes in the annual average number of cooling tower fans.
Energies 15 09217 g011
Figure 12. Average annual change in flow rate for cooling water pumps.
Energies 15 09217 g012
Figure 13. Annual energy consumption.
Energies 15 09217 g013
Table 1. Performance degradation of HVAC equipment.
With MaintenanceWithout Maintenance
DC coil0.25% per year1% per year
Central chiller0.25% per year1% per year
Boiler0.2% per year0.5% per year
Heat pump heating0.25% per year1% per year
Constant volume fan0.2% per year0.5% per year
Variable volume fan0.2% per year0.5% per year
Gas heating coil0.1% per year0.2% per year
Table 2. Specifications for gas absorption chiller-heater.
Target EquipmentCh-1, Ch-2, Ch-3
SpecificationCooling capacity 2408 kW, Outlet chilled water temperature 7.0 °C, Inlet cooling water temperature 32 °C, Rated chilled water flow 348 m3/h, Rated cooling water flow 700.2 m3/h, Rated gas consumption 187 Nm3/h
Table 3. Model parameters.
a0a1a2a3a4a5
Value3.514470.135170.003130.037420.005160.01425
Table 4. Open cooling tower specifications.
Target EquipmentCT-1, CT-2, CT-3
SpecificationCapacity 4396.6 kW, cooling water flow 700 m3/h, Fan 5 EA, Fan air flow 72,000 (m3/h)/EA
Table 5. Inverter-type pump specifications.
Target EquipmentP-1, P-2, P-3
SpecificationRated flow 702 m3/h, Rated Brake horsepower 110 kW, Rated head 37 m, Rated rpm 1800 rpm
Table 6. Performance degradation rate of gas absorption chiller-heater.
Ch-1Ch-2Ch-3
Degradation rate per hour [%/h]2.015 × 10−31.420 × 10−32.058 × 10⁻³
Table 7. Performance degradation rate of cooling towers.
CT-1CT-2CT-3
Degradation rate per hour [%/h]−1.709 × 10−3−6.201 × 10⁻⁴−7.087 × 10⁻⁴
Table 8. Performance degradation rate of pumps.
P-1P-2P-3
Degradation rate per hour [%/h]1.828 × 10−31.135 × 10−31.860 × 10⁻³
Table 9. Performance degradation rate of each device (Unit: [-]).
Ch-1Ch-2Ch-3CT-1CT-2CT-3P-1P-2P-3
1st year0.970.970.980.991.001.000.990.990.99
2nd year0.930.940.960.980.990.990.980.980.99
3rd year0.900.910.930.960.990.990.960.970.98
4th year0.870.880.910.950.980.980.950.950.97
5th year0.830.850.890.940.980.980.940.940.97
6th year0.800.810.870.930.970.970.920.930.96
7th year0.760.780.850.920.970.970.910.920.95
8th year0.730.750.820.910.960.970.900.910.95
9th year0.690.720.800.890.960.960.890.900.94
10th year0.660.690.780.880.950.960.870.880.93
11th year0.620.650.750.870.950.950.860.870.92
12th year0.590.620.730.860.940.950.850.860.92
13th year0.550.590.710.850.940.940.840.850.91
14th year0.510.550.680.830.930.940.820.840.90
15th year0.480.520.660.820.930.930.810.830.90
Publisher’s Note: MDPI stays neutral with regard to jurisdictional claims in published maps and institutional affiliations.