1. Introduction
In order to cope with climate change and environmental pollution, the achievement of existing energy decarbonization and renewable energy development is a broad consensus worldwide. In 2015, the Paris Agreement signed by all countries in the world put forward an energy system aiming to achieve net-zero emissions by 2050 [
1]. The Paris Agreement addressing climate change represents the general direction of the global green low-carbon transition and the minimum action needed to protect the Earth. In such a case, in September 2020, Chinese President Xi Jinping, on behalf of the Chinese government, solemnly announced at the 75th UN General Assembly that China will strive to reach the CO
2 emissions peak value by 2030 and work towards realizing carbon neutrality by 2060 [
2]. Then, in October 2021, the Chinese government submitted its National Autonomous Contribution Report to the Secretariat of the United Nations Framework Convention on Climate Change, which included the “Double Carbon” targets [
3]. The “Double Carbon” target has become the biggest external constraint affecting China’s energy consumption structure, and the large-scale application of clean energy represented by wind energy, solar energy or natural gas is the key to achieving the “Double Carbon” strategic goal [
4].
As representatives of renewable energy, solar energy and wind energy have broad application prospects and huge development potential [
5]. By 2021, the proportion of renewable energy in global electricity generation will have reached 37%, 8300 TWh, an 8% increase compared to 2020, the fastest year-on-year growth since the 1970s, in which solar energy and wind energy have contributed two-thirds of the growth [
6]. However, due to the typical intermittent and uncertain nature of power generation with renewable energy, such as wind power generation and photovoltaic power generation, the sudden large-scale access to the power grid will have an impact on its safe operation and cause a series of problems, thus resulting in a large number of “abandoned power” phenomena [
7]. According to statistics, in 2021, the abandoned power generation by renewable energy in China will be about 20 billion kWh, which is equivalent to 20% of the generation capacity of the Three Gorges hydropower plant (i.e., the largest hydropower plant in the world) in the same year [
8]. In order to improve the efficiency of renewable energy utilization, it is necessary to establish the relevant energy storage facilities to provide the basic conditions for large-scale wind power, photovoltaic power and other new energy generation to be connected to the grid [
9]. At present, there are various modes of electric energy storage technologies, and the most representative ones include compressed air energy storage (CAES), pump storage, or battery energy storage [
10,
11]. Among such technologies, CAES refers to the use of surplus electricity generated by clean energy to compress air into a closed container, and then use the compressed air to drive a steam turbine to generate electricity to balance the grid supply when the electricity consumption is at its peak [
12]. Due to the low energy density of the air, the realization of CAES technology is critical to the requirements of the container for storing the compressed gas, which directly determines the location and construction of the power plant. The proper location shall generally meet the following three requirements [
13]: (1) the capacity shall be as large as possible, which generally requires more than 100,000 m³ of space; (2) it shall ensure good tightness, because there can be no leakage after storing high-pressure gas; (3) it shall have good stability to ensure the long-term safe operation of the storage. Accordingly, making use of the deep underground space, especially the underground salt caverns for storing the energy on a large scale, is one of the effective ways to ensure the stable supply of clean energy internationally. This is because the salt rock has good creep and damage self-recovery properties [
14,
15], which can meet the frequent injection and extraction needs of the CAES system, while the extremely low permeability of salt rock makes the cavities have a good tightness [
16]. Finally, the underground salt caverns can be constructed by water solution mining, which reduces the construction costs.
The application of salt caverns in the CAES system of the commercial fields has not yet been promoted on a large scale. Currently, only two CAES systems are in operation for commercial purposes worldwide. The first one is the Huntorf power plant in Germany, built in 1978 [
17], which has a design peak load capacity of 290 MW for 2 h or 60 MW for 8 h with an energy conversion efficiency of 42% [
18]. The second power plant, McIntosh, Alabama, USA, was officially put into operation in 1991 with a design peak load capacity of 110 MW for 26 h and a slightly better efficiency of 54% [
18,
19]. The successful experience obtained from these two power stations demonstrates the feasibility of using a salt cavern in the system. In recent years, with the advancements in engineering technology, the CAES’s efficiency is expected to increase to 70%, which will stimulate relevant studies to be carried out around the world. The application of a salt cavern in the field of CAES has come later compared to oil and gas territory in China. In 2007, the first attempt of salt cavern CAES was carried out in Jintan with the capacity of 60 MW/300 MW h in the first stage [
20]. Now, the CAES site selection project has also been carried out in Feicheng, Shandong Province, and Yunying, Hubei Province.
Natural gas, as a clean energy source recognized worldwide, has the advantages of generating less carbon dioxide during combustion and producing almost no dust and sulfur dioxide, which has been rapidly developed in China’s energy consumption in the last decade. According to the latest data [
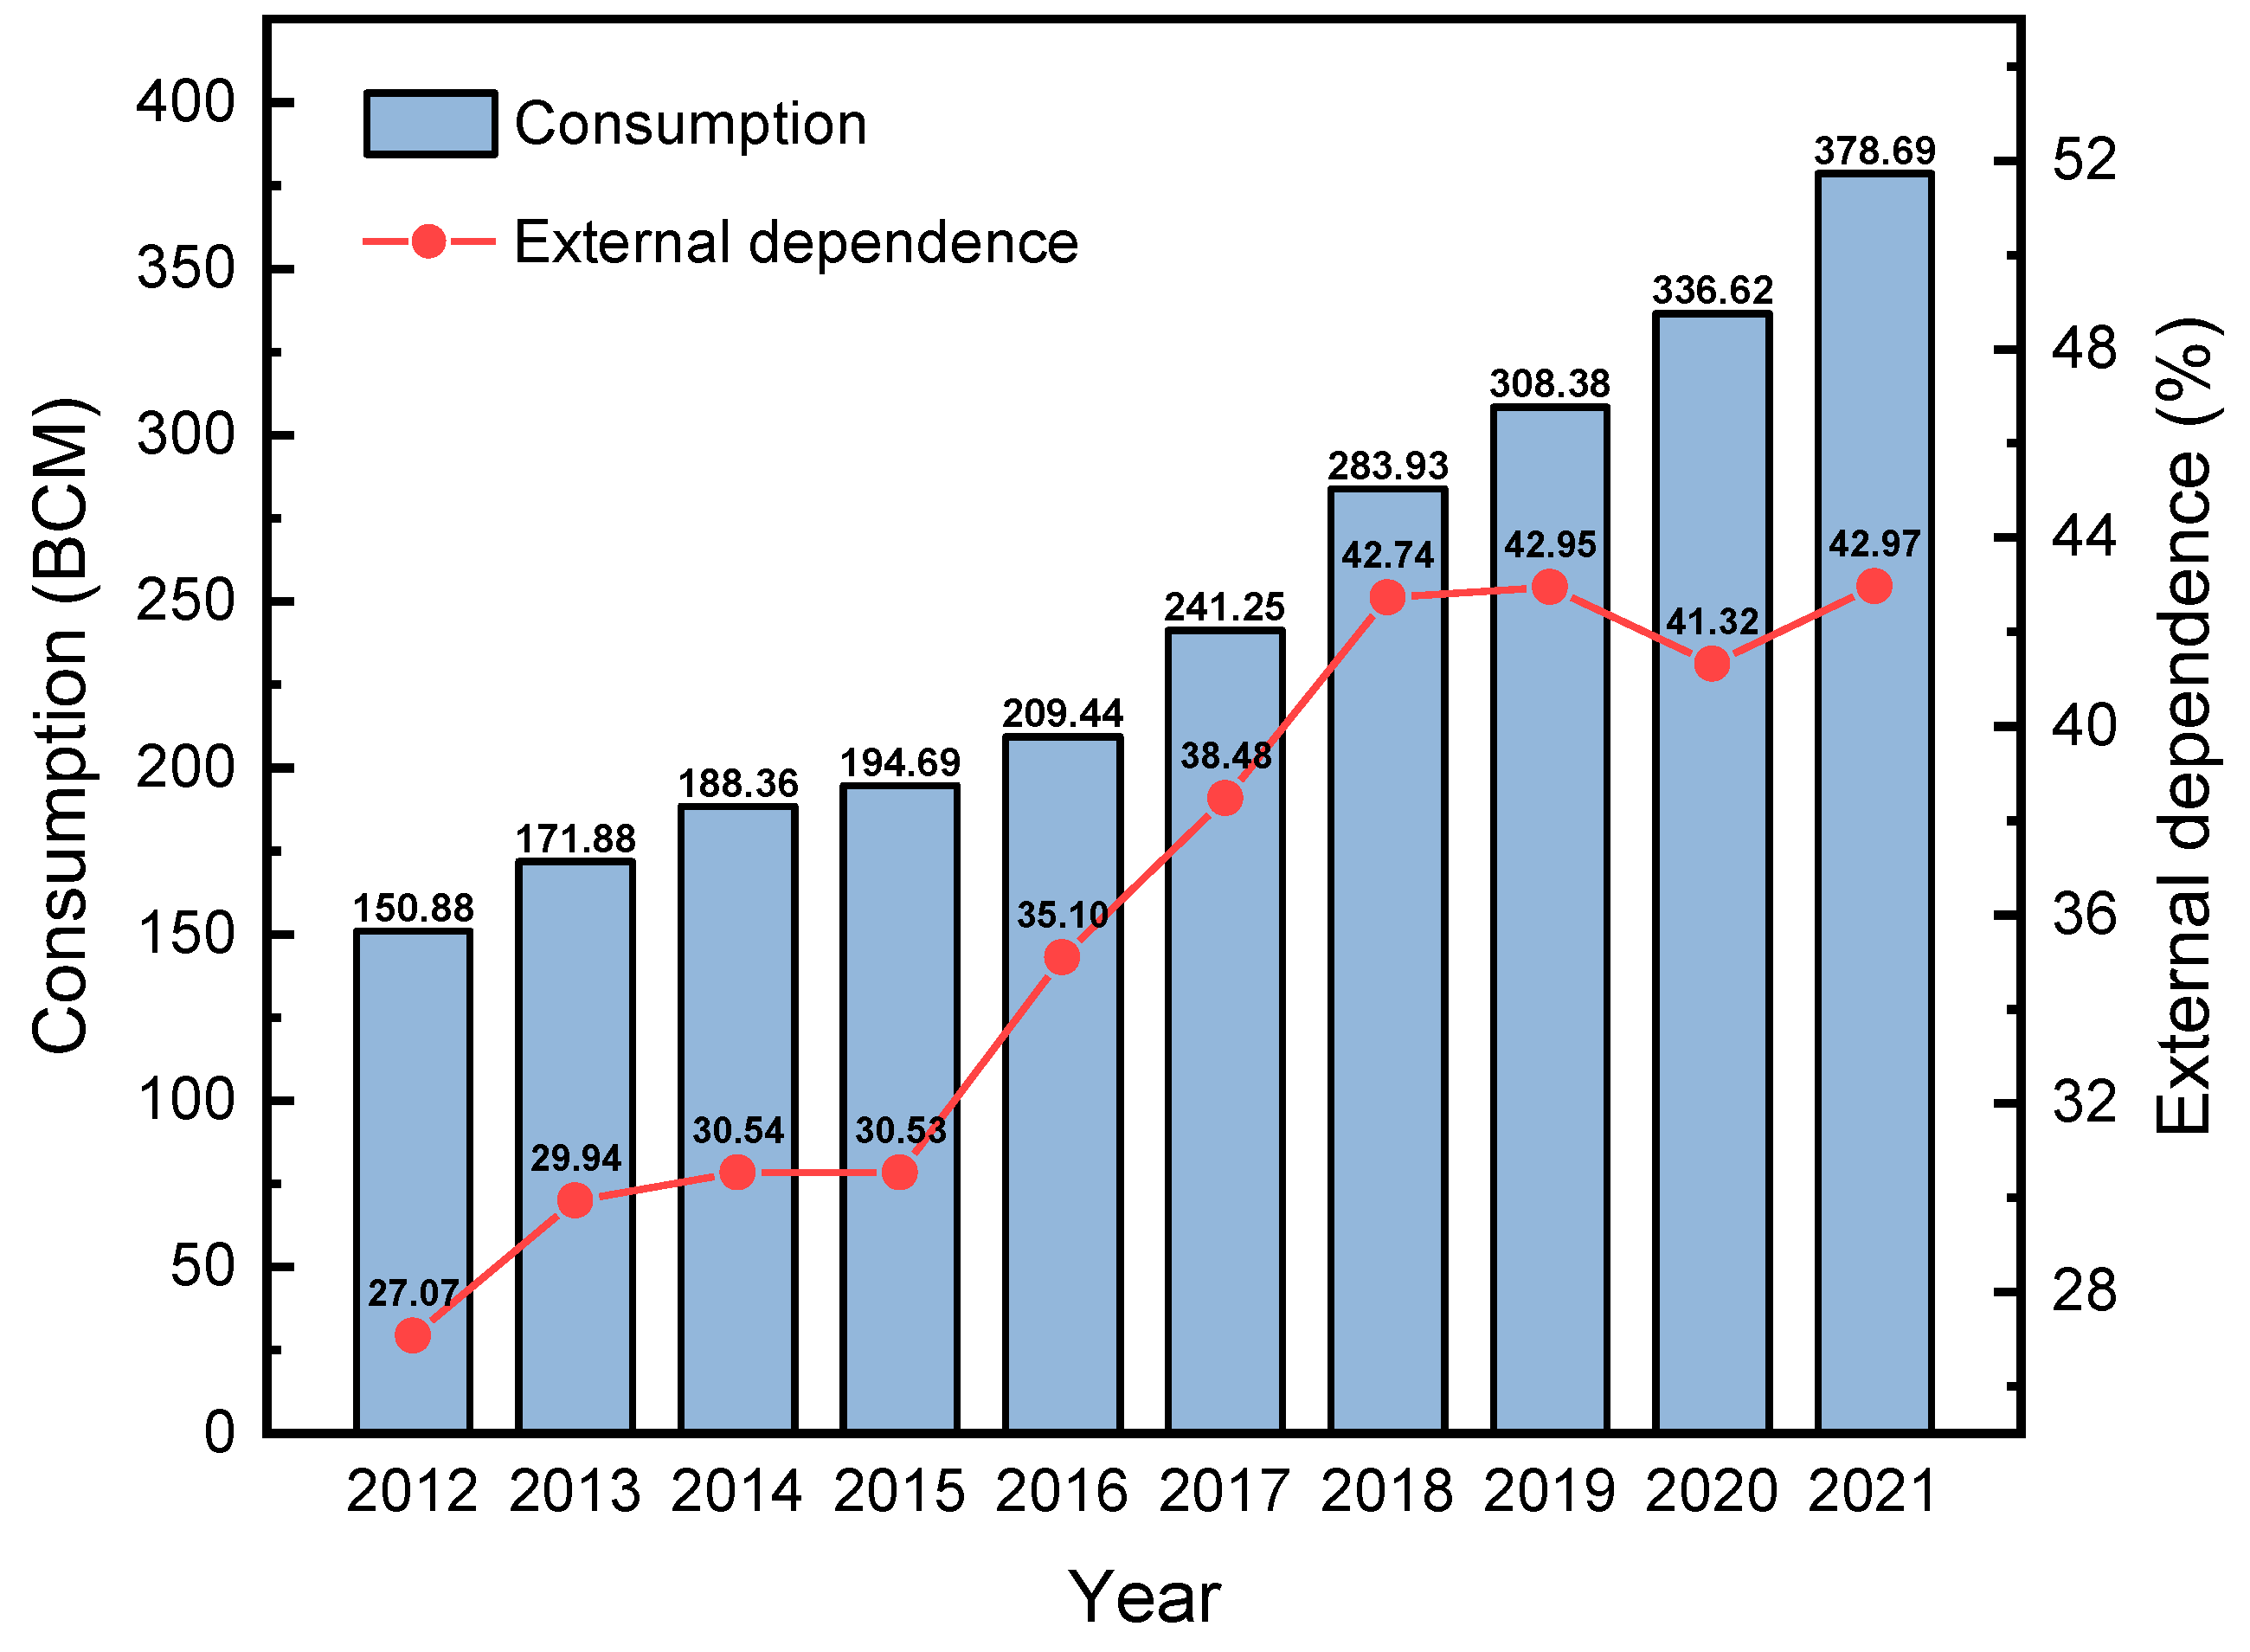
21], China’s natural gas consumption has maintained a high growth rate in the last decade (
Figure 1), increasing from 135.2 billion cubic meters in 2011 to 378.7 billion cubic meters in 2021, with an average annual growth rate of 10.9%, which is significantly higher than the growth rate of other countries in the world. In 2021, China became the third largest consumer of natural gas in the world, closely followed by the United States and Russia, with annual natural gas consumption already accounting for 9.4% of the world’s total consumption. However, excessive reliance on external imports has also shown the hidden dangers of sustainable social development. In 2021 (
Figure 1), China’s natural gas imports reached 162.72 bcm, with an external dependence of 42.9%. China urgently needs to establish corresponding natural gas reserves to meet the needs of national security, urban emergency reserves, and daily peak value adjustment. Underground gas storage has been applied as a strategic energy reserve by most of the countries in the world because of its advantages such as large storage capacity, high economic efficiency, good safety, and good concealment capability [
22], which can effectively deal with the risks caused by energy price fluctuations and changes in the external environment [
23]. At present, the main types of underground gas storage in the international arena are salt cavern gas storage, depleted oil and gas reservoir storage or gas storage in aquifers [
24]. Among them, salt cavern gas storage has unique advantages. This is mainly due to the following reasons [
25]: (1) salt rock has good properties, such as creep, low permeability, and damage self-healing ability, which means the cavern is capable of adapting to adverse factors in the external environment; (2) salt rock gas storage has high injection and extraction efficiency: it can adopt high speed and high frequency of gas injection and extraction mode during the operation, which can maximize the use of limited storage space; (3) salt cavern gas storage has a low amount of bedding gas and a high working gas volume.
Salt caverns have been used in the field of oil and gas storage for a long time. Canada took a pioneering role in the use of salt caverns for hydrocarbon storage in the early 1940s [
26,
27]. Subsequently, in 1961, another salt cavern for gas storage was built in the United States using the Morton No. 16 salt cavity in order to store natural gas in Marysville and Michigan [
28]. As of the end of 2019, there are 99 salt cavern gas storages that have been put into operation around the world. Although the volume of salt caverns accounts for only 8.5% of the global storage capacity, they can provide up to 25% of the global daily gas extraction production due to the higher efficiency [
29]. The construction of salt cavern gas storage in China started in 2000; in the following 20 years, it has been developed only in Jintan, Jiangsu Province and has formed a certain gas storage and working gas volume. There are three gas storages in this area, including Jintan (Hong Kong and China Gas) First phase, Jintan China National Petroleum Corporation (First phase) and Jintan Sinopec (First phase). Up to now, a total storage capacity of 1.25 billion m³ and a total working gas volume of 730 million m³ have been formed [
30].
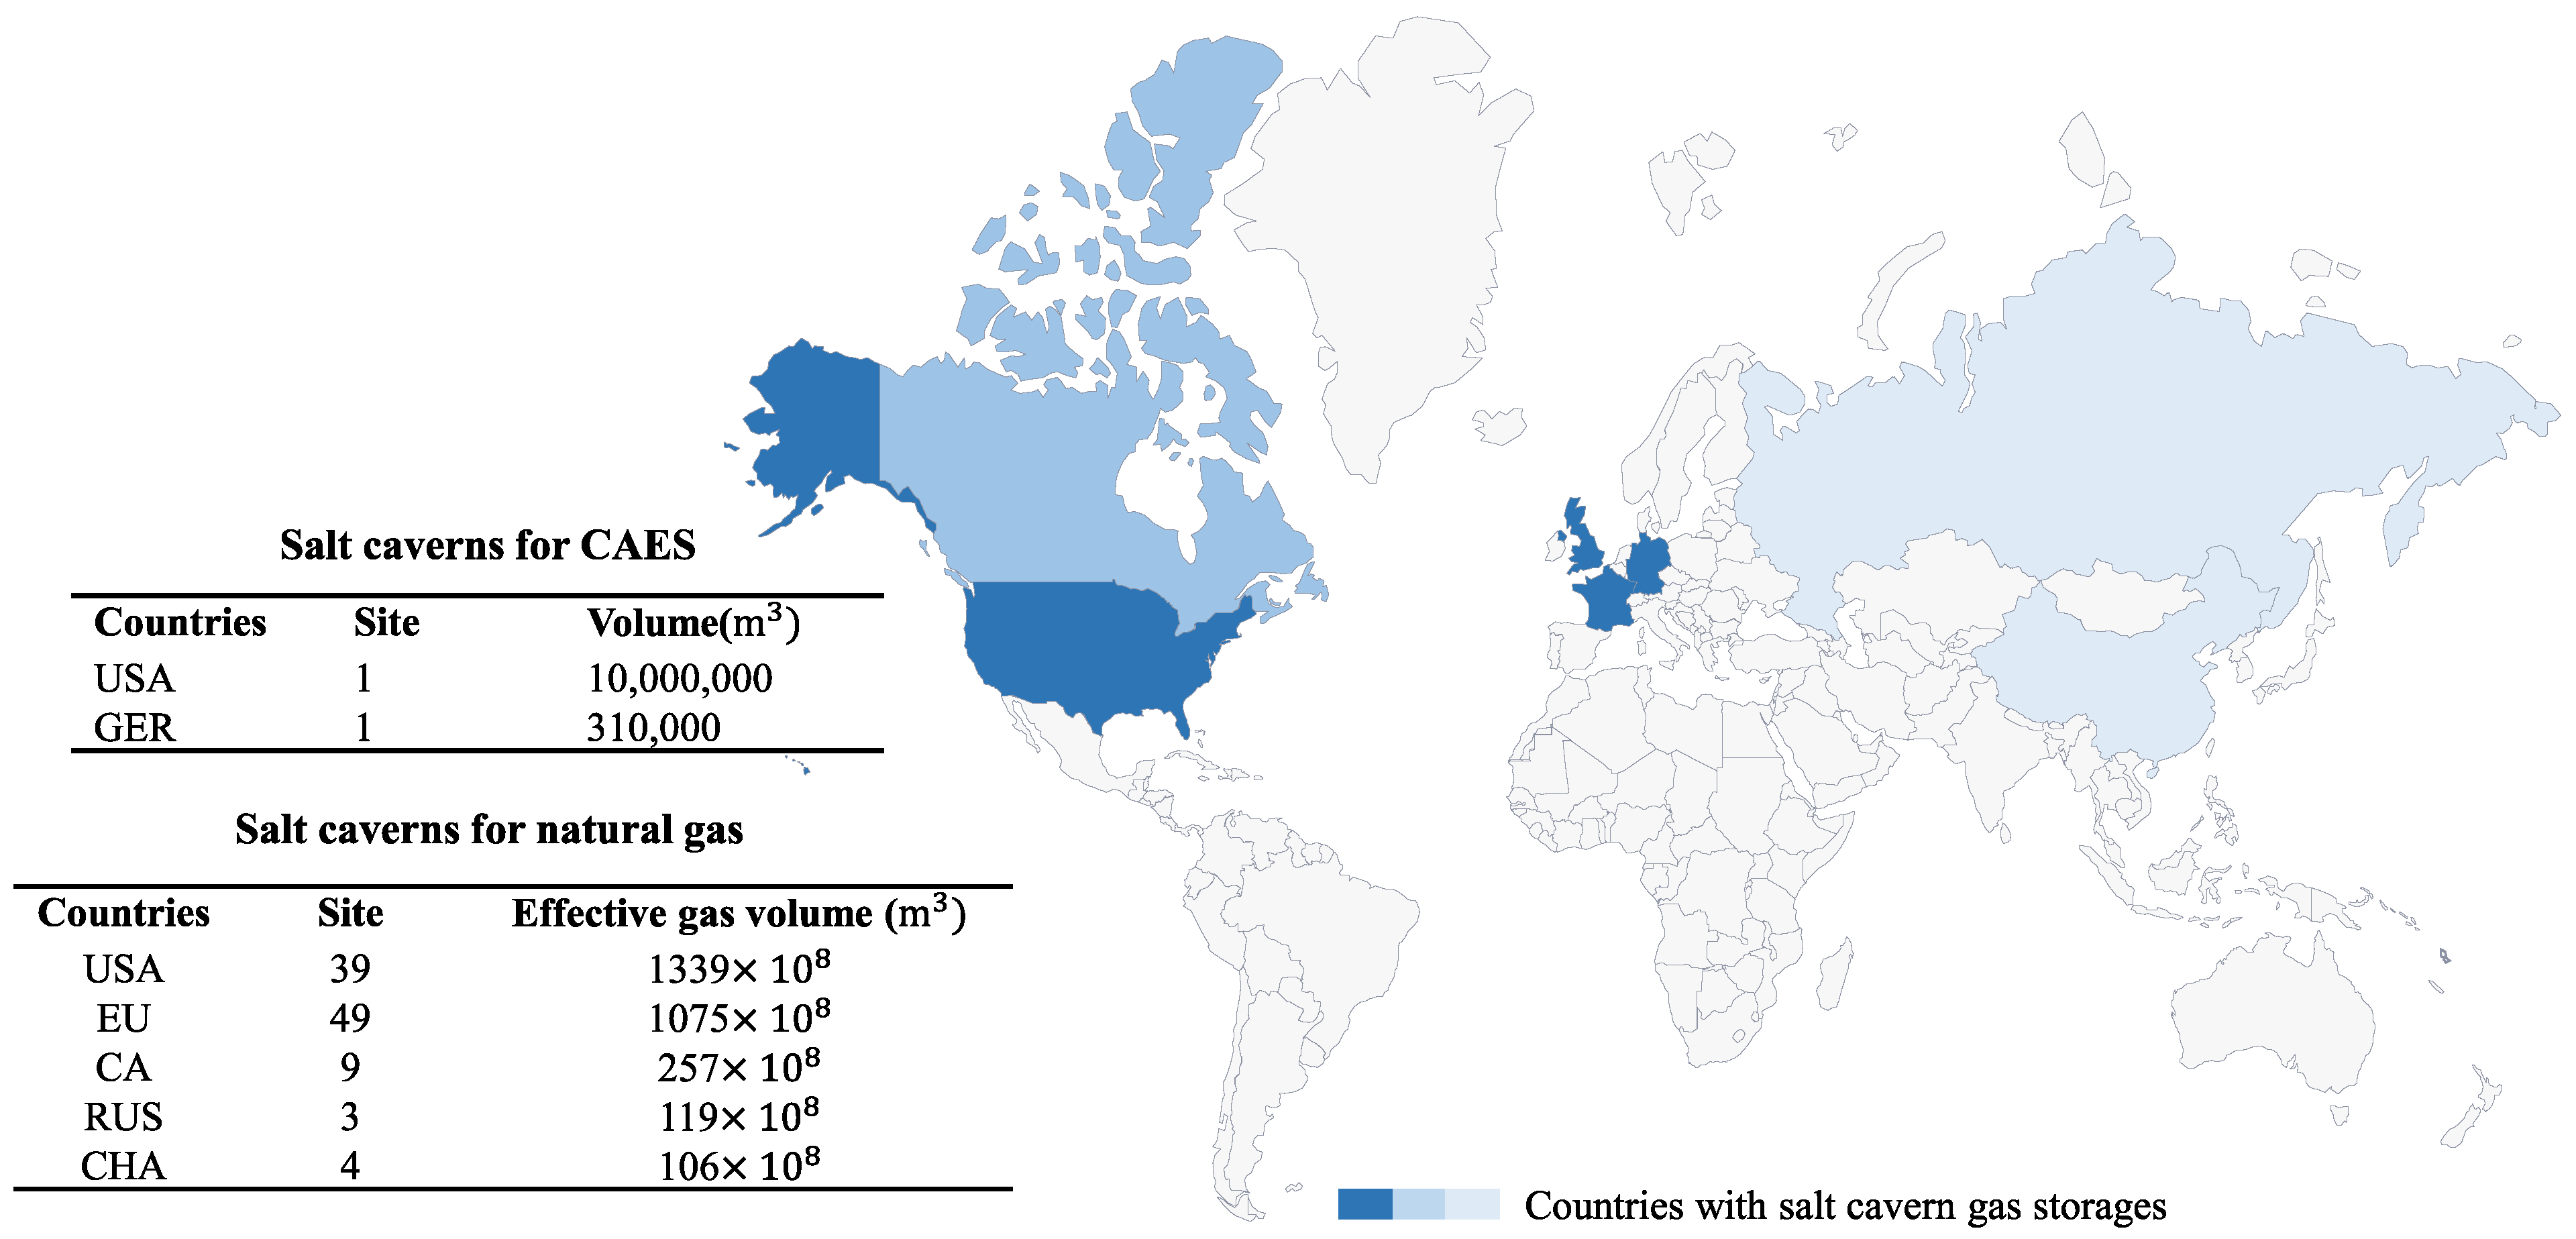
Figure 2 displays the current utilization of salt caverns space worldwide. It can be seen that making use of underground salt cavern space to form a certain scale of energy reserves is an extremely time-consuming project. Up until now, China has formed only less than 1 billion working gas volume after more than two decades of development in the field of salt cavern gas storage and has not yet seen any successful energy storage cases of CAES by salt cavern, which has a certain gap compared with other countries. The reasons for this are mainly divided into the following points: (1) the energy storage built based on salt formations abroad is generally located in a giant thick-layered salt dome with better geological conditions, and some of them are near the seashore and have unique brine discharge channels, which can greatly speed up the construction of storage; (2) although China is rich in salt resources, the most salt strata belong to lacustrine deposit formation, which has the characteristics of many interlayers. When building energy storage, the influence of interlayers and interfaces shall be considered, resulting in little suitable strata [
31]. (3) At present, the existing energy storage in China is all used single caverns formed by a single vertical well; there is no precedent for the successful application of ESC formed by a horizontal convection well. (4) The investment benefit recovery channel of salt cavern storage and the market mechanism have not yet been established. In the case of aiming to form a certain scale of energy storage as soon as possible, it is necessary to innovate the idea of storage construction to accelerate the construction cycle and reduce investment.
China is a large producer of well salt and there are many salt chemical enterprises in China. After solution mining brine for long-term salt formation, a large amount of salt cavern space was formed. When the salt resources were exhausted, these caves were filled with brine that had been abandoned for a long time underground. We will call such cases “Existing Salt Caverns” (ESC). According to the survey, there are more than 500 ESCs in Huai’an of Jiangsu province, Pingdingshan of Henan province and Yunying of Hubei province. If some of the ESC are screened out through technical means and converted into energy storage, then the CAES system or salt cavern gas storage is built directly based on them, which would greatly narrow the construction cycle; a huge energy storage scale will be formed in a short period of time with considerable economic benefits [
33]. Based on the comprehensive analysis of the above, this paper focuses on the key scientific issues in the technical bottlenecks of ESC conversion energy storage and highlights the current primary selection principles for screening available ESC and the evaluation and testing methods of ESC tightness. Finally, a case study is carried out in combination with the above theory, which provides a technical roadmap for the subsequent implementation of ESC utilization projects on a large scale.
2. Selection Principle of Reconstruction ESC into Energy Storage
In general, for an underground salt cavern to be able to serve as an energy storage space, either for compressed air or natural gas, its tightness must be ensured, which requires the parameters of the salt cavern, such as the width of the pillars, the thickness of the roof, and the shape of cavern, to all meet the design requirements [
34]. However, ESCs formed by salt mining are to some extent only a by-product. The coarse ore management in the production process of salt chemical enterprises can lead to a very complex underground cavern situation. So, certain primary selection principles must be established to screen out the most potential ESC form numerous alternatives before construction.
At present, domestic and international studies on underground energy storage caverns in salt rocks mainly focus on the construction technology, cavern stability, and mechanical properties of salt rocks. As for research on the site selection of energy storage of salt caverns [
35,
36], although some studies in the literature have mentioned this, there are still fewer studies on how to screen suitable ESC. The selection of suitable caverns for reconstruction is the first hurdle in the construction of the whole project and should be given sufficient attention. This section analyzes and categorizes the factors affecting the late utilization of existing salt caverns based on the basic situation of lacustrine sedimentary salt formation in China.
2.1. Geological Conditions
- A.
Regional tectonic features and faults
The tectonic features of the area where the cavern is located have an important impact on the construction and safe operation of the subsequent energy storage reservoir. If the geological activity of the salt cavern is relatively weak, the tectonics are gentle. The fault development is weak and there are few earthquakes in the history. The whole area will be relatively smooth, and the cavern set in it will also be relatively safe, which will be conducive to its stability and tightness.
Conversely, if the salt cavern is located in a region with intense tectonic movement, fault development and earthquakes in the more recent geologic history, then the entire region is relatively complex in terms of deposition. It may not only lead to the irregular shape of the underground cavern, but also adversely affect the stability and tightness of the cavern. In general, if active faults exist near the ESC, it should be discarded.
- B.
The nature of the roof and floor of the ESC
Properties of the roof and floor of the ESC mainly include the lithology and thickness of the caprock. If the caprock is hard, compact and less fissured, it can have good tightness even if the thickness is small; if its lithology is weak, the weathering degree is high and joints fissures are developed. It needs to have a larger thickness, so that it can effectively reduce the adverse effects brought by lithology, and reduce the possibility of fissures and pores penetration so it can effectively stop the leakage and diffusion of gas inside the cavern through the cover.
2.2. Cavern Conditions
- A.
Cavern volume
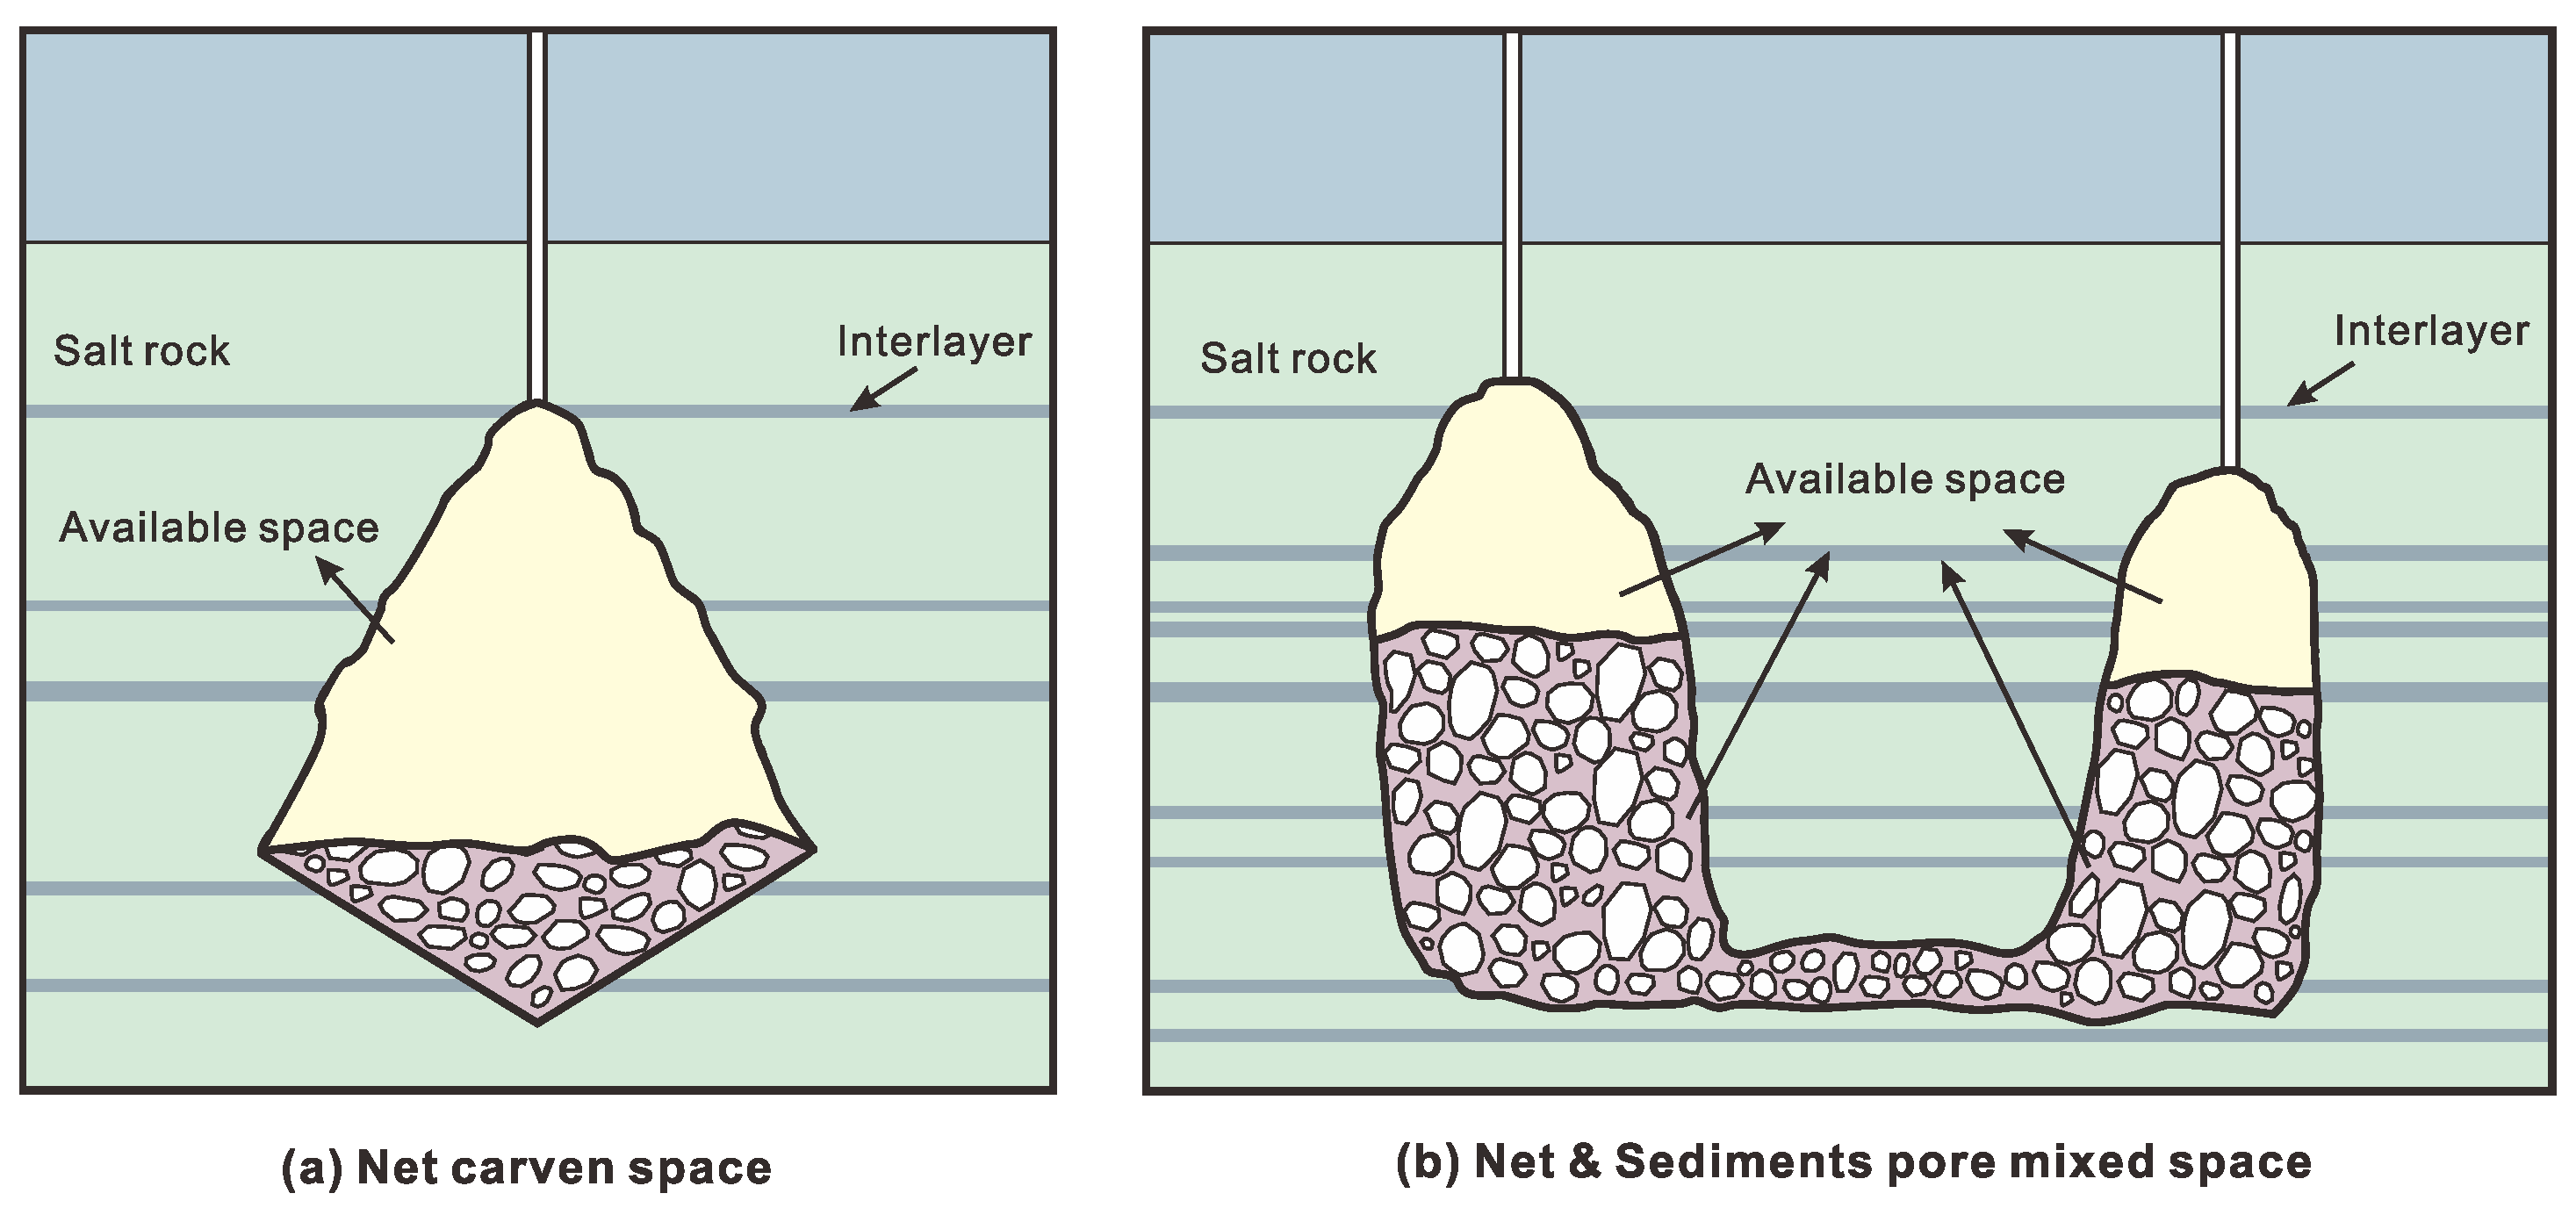
The salt cavern space can be divided into two parts underground: the upper part is a cavern filled by pure brine, and the lower part is a mixture of sediment and brine. Depending on the insoluble content of the mining layer where it is located and the injection-production technology, the current utilization mode of the cavern can be divided into the following two types (
Figure 3), respectively: (1) salt cavern net space utilization mode: this case is for the single cavern formed by single well mining; it can generally directly use the upper net space formed after mining and the volume of the cavity can be directly detected by sonar equipment. (2) Net-sediment pore mixed utilization mode: this is the case when there are interlayers in the formation and some part of the space will be filled after the collapse of the interlayer. The available space includes the net space of the upper net salt cavern and the space in the lower sediment pore; almost all the available existing salt caverns in China are like this. However, for caverns formed by the convective well group, sonar does not detect the full effective volume and only shows the net space above the sediment interface, which needs to be estimated in conjunction with salt extraction data. For example, for every 1 ton of salt extracted from the ground, 0.462 m³ of net space will be formed underground (the density of salt is taken as 2.165 kg/m³). After comprehensive judgment by the above methods, we try to choose the ESC with available space above 100,000 m³ to ensure the scale of energy storage and economic benefits.
- B.
Interconnection mode
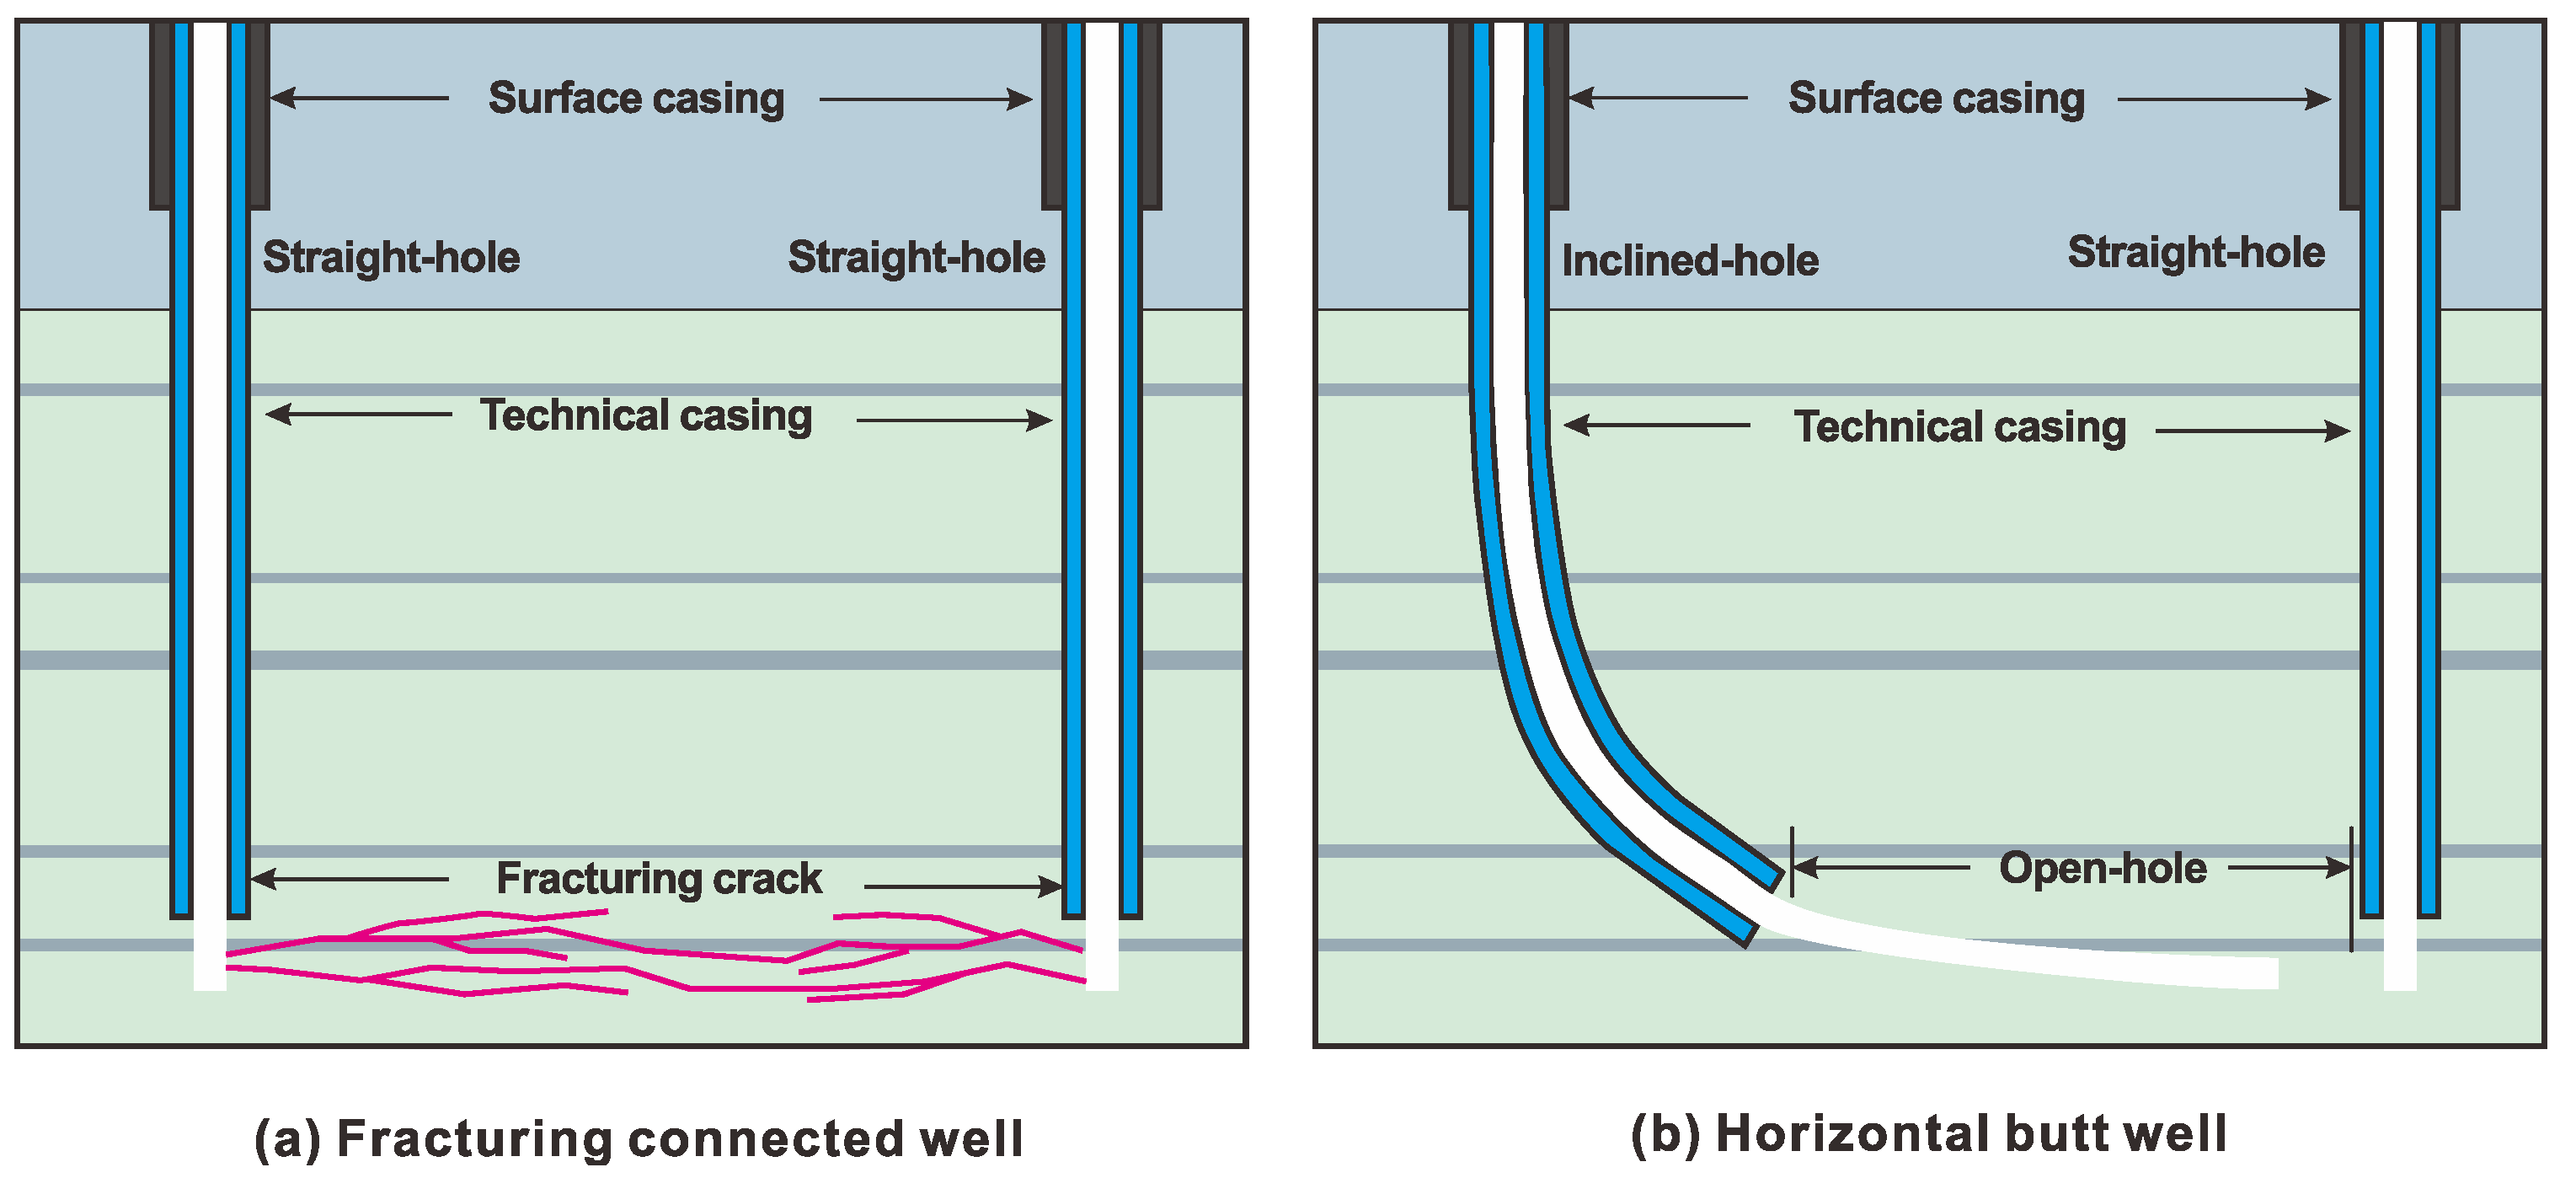
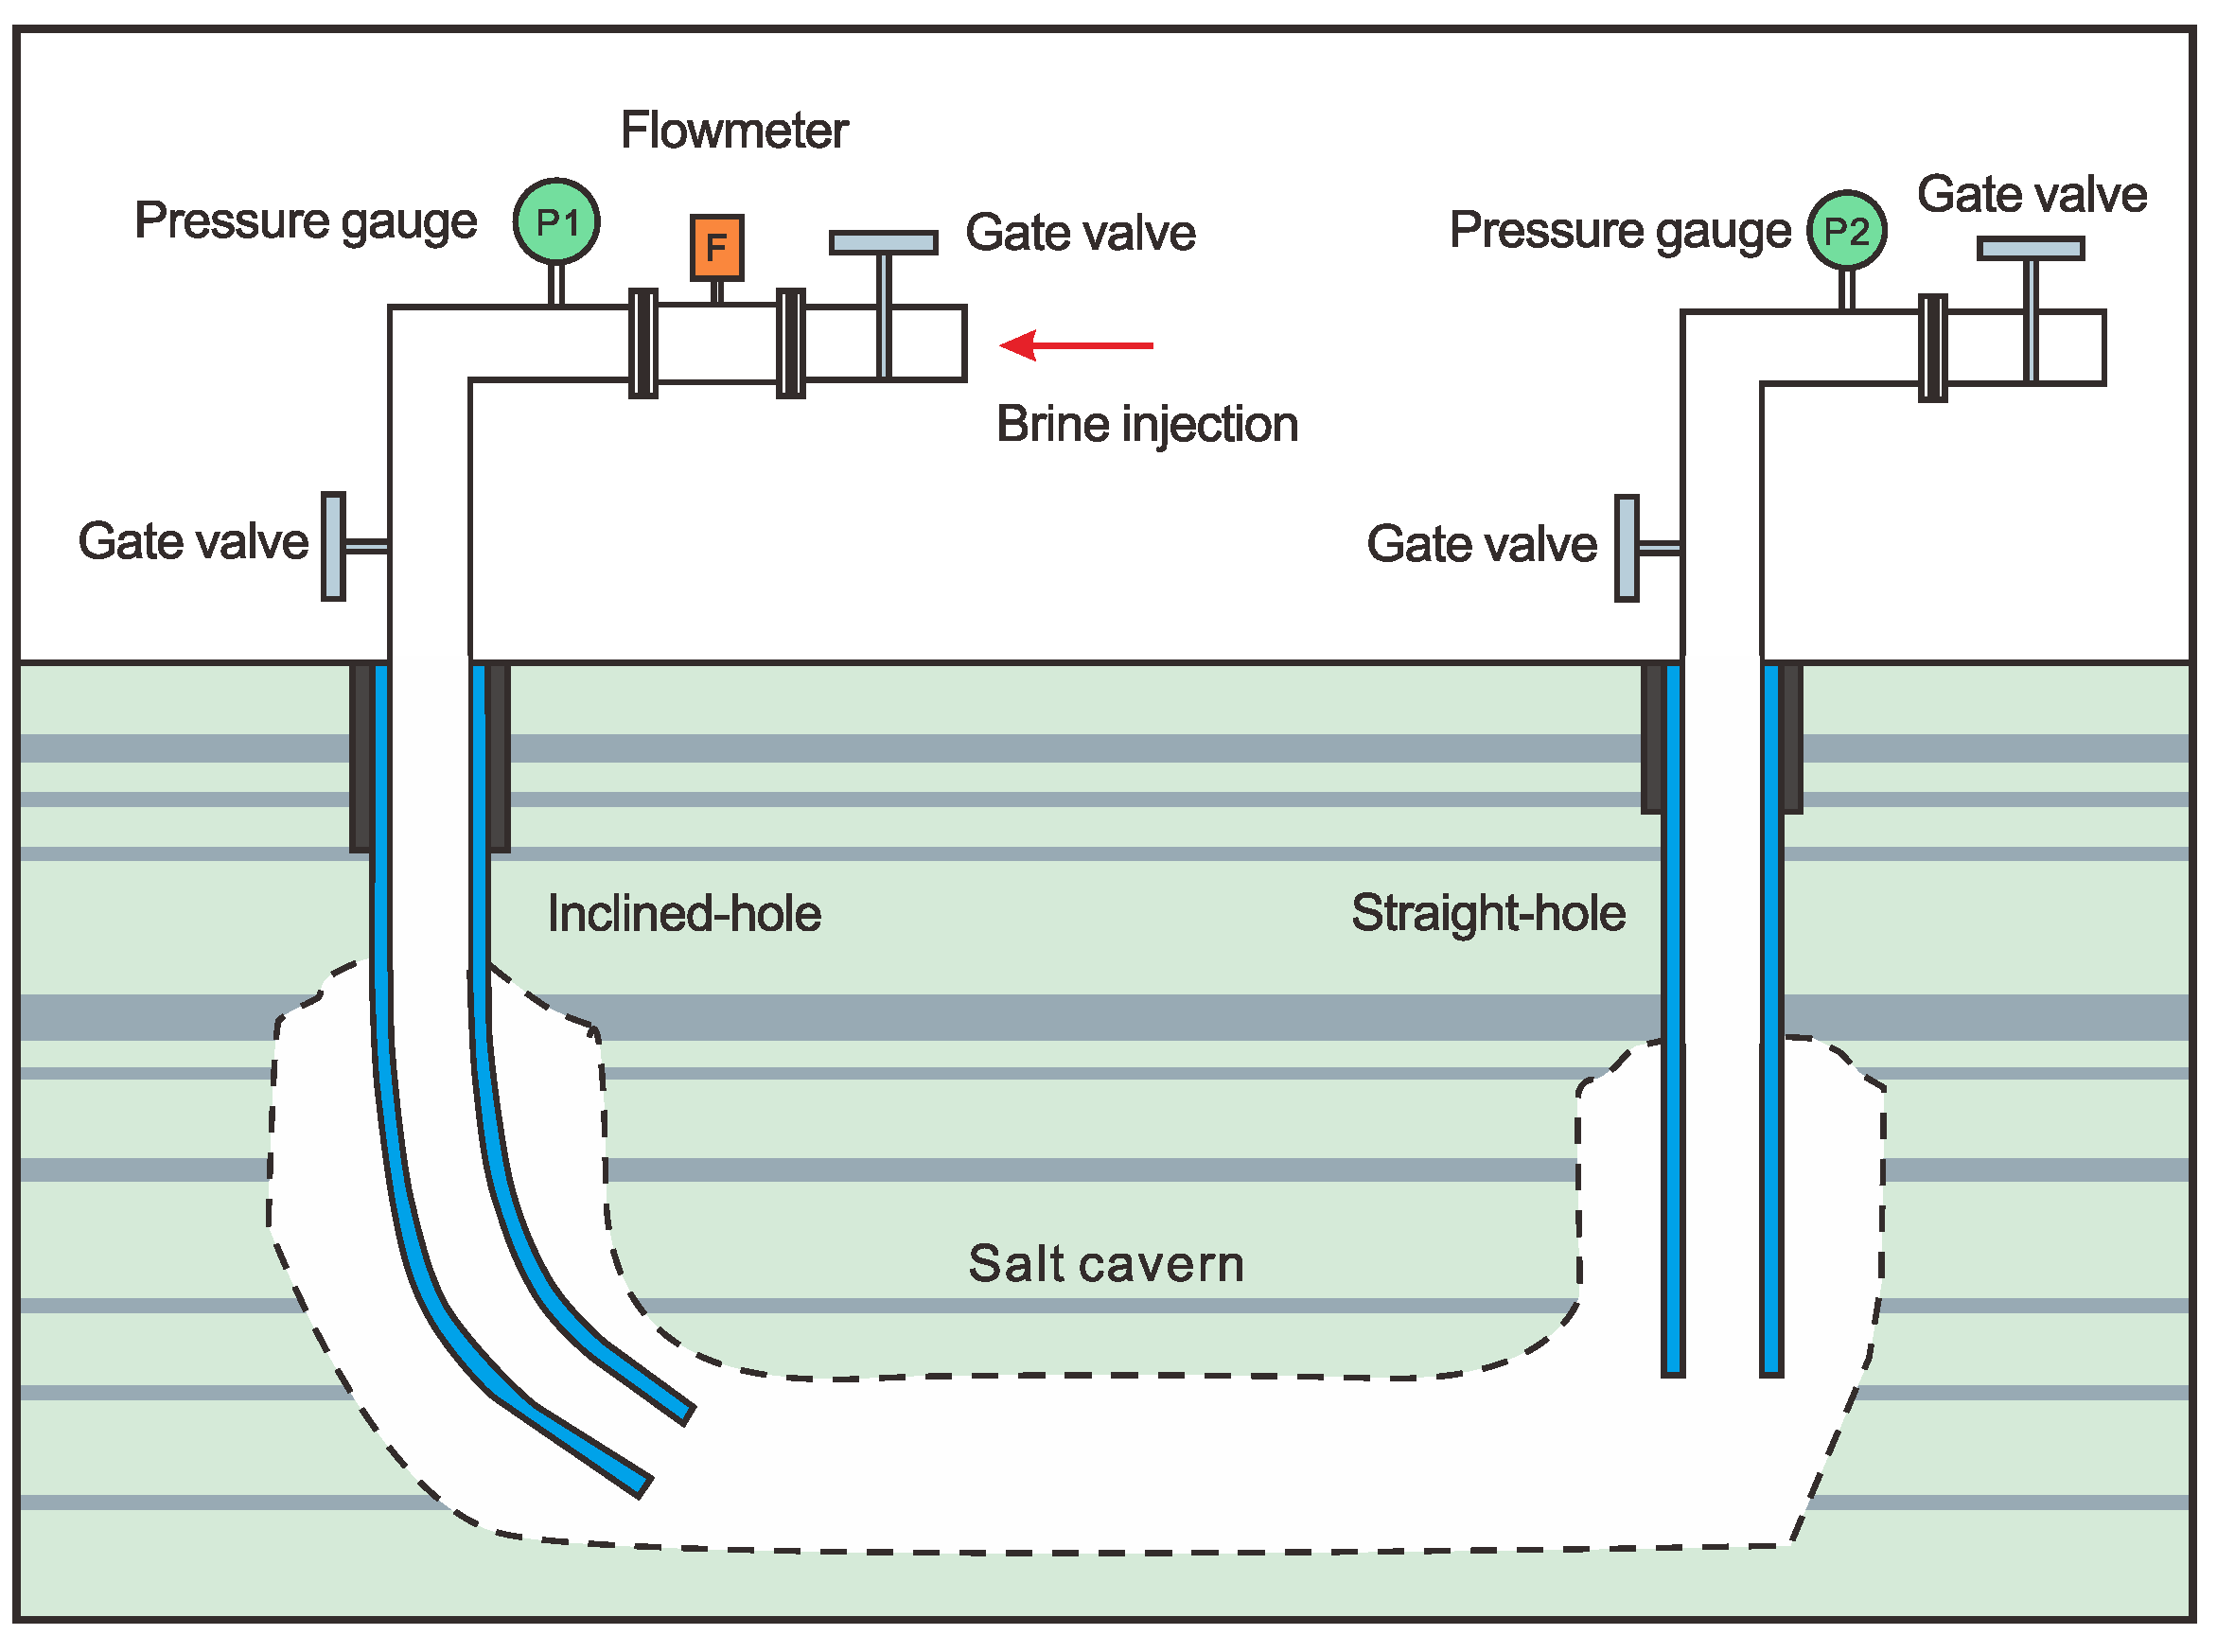
Conventional salt cavern energy storage construction generally uses a single well vertical construction mode; this way, the cavern shape is regular and easy to control, but there are also problems such as large friction, high energy consumption and low concentration of brine discharge. The main purpose of salt-chemical enterprises is to obtain salt brine resources with low requirements for the shape of the formed cavern; therefore, most of the production is conducted in the form of a double-well convective interconnection or triple-well convective interconnection, which require only a short construction period to obtain high concentrations of brine, while the production capacity can be significantly increased up to 2–4 times compared to a single well. In addition, the salt layer can be mined from the bottom layer by layer, and the service time of the salt well is greatly extended, which can maximize the use of the salt rock resources in the mine and improve the collection efficiency. At present, the ESC available in salt mines are basically of this mode [
37]. There are two main connection types of the convection wells: one is fracture interconnection and the other is butt interconnection, as shown in the
Figure 4 below.
The fractured convection well interconnection method relies on the fracture gap created by high-pressure water to form a channel between the two wells, which in turn circulates and dissolves to form the caverns. The horizontal butt well is connected to the diameter butt by horizontal orientation. As salt mining continued to develop to deep and tectonically complex areas, horizontal well technology was increasingly perfected, and this method has gradually become the development trend of salt mining. Due to the randomness of the extension direction and distance of the fractures in the process of connecting the fracturing wells, predicting the connecting channel becomes difficult. This adds unpredictable risks to the tightness and stability of the caverns. Therefore, we give priority to the horizontal butt well when finding the target.
- C.
Mining History
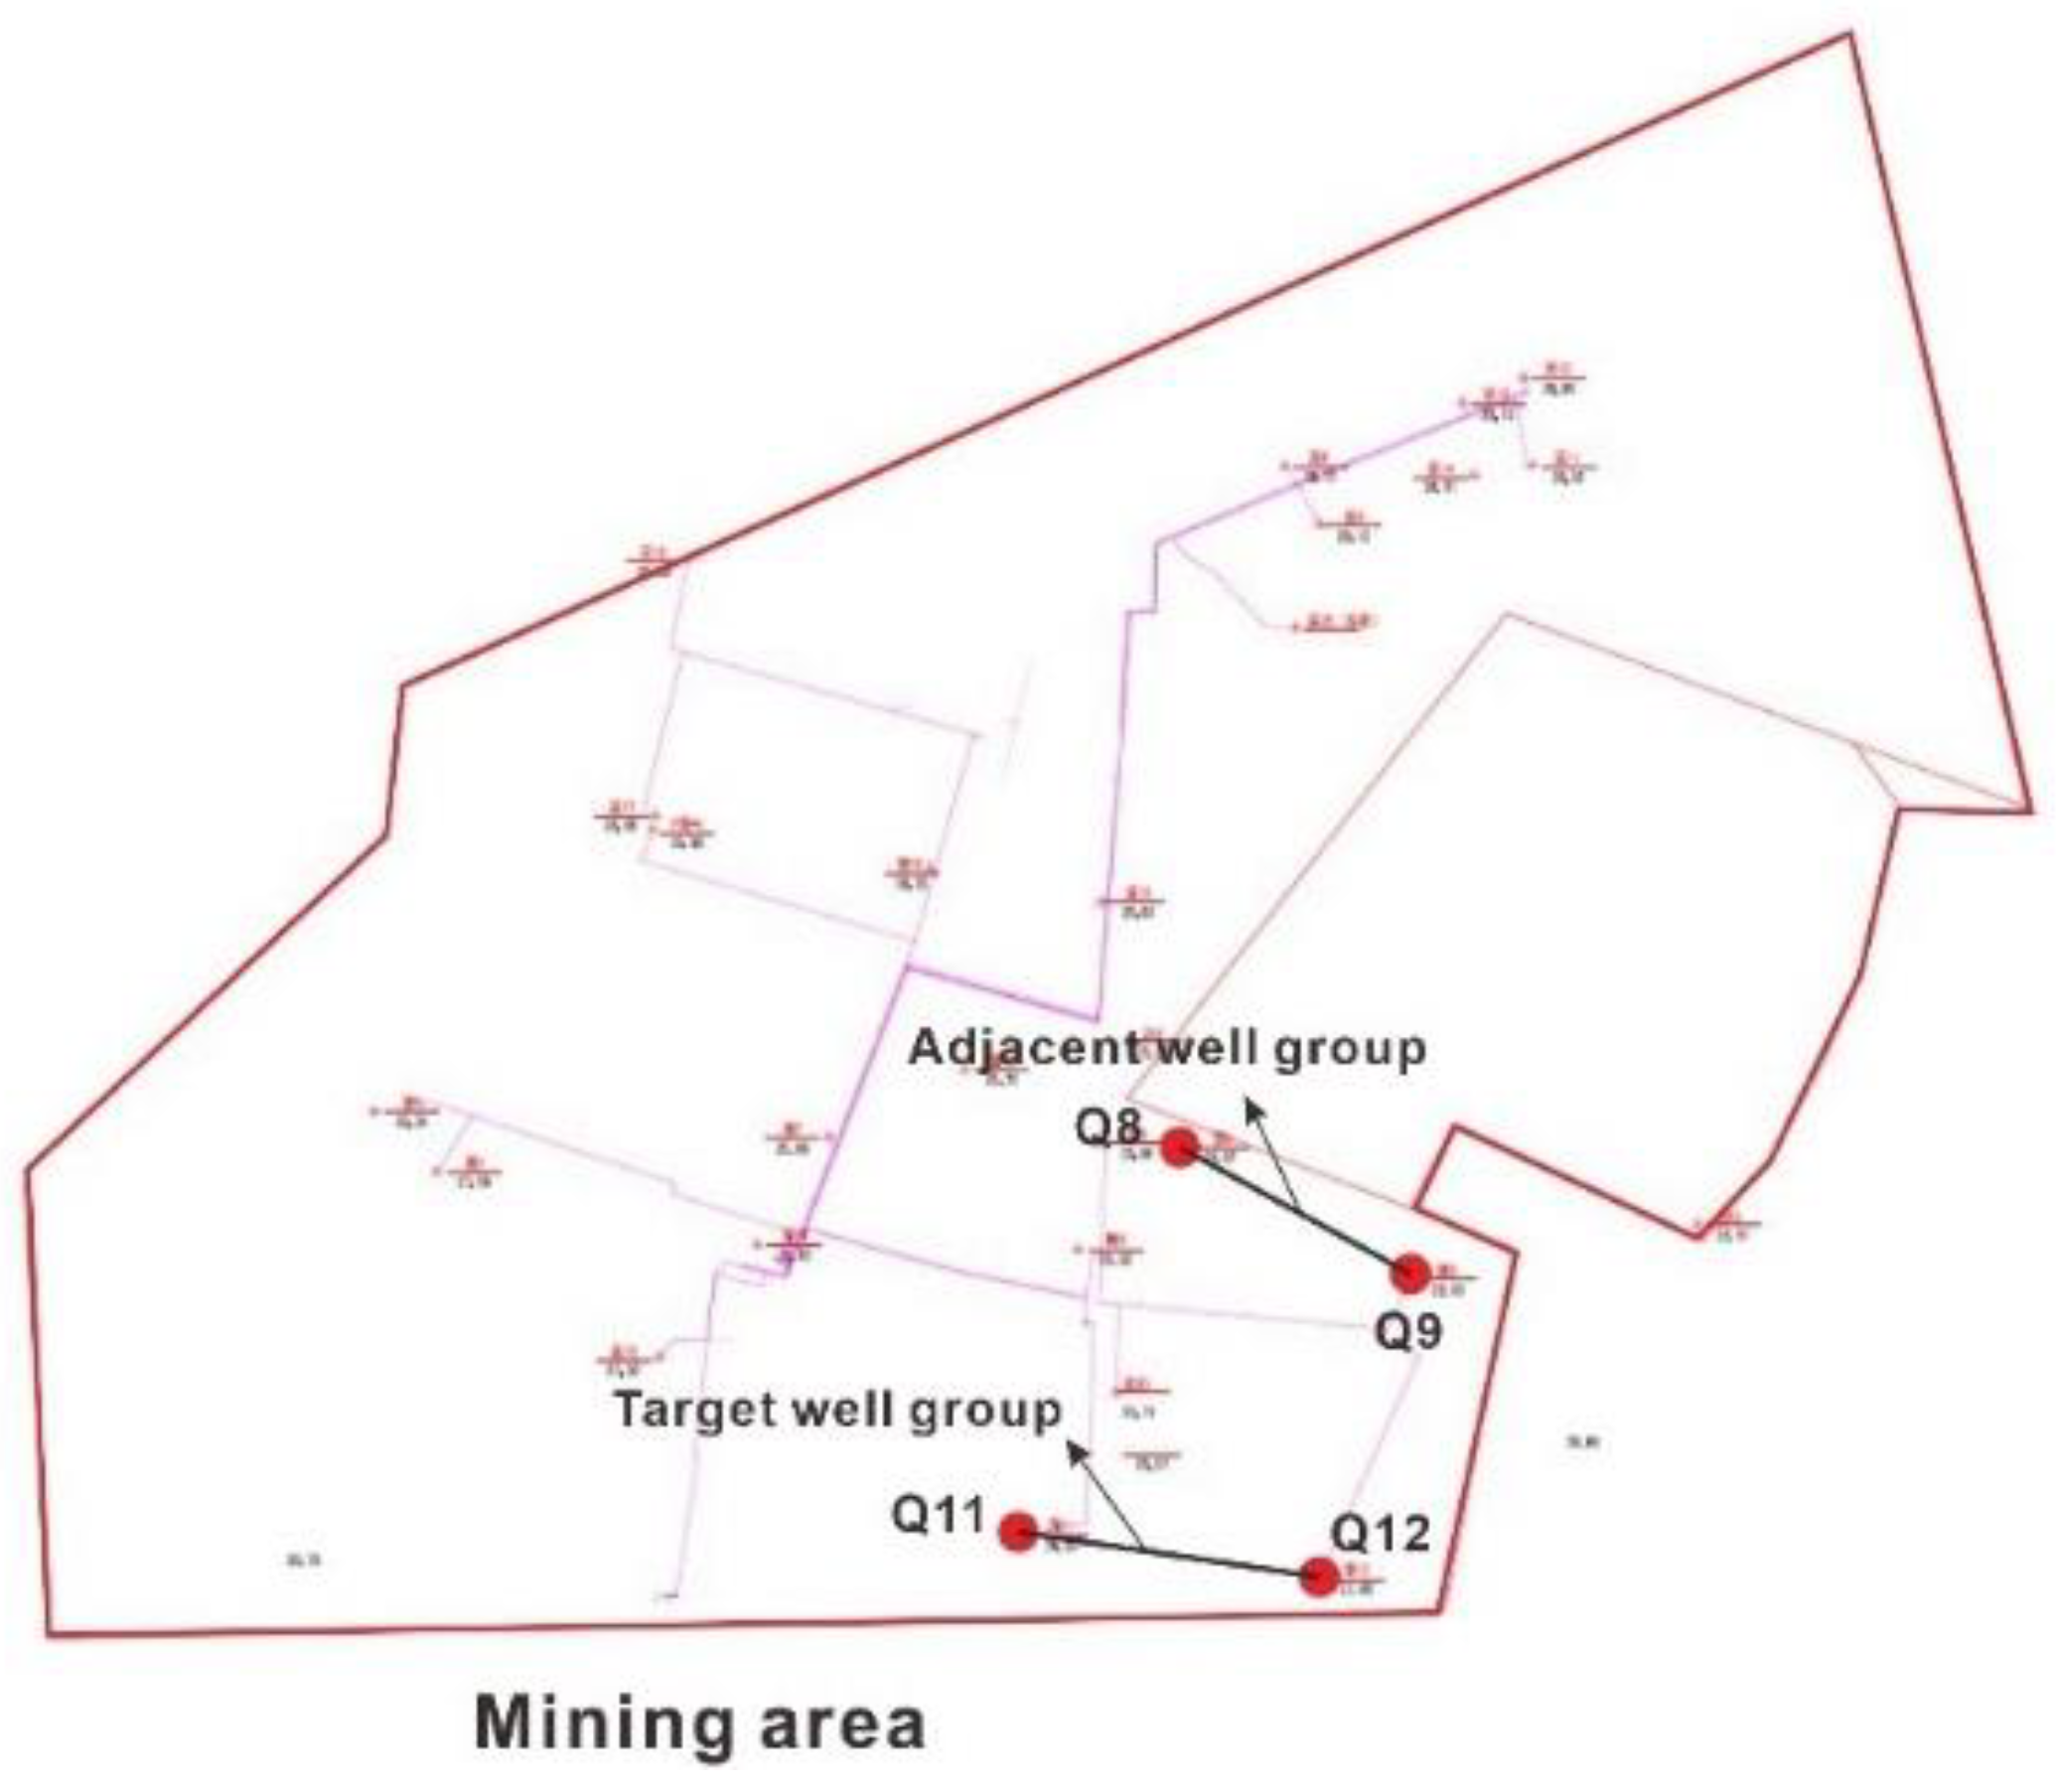
ESC has generally undergone long mining cycles, ranging from years to decades, during which various unexpected conditions may have occurred. Understanding the production history of the target well group is important for predicting the cavern’s status. In the screening process, we need focus on collecting the following information from the producers: (1) to understand the relative position of the target well group in relation to other producing well groups within the entire salt rock mining area and to determine whether there is a connection with neighboring well groups. (2) Whether engineering accidents such as ground collapse or brine leakage have occurred throughout the mining process, or other evidence that the cavern’ caprock has collapsed. (3) Collect the production information of the ESC’s well, including the accumulated running time, running flow rate, brine discharge concentration, injection-production method, etc. Through this information we can estimate the volume of the cavern and even make a preliminary estimation of the cavern’s roof position, which can provide valuable information for the subsequent sonar measurement and stability evaluation.
2.3. Ground Conditions
A. When selecting a site for the energy storage, it is important to first consider whether it can meet the requirements of the economics feasibility. For CAES systems, the ESC’s position should ensure the availability of sufficient wind and solar resources nearby, as well as the existence of a supporting grid system to provide surplus power for air compression and transmission of electricity generated by the release of compressed air [
38]. For salt cavern gas storage, the geographical location should be within 150 km from the consumption city center to reduce transportation costs; if it is mainly used as consumption peak regulation, then its distance from both the long-distance pipeline and the user concentration should not exceed 100 km [
39].
B. Secondly, the impact of ground safety should be considered. The site of energy storage should avoid population- and building-dense areas as much as possible, especially when storing natural gas and other flammable media to avoid accidents such as oil and gas leaks, resulting in casualties and property damage. At the same time, areas containing major structures should be avoided to prevent surface subsidence caused by cavern contraction from affecting the stability and safe operation of buildings.
Based on the above analysis, we summarize the principle for screening ESC as follows (
Figure 5):
3. Tightness Ability Evaluation Techniques and Test Methods of ESC
The construction of energy storage with ECS is complex and involves the safety protection of underground engineering, shaft engineering, surface engineering and other aspects. The tightness performance of the cavern is the primary problem to ensure the safe and stable operation of the energy storage [
40]. After screening the ESC with energy storage potential through certain criteria, the first thing that needs to be clarified is whether their tightness performance is intact, and the best way to discern this is through field tests.
3.1. Existing Detection Techniques of Salt Cavern Tightness
At present, there are three main methods for testing the tightness ability of a salt cavern at home and abroad: the API (American Petroleum Institute) method, used in North America [
41], the Geostock method, popularly used in Europe [
42], and the NLT (Nitrogen Leakage Test) method in China [
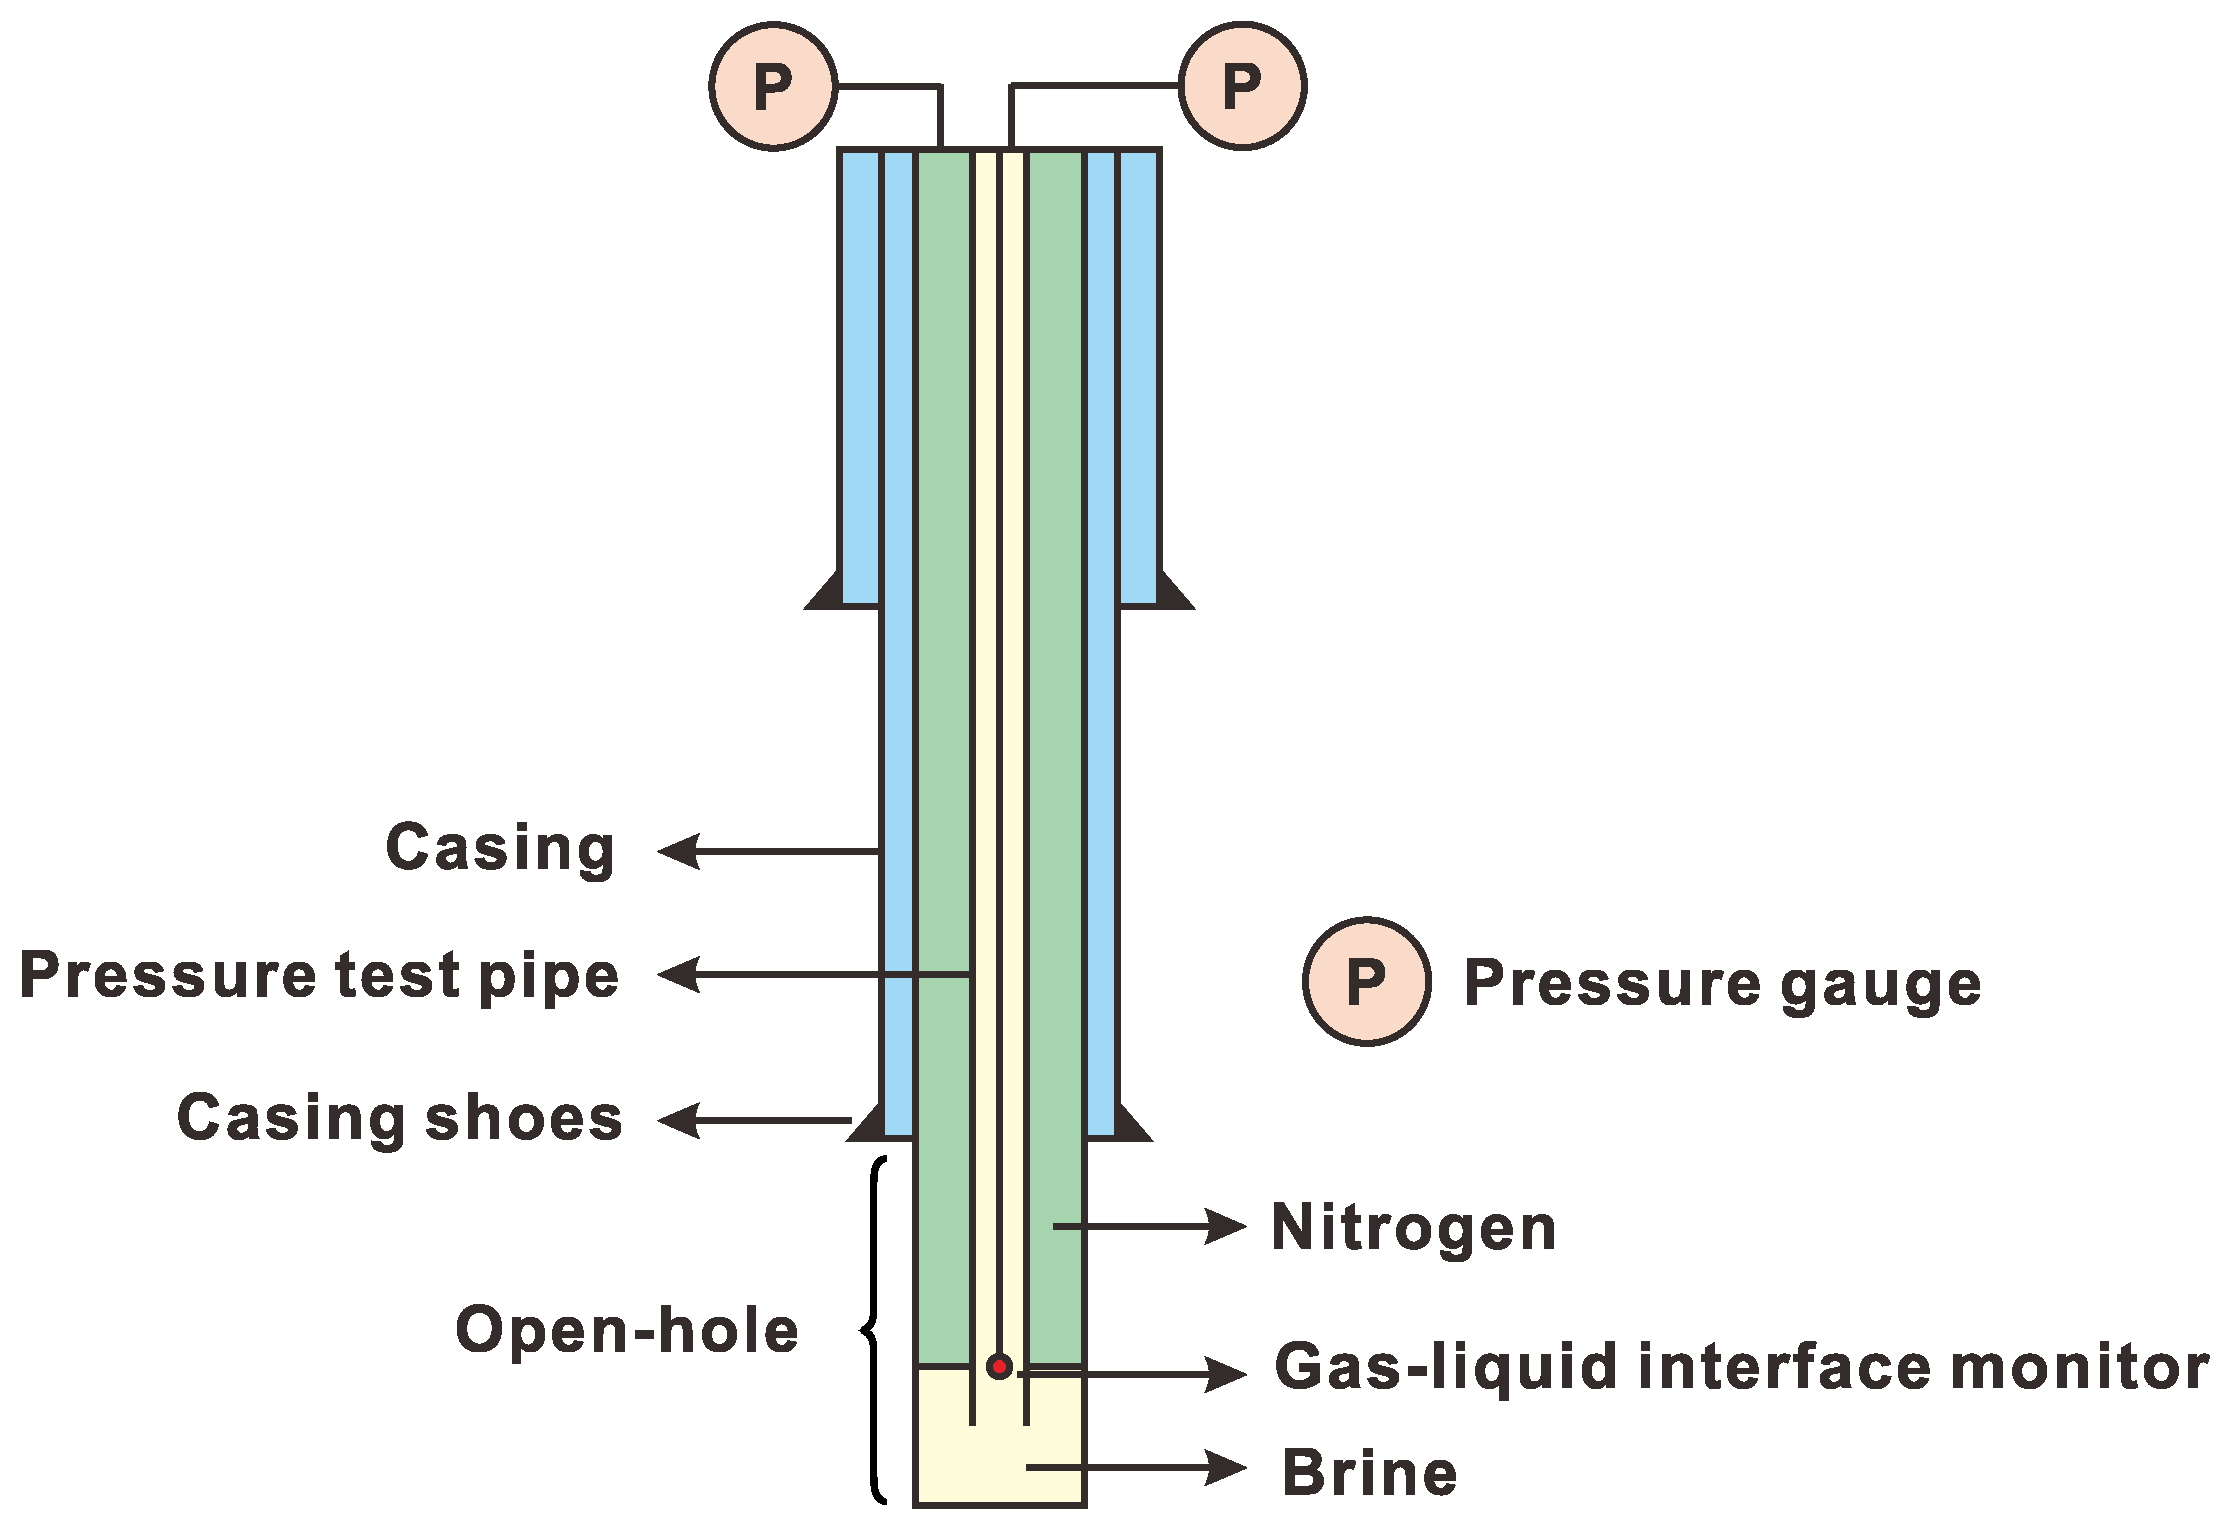
43]. Among them, the API method is used to evaluate the cavern tightness ability by injecting nitrogen or air into the wellbore and monitoring the change in the gas–liquid interface with logging instruments. While the Geostock method test medium is oil, by injecting oil into the wellbore, checking the wellhead pressure and recovering the oil allows us to compare the before and after volume and thus evaluate the cavern’s sealing ability. The NLT test method is proposed by China in the construction practice of Jintan salt cavern gas storage by borrowing the advantages of the API and Geostock methods. It has the advantages of a simple testing principle, low cost, etc., and can also roughly determine the leak location if the wellbore seal fails.
The brief principle of NLT testing is as follows (
Figure 6). The pressure test pipe is lowered into the open-hole section, and then the gas–liquid interface monitoring instrument is placed in there. Subsequently, saturated brine is injected into the salt cavern to bring the internal pressure up to the design operating pressure, followed by nitrogen injection into the hollow ring between the casing and the pressure test pipe. Then, the change in the gas–liquid interface is monitored from time to time and the nitrogen pressure in the hollow ring is kept at a constant value when the depth of the gas-liquid interface is at a position 5–10 m below the casing shoes. In this way, the absolute gas leakage and the trend of leakage rate over time can be calculated based on the change in the position of the gas–liquid interface and the pressure gauge reading. If both of the following criteria are met, the tested cavern tightness performance is considered qualified.
A. The gas leakage rate gradually decreases with time and eventually stabilizes.
B. In the test time span range, the gas–liquid interface position change amplitude shall not exceed 1 m.
If only condition A is satisfied, not condition B, it is necessary to discuss the specific situation according to the site or extend the test time to determine whether the tested cavern tightness ability is qualified. If condition A or both are not satisfied, the sealing ability is directly judged to be unqualified.
The NLT test method has been used as a validation evaluation prior to formal energy storage in salt caverns, with high requirements for wellbore and wellhead installations, and is essentially untestable for ESC’s casing that have been in continuous production for many years. The main reason is that after years of continuous production in the ECS, the casings are basically deformed or even wrongly broken, which makes it impossible to start many subsequent works. For example, NLT testing requires placing the testing pipe, gas–liquid interface monitoring or logging equipment, all of which depend on the smooth up and down of the casing. In addition, it is difficult to predict the degree of damage in the underground casing, and the gas–liquid interface is extremely volatile when conducting NLT testing, making it difficult to estimate the true leakage volume through theory. In conclusion, using the NLT testing method to evaluate the tightness requires construction modification of the wellbore first, and the testing cost is high, which will make all parties bear a high investment risk and cannot be an effective method for the pre-evaluation of an ESC. Therefore, a simpler and more effective testing program must be utilized to evaluate the ESC prior to construction to avoid investment risks.
3.2. Brine Injection Test of the ESC
From the actual situation and characteristics of the ESC, it is possible to use only brine as the test medium, inject saturated brine into the salt cavern through the original production pipeline and equipment of the salt chemical enterprise. At the same time, recording the flow and pressure data for subsequent analysis of I have checked and revised the tightness ability.
3.2.1. Test Preparation
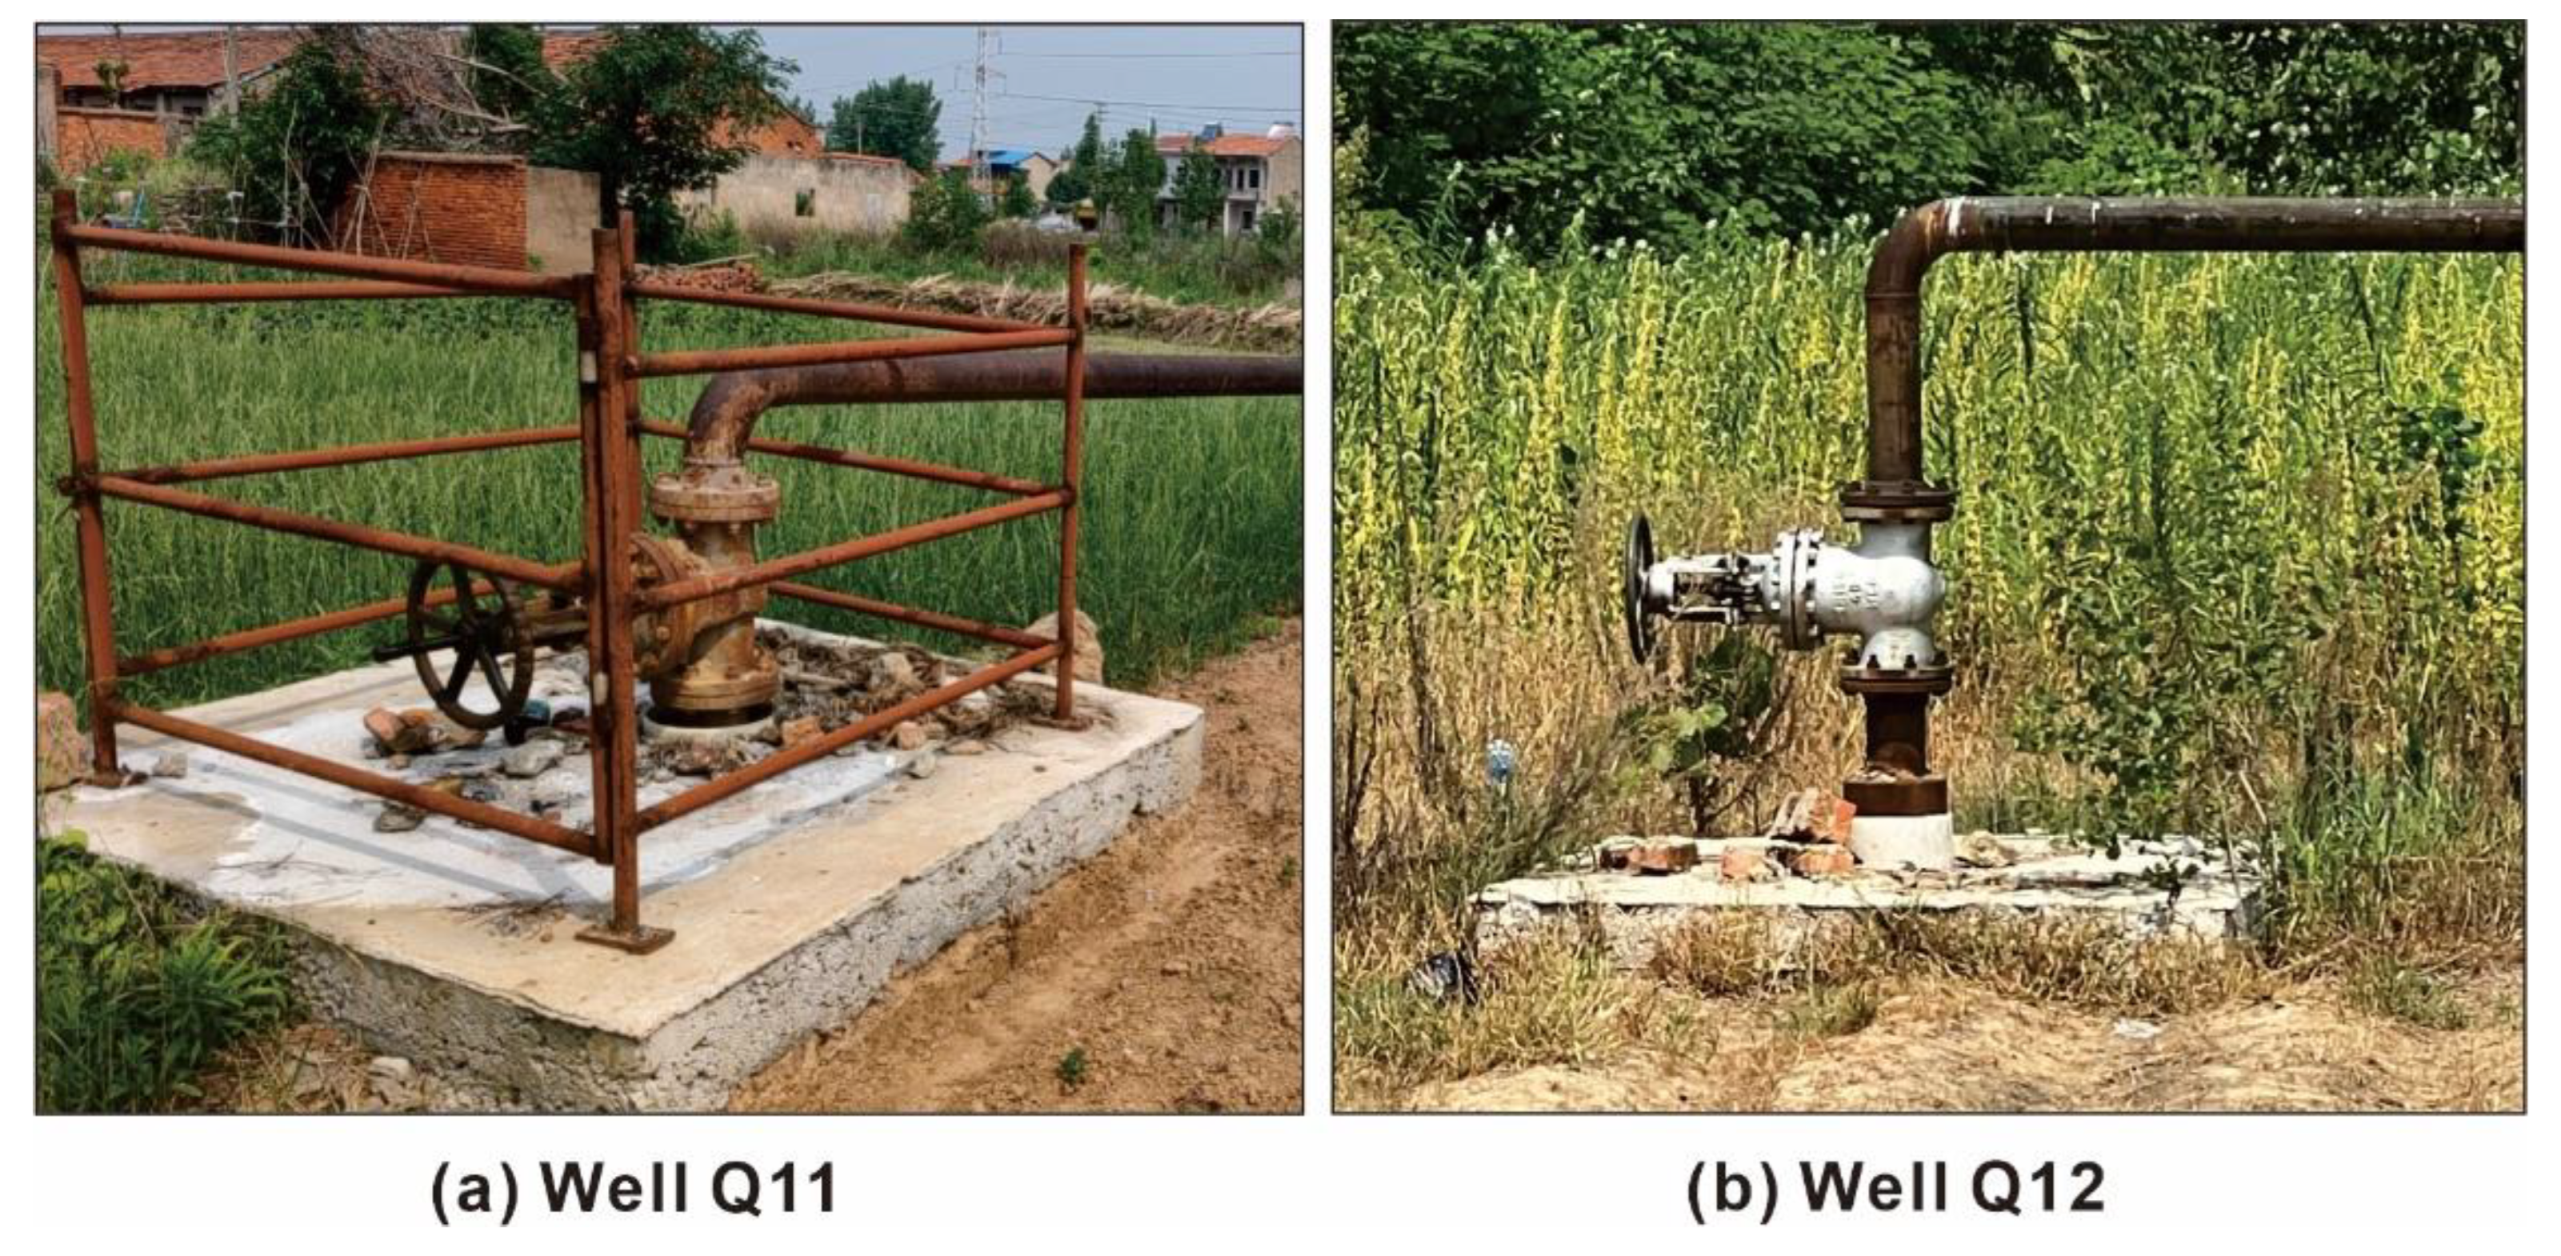
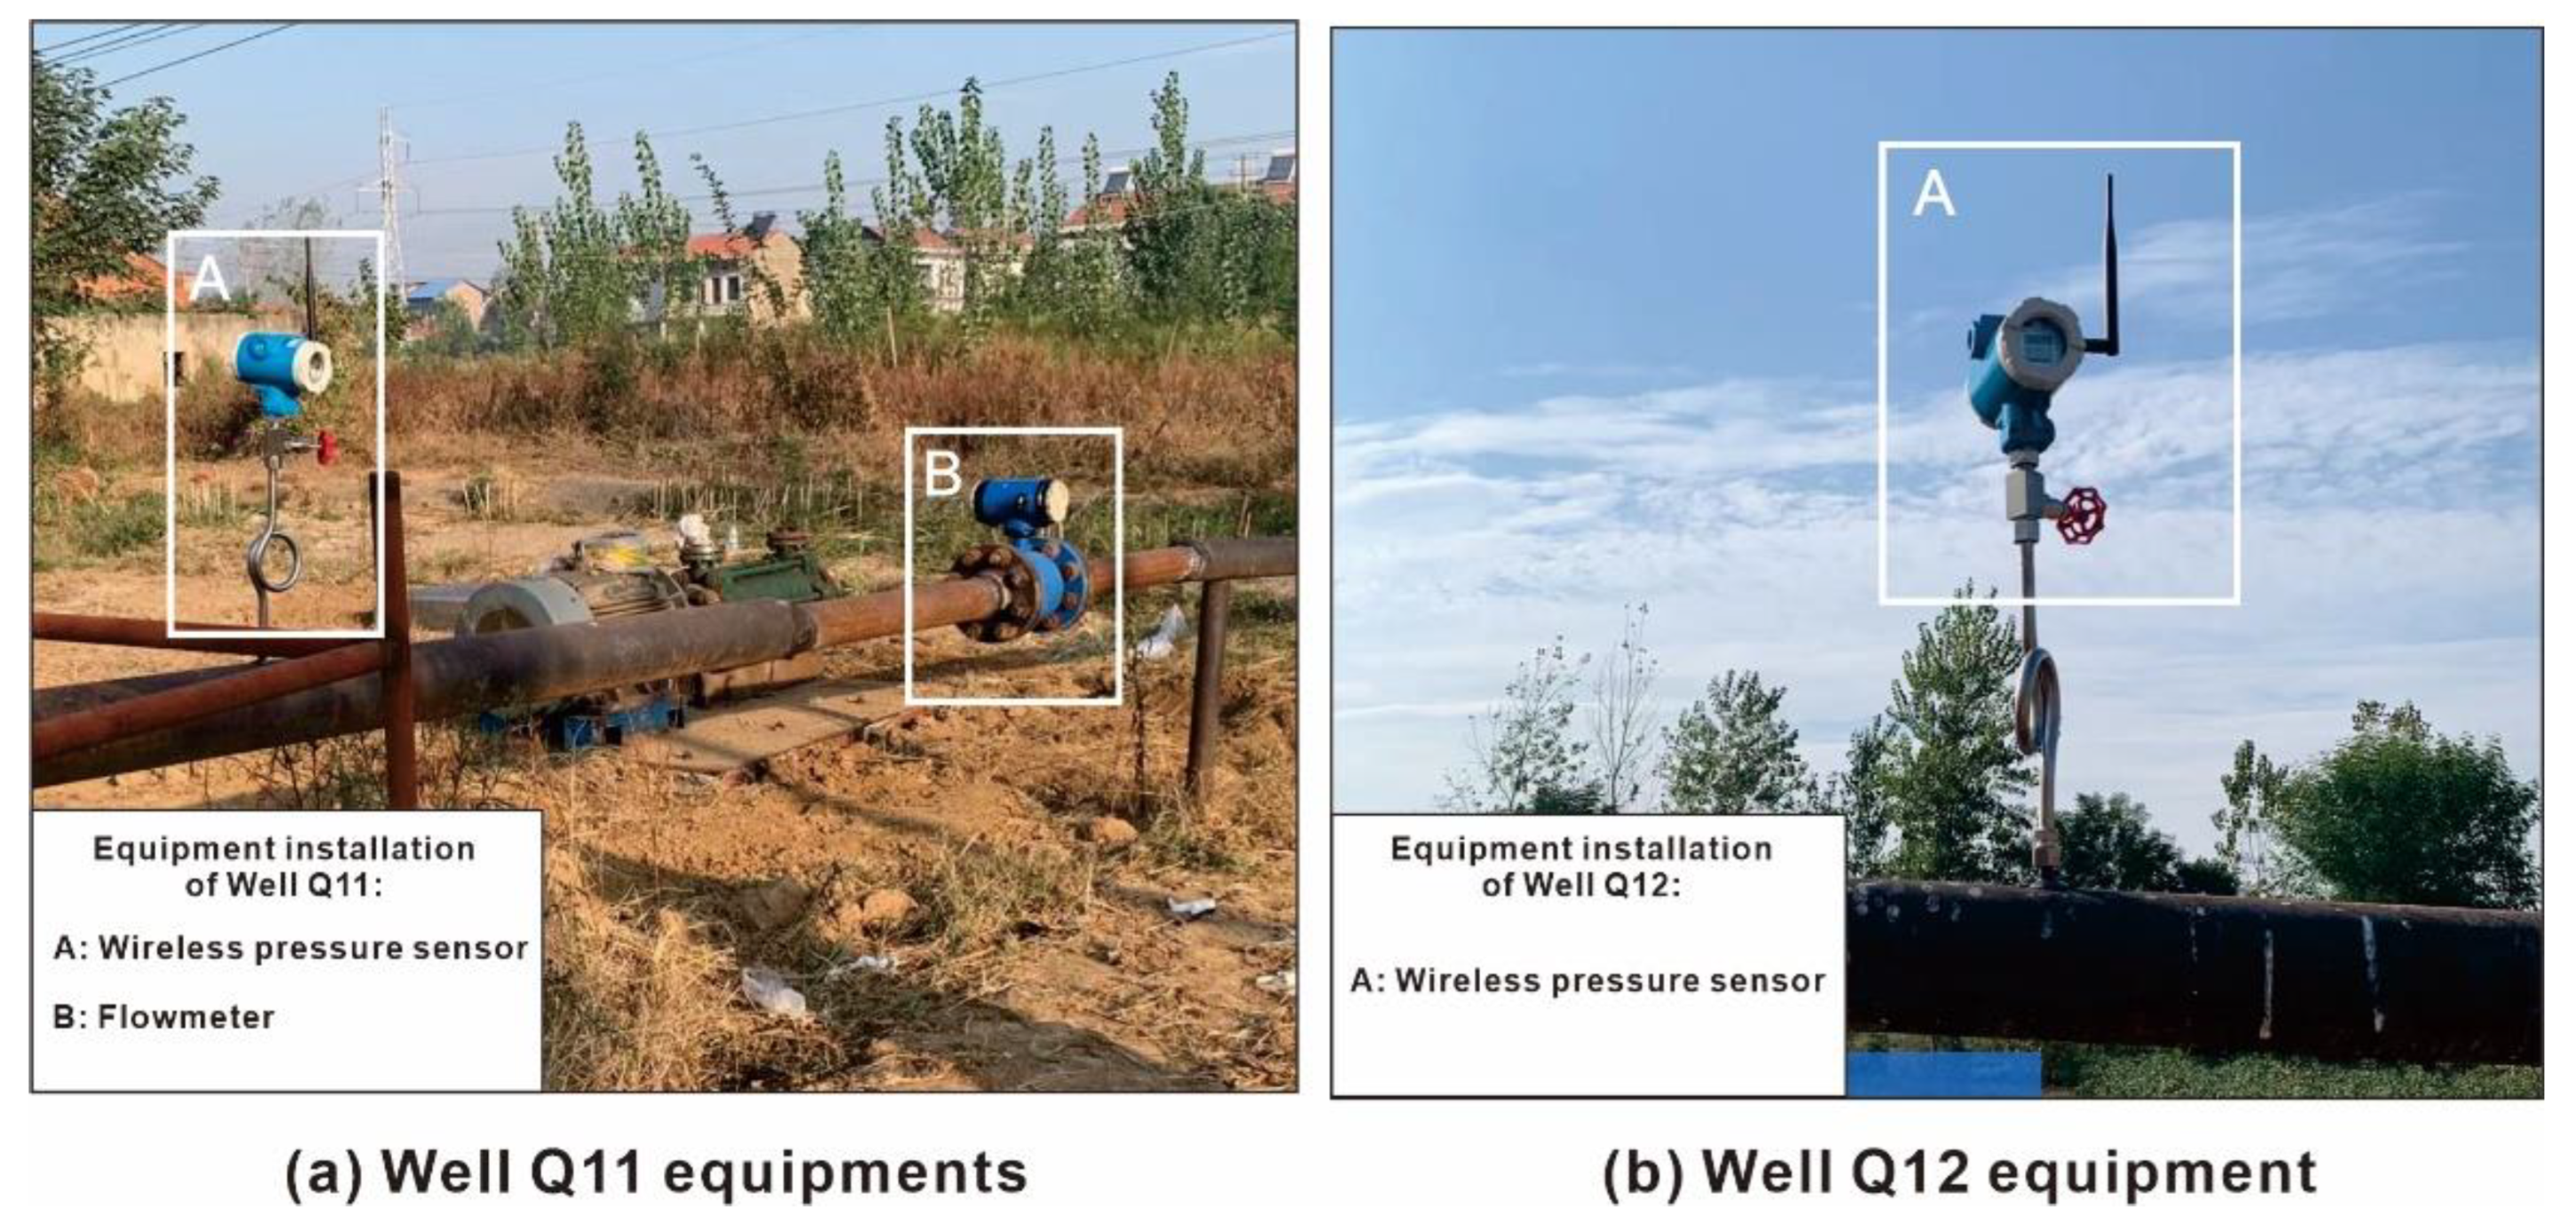
In order to improve the test accuracy, the following work needs to be carried out: (1) For the well group under production, the process needs to be stopped to make the salt cavern thermally balanced, while for the abandoned well group there is no need to wait; (2) the rust and corrosion of the wellhead, as well as the pressure-bearing pipeline, needs to be checked to evaluate its pressure-bearing capacity and ensure the safety of the test; (3) the wellhead and the injection pipeline need to be connected and for old well groups without an injection pipeline, a pump truck needs to be chosen as the injection equipment. Meanwhile pressure gauges, flow meters, and valves should be installed on the injection manifold (
Figure 7).
The test pressure is determined according to the minimum principal stress value at the casing shoes. In order to ensure the safety of the salt roof, 80% of the minimum principal stress value of the formation is taken for calculation. Then, the pressure value at the wellhead can be obtained after deducting the hydrostatic column pressure of the wellbore. The calculation formula is shown in Equation (1). If the minimum principal stress value of the formation is difficult to obtain, it is recommended to calculate it according to the empirical pressure gradient, as shown in the following Equation (2).
where, the
is the maximum wellhead pressure obtained from the formation stress (MPa);
is minimum principal stress value at the casing shoes (MPa);
is density of injected brine (kg/m³);
is the gravitational acceleration (m/s
2);
is the depth of cavern roof (m);
is the maximum wellhead pressure calculated by empirical pressure gradient (MPa);
is the empirical pressure gradient, value is 0.017 MPa/m.
3.2.2. Testing Process
The Brine Injection Test is divided into two steps: Independence Test and Pressure-Flow Comprehensive test. The former is used to evaluate whether the target cavern and adjacent caverns exist in collusion, and the latter is used to conduct more detailed tightness evaluation of the target cavern by orderly brine injection.
- I.
Independence test
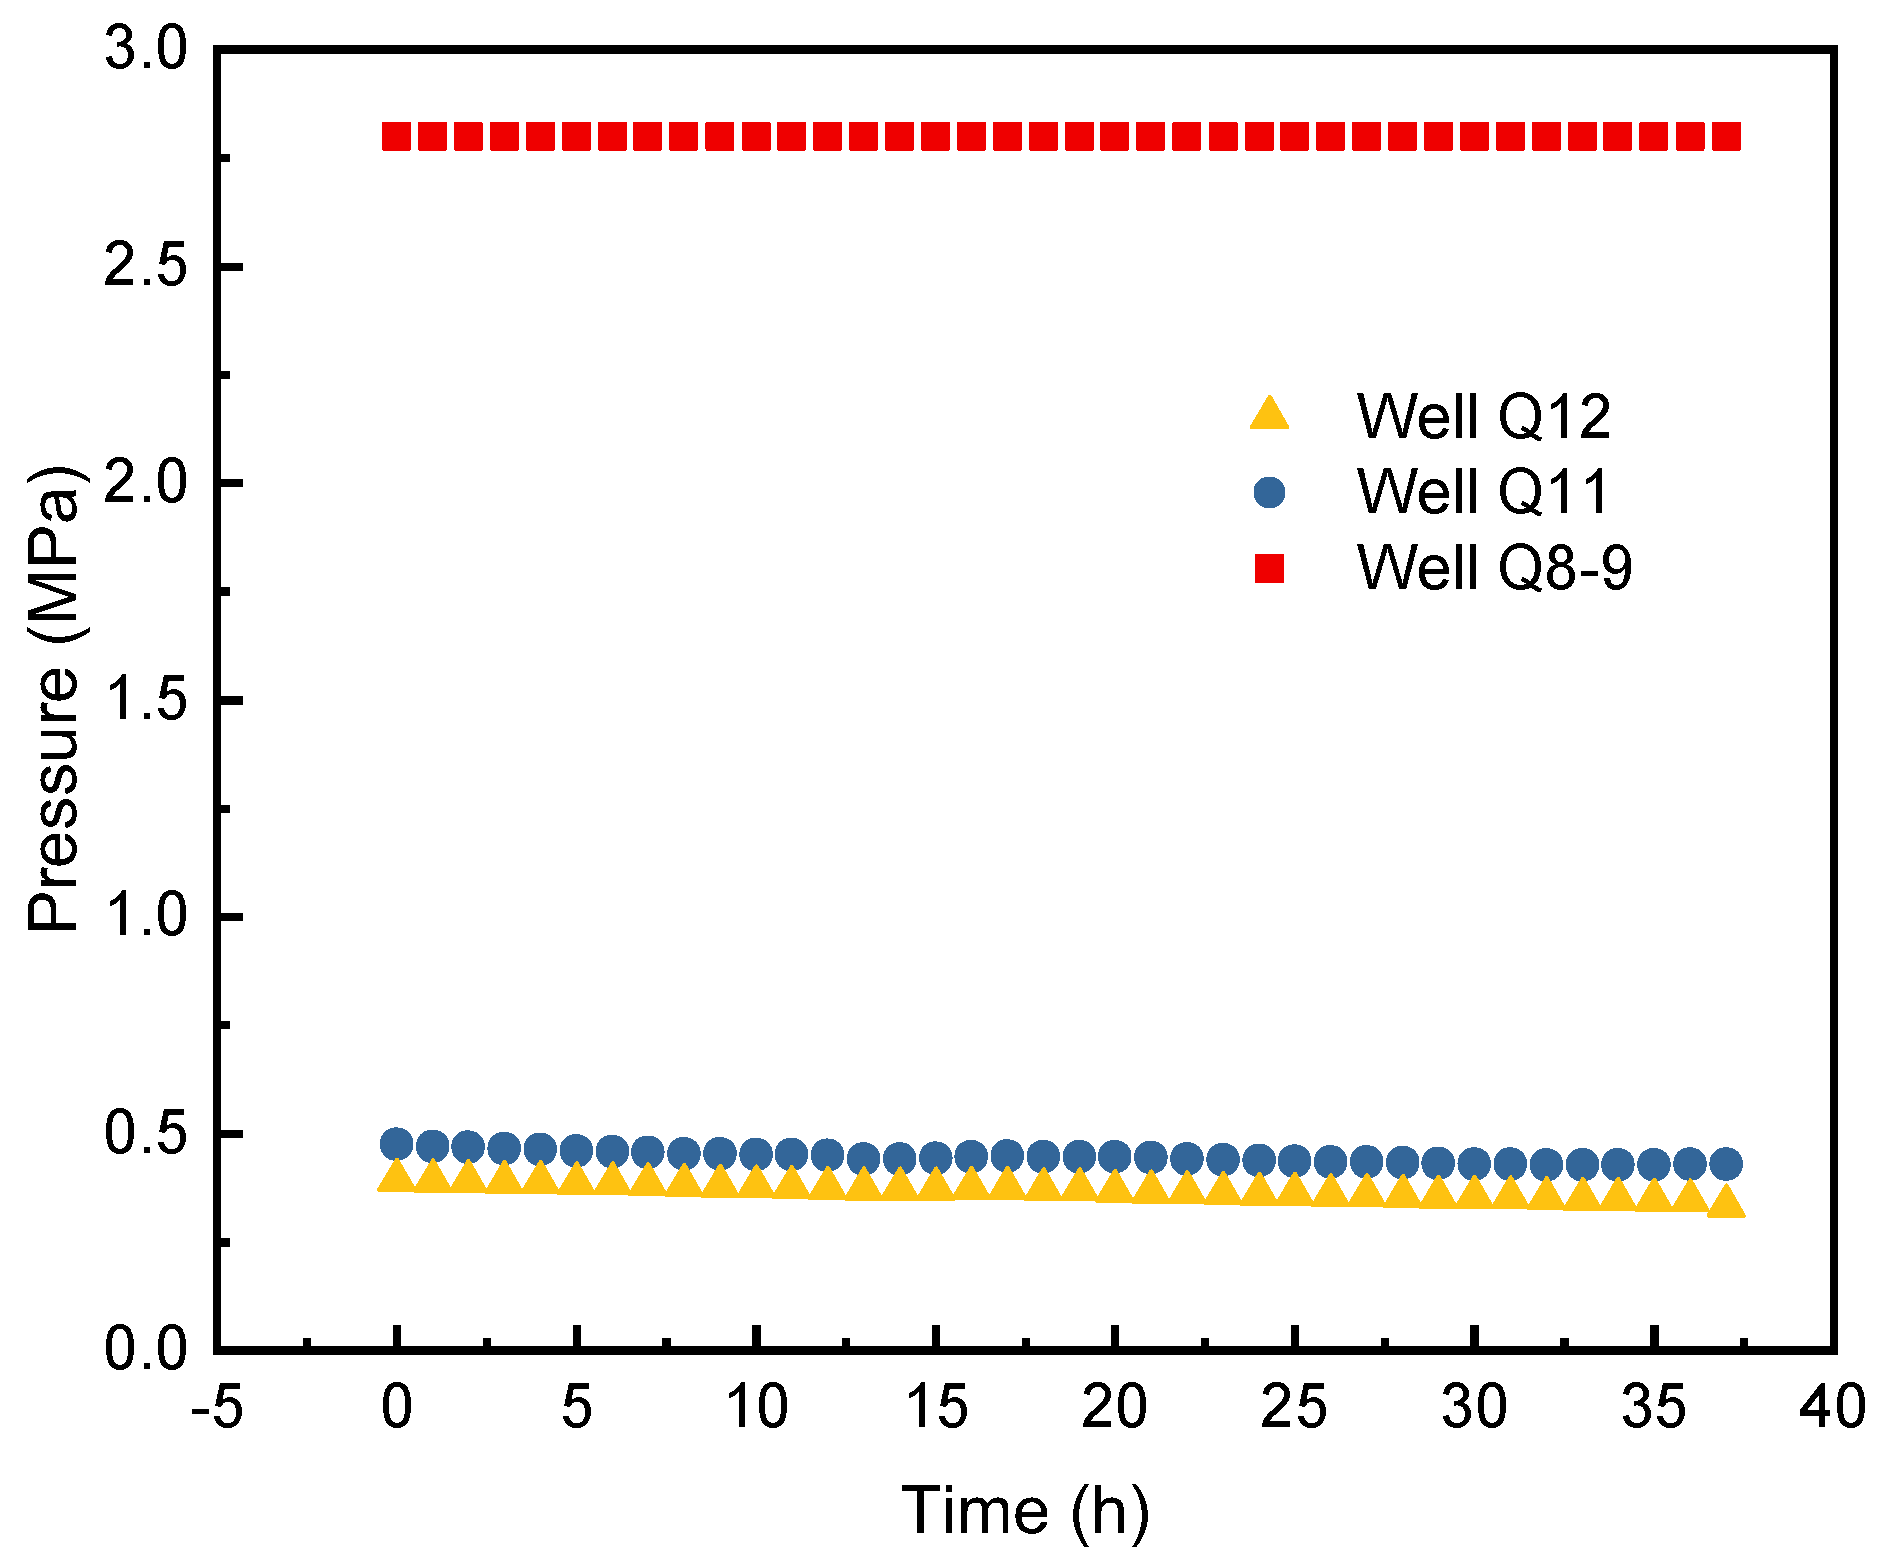
A. Before the test starts, we have to collect relevant information from the salt chemical enterprises, making clear the information concerning which well groups are adjacent to the well group under test.
B. The tested well group needs to be stopped and the wellhead valve opened for evacuation until no brine is released. Then, the valve is closed to seal off the cavern and monitor the wellhead pressure change.
C. The adjacent well group is kept in normal production at high pressure and the production pressure data is recorded every hour.
D. The pressure data between the target well group and the adjacent well group are compared during the monitoring process. If the target well group pressure remains basically unchanged, it can be considered as an independent cavern.
- II.
Pressure-flow comprehensive test
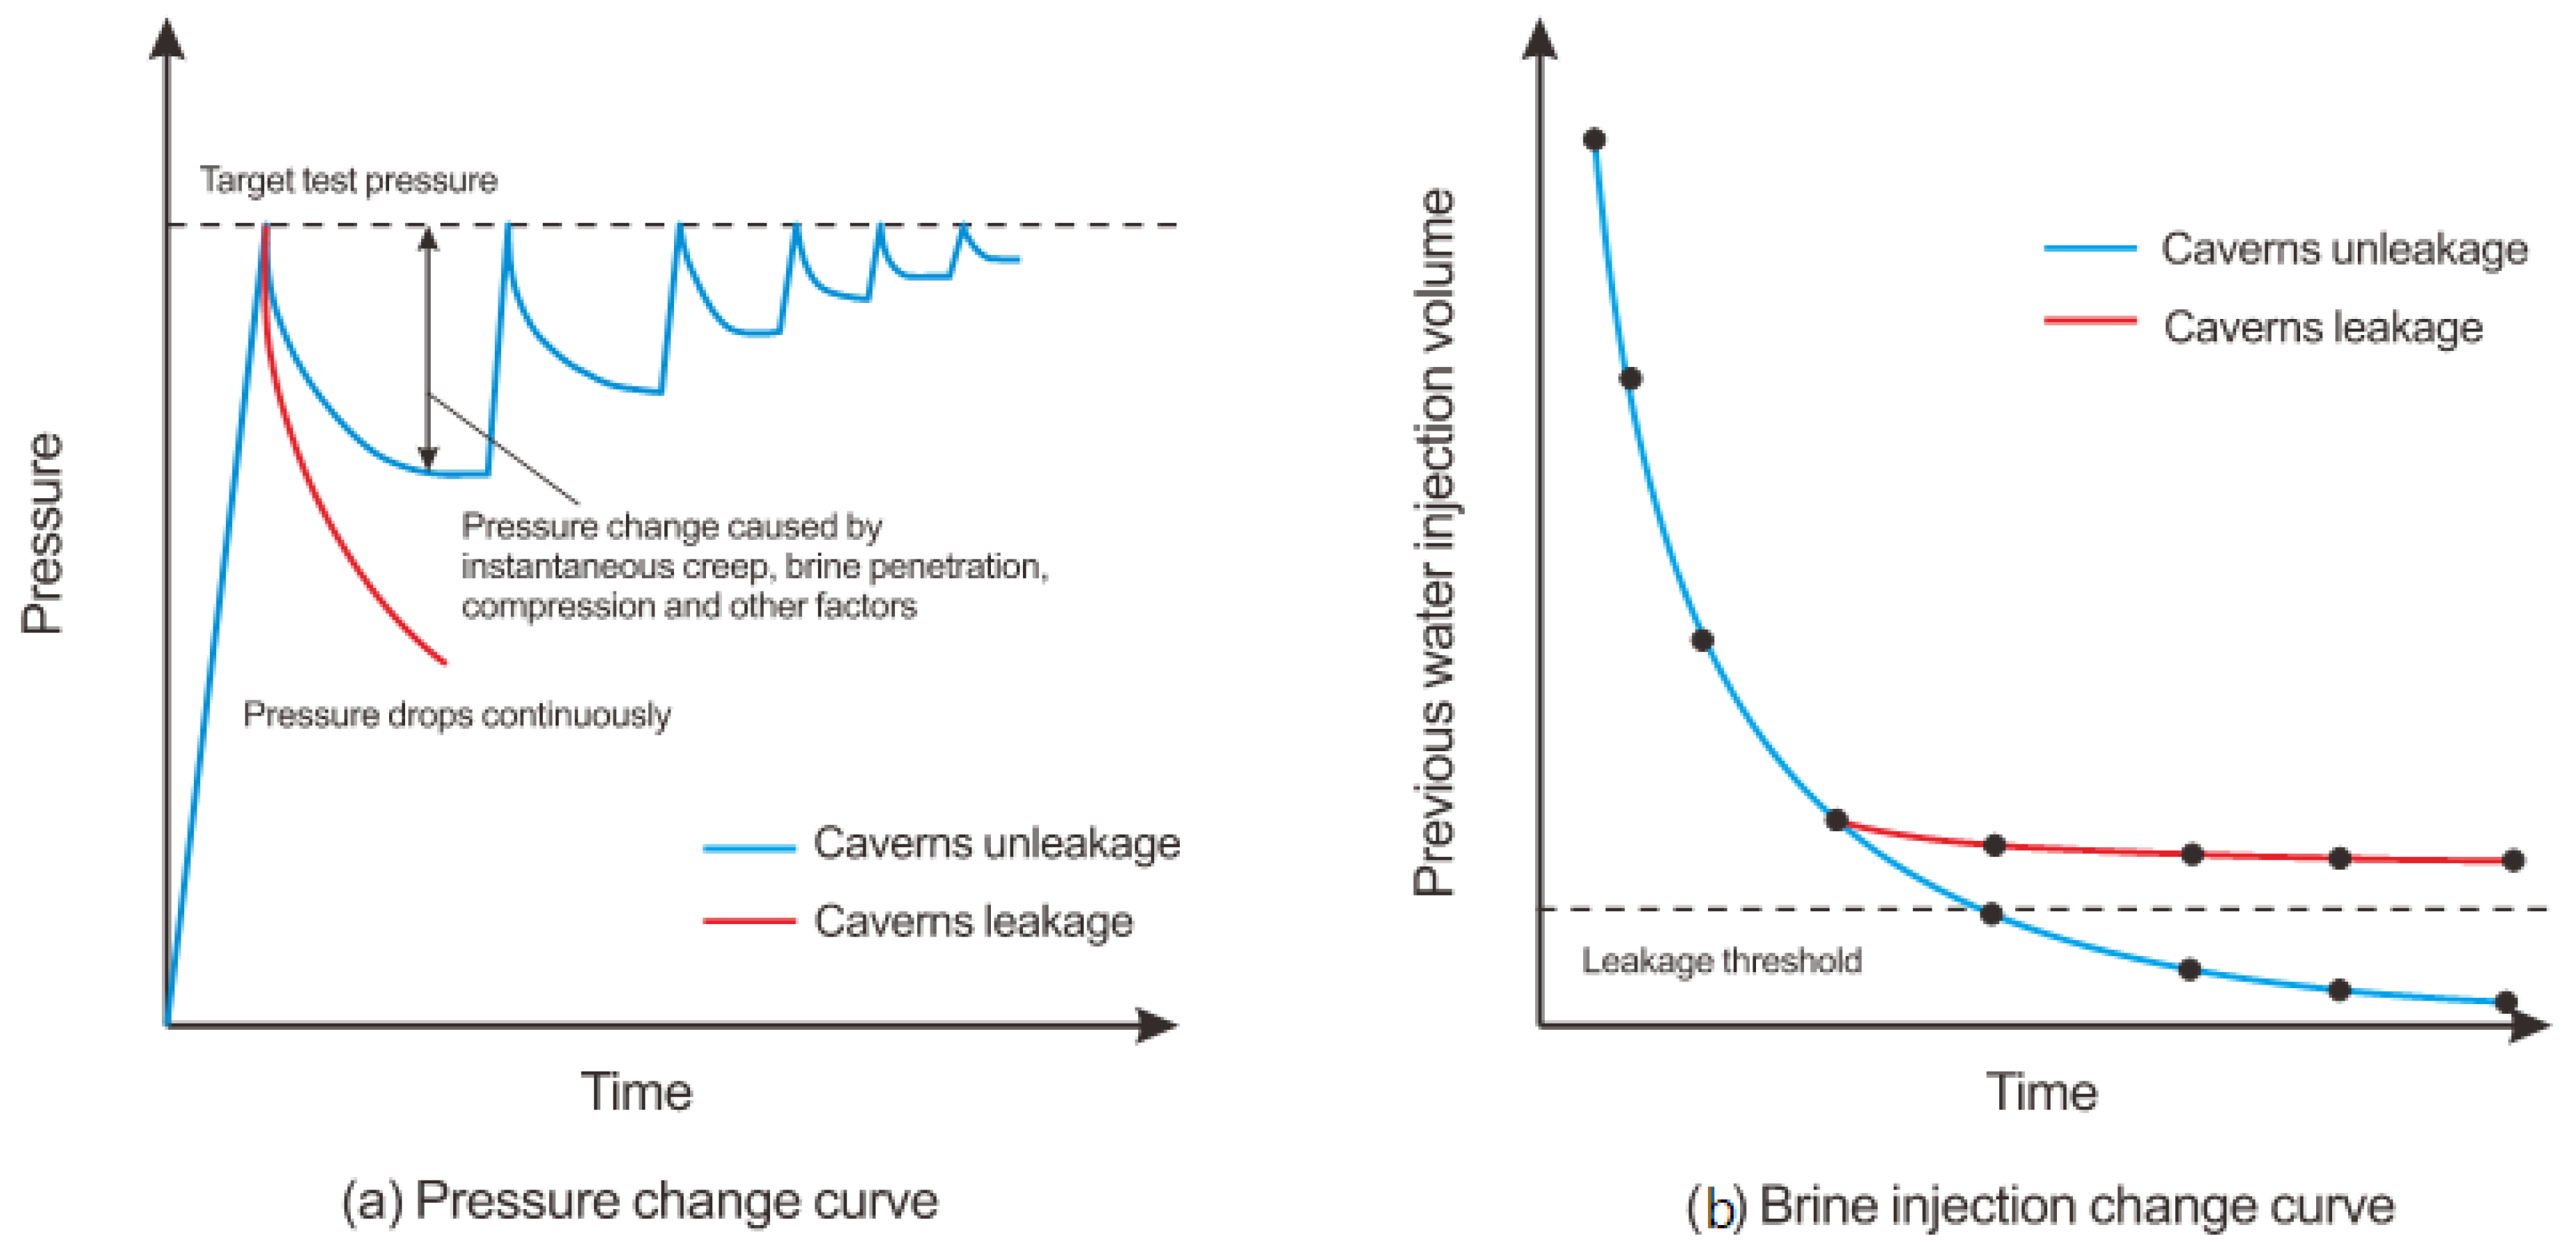
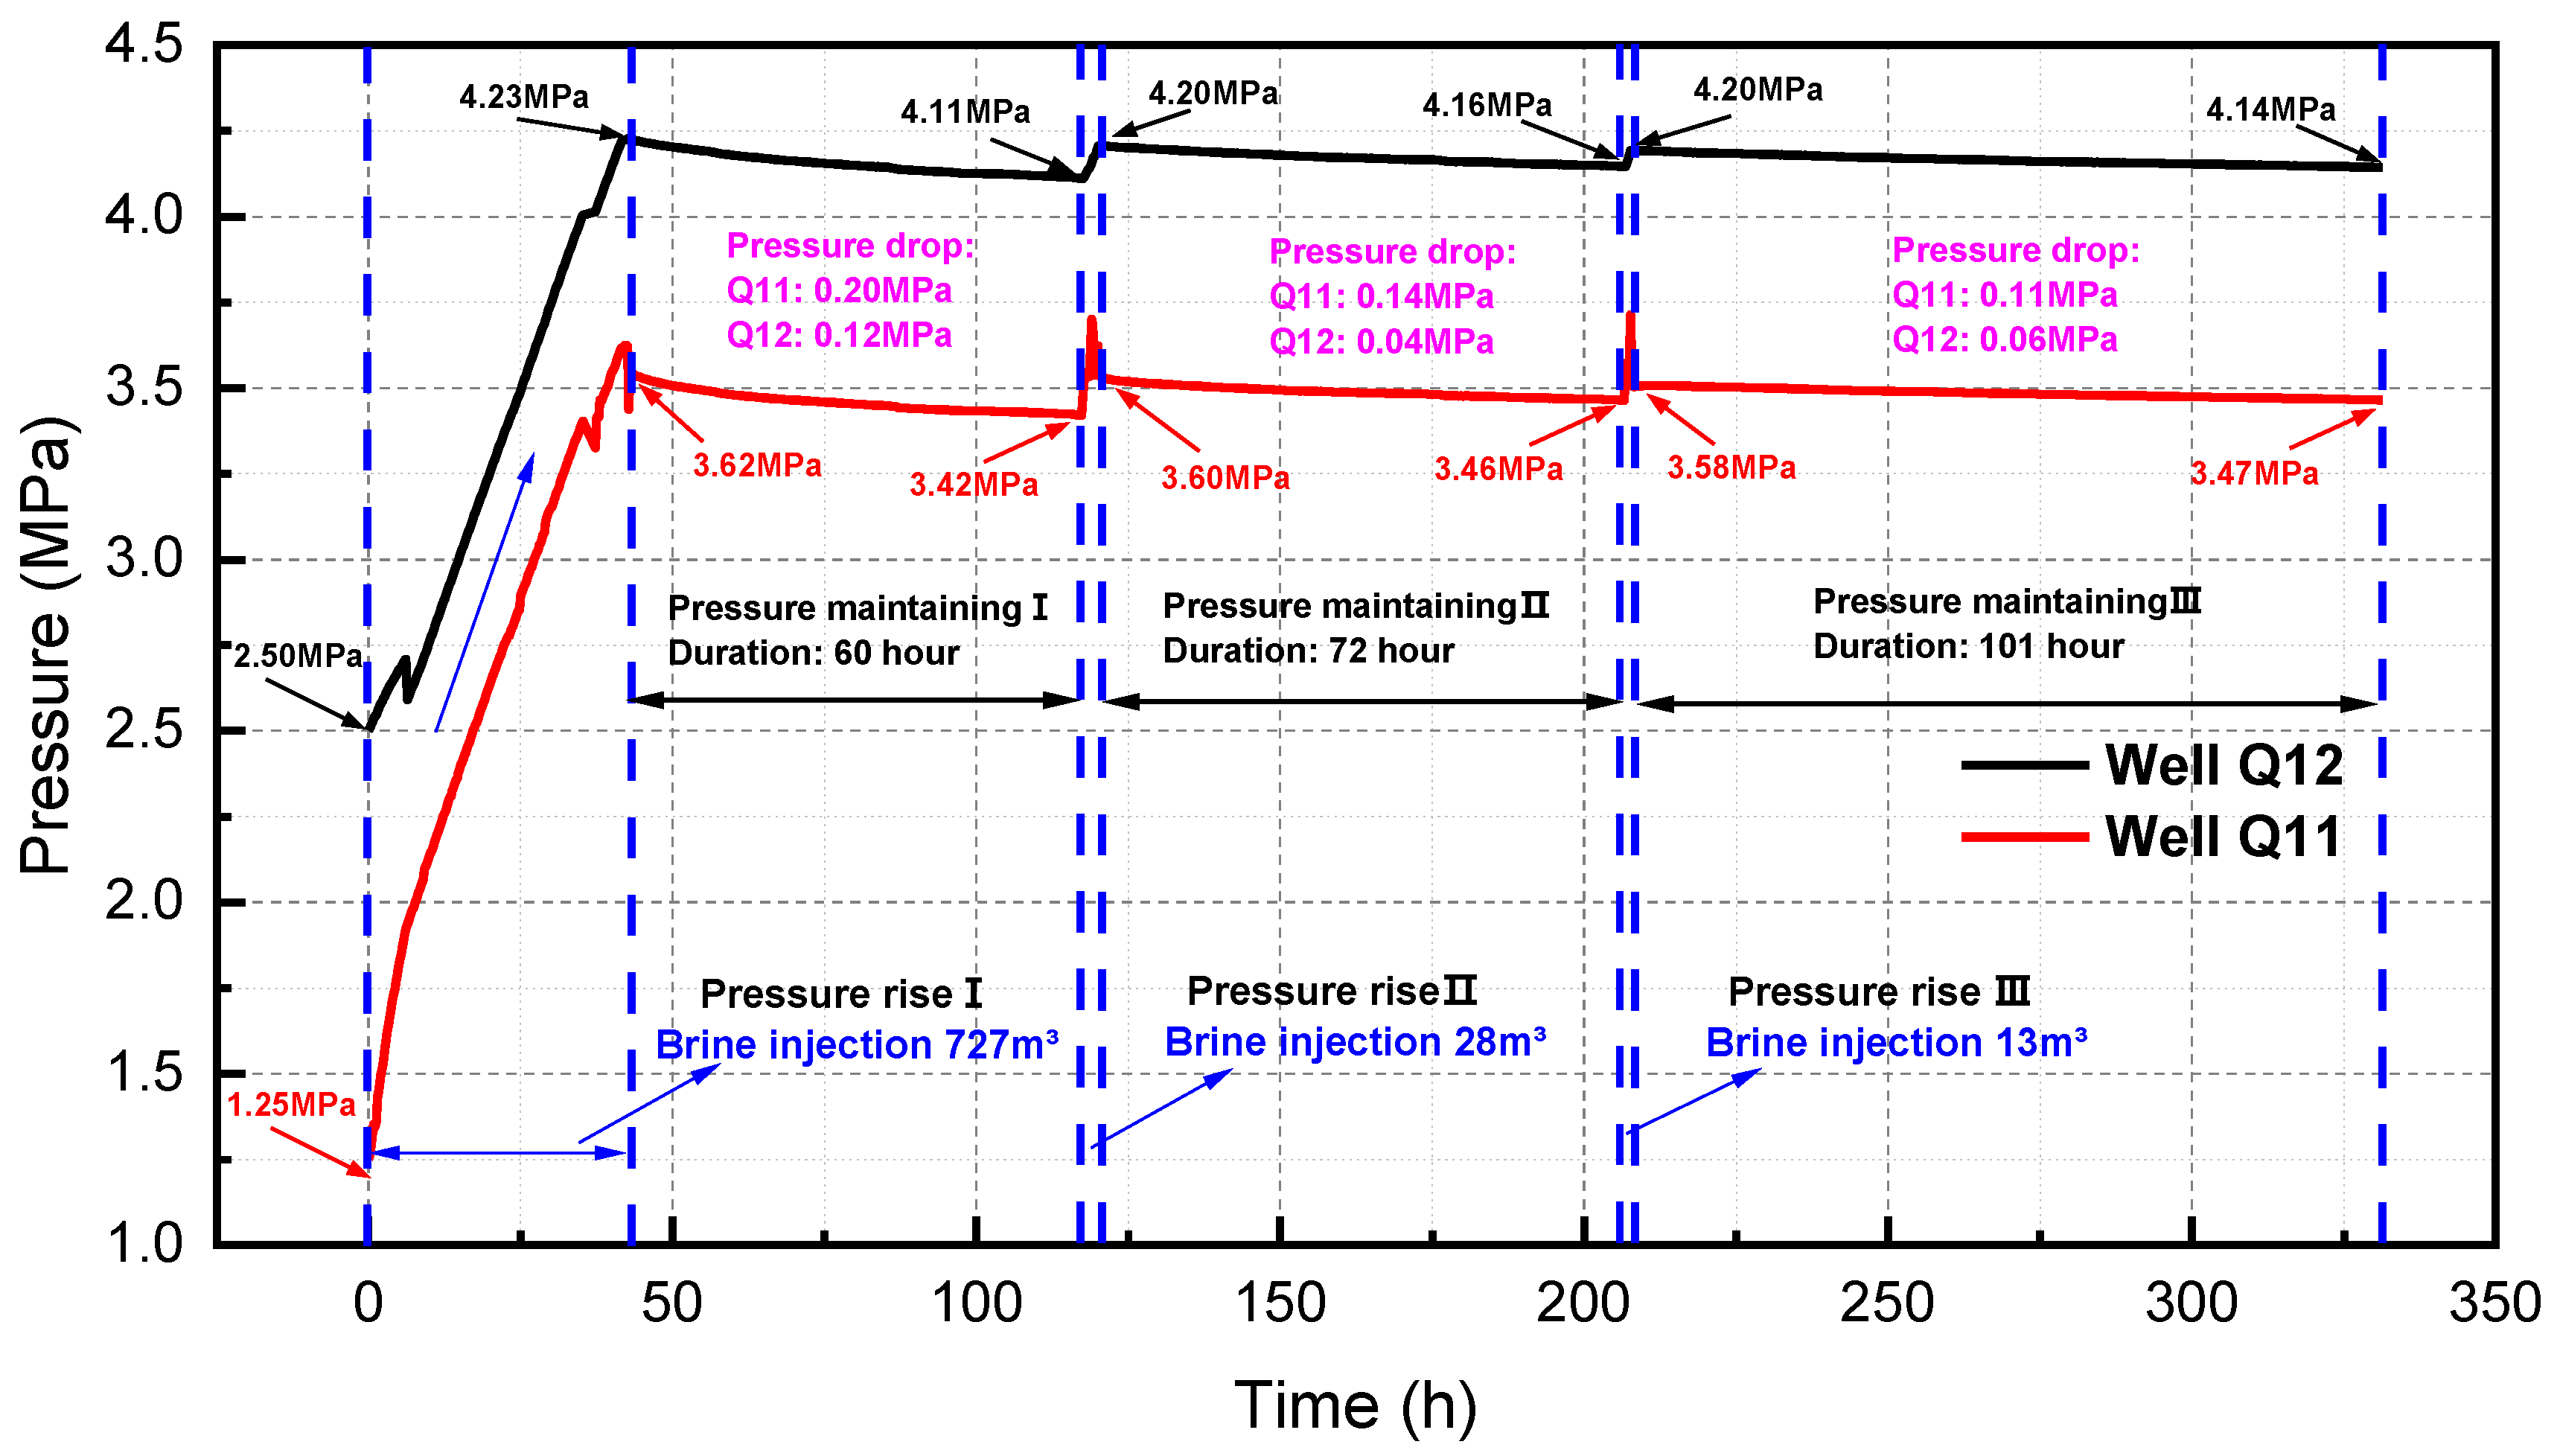
The tightness of the cavern needs to be combined with pressure changes and flow data to make a comprehensive judgment. As the cavern has different burial depth and volume, the pressure maintaining time and test pressure are very different. Therefore,
Figure 8 is only an example to show the trend of change. The general idea is to raise the cavern pressure to the target value and observe the pressure drop at the wellhead. Under normal conditions, the pressure drop is very small, causing a negligible amount of cavern deformation. The injected liquid is saturated brine, ignoring the influence of salt rock dissolution. We assume the wellhead pressure drop is only caused by cavern leakage, such as brine penetration. At this time, additional brine needs to be injected to supplement the cavern pressure, which we will call the cavern leakage volume. This is carried out as follows:
A. Saturated brine is injected into the cavern, the wellhead pressure is raised to the design value for the first time, and the brine injection volume and pressure changes are recorded during this period. The wellhead valve is closed to hold this pressure for 1–2 days, using pressure monitoring equipment to record pressure changes at any time. In general, the wellhead pressure will gradually decrease over time during this period, but the amplitude is very small.
B. Brine is injected again to bring the wellhead pressure to design value, the wellhead valve is closed and left for 1–2 days and the brine injection volume and pressure changes are recorded.
C. Step 2 is repeated several times to obtain multiple data groups: usually no less than three times.
D. The pressure variation curve and brine injection curve are plotted as shown in
Figure 8.
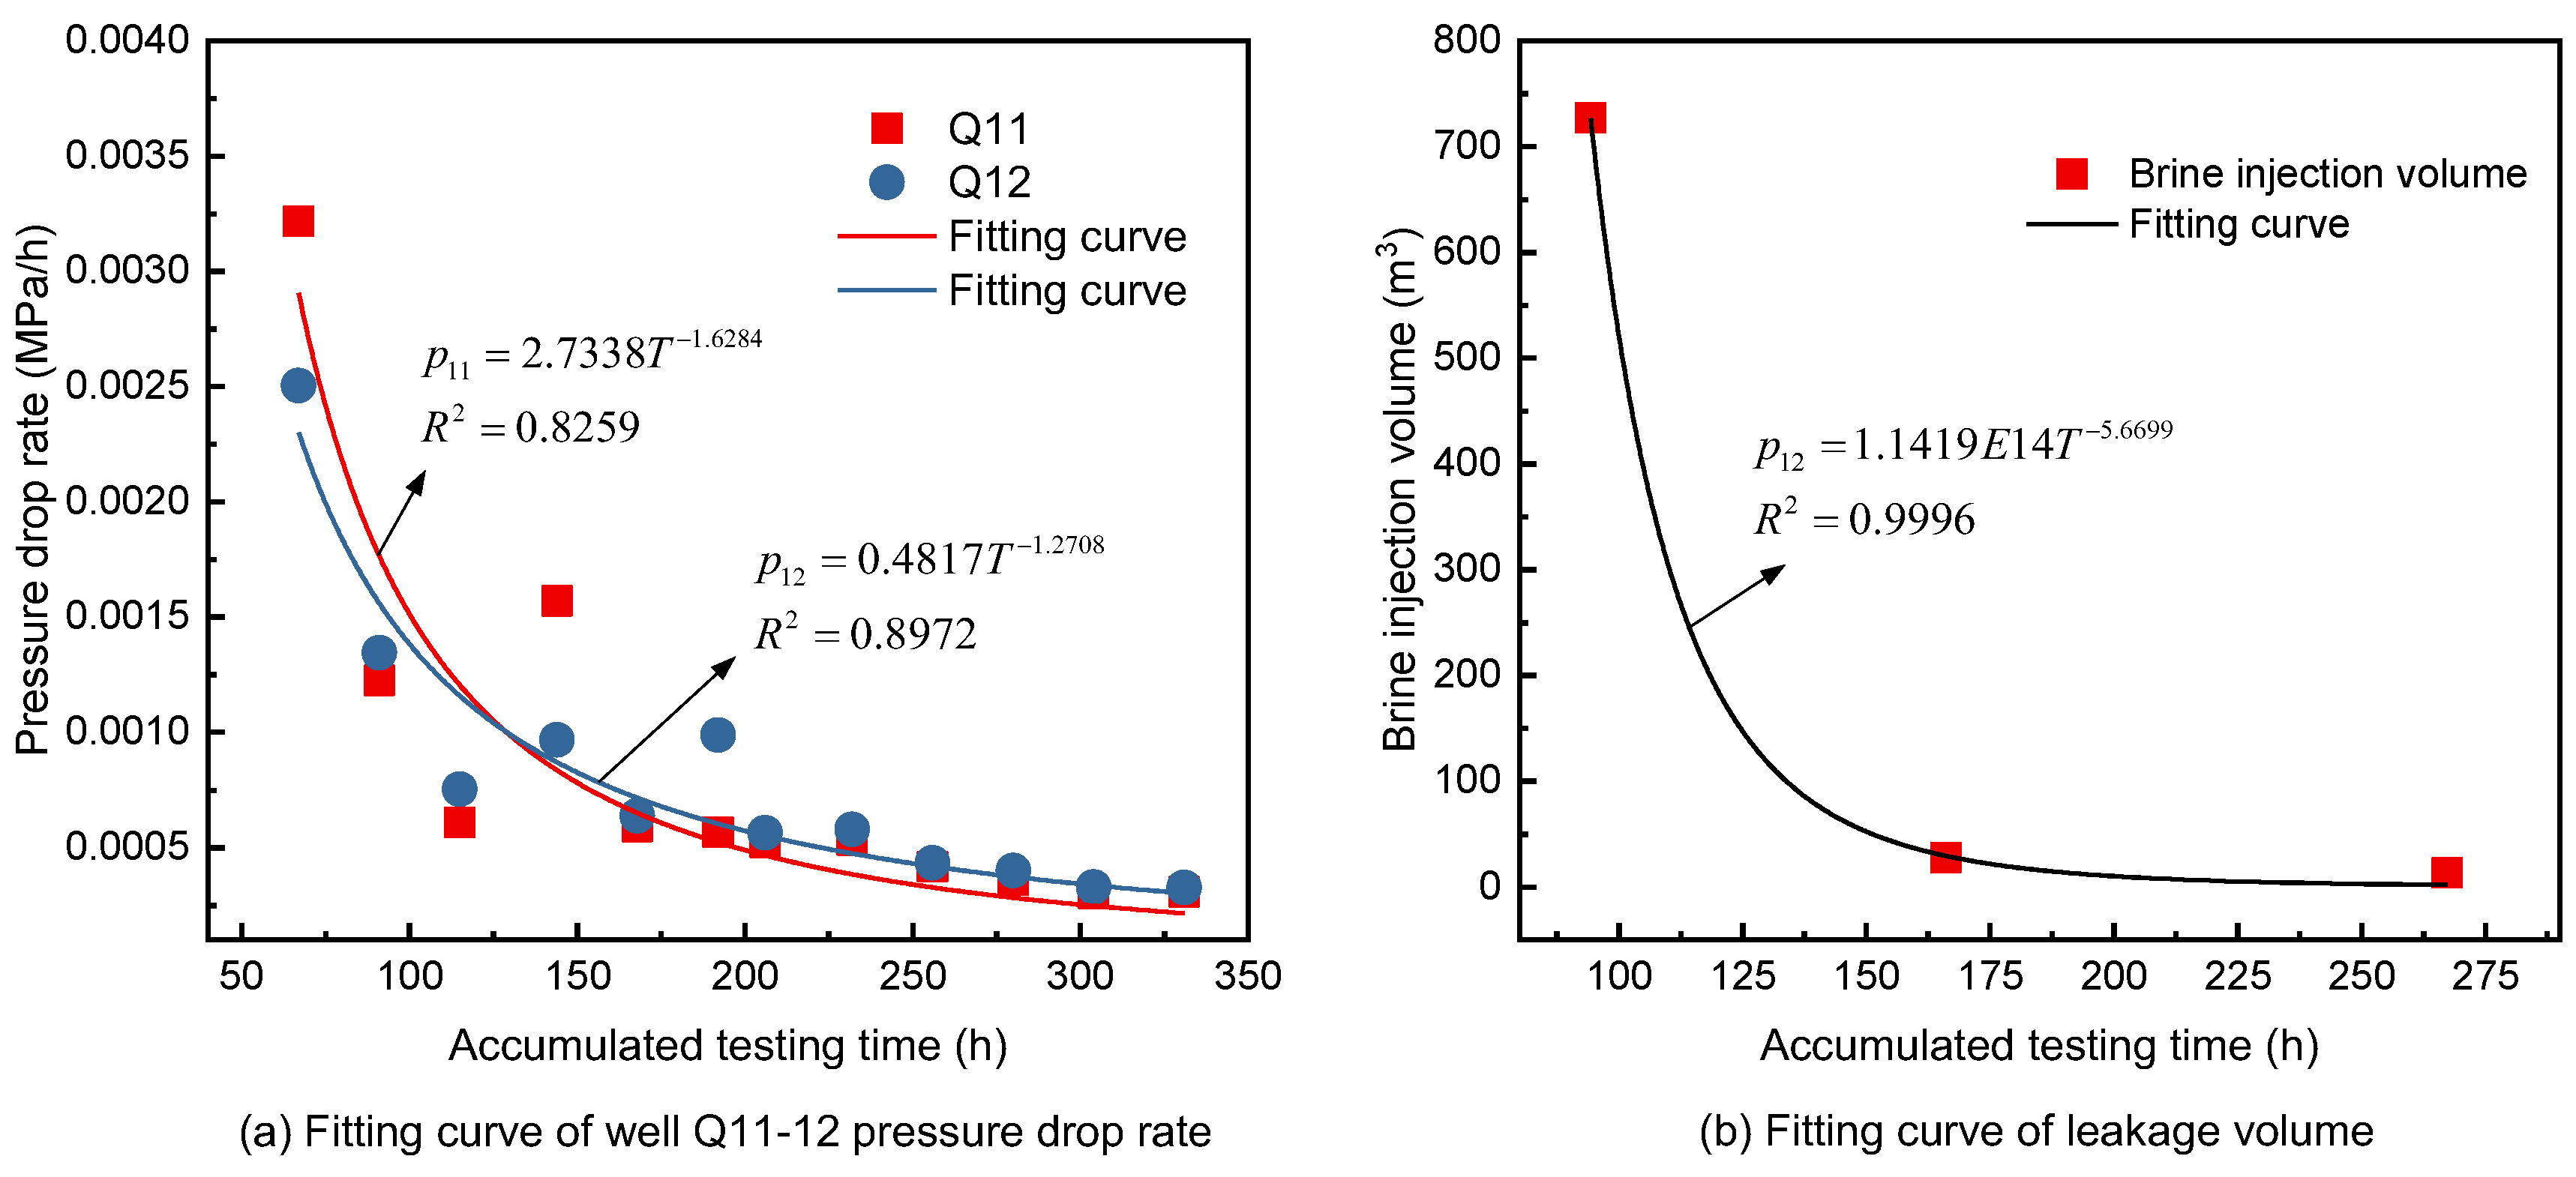
The plotted pressure and injection volume curve are observed to check whether the wellhead pressure drop gradually decreases and is lower than the acceptable value. Meanwhile, the daily water injection volume gradually becomes smaller with the increase in the number of tests, and finally reaches less than the change threshold value and remains stable. Then, we can determine whether the salt cavern’s tightness is qualified. The acceptable value of leakage volume is generally taken as one ten thousandth of the volume of the cavern, and the acceptable value of the pressure drop does not exceed 0.005 MPa/h [
44].
