Abstract
The podded propulsor has gradually become an important propulsion device for high technology ships in recent years because of its characteristics of high maneuverability, high efficiency, low noise, and vibration. The performance of podded propulsor is closely related to its flow field. To study the unsteady flow field characteristics of podded propulsor, the DDES (delayed detached eddy simulation) method was used to carry out high-precision transient numerical simulations. Results showed that the pod has a significant influence on the unsteady flow field. The rotor–stator interaction between the propeller and pod can be observed, leading to the periodic fluctuation of thrust on the propeller. On the surface of pod, pressure distribution changes with time, leading to the difference of local lateral force. In the spatial region affected by the propeller wake flow, pressure distribution presents a spiral characteristic, both in the region far away from the pod, and in the region of the wake flow of strut and fin. The vortex structures of podded propulsor are complex since the interference of the pod. In addition to the tip, root and hub vortex, strut and fin vortices also occur. The vortices generated by the effect of mutual inductance between vortices are also discussed.
1. Introduction
As a new type of ship propulsion system, the podded propulsor is focused in the field of ship propulsion in recent years. Its research of technology is closely related to the development of large high-speed ships [1]. Atlar [2] investigated several high-speed ships and summarized the design and application of podded propulsor in these ships, mainly focusing on the environmental protection and efficiency. The podded propulsor is designed as a blocked pod to hang under the ship, and the propeller motor is placed in the pod to drive the propeller directly, thus eliminating the shaft device of the traditional propeller. Based on this type of structure, the podded propulsor can provide thrust in any direction [3], hence eliminating the device of rudder or tail fin. High maneuverability and high efficiency will be generated by the podded propulsor with comparison with traditional propeller system. The podded propulsor is less affected by ship wake flow than traditional propeller system, thus it has a more uniform stern flow field, which can achieve higher efficiency.
In the early days, the potential flow theory, including panel and lifting surface methods, was widely used in the numerical study of propeller and podded propulsor. Kawakita et al. [4] analyzed the interference between the pod, strut and propeller by using surface panel method. It is found that the calculated pressure distribution and lift coefficient meet the experimental data pretty well, which proves that the panel method is a useful design tool for the podded propulsor. Kerwin and Lee [5] reported a vortex lattice method (VLM) for predicting steady and unsteady fluctuating distributions of forces acting on a propeller. Bal and Güner [6] improved the original numerical method developed before by coupling the boundary element method (BEM) and VLM for the prediction of the performance of podded propulsor with a specific emphasis on the interference amongst the propulsor components. It is concluded that velocities on the surface of the pod increase, which is caused by the strut, especially close to the strut surface.
With the development of computer computing power, the numerical simulation based on the computational fluid dynamics (CFD) has been used widely to study the hydrodynamic performances of propeller. The Reynolds Averaged Navier—Stokes (RANS) is the most widely used method, including the models of k-ε, k-ω and so on. Choi et al. [7] studied the scale effect on performance of a podded propulsor by using realizable k-ε model. Results show that the drag of pod is the key factor of the scale effects on the performance between model and full size podded propulsor. Shamsi and Ghassemi [8] investigated the hydrodynamic characteristics of podded propulsor at different yaw angles and operating conditions by using RNG k-ε model. Numerical results are compared with the experimental data, then the torque and thrust are presented as functions of advance coefficients and yaw angles. Taskar et al. [9] studied the effect of various factors such as wake variation and ship motion that influence a chemical tanker equipped with two podded propulsors by using SST k-ω model. Amini et al. [10] used SST k-ω model to obtain the hydrodynamic force and moment on the podded propulsor, then results are implemented in the blade element momentum theory (BEMT), which is compared with the results from BEM. Hu et al. [11] studied the hydrodynamic performance of a reverse podded propulsor under azimuthing conditions by using SST k-ω model.
However, by summarizing these studies using RANS method, it can be found that details of flow field such as the spatial distributions of pressure and vortex are not captured enough. The reason is that RANS method carries out an averaged treatment of the parameters in the flow field, which may conceal possible details. Based on this deficiency, a new simulation method is proposed, which is known as Large Eddy Simulation (LES). What’s more, a compromise approach, Detached Eddy Simulation (and its improved methods), is proposed, since that LES requires too much simulating time and computing resources. Dong and Yang [12] studied a podded propulsor by using DES method. The DES results are compared with those from RANS method using the same mesh. It is found that two methods can obtain similar hydrodynamic performances of the podded propulsor, but stronger vortex can be observed by DES method, especially at downstream of the strut and pod. Zhang et al. [13] studied on the interaction between the forward and aft propellers of a hybrid contra-rotating propeller (CRP) pod propulsion system by using Improved Delayed Detached Eddy Simulation (IDDES), focusing on the global quantities such as thrust and flow details such as vortex structure. As for LES method, at present, it is seldom seen to be applied in the study of podded propulsor, but something more in the study of single propeller system. Hu et al. [14] studied the tip vortex of a CRP by using LES method. The tip vortex and its formation and evolution are captured good enough. Posa et al. [15] studied a notional submarine propeller with an upstream hydrofoil by using LES method. The interactions between the hydrofoil and propeller are discussed.
Based on above analysis, it can be concluded that the potential flow theory and RANS method can obtain accurate hydrodynamic performance of the podded propeller, but the capture of details such as vortex structures is insufficient. LES and DES method can obtain more details of the flow field, but the former consumes more computing resources than the latter. Hence, in the present paper, Delayed Detached Eddy Simulation (DDES) method is used to obtain high precision numerical results while saving computing resources. Section 2 introduces the numerical implementation, including numerical method, mesh generation and other numerical setup. The verification and validation study are also carried out. Then in Section 3 and Section 4, results, discussions and conclusions are presented, mainly focusing on the unsteady exciting force, pressure distributions and vortex structures.
2. Numerical Implementation
2.1. Mathematical Theories
2.1.1. Governing Equations
The simulation is divided into two aspects to acquire high precision results. The first aspect is the steady simulation. During this simulation, the SST k-ω turbulent model is utilized, which includes all the refinements of the Standard k-ω and BSL k-ω models. In addition, it accounts for the transport of the turbulence shear stress in the definition of the turbulent viscosity [16]. These features make the SST k-ω model more accurate and reliable for wider classes of flows.
Results from the steady simulation are defined as the initial values for the second aspect, which is named the unsteady simulation. During the unsteady simulation, a more accurate turbulent model, Delayed Detached Eddy Simulation (DDES), is applied. This kind of method combines the advantages of RANS and LES methods. In detail, RANS method is applied in the region of the boundary layers, while LES method is used in the region away from the walls. In the present paper, during the simulation, SST k-ω model is selected when RANS method is activated. The governing equations of SST-DDES model are shown below:
where the blending function F1 is defined by:
All the variables mentioned in Equations (3)–(5) can refer to Menter et al. [17]. The shielding function defined as follow controls which method to be used:
where LRANS is the turbulent length scale, CDES is a calibration constant, and Δ is the maximum local grid spacing. FSST can be chosen from the blending functions of the SST model. FSST is called the delay factor, it converges to 1 in the boundary layers and will converge to 0 in the area away from the walls. As a result, FDDES is given different values when simulate different regions, thus control the usage of RANS or LES methods. Finally, the high precision results will be obtained with appropriate time consuming and computing resources.
2.1.2. Equations about Hydrodynamic Performance of the Podded Propulsor
The thrust T, torque Q of the propeller and lateral force Fy of the pod are nondimensionalized to obtain thrust and torque coefficients, KT, KQ, KFy:
where ρ, n, D correspond to water density (kg/m3), propeller rotating speed (r/s), and diameter (m), respectively.
Advance coefficient is J, defined by:
where v denotes the inflow velocity (m/s).
Pressure coefficient is defined by:
where P is the static pressure (Pa) obtained by the simulation.
As for the frequency-domain analysis, the rotating frequency fR and the blade passage frequency fBPF are defined by:
where k is the harmonic number and Z is the blade number.
When processing Fast Fourier Transform (FFT), the Hanning window function is applied to avoid spectrum leakage. In addition, amplitude correction function (ACF) is applied by using:
where wHann(N) is the Hanning window function and N is the length of data. By using these, not only the characteristic frequency can be captured clearly, but also the more realistic amplitude of data can be obtained.
2.2. Spatial Discretization
2.2.1. Test Cases
The model of the podded propulsor contains the pod, including the strut and the fin in the bottom, and the propeller. Table 1 presents the main design parameters of the podded propulsor model. Figure 1 shows the hydraulic dimensions of propeller.

Table 1.
Parameters of the podded propulsor.
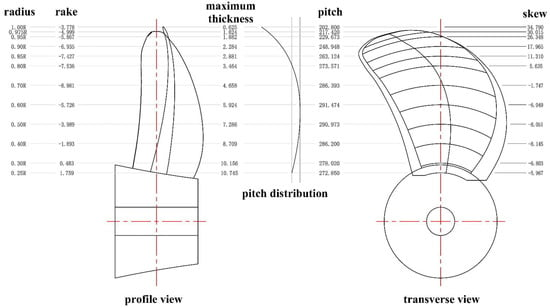
Figure 1.
Hydraulic dimensions of propeller.
To achieve the numerical simulation, it is necessary to construct computational domain, including static domain and rotating domain. These two domains are both cylinder with diameters 5D and 1.2D. The locations and types of the boundaries in the inlet, outlet and far-field are shown in Figure 2. It must be emphasized that the positive direction of Z axis is the direction of flow, while the negative direction of X axis is the direction towards the water surface. The coordinate origin is the center of the propeller disk. Besides, some numerical methods setups should be pointed out. The SIMPLE scheme is used to couple pressure-velocity. The turbulent kinetic energy and specific dissipation rate are calculated by second order upwind approach. The bounded central differencing approach is applied to the momentum discretization. Specially, the warped-face gradient correction is applied since the cases’ mesh are generated by Poly-Hexcore technique, which will be discussed below.
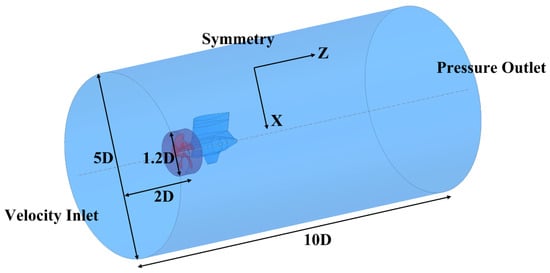
Figure 2.
Computational domain of the podded propulsor.
2.2.2. Mesh Generation and Verification
Considering the complex structure of the model, it is difficult to divide blocks for the structured mesh, hence an unstructured mesh is generated by using Poly-Hexcore technique [18]. The mesh generated by Poly-Hexcore technique have less number of grids and higher grid quality than other unstructured mesh such as tetrahedral mesh. Thus it use less internal memory and disk space when running numerical simulations. Besides, it can control the gradient of volume element more accurately, since it has more faces that can be interpolated than other unstructured mesh. Figure 3 shows the details about the mesh in the XZ plane. It can be seen that the polyhedral grids are in the region near the boundaries, while the hexagonal grids are set in the region away from the boundaries. In addition, fine transition layer grids in the transition area between the two types of grid regions are generated. In order to meet the simulation requirements of DDES method, the boundary layers are added on the walls of the propeller and pod. According to the results from the steady simulation under the design condition, the values of y plus are good enough for DDES method, especially in the region of the propeller, which is presented in Figure 4. Besides, to capture the vortex shedding of the podded propulsor, a refined grid region with the shape of annulated column is defined [19]. However, the size of the refined grids is not set too small because of the limitation of the computing resources.
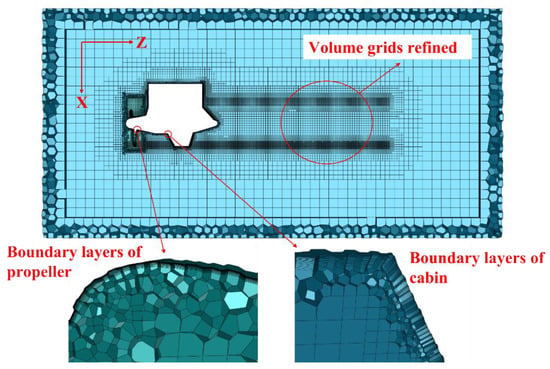
Figure 3.
Unstructured mesh for the simulation.
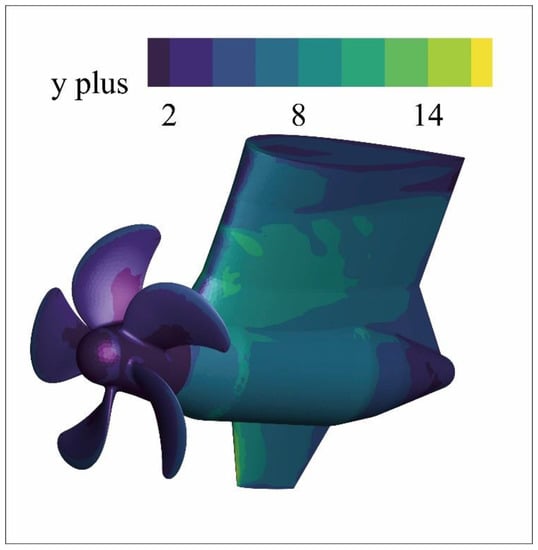
Figure 4.
Contour of y plus values on the walls.
For mesh independence verification, several sets of meshes are generated by controlling the size functions of the mesh. Figure 5 presents the results at J = 0.9, where the test value is KQ. It is found that the variation of KQ changes very small when the number of the meshes exceeds 7 million. In detail, a convergence study can be done [20]. The convergence ratio (CR) is defined as:
where S1, S2, S3 correspond to the results with fine, medium, coarse parameters, respectively. There are three possible convergence conditions:
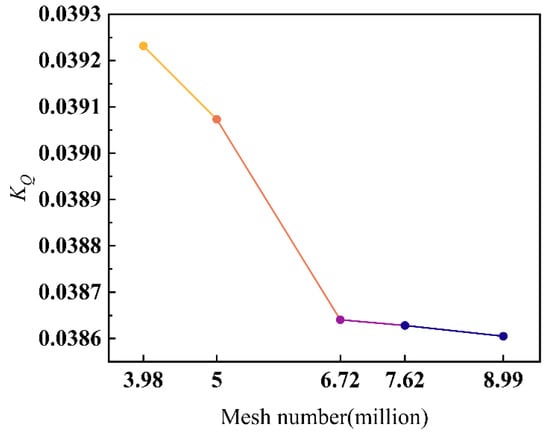
Figure 5.
Mesh independence verification.
For three sets of meshes arbitrarily, if condition (b) or (c) in Equation (13) is satisfied, then the fine mesh from three sets can be considered valid for the simulation.
Table 2 presents the results with KT and KQ at J = 0.9. Clearly, CR for KT is −0.2262, and CR for KQ is 0.0287. Both of two variables are convergent according to Equation (13). That is, the case of the mesh with 7.62 million grids meets the acquirements of the current numerical simulations.

Table 2.
Convergence study.
After the unsteady simulation under the design condition, the Courant number (CFL) can be obtained. Figure 6 demonstrates the CFL in the XZ plane. It is obvious that the CFL is less than 1 within most regions, except the area near the blade tips. CFL illustrates the ratio of the fluid movement distance in a time step to the unit length of a grid. The grids near the blade tips are smaller than others, and the speed in the blade tips is faster than the hub, so that the CFL near the above regions is larger than it in other area. If CFL are controlled to be less than 1 in every region, which is the best condition, it will lead to the smaller time step size or the larger grid size. It is not what is expected, since that the former will lead to an increase in simulation time, and the latter may result in the loss of geometric features of the model. As for the present simulation, current results are good enough to analyze.
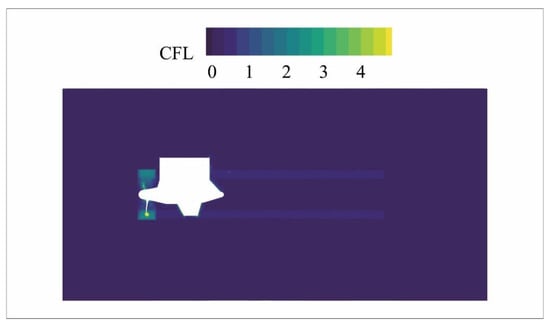
Figure 6.
Contour of CFL in XZ plane.
In summary, an unstructured mesh of the podded propulsor model is generated by using Poly-Hexcore technique. Finally, the scheme of 7.62 million mesh is selected. Furthermore, the quality of the mesh has been proved to be good enough for the current research.
2.3. Temporal Discretization
In order to obtain more accurate time domain data of the pressure pulsation, it is necessary to consider selecting the appropriate time resolution, which is known as the time step size in numerical simulation. Sezen and Kinaci [21] reported a method about how to choose the time step size. Under normal circumstances, a pressure-time curve that obtained in a certain point from the flow field usually looks like a sine curve. Figure 7 shows that how many points should be used to represent a sine curve. It is obvious that the features can be captured by 9 points at least. The more points, the more accurate the curve, the higher frequency obtained. However, fitting curve with less than 9 points may generate straight lines.
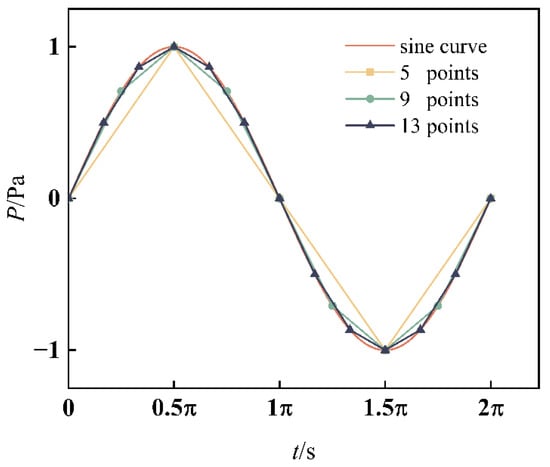
Figure 7.
A typical pressure curve.
Therefore, it can be stated that the time step size Δt should be:
where kn denotes the number of the points chosen to represent the curve. On the other hand, for the analysis of frequency, FFT often be used to convert data from time domain to frequency domain. During the procedure of FFT, the length of data should be exponent of 2 preferably. If not, the FFT code will extrapolate data length to compensate the results, which may result in unreal magnitude. Hence, for a simulation with 1 s, the time step size should be:
where m must be an integer. Solve the Equations (15) and (16) simultaneously and represent m:
Choose kn = 13, k = 2, and substitute them into Equation (15) together with other constants needed in Equation (15). Thus, m can be selected to 12.
As a result, in the present study, the time step size is selected to be Δt = 1/4096 s. Converting time concept to a spatial concept, the time step size selected here means the propeller rotates 2.124 degrees in every unsteady simulation step.
2.4. Validation Study
Since the experiments on the current test cases have not been carried out, the experimental data with standard propeller DTMB 4119 [22] is used to compare the current simulation results. All the numerical setups are the same with the case of the podded propulsor. Current numerical and experimental open water propeller performances are given in Figure 8. Table 3 shows the specific values of both numerical and experimental data and their relative errors.
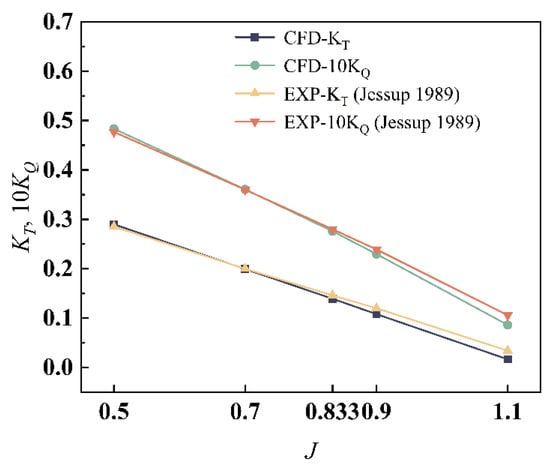
Figure 8.
Open water performances of DTMB 4119 propeller [22].

Table 3.
Relative errors of KT and 10KQ.
As shown in Figure 8 and Table 3, under the conditions at low advance coefficient, the values of current simulations are in good agreement with the experimental values. However, with the increase of advance coefficient, the relative error increases. The reason may be that under the high advance coefficient conditions, the thrust and torque decrease sharply, the real values may be covered by the error of the numerical simulation. Most researches [21,23,24] that carry out validation study by using DTMB 4119 propeller have the similar numerical results with current simulation.
3. Results and Discussions
3.1. Unsteady Exciting Force
In the present paper, three conditions of J = 0.6, 0.8217 (design condition), 1.0 are considered and simulated. Figure 9 shows the time histories of unsteady KT and KQ under J = 0.8217.
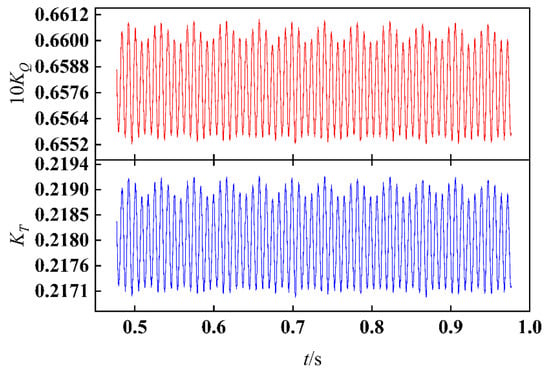
Figure 9.
Time histories of unsteady thrust and torque coefficients under J = 0.8217.
It can be seen that similar to traditional propeller system, the unsteady thrust and torque also fluctuate close to a certain value slightly. However, the situation becomes more complicated because of the pod, which is downstream of the propeller and will interferes with the propeller. Figure 10 shows the distributions of pressure coefficient on the pressure side under J = 0.8217 with time step t0, t0 + 5Δt, t0 + 10Δt, and t0 + 15Δt.
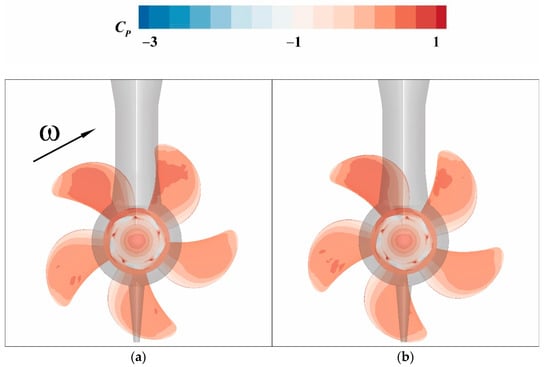
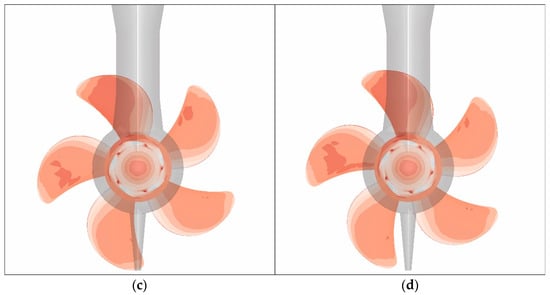
Figure 10.
Cp distributions on the pressure side under J = 0.8217: (a) t0; (b) t0 + 5Δt; (c) t0 + 10Δt; (d) t0 + 15Δt.
The rotation of the propeller is right hand. It is evident that compared to the blades which are far away from the strut, the blades near the strut have a higher region of the pressure. With the rotation of the propeller, the high-pressure region on the blade that gradually away from the strut disappears slowly. However, a new high-pressure region slowly appears on the blade, which is gradually approaching the strut. Moreover, the largest region of high pressure is on the blade that is sweeping the strut. The wake flow field of the propeller is inhomogeneous and periodic. When the water flows impact the strut periodically, the strut will be subjected to periodic exciting force. Due to the interaction of forces, the propeller will also get exciting force. Consequently, the pressure side on the blade that is sweeping the strut will generate a high-pressure region. This phenomenon is called rotor–stator interaction. The smaller distance between the rotor and the stator, the stronger effect of rotor–stator interaction will be generated.
It can also be observed that when the blades sweep the fin in the bottom, there seems no special region of high pressure appears on the pressure side of the blade. The reason is that the distance between the propeller and fin in the bottom is larger than it between the propeller and the strut, therefore the effect of rotor–stator interaction has been decreased significantly. Owing to rotor–stator interaction, the podded propulsor will obtain higher thrust than traditional propeller system. Besides, compared to the normal propeller which often been mounted behind the ship directly, the installation position of the podded propulsor is far away from the wake flow field of the ship, which will lead to a more uniform inflow condition. Combined with the characteristic of high thrust, the efficiency of the podded propulsor will be higher than other traditional propellers.
Figure 11 shows the frequency domain result of the thrust coefficient under J = 0.6, 0.8217, 1.0. It is obvious that the discrete frequency is fBPF. According to the normal law of the open water performance of the propeller, it is definite that the thrust provided by the propeller will decrease with the increase of the advance coefficient. However, in the frequency domain, the energy contribution of the thrust is variant under different conditions, as is shown in Figure 11. Under three conditions, although the main frequencies are all blade passage frequencies, the amplitudes are different; there is the maximum amplitude of the thrust in the blade passage frequency under J = 1.0, followed by 0.8 and 0.6. Obviously, the energy is more centralized under a higher-advance coefficient, while some energy is dispersed elsewhere under low-advance coefficient. More specifically, it is in the lower-frequency band with a characteristic frequency 0.6 fR approximately, which is marked by red circle box in Figure 11. This means that there are low-frequency interference signals in the flow field at low advance coefficient, which may be induced by the periodic shedding vortex generated by the complex flow field under low conditions. Under higher conditions which are closer to the design condition, the flow field will be more uniform, thus the low-frequency signals may be covered by the main frequency.
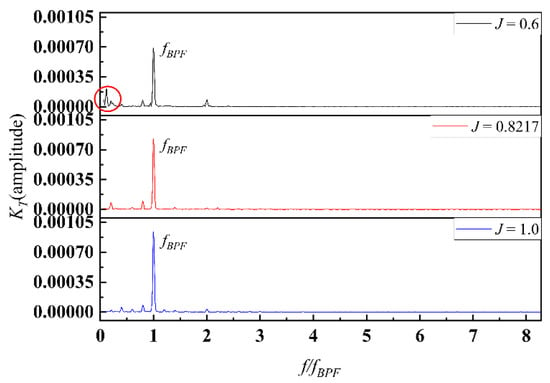
Figure 11.
Frequency domain of KT under different conditions.
The time history and frequency domain result of the lateral force of the pod is shown in Figure 12. Similar to the thrust of the propeller, the lateral force of the pod is also vibrating. Meanwhile, all the values have the same sign, which means that the pod is always pushed to one side.
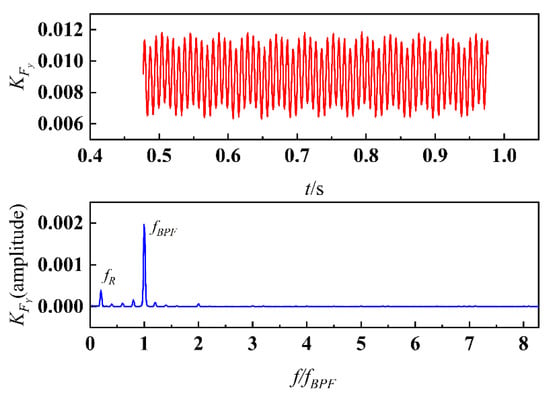
Figure 12.
Time history and frequency domain of KFy.
Figure 13 shows the constrained streamlines and the distribution of pressure coefficients on X = ±0.35D planes under J = 0.8217 at time step t0 and t0 + 15Δt. The view is from the top of the pod to the bottom. It is obvious that although the strut and fin at the bottom are designed by some symmetrical airfoils, the pressure distribution is asymmetric. This is evidently attributed to the nonuniform outflow by the propeller. On the X = ±0.35D planes, the local flow field around the strut and the fin is obviously affected by the lateral outflow, which is induced by the motion of the propeller. The leading edge of the strut being impacted by the water flow will firstly generate a high-pressure region, while the other side will generate a low-pressure regio, because of the faster velocity induced by the larger distance at the same time. This apparent misalignment presents in both the strut and the fin simultaneously.
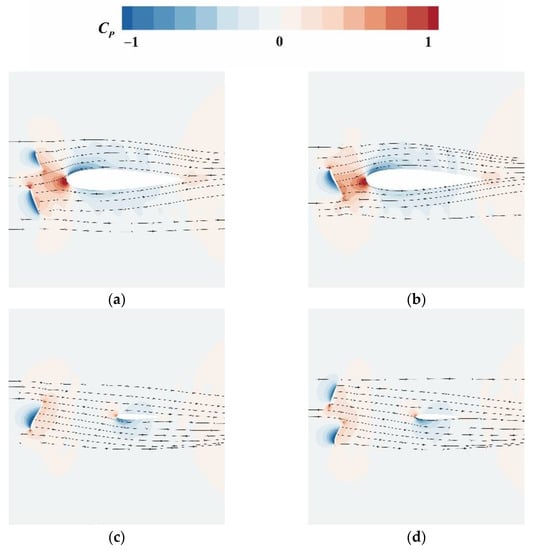
Figure 13.
Constrained streamlines and Cp distributions of under J = 0.8217: (a) X = −0.35D, t0; (b) X = −0.35D, t0 + 15Δt; (c) X = 0.35D, t0; and (d) X = 0.35D, t0 + 15Δt.
What is more, the directivity of the pressure difference is complicated, the details about the pressure coefficient distributions on the airfoil section lines of the strut and the fin (shown in Figure 13b,d) are shown in Figure 14. It should be noted that the view observed from the pod is from back to front, thus the side names are defined correspondingly. It is significant that the direction of the local lateral forces suffered by the strut and the fin are inconsistent. Both point to one side firstly, and then point to another side. The turning points in the section lines of the strut and fin are located at 0.37 and 0.7 times the chord length, respectively. In addition, the pressure coefficient fluctuates at the back of the strut, while it does not fluctuate at the same location of the fin. The reason may be that the strut receives the impact of the propeller wake flow earlier than the fin, and the flow filed has a higher pulsation level.
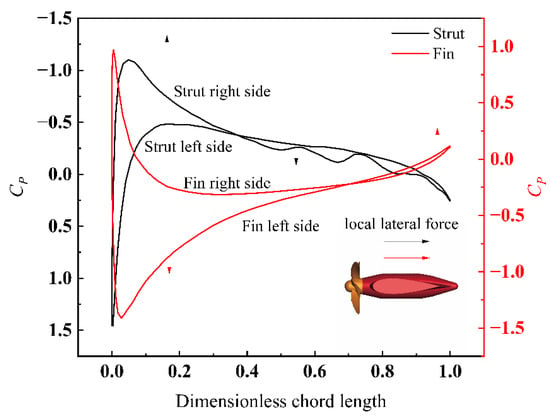
Figure 14.
Cp distributions on airfoil section lines of the strut and fin on X = ±0.35D planes under J = 0.8217 at time step t0 + 15Δt.
As a comparison, the pressure coefficient distributions on the same location in Figure 14 at another time step t0 are plotted, as shown in Figure 15. In the aspect of the strut, both of the two time steps have similar distribution and turning points. However, the pressure fluctuation is different in the region marked by the blue circle box, where alternating phenomena presents. In other words, with the motion of the propeller, pressure changes periodically in the region mentioned above may lead to vortex shedding. As for the fin, there seems no obvious difference between the two time steps, which is to say that the influence of the wake flow field of the propeller on the flow around the fin is not very obvious. At another location, where on X = ±0.45D planes, with the time steps mentioned above, the phenomenon of pressure fluctuation becomes more violent, as shown in Figure 16. The pressure on the pod not only fluctuates at different time steps, but also on the left and right sides at the same time step. As for the fin, there are also pressure fluctuations at different time steps, and the location of the turning points are different, which is almost at the same location in X = ±0.35D planes. Although the distributions of local pressure in the strut and the fin are complex, the overall lateral force points to the right side of the pod, which is identified in Figure 12. Since the lateral force is obtained by integrating the local pressure with the area, and the area of the strut is much larger than the fin. In addition, the lateral force of the pod has the same discrete frequencies with the propeller, which is the result of the pod acting on the propeller wake flow field.
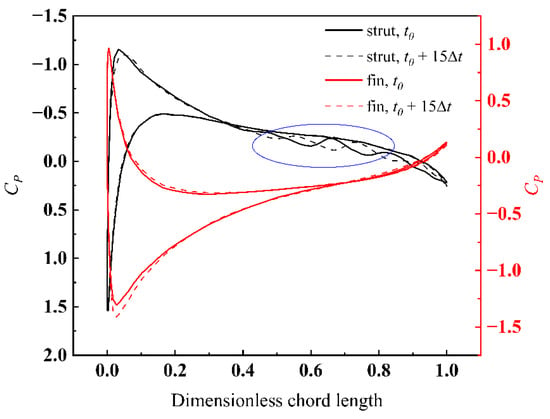
Figure 15.
Comparison of Cp distributions between time step t0 + 15Δt and t0 on airfoil section lines of the strut and fin on X = ±0.35D planes under J = 0.8217.
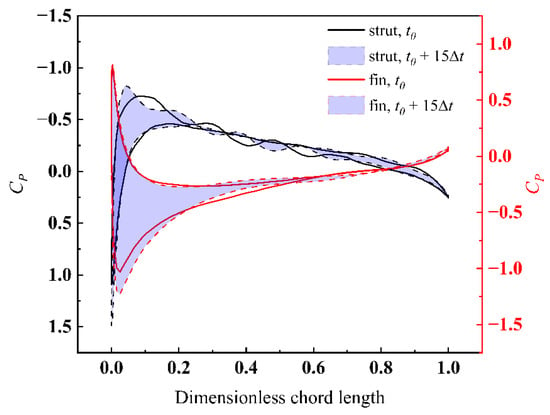
Figure 16.
Comparison of Cp distributions between time step t0 + 15Δt and t0 on airfoil section lines of the strut and fin on X = ±0.45D planes under J = 0.8217.
3.2. Characteristics of Pressure Pulsation
In order to investigate the characteristics of the podded propulsor, some monitors of the pressure pulsation have been set, as is shown in Figure 17.
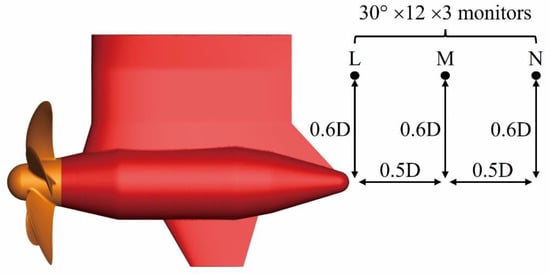
Figure 17.
Locations of pressure monitors.
To investigate the pressure coefficient distributions in the outside and rear of the propeller, some cylindrical surfaces are defined with different diameters 0.7D, 0.9D, 1.2D, 1.5D. As shown in Figure 18, for a clearer display, the cylindrical surfaces are extended by the phase angle θ, which begins at positive direction of X, then towards to the positive direction of Y. It should also be pointed out that all the surfaces do not intersect with the propeller region, which is why there are some blank regions on surfaces with diameters of 0.7D and 0.9D. Compared with Figure 13, it can be seen that the region with a phase angle between 180° and 360° is on the left side of the pod, since there are high pressure regions on the certain side of the strut and the fin, as shown in Figure 18a,e,i. In three different conditions, the pressure coefficient distributions are similar. The pressure pulsation is developed rotationally during the evolution from the region behind the strut towards the left side of the pod, while it is behind the fin towards to the right side of the pod. However, the levels of the pressure coefficient are obviously different. Under the condition J = 0.6, the levels are the highest, followed by 0.8217 and 1.0. Figure 19 shows a diagram of a velocity triangle to present the relationship between the advance coefficient and attack angle of propeller airfoil. Under the low-advance coefficient condition, the inflow velocity is lower, and the circumferential velocity is constant on a certain radius, thus the tangent angle between the above two velocities is smaller. Then, the pitch angle is also a certain constant, which means the attack angle, calculated by the pitch angle minus the tangent angle (ignore the influence of induced velocity), is larger than the high advance coefficient condition. According to the theory of airfoils, pressure coefficients increase gradually within a certain range of positive attack angle. Thus, the levels of the pressure field with low-advance coefficients are higher than when under a high advance coefficient.
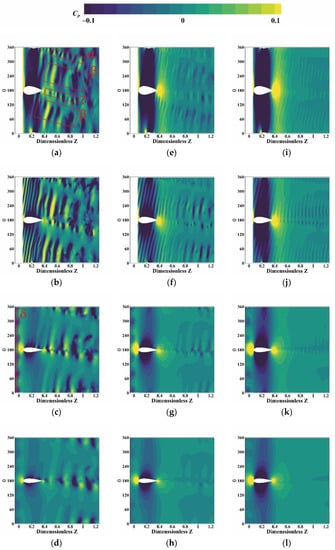
Figure 18.
Cp distributions on cylindrical extended surfaces with different diameters: (a) J = 0.6, 0.7D; (b) J = 0.6, 0.9D; (c) J = 0.6, 1.2D; (d) J = 0.6, 1.5D; (e) J = 0.8217, 0.7D; (f) J = 0.8217, 0.9D; (g) J = 0.8217, 1.2D; (h) J = 0.8217, 1.5D; (i) J = 1.0, 0.7D; (j) J = 1.0, 0.9D; (k) J = 1.0, 1.2D; and (l) J = 1.0, 1.5D.
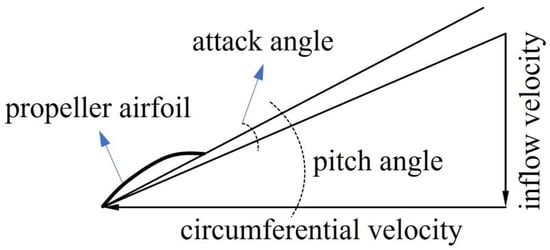
Figure 19.
Diagram of velocity triangle.
As shown in Figure 18a,c, some typical pressure coefficient distribution regions have been named and marked by red rectangular boxes. Other locations and conditions have similar typical regions, but they are not marked in Figure 18. The region β, which is distributed on both sides of the pod, is induced by the propeller wake flow directly. The region α and γ are behind the strut and the fin, respectively, they are wake flow fields of the strut and the fin. However, these two regions are not similar to normal flow around airfoil, they are not symmetric. The characteristics of the region α and γ are closer to the region β. Obviously, on the surface with diameter 0.7D, due to the influence of the propeller wake flow, which is rotational and pulsating, the characteristics of wake flow fields of the strut and the fin have changed, and the structures of distribution tend to be similar to the propeller wake flow field. With the increase of the surface diameter, the pressure pulsation becomes more violent, as shown in Figure 18b. The pressure coefficient distribution on this surface is caused by the wake flow generated by the tip of the propeller. According to Figure 10, it can be seen that the pressure gradient at the tip of the propeller is very evident, which will lead to the higher velocity pulsation, thus the flow from here to the back will have a higher pulsation level. On the surface with diameter 1.2D, the typical distributions are changed. The part beyond the surfaces with diameter 0.7D and 0.9D is the outside of the propeller, where the region δ is located. This periodic phenomenon of alternating positive and negative pressures is caused by the water sucking and drainage of the propeller. In addition, regions α, β, and γ are no longer similar to the regions on the surface with diameters of 0.7D and 0.9D, and become more symmetric, which are close to the characteristics of the symmetric airfoil around flow. On the surface with the largest diameter 1.5D, the distributions are similar to the surface with a diameter of 1.2D, but the levels of pressure coefficients are decreased. According to the analysis above, it can be found that the propeller wake flow has a great impact on the flow field near the pod. However, such an influence is limited and bounded. As shown in Figure 18, the influence mainly exists in the regions within the propeller diameter. In other regions, the flow field presents similar characteristics to normal flow around the airfoil.
To obtain the attenuation law of pressure pulsation behind the podded propulsor, the rotating frequency and blade passage frequency data under J = 0.8217 at monitors (see Figure 17) L1~12, M1~12, N1~12, are extracted, as shown in Figure 20. It can be seen that the amplitudes of the pressure coefficients are extremely outstanding at the direction of 0° and 180°, where the places behind the fin and the strut are, respectively. Furthermore, the amplitudes at the direction of the strut are larger than the fin, which means that the influence of the strut to the flow field is greater than the fin. The amplitudes of pressure coefficients at other directions are comparatively close. This means that the pod has a significant impact on the propeller wake flow field, which is reflected in the pressure distributions. In addition, the energy contributions in the rotating frequency and blade passage frequency are different at various locations. With the increase of the distance between the monitors and the pod, the energy proportion in the rotating frequency gradually increases, while the blade passage frequency gradually decreases. The overall pressure energy at these monitors must be decreased, it means that the energy in the blade passage frequency decays faster than the energy in the rotating frequency.
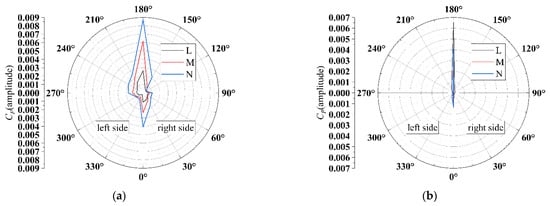
Figure 20.
CP amplitude distributions under J = 0.8217 at monitors L1~12, M1~12, N1~12: (a) rotating frequency; and (b) blade passage frequency.
3.3. Vortex Structure and Evolution
To investigate the structure of the vortex that is generated from the flow field of the podded propulsor, a method named Q criterion is utilized to calculate the vortex core regions and present them as iso-surfaces. Q criterion can be described as [25]:
where Ω is the rotation rate tensor and S is the strain rate tensor. ||·||F means the Frobenius norm, which is the square root of the sum of the squares of all tensor elements. If Qc > 0, the rotating force will be the predominant role and the vortex will be generated in the flow field. What is more, the contours on the iso-surfaces are obtained by the z-vorticity, which is defined as [26,27]:
where vx and vy are the velocity components. The reason why vorticity at the direction of Z is used is that the flow direction is Z, hence z-vorticity is the best value which can reflect the characteristics of the vortex. The positive and negative values of z-vorticity indicate a different swirl direction. In addition, the vorticity magnitude ω is used to present the shape of the vortex, which is defined as:
where ωX and ωY have similar definitions as ωZ.
Figure 21 shows the vortex structures of the podded propulsor, which are visualized by iso-surfaces with Qc = 500 1/s2 and colored by z-vorticity with value range −100 1/s to 100 1/s. Overall, the vortex structures under three different advance coefficients are similar, but it is stronger under J = 0.6 which can be sure according to the larger area of high vorticity region shown in Figure 22. As is discussed in Section 3.2, with the lower advance coefficient, the larger attack angle will be induced, and the phenomenon of flow separation will be more obvious, thus the vortex will be stronger.
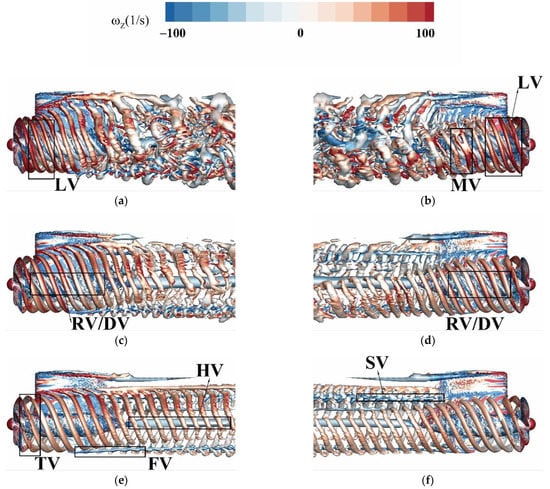
Figure 21.
Vortex structures, with Qc = 500 1/s2, colored by z-vorticity: (a) J = 0.6, left side; (b) J = 0.6, right side; (c) J = 0.8217, left side; (d) J = 0.8217, right side; (e) J = 1.0, left side; and (f) J = 1.0, right side.
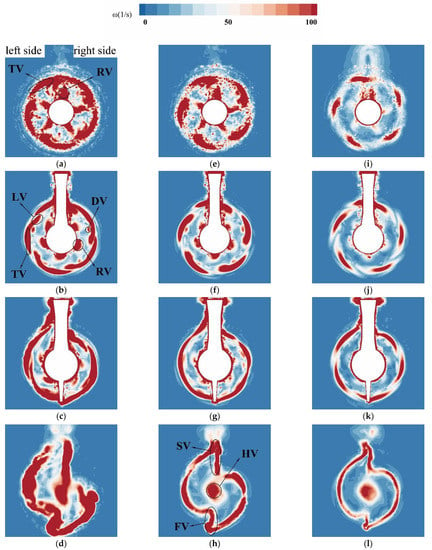
Figure 22.
Distributions on different Z planes: (a) J = 0.6, Z = 0.2D; (b) J = 0.6, Z = 0.35D; (c) J = 0.6, Z = 1D; (d) J = 0.6, Z = 2D; (e) J = 0.8217, Z = 0.2D; (f) J = 0.8217, Z = 0.35D; (g) J = 0.8217, Z = 1D; (h) J = 0.8217, Z = 2D; (i) J = 1.0, Z = 0.2D; (j) J = 1.0, Z = 0.35D; (k) J = 1.0, Z = 1D; and (l) J = 1.0, Z = 2D.
Unlike a traditional single propeller system, the vortex of the podded propulsor has more characteristics. Some typical vortex structures have been marked by black rectangular boxes, as shown in Figure 21. The tip vortex (TV) is the first typical structure that occurs in the flow field, the root vortex (RV) also appears at the same time. Both are induced by the differential pressure between the pressure side and the suction side. According to the scale calculation in Figure 21c, the distance between two vortex circles correspond to the pitches at 0.9R and 0.5R, respectively, which are consistent with their generating positions on the blades. The tip vortex can be observed under all the three conditions, but a sspecial type of structure that occurs under J = 0.6, is called the leapfrogging vortex (LV), shown in Figure 21a,b and Figure 22b. This kind of vortex has been discussed extensively in wind turbines [28]. Felli et al. [29] also found it in underwater propellers in their experiments. When the adjacent tip vortices pass within a distance, the mutual inductance effect appears, so that they will experience the influence of each other. This effect causes the adjacent tip vortices to roll up around each other, which lead to the leapfrogging phenomenon. With the advance coefficient decreases, the leapfrogging vortex occurs earlier. It is only observed in Figure 21a,b and Figure 22b, and close to the propeller. The influence of the pod on the propeller wake flow is not violent in this region, hence the leapfrogging vortex under low advance coefficient will appear. However, with the evolution of the propeller wake flow, the influence of the pod increases, which leads to more complicated vortex structures and cannot find leapfrogging vortex anymore. As shown in Figure 22, only on Z = 0.35D plane under J = 0.6 can it be observed, because the leapfrogging vortex has an obvious pitch that is different to the pitch of the tip vortex.
As for the root vortex, under J = 0.6 and 0.8217, it is wound around the pod, and develops towards the back with a spiral shape. However, it will not develop to the rear of the pod and dissipate quickly due to the effect of the viscous force. As shown in Figure 22, the root vortex can be found on Z = 0.2D to 1D planes under J = 0.6 and 0.8217. However, under J = 1.0, the root vortex can hardly be observed under iso-surface with Qc = 500 1/s2, as shown in Figure 21e and Figure 22i, which means that the root vortex here is much weaker than the tip vortex.
With the evolution of the tip vortex, it impacts the leading edge of the strut, and be separated to left part and right part. Besides, it can also be observed that there are some cracked and detached vortex (DV), as is shown in Figure 21c,d and Figure 22b. They are not connected to the tip vortex, and also has a certain pitch, but it does not match to any section pitch of the propeller blade, which can be observed in Figure 22b clearly. It may be induced by the energy separation because of the impact.
With the evolution continuing, the tip vortex flows around and through the pod and the fin early or late, which lead to the appearance of the strut vortex (SV) and the fin vortex (FV). Figure 23 shows the distributions of z-vorticity on different planes. During this evolution process, part of the energy of the tip vortex is used to generate two new vortex structures mentioned above, thus changing its original evolution state. As shown in Figure 23, the tip vortex attaches the trailing edge of the strut and fin gradually, and the bound vortex occurs on the plane X = −0.35D and 0.45D. It has been known that there is phenomenon of the pressure fluctuation located in where the bound vortices appear, as shown in Figure 15 and Figure 16. Then, the bound vortices develop toward to back, and the strut vortex and the fin vortex are generated. This means that the guess mentioned in Section 3.1 is right: pressure fluctuation is one of the reasons of the vortex generated.
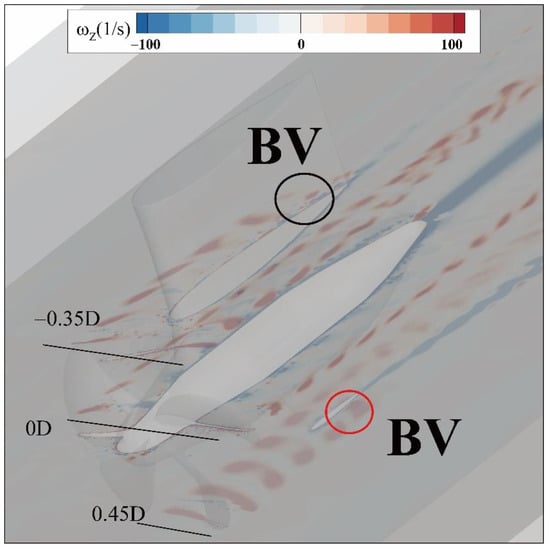
Figure 23.
Distributions of z-vorticity on X = −0.35D, 0D, 0.45D planes under J = 0.8217.
Under all the three conditions, the left part of the tip vortex offsets upward, the blank region generated by offset is occupied by the fin vortex, shown in Figure 21a,c,e. Correspondingly, the right part of the tip vortex offsets downward, and the region is occupied by the strut vortex, shown in Figure 21b,d,f. This phenomenon is different from the traditional single propeller system, in which the tip vortex should be parallel or contracted and develop toward the back. Although the two vortex structures mentioned above occupy the region generated by the offset of the different parts of the tip vortex, they are connected with another part of the tip vortex, respectively, as shown in Figure 22h,l. However, as shown in Figure 22d, the structure behind the pod is different. The strut vortex seems no connected with the left part of the tip vortex, but it is connected with the hub vortex (HV). Besides, under J = 0.6, it is observed that there is a merged vortex (MV), which is also induced by the mutual inductance effect. Both of the two phenomena mentioned above can prove the instability of the flow field under a low-advance coefficient.
At the rear of the pod, the hub vortex occurs, and two parts of the tip vortex offset continuously. Because of the lack of grids refined in the location where the hub vortex occurs, there are no more details about the hub vortex and its mutual inductance effect with other vortex structures.
4. Conclusions
In the present paper, the DDES method was used to simulate the unsteady flow field of a podded propulsor. The paper focused on the unsteady forces and flow field of a podded propulsor. The obtained conclusions are as follows.
Under the influence of rotor–stator interaction, the thrust fluctuates periodically and has a main frequency—blade passage frequency. Under the low advance coefficient 0.6, there are low-frequency interference signals in the flow field, which is induced by the more violent vortex shedding. Due to the wake flow of the propeller acting on the pod, the pressure distribution on the surface of the pod is different from that of the symmetrical flow around the airfoil. The pressure values on both sides of the pod have turning points, and there are phenomena of pressure fluctuations near the trailing edge of the strut and fin, which will lead to the strut vortex and fin vortex. Although the direction of local lateral force is complex, the total lateral force directs to the right side.
The influence of the propeller wake flow on the flow field of the pod is limited and bounded. It only affects the wake flow field within the propeller diameter range approximately. In this region, the pressure distribution presents the characteristic of a spiral, not only in the region far away from the pod, but also in the region of the wake flow of the strut and fin, which should be symmetric in the symmetric airfoil around the flow. As for the region behind the pod, the pressure spectrum distribution has obvious directivity. The pressure amplitudes in the rotating and blade passage frequency are concentrated in the location behind the strut and fin, respectively. What is more, the pressure amplitudes in the direction of the strut are larger than the fin.
For the vortex structure in the flow field, the tip vortex and root vortex are first generated on the propeller blade. Both develop spirally towards the back. The root vortex is wound around the pod, but does not develop to the rear of the pod. The tip vortex impacts the leading edge of the strut, and the detached vortex occurs. Then, the tip vortex flows around and through the pod and the fin, attaching to the trailing edges of them, evolving the strut vortex and fin vortex. Finally, behind the pod, the hub vortex occurs. However, there are some special vortex structures that can be found under the low-advance coefficient 0.6. Near the propeller, the leapfrogging vortex occurs. In the process of future developments, the tip vortex becomes chaos and unordered, the two parallel tip vortex circles will even be merged. Behind the pod, the strut vortex is connected to the hub vortex, which is not found under higher advance coefficients. All the special vortex structures are generated by the effect of mutual inductance.
In the present paper, only a simple situation, uniform inflow, was considered. In actual working conditions, factors affecting the flow field of a podded propulsor are more complicated, such as wake fractions, cavitation, oblique flow and so on. In further research, those situations will be considered and more than one podded propulsor coupled with the ship model will be investigated.
Author Contributions
Conceptualization, B.G., N.Z. and G.L.; methodology, Z.M., B.G., N.Z. and Y.L.; software, Z.M. and Y.L.; validation, Z.M. and Y.L.; formal analysis, Z.M. and Y.L.; investigation, Z.M., B.G., N.Z. and Y.L.; resources, B.G. and N.Z.; data curation, Z.M. and Y.L.; writing—original draft preparation, Z.M.; writing—review and editing, B.G., N.Z. and Y.L.; visualization, Z.M. and Y.L.; supervision, B.G., N.Z. and G.L.; project administration, B.G., N.Z. and G.L.; funding acquisition, Z.M., B.G., N.Z. and G.L. All authors have read and agreed to the published version of the manuscript.
Funding
This research was funded by National Natural Science Foundation of China (grant No. 51576090, 51706087 and 51706086), Six Talent Peaks Project in Jiangsu Province (grant No. KTHY-060), Postgraduate Scientific Research and Innovation Plan in Jiangsu Province (grant No. SJCX21_1710), Research Foundation of Excellent Young Teacher of Jiangsu University (grant no number), Fundamental Science Research Project of Jiangsu Higher Education Institutions (grant No.22KJB570002), and Industrial Science and Technology of Taizhou (grant No.22gyb43).
Data Availability Statement
Not applicable.
Acknowledgments
Thanks for all projects that fund this paper. Thanks for the support of computing resources provided by school of Energy and Power Engineering, Jiangsu University.
Conflicts of Interest
The authors declare no conflict of interest.
Nomenclature
| ρ | water density, kg/m3 |
| Ω | rotation rate tensor, 1/s |
| θ | phase angle of cylindrical extended surface, ° |
| ωi | vorticity components, 1/s |
| Δt | time step size, s |
| CP | pressure coefficient, dimensionless |
| D | propeller diameter, m |
| fBPF | blade passage frequency, Hz |
| fR | rotating frequency, Hz |
| Fy | lateral force, N |
| H | height of the pod, m |
| J | advance coefficient, dimensionless |
| k | harmonic number, dimensionless |
| KFy | lateral force coefficient, dimensionless |
| kn | number of points chosen to represent the curve, 1 |
| KQ | torque coefficient, dimensionless |
| KT | thrust coefficient, dimensionless |
| L | length of the pod, m |
| m | integer exponent, 1 |
| n | propeller rotating speed, r/s |
| N | length of data, 1 |
| P | static pressure, Pa |
| Q | torque, N·m |
| Qc | value of Q criterion, 1/s2 |
| S | strain rate tensor, 1/s |
| Si | numerical results with different meshes, dimensionless |
| T | thrust, N |
| t0 | a certain time step, s |
| v | inflow velocity, m/s |
| vi | velocity components, m/s |
| X | x coordinate, m |
| Z | blade number, 1 |
| Z | z coordinate, m |
Abbreviations
| ACF | Amplitude Correction Function |
| BEM | Boundary Element Method |
| BEMT | Blade Element Momentum Theory |
| BSL | Baseline |
| BV | Bound Vortex |
| CFD | Computational Fluid Dynamics |
| CFL | Courant number |
| CR | Convergence Ratio |
| CRP | Contra-Rotating Propeller |
| DDES | Delayed Detached Eddy Simulation |
| DES | Detached Eddy Simulation |
| DTMB | David Taylor Model Basin |
| DV | Detached Vortex |
| FFT | Fast Fourier Transform |
| FV | Fin Vortex |
| HV | Hub Vortex |
| IDDES | Improved Delayed Detached Eddy Simulation |
| LES | Large Eddy Simulation |
| LV | Leapfrogging Vortex |
| MV | Merged Vortex |
| RANS | Reynolds Averaged Navier-Stokes |
| RNG | Re-Normalization Group |
| RV | Root Vortex |
| SST | Shear-Stress Transport |
| SV | Strut Vortex |
| TV | Tip Vortex |
| VLM | Vortex Lattice Method |
References
- Nuchturee, C.; Li, T.; Xia, H. Energy efficiency of integrated electric propulsion for ships—A review. Renew. Sustain. Energy Rev. 2020, 134, 110145. [Google Scholar] [CrossRef]
- Atlar, M. FAST POD Project: An overall summary and conclusion. In Proceedings of the 2nd International Conference on Technical Advances in Podded Propulsion (T-POD), Nantes, France, 3–5 October 2006. [Google Scholar]
- Akinturk, A.; Islam, M.F.; Veitch, B.; Liu, P. Performance of dynamic azimuthing podded propulsor. Int. Shipbuild. Prog. 2012, 59, 83–106. [Google Scholar]
- Kawakita, C.; Hoshino, T.; Minamiura, J. Prediction of hydrodynamic performance of hydrofoil, strut and pod configuration by a surface panel method. Jpn. Soc. Nav. Archit. Ocean. Eng. 1994, 87, 15–25. [Google Scholar]
- Kerwin, J.E.; Lee, C.S. Prediction of steady and unsteady marine propeller performance by numerical lifting-surface theory. In Proceedings of the Transactions of SNAME, New York, NY, USA, 16–18 November 1978; pp. 1–30. [Google Scholar]
- Bal, Ş.; Güner, M. Performance analysis of podded propulsors. Ocean. Eng. 2009, 36, 556–563. [Google Scholar] [CrossRef]
- Choi, J.K.; Park, H.G.; Kim, H.T. A numerical study of scale effects on performance of a tractor type podded propeller. Int. J. Nav. Archit. Ocean. Eng. 2014, 6, 380–391. [Google Scholar] [CrossRef]
- Shamsi, R.; Ghassemi, H. Hydrodynamic analysis of puller and pusher of azimuthing podded drive at various yaw angles. Proc. Inst. Mech. Eng. Part M J. Eng. Marit. Environ. 2014, 228, 55–69. [Google Scholar] [CrossRef]
- Taskar, B.; Steen, S.; Eriksson, J. Effect of waves on cavitation and pressure pulses of a tanker with twin podded propulsion. Appl. Ocean. Res. 2017, 65, 206–218. [Google Scholar] [CrossRef]
- Amini, H.; Sileo, L.; Steen, S. Numerical calculations of propeller shaft loads on azimuth propulsors in oblique inflow. J. Mar. Sci. Technol. 2012, 17, 403–421. [Google Scholar] [CrossRef]
- Hu, J.; Zhao, W.; Chen, C.G.; Guo, C. Numerical simulation on the hydrodynamic performance of an azimuthing pushing podded propulsor in reverse flow and rotation. Appl. Ocean. Res. 2020, 104, 102338. [Google Scholar] [CrossRef]
- Dong, X.Q.; Yang, C.J. Detached eddy simulation of blade-pod interactions. In Proceedings of the VI International Conference on Computational Methods in Marine Engineering, MARINE VI, Rome, Italy, 15–17 June 2015; CIMNE: Barcelona, Spain, 2015; pp. 639–645. [Google Scholar]
- Zhang, Y.X.; Wu, X.P.; Zhou, Z.Y.; Cheng, X.K.; Li, Y.L. A numerical study on the interaction between forward and aft propellers of hybrid CRP pod propulsion systems. Ocean. Eng. 2019, 186, 106084. [Google Scholar] [CrossRef]
- Hu, J.; Wang, Y.; Zhang, W.; Chang, X.; Zhao, W. Tip vortex prediction for contra-rotating propeller using large eddy simulation. Ocean. Eng. 2019, 194, 106410. [Google Scholar] [CrossRef]
- Posa, A.; Broglia, R.; Balaras, E. LES study of the wake features of a propeller in presence of an upstream rudder. Comput. Fluids 2019, 192, 104247. [Google Scholar] [CrossRef]
- ANSYS. Fluent ANSYS Fluent Theory Guide, Version 19.0; Ansys Inc.: Canonsburg, PA, USA, 2018. [Google Scholar]
- Menter, F.R.; Kuntz, M.; Langtry, R. Ten years of industrial experience with the SST turbulence model. Turbul. Heat Mass Transf. 2003, 4, 625–632. [Google Scholar]
- Zore, K.; Sasanapuri, B.; Parkhi, G.; Varghese, A. Ansys mosaic poly-hexcore mesh for high-lift aircraft configuration. In Proceedings of the 21th Annual CFD Symposium, Bengaluru, India, 8–9 August 2019; pp. 1–11. [Google Scholar]
- Ku, G.; Cho, J.; Cheong, C.; Seol, H. Numerical investigation of tip-vortex cavitation noise of submarine propellers using hybrid computational hydro-acoustic approach. Ocean. Eng. 2021, 238, 109693. [Google Scholar] [CrossRef]
- Wilson, R.; Stern, F. Verification and validation for RANS simulation of a naval surface combatant. In Proceedings of the 40th AIAA Aerospace Sciences Meeting & Exhibit, Reno, NV, USA, 14–17 January 2002; p. 904. [Google Scholar]
- Sezen, S.; Kinaci, O.K. Incompressible flow assumption in hydroacoustic predictions of marine propellers. Ocean. Eng. 2019, 186, 106138. [Google Scholar] [CrossRef]
- Jessup, S.D. An Experimental Investigation of Viscous Aspects of Propeller Blade Flow. Ph.D. Thesis, The Catholic University of America, Washington, DC, USA, 1989. [Google Scholar]
- Krishna, V.R.; Sanaka, S.P.; Pardhasaradhi, N.; Rao, B.R. Hydro-elastic computational analysis of a marine propeller using two-way fluid structure interaction. J. Ocean. Eng. Sci. 2022, 7, 280–291. [Google Scholar] [CrossRef]
- Zhang, Y.; Han, J.; Huang, B.; Zhang, D.; Wu, D. Suppression method for exciting force of pump jet propellers based on sinusoidal unevenly spaced rotor blades. Ocean. Eng. 2022, 262, 112198. [Google Scholar] [CrossRef]
- Wei, Y.; Wang, J.; Xu, J.; Wang, Z.; Luo, J.; Yang, H.; Zhu, Z.; Zhang, W. Effects of Inclined Volute Tongue Structure on the Internal Complex Flow and Aerodynamic Performance of the Multi-Blade Centrifugal Fan. J. Appl. Fluid Mech. 2022, 15, 901–916. [Google Scholar]
- Zhang, N.; Jiang, J.; Gao, B.; Liu, X.; Ni, D. Numerical analysis of the vortical structure and its unsteady evolution of a centrifugal pump. Renew. Energy 2020, 155, 748–760. [Google Scholar] [CrossRef]
- Li, D.; Zhang, N.; Jiang, J.; Gao, B.; Alubokin, A.A.; Zhou, W.; Shi, J. Numerical investigation on the unsteady vortical structure and pressure pulsations of a centrifugal pump with the vaned diffuser. Int. J. Heat Fluid Flow 2022, 98, 109050. [Google Scholar] [CrossRef]
- Lignarolo LE, M.; Ragni, D.; Scarano, F.; Ferreira, C.S.; Van Bussel, G.J.W. Tip-vortex instability and turbulent mixing in wind-turbine wakes. J. Fluid Mech. 2015, 781, 467–493. [Google Scholar] [CrossRef]
- Felli, M.; Camussi, R.; Di Felice, F. Mechanisms of evolution of the propeller wake in the transition and far fields. J. Fluid Mech. 2011, 682, 5–53. [Google Scholar] [CrossRef]
Publisher’s Note: MDPI stays neutral with regard to jurisdictional claims in published maps and institutional affiliations. |
© 2022 by the authors. Licensee MDPI, Basel, Switzerland. This article is an open access article distributed under the terms and conditions of the Creative Commons Attribution (CC BY) license (https://creativecommons.org/licenses/by/4.0/).