1. Introduction
The correct perception of the vehicle driver is essential for the safe crossing or performance of a transport service [
1,
2,
3]. In daytime conditions, under natural light, the perception of lane elements is not a challenge, even in complex and specific road layouts [
4,
5,
6]. The problem of visibility, and the decrease in perception, occurs with dusk and night time [
7,
8,
9]. According to data from the police headquarters, over the years 2011–2019, there has been a decrease in road incidents on the road network in Poland during dusk, dawn and at night [
10]. Unfortunately, accidents at these times are usually associated with much higher consequences than during the daytime, which translates into an average of 1280 fatalities per year.
Street lighting is an element of road infrastructure that is responsible for ensuring adequate visibility conditions depending on the category of road and the traffic that takes place on it, or objects such as a tunnel [
11,
12] or a pedestrian crossing [
13,
14]. It should be emphasized that street lighting also serves pedestrian traffic while increasing the comfort of residents and the aesthetics of the urban space [
15,
16,
17]. Street lighting studies focus on the comparative analysis of the obtained illumination levels of the number/type of incidents on the road [
18,
19,
20,
21]. The vast majority of studies show an unambiguous relationship depicting a decrease in road incidents with increased lighting levels [
22,
23,
24]. Some researchers did not see the above correlations in their analyses, indicating a lack of effect after the use of lighting [
25,
26,
27] or even a back-to-back effect [
28,
29,
30], a well-lit road with the entire road lane area may cause a decrease in driver attentiveness or have the effect of increasing the average speed of vehicles [
31,
32,
33]. The impact of potential driver glare on safety is also an important issue [
34,
35,
36].
The use of artificial road lighting also has unequivocally negative effects related to ecology and the phenomenon of light pollution [
37,
38,
39,
40]. The lighting of a certain level or spectrum, can provoke wildlife to cross the road during the night period, which negatively affects the safety of both wildlife and road safety [
41,
42,
43,
44].
Nowadays, due to rising electricity prices, there is a need to analyze the advisability of using street lighting, especially in areas where there is no traffic in the illuminated area. The viability of using dynamic street lighting, maintains minimum values in the absence of traffic and dynamically increases the power of the luminaires at the time of detection [
45,
46,
47,
48,
49]. Another more common way to increase the efficiency of street lighting use is to replace light sources with LED luminaires [
50,
51]. Often, lighting retrofitting is carried out without a detailed design but only involves the replacement of luminaires, which, due to the different luminaire luminous body characteristics, can result in inadequate illumination of the road by, among other things, not meeting the uniformity requirement [
52,
53] or overexposing the road [
47]. Therefore, it is important to carry out studies of the level and spatial distribution of the illuminance intensity for the lighting projects carried out [
24,
54].
The verification of the illuminance condition with current measurement methods does not meet the challenge of time [
55]. The necessity to use spot or matrix luminance meters to measure the selected measurement field makes the measurements time-consuming and labor-intensive, and they should be carried out with the road traffic stopped for reasons of safety for those carrying out the measurements [
56], and to limit the impact of extraneous light from vehicles driving on the road. An alternative to such surveys is the use of mobile measurement systems mounted, for example, on the roof of a vehicle [
57,
58,
59].
In the opinion of the authors of the article, the applied requirements for street lighting should be reconsidered and criteria should be set anew, which will allow infrastructure managers to optimize the use of electric energy for lighting purposes in a simple way, reducing harmful substances to the environment while ensuring an adequate level of illumination, taking into account traffic safety.
The authors are carrying out construction and research work on the use of a mobile measurement system for road traffic lighting condition surveys. A preliminary verification of the results obtained confirmed that the proposed measurement approach is correct and useful. One of the main problems that became apparent during the research was the correct positioning of the measurement points. In the measurements carried out so far [
60], a classic GPS receiver was used, which under the conditions of urban traffic and dense buildings generated numerous positioning errors of measurement samples, which significantly influenced the obtained results of illuminance values in the analyzed areas. A solution to this problem could be the use of a precise GPS RTK (Real-Time Kinematic) receiver [
61,
62].
The paper has presented the design of a measurement system for a mobile post-measurement of street lighting using a GPS RTK receiver, along with verification of its correct operation.
2. Materials and Methods
2.1. Functional Assumptions for the Measurement System
In formulating the functional assumptions for this stand, it was assumed that it would provide:
- -
simultaneous and synchronized measurement of illuminance from three measuring sensors placed in the horizontal plane and one placed in the vertical plane, all fixed at a height of 1.5 m above the roadway;
- -
spectral sensitivity of the sensors close to the spectral sensitivity of the human eye V(λ);
- -
an unambiguous assignment of geolocation data to the measurement sample;
- -
sampling frequency of the sensors allowing to obtain the minimum required density of the measurement grid;
- -
the possibility to adjust the position of the measuring sensors in the horizontal plane;
- -
possibility of non-invasive mounting of the system to the roof of the vehicle;
- -
possibility to set digital markers in the data frame to inform about potential interferences or important information, e.g., beginning and end of measurement.
Relating these assumptions to the prescriptive requirements [
56] of street lighting illuminance measurements, and the possibility of sourcing components with specific specifications, allowed us to establish the technical limitations and design requirements for the test stand:
- -
adjustable distance between sensors: < 1–2 > m;
- -
spectral sensitivity range of sensors: < 380–780 > nm with V(λ) adjustment;
- -
measuring range of illuminance sensors < 0.01–83 k > lux;
- -
vehicle geolocation based on GPS RTK corrections with an error of < 5 cm;
- -
control panel for setting digital markers with three function keys;
- -
sampling frequency minimum 5 Hz;
- -
speed of the measuring vehicle maximum 20 km/h;
- -
digital data recording.
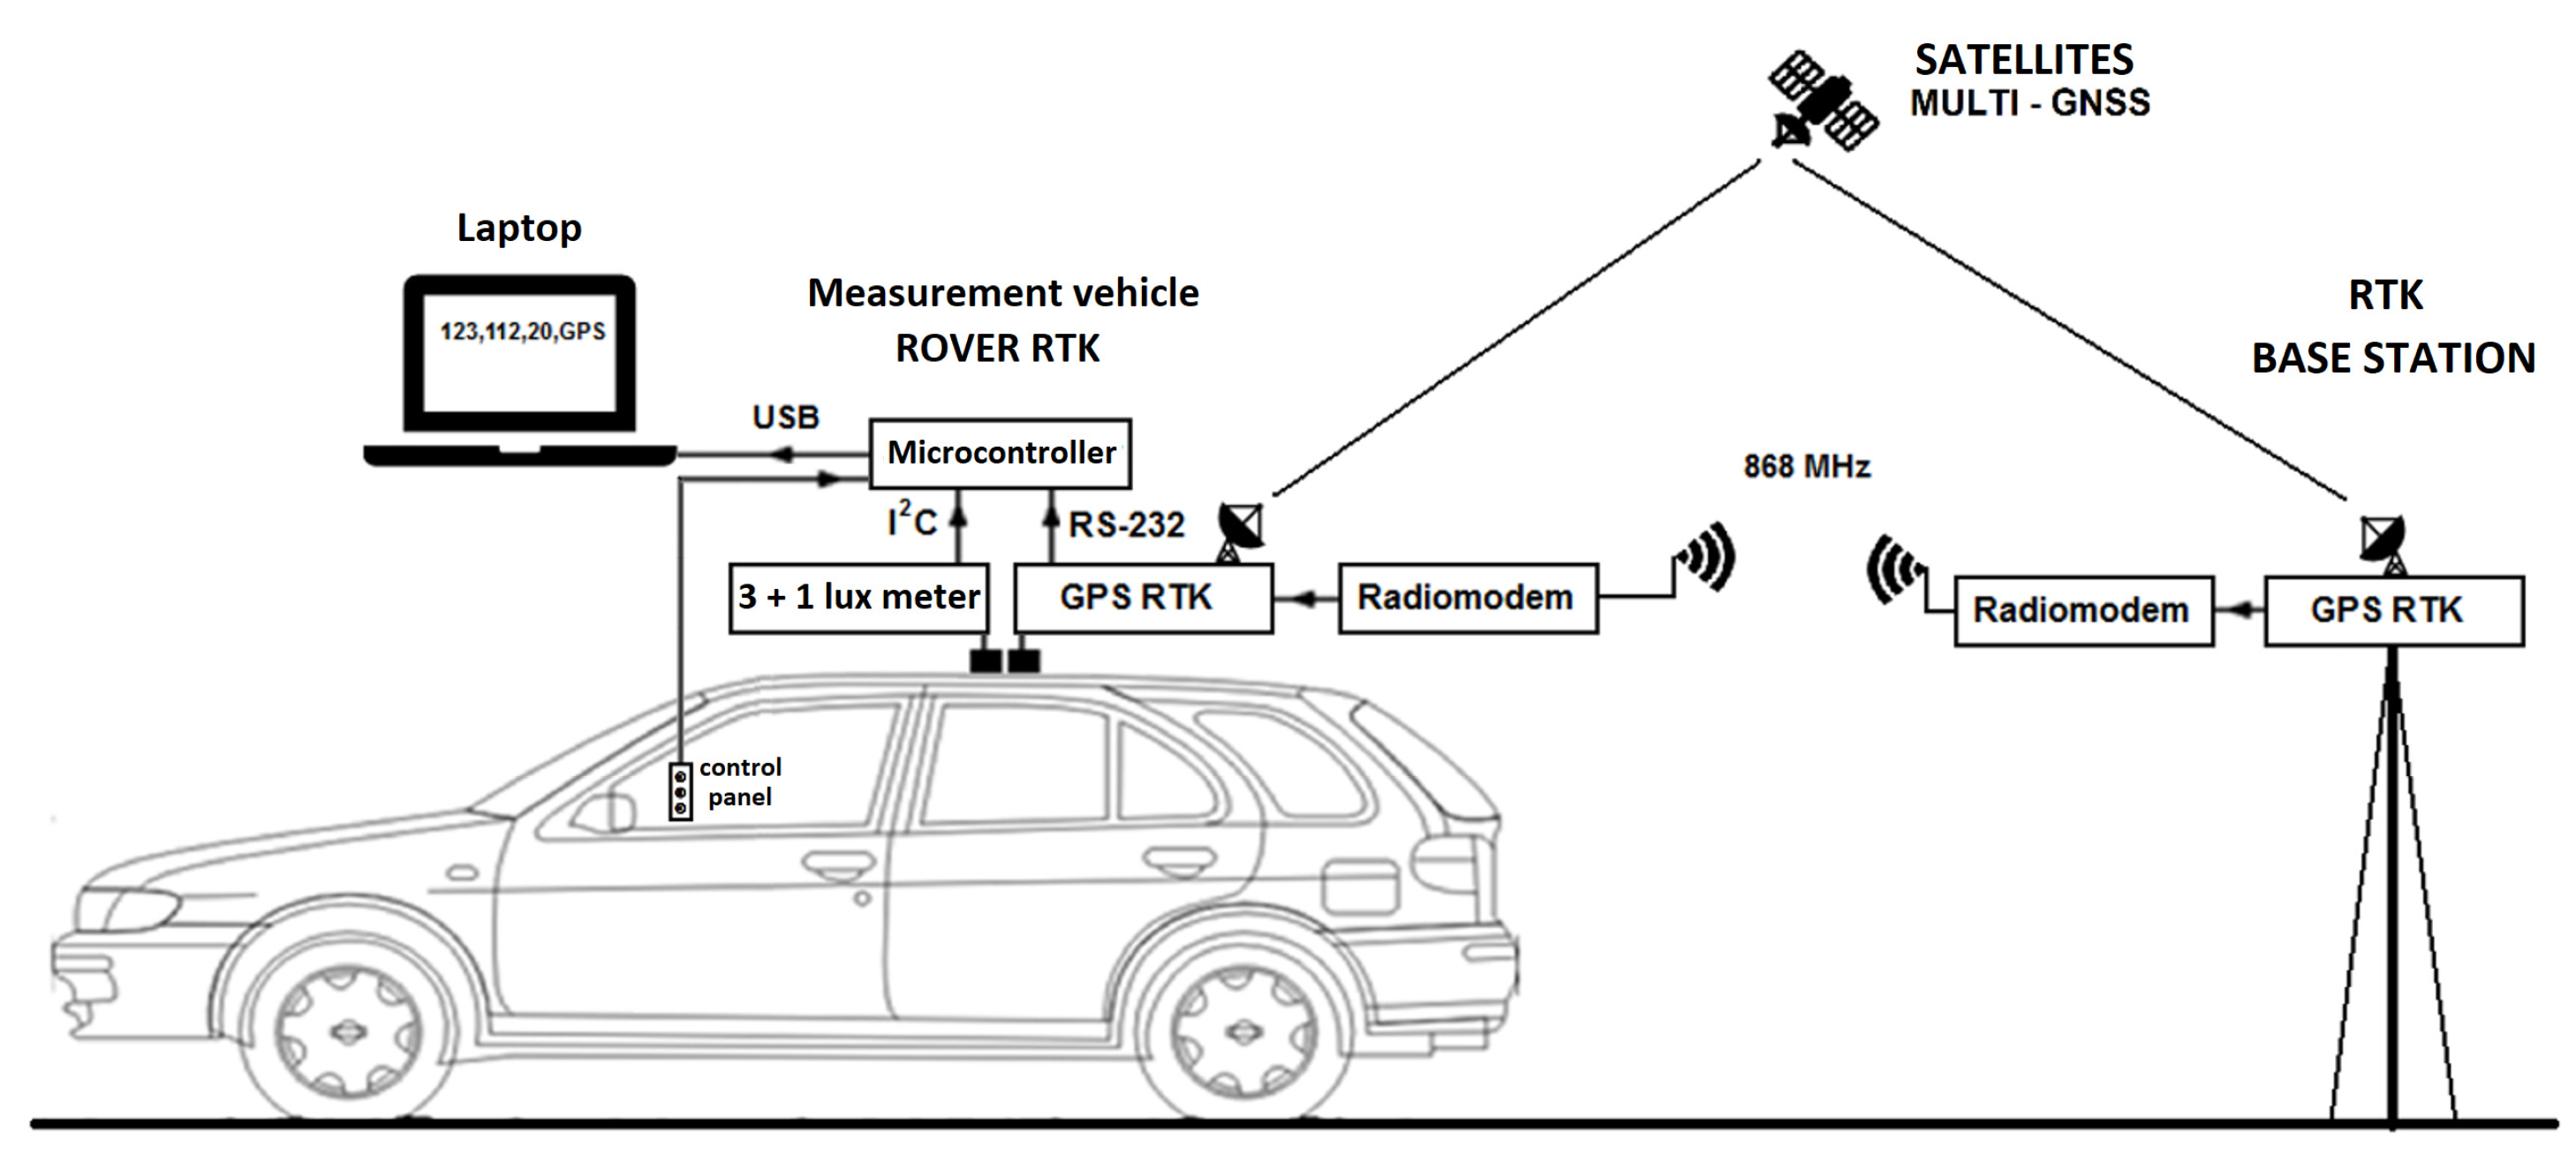
2.2. Mobile Measurement System (Rover)
Based on the defined functional assumptions, a target test station was developed, which consists of two main elements: a measurement vehicle (ROVER) and a GPS RTK base station (BASE STATION). The main components of the mobile measurement system are three illumination sensors mounted in the horizontal plane and one sensor in the vertical plane, a GPS receiver module with the possibility of introducing RTK corrections, a long-range radio modem and a microcontroller with a computer for recording and visualizing measurement data (
Figure 1).
Digital illuminance sensors OPT3001 (
Figure 2) from Texas Instruments [
63], with a spectral sensitivity V(λ) similar to that of human eyes (
Figure 3) and a measurement frequency of 5 Hz, were used to build the designed system.
The OPT3001 illuminance sensors have a built-in amplifier circuit, an analogue-to-digital converter, and a serial communication interface module (
Figure 4). This allows them to communicate digitally with the microcontroller via an I
2C bus.
The mechanical design of the measurement system allows for quick adjustment of the distance between sensors, while the magnetic mounts provide secure fixings on the roof of the vehicle, in the central part of which there is a GPS RTK receiver with a radio modem (
Figure 5) for receiving geodetic corrections transmitted from the base station.
The essential role in the measurement system is played by three illuminance sensors fixed in the horizontal plane (
Figure 6), spaced at the target distance (for the road section under study, 1 m). The use of three illuminance sensors allows a minimum value of the number of measurement grid points to be obtained for one road lane in the transverse direction, as required by the standard [
56]. In order to obtain information about the potential impact of extraneous light, an additional sensor measuring the vertical component of illuminance was mounted in the central part of the post-measurement system (
Figure 7).
The GPS RTK corrections received from the base reference station enable the precise location of the measurement points of the used illuminance sensors on the road. The microcontroller used aggregates of the measurement values from all illuminance sensors and location information from the GPS RTK receiver and sends the aggregated data to a laptop for storage and visualization (
Figure 8). In addition, the measurement system is designed so that digital markers can be added while measurements are being taken using a manual operator-controlled control panel with three buttons. This tool is helpful during survey execution. It offers the possibility to record in a data frame, (
Figure 9), situations that were not foreseen within the implemented test scenario, or to give other functionality, e.g., to assign a value to a specific vehicle direction or to indicate the occurrence of extraneous light effects in the environment of the measuring vehicle.
The data frame stores illuminance registrations from four sensors from the horizontal plane and one from the vertical plane. Each registration is assigned a value from the markers, with a default value of 0, and data associated with the GPS RTK position determination.
The syntax of the data frame is shown according to the table below (
Table 1), where:
1, 2, 3—illuminance value in the horizontal plane [lx],
4—illuminance value in the vertical plane [lx],
5, 6,—marker 0/1 based on pressing the button on the control panel,
8—GPS RTK data $GNRMC sequence.
Measurement data is recorded in text form in the following format (three readings):
16.22,12.03,9.19,1.60,0,0,0,$GNRMC,214613.40,A,5214.63836,N,02059.21320,E,0.427,,071022,,,A*61
16.30,11.87,9.68,1.68,0,0,0,$GNRMC,214613.50,A,5214.63838,N,02059.21321,E,0.422,,071022,,,A*6A
16.38,11.79,9.73,1.69,0,0,0,$GNRMC,214613.60,A,5214.63839,N,02059.21324,E,0.092,,071022,,,A*62
RMC (Recommended minimum of data) $GNRMC sequence, this is defined by the NMEA standard as the minimum data that a GPS RTK receiver must send. Interpretation of this data also determines the GPS position of the device, where:
GNRMC—header for a multisystem frame (GPS, GOLNAS and others),
214613.40—Data validity—21:46:13.40 UTC,
A—status (A—active; V—inactive),
5214.63836,N—latitude N
02059.21320,E—longitude E,
0.427—object speed (calculated in knots),
084.4—tracking/moving angle of the object (in degrees)—useful for determining the direction of the object if the GPS unit is not equipped with a compass,—071022—date (07.10.2022),
003.1,W—magnetic deviation of the earth,
-—method of determining position, where: A—Autonomous; D—Differential; E—Estimated (dead reckoning) mode; M—Manual input, N—Data not valid.
*6A—checksum preceded by special character (*),
[CR][LF]—end of line.
2.3. Locating the Measurement Sample (GPS RTK Reference Base Station)
An important change in relation to the measurement system used by the authors [
60] to date is the use of GPS RTK positioning, which allows precise localization of measurement samples. A variant with the construction of an own reference station was decided upon (
Figure 10). The disadvantage of such a solution is the longer measurement initiation (related to establishing the base station reference position) and limited measurement range (resulting from limited radio modem transmission range). An alternative to the system used is the possibility of purchasing commercial corrections from available reference stations and using a receiver with Internet access via a GSM modem (GPRS).
In the solution used, the transmission of corrections between the RTK modules (GPS DP0501 RTK GNSS Tiny M8P) of the base station (BASE) and the survey vehicle (ROVER) (
Figure 1) is carried out according to the scheme (
Figure 11) using ARF868 ULR radiomodems with a range of up to 20 km. In contrast, on-street field surveys were carried out at distances of up to 2.5 km from the reference station.
2.4. Verification of the Quality of the Measurement System
The verification of the acquired data from the author’s illuminance measurement system with the use of a GPS RTK receiver was performed on the basis of a comparison of the results obtained. Dynamic measurements carried out in the selected measurement field were related to the tests carried out using the classic method. The measurements were made in a grid of points compliant with the requirements of the [
56] standard. The registrations were performed manually, using a class A lux meter, the measuring head of which was mounted at the same height as the sensors in the measuring vehicle, at 1.5 m. The value of the average illuminance for each of the vehicle directions (A and B) in the analyzed field was calculated. The next step was to carry out comparative analyses between successive runs for the selected measurement fields. The fields were selected due to the absence of interfering factors (i.e., traffic lights, bright advertisements, and shop windows).
The potential of the measurement system was used in dynamic measurements and its quality directly influenced the results of the measurements, including the reliability of the analyses based on them. The quality of the measurement system is measured by the accuracy, which represents the position of the data with respect to the nominal/actual value, and the variance, which indicates the variability/spread of the measurement data.
A high variance value of the results translates into low data quality. The reason for this may be the lack of robustness of the measurement system to factors related to related to atmospheric conditions, or other factors interfering with the measurement of light, or the position of the vehicle on the road, which are variable for individual registrations. In the case of the method in question, this could be the speed of measurement or a different trajectory of the vehicle, extraneous light from other vehicles or extraneous light from traffic lights. As certain factors have a greater influence on the measurement result, the usability and quality of the registration decreases. When characterizing the potential errors associated with a measurement system, the following types can be distinguished [
64]:
- -
accuracy (bias) is the deviation of the mean value of the measurements from the actual magnitude of the property being measured;
- -
repeatability is the variance, the variation in measurement results obtained when a given operator measures one and the same item several times under the same weather conditions;
- -
reproducibility is the variability that occurs between the mean values measured by different operators when measuring the same element with the same instrument;
- -
stability is the total variability obtained when a characteristic is measured over an extended period of time;
- -
linearity is the variability in the accuracy of a measurement expressed in relation to the magnitude of the measurement.
One way of proving the correct operation of a measurement system is the MSA (Measurement System Analysis) method [
65], together with the R&R (Repeatability and Reproducibility Study) test [
66]. According to the method, the value of the R&R statistics expressed as a percentage allows the measurement system to be evaluated according to the following criterion:
- -
below 10% the system is acceptable;
- -
10–30% the system is conditionally acceptable;
- -
above 30% the measuring system is unacceptable (refinement is necessary).
3. Results
Tests on lighting parameters using a measurement system with GPS RTK (ROVER) installed on a vehicle, at a height of 1.5 m above the road surface, were carried out on the entire course of Smocza Street in Warsaw (Poland). The length of the street is 1025 m. The street was divided into 30 sections with a shape adapted to the road profile and a length adapted to the positioning of poles specified in the requirements of the standard [
67] (
Figure 12). Geodetic data acquired in the QGIS environment [
30] was used to visualize the results. Data related to the location of the luminaires and their technical parameters, including power, were obtained on the basis of information made available by the road infrastructure manager ZDM in Warsaw [
68] in a digital file.
Smocza Street in Warsaw is illuminated by a new lighting system with LED luminaires in single-sided and alternating settings. There is a change in the orientation of the single-sided luminaires in some sections. Within the street, there are nine pedestrian crossings illuminated by a system with two luminaires dedicated to lighting pedestrian crossings, with asymmetrical distribution of the luminous flux. Fields where additional lighting of pedestrian crossings, intersections, and areas where there is the possibility of extraneous light effects were excluded from further analysis.
In the first study, manual spot measurements of illuminance were carried out in area No. 24 in accordance with the requirements of [
60,
67]. Mean illuminance values E for diraction A = 19.81 lx and for direction B = 18.94 lx equal to new approach results for direction A = 19.49 lx (standard deviation of 0.1547 lx) and for direction B = 19.13 lx (standard deviation of 0.164 lx) related to the directions of travel in the section under study.
For the purpose of the comparative test, measurement data recorded with a mobile measurement system with GPS RTK corrections on Smocza Street, consisting of five runs for measurement field No. 24, were used (
Figure 13). The measurement was carried out by five measurement operators (drivers) with one trial each for the entire test field.
Table 2 summarizes the calculated average illuminance values E for directions A and B.
The locations of the illuminance measurement points in the selected fields are shown in
Appendix A in
Figure A1,
Figure A2,
Figure A3,
Figure A4,
Figure A5,
Figure A6,
Figure A7,
Figure A8,
Figure A9 and
Figure A10. The results of measurements of the parameter of average illuminance value in the measurement field for five consecutive trips made with the use of the measurement system with a GPS RTK receiver (corresponding to the fields in
Appendix A) are summarized in
Table A1,
Table A2,
Table A3,
Table A4,
Table A5,
Table A6,
Table A7,
Table A8,
Table A9 and
Table A10 in
Appendix B.
Calculations were performed using the MATLAB software and an R&R result of 11.14% was obtained. Based on the %R&R value obtained, it should be concluded that the proposed system for measuring the condition of street lighting slightly exceeds 10%, resulting in a conditional acceptance of the measurement system. When comparing a proprietary design developed with limited funding to a sophisticated research lab (%R&R = 26.60%) [
57], a much better result was obtained. When comparing the systems by variance, the author’s measurement system achieved 10.83% against the Gibbons team’s 13% [
57].
The conclusion of the analysis is that the measurement system used proves the correct performance. In the opinion of the article’s authors, the author’s measurement system, with better retrofitting and minor design changes, has the potential to meet the criterion of achieving a %R&R test value below 10%. Development of the solution is one of the objectives of further research work.
4. Discussion
Tests carried out and described in the article, verifying the possibility of measuring illuminance parameters in road traffic, confirmed the repeatability of measurements and the applicability of the proposed measurement system solution. Thanks to the use of a precise GPS RTK receiver, it was possible to obtain repeatable results of average illuminance values in the analyzed measurement fields and to unambiguously assign the results to the analyzed area (
Figure 14).
The issues presented in this article do not exhaust all the problems considered in relation to the implementation of measurements in urban environments. Further work will concern the evaluation and elimination of the level of influence of factors interfering with the measurement results by means of extraneous light, e.g., from other road users, light advertisements, or traffic lights. Consideration will also be given to the use of a different RTK receiver in order to achieve a higher positioning frequency while maintaining location precision under urban conditions, which currently significantly limits the speed of the measuring vehicle.
5. Conclusions
In urban settings, mobile measurement systems are used to obtain data on e.g., parking, pavement condition, atmospheric condition, objects (advertisements) installed in the road environment, etc. These data are stored in databases and made available in formats that allow them to be used for various purposes (e.g., warning, condition assessment, payment of fees or local taxes, Smart City, etc.). Currently, there is a lack of data on street lighting levels in cities and the developed measurement system equipped with a GPS RTK receiver attempts to fill this gap.
Street lighting data can also serve a variety of applications. On the basis of information on lighting levels, the maintenance or replacement of luminaires can be predicted, but it is also possible to look for links to personal safety, traffic safety, light pollution, potential opportunities to reduce electricity consumption and related greenhouse gas emissions.
Conducting street lighting surveys under urban conditions involves a number of technical and organizational constraints. For practical, cost-intensive reasons it is neither possible nor justifiable to close streets in order to carry out street lighting surveys. This is one of the reasons why these surveys are not carried out or only to a limited extent.
The measurement system for street lighting surveys proposed and described in this article fits in with current needs and allows rapid surveys of illuminance parameters in traffic, practically with only minor limitations due to the accuracy of the GPS RTK positioning system.
The recorded illuminance measurement data is described by geographical coordinates and allows spatial evaluation of the illuminance level by determining the average illuminance value for individual measurement sections or entire street sequences. Thanks to the geolocation of the measurement samples, it is possible to visualize the data on GIS maps, making it possible to identify correctly or incorrectly lit areas. The system makes it possible to control large stretches of lit road in a short period of time. Measurements are carried out automatically, reducing errors, and operator mistakes. The measurements can be carried out in a repeatable manner, which in turn can make it possible to assess changes in the lighting parameters of a road lighting installation over time for the entire analyzed area, street, or city. The repeatability of the obtained results allows analyses to be conducted on a wider time scale, e.g., systematic, monthly, which makes it possible to assess the degradation of the installation and establish maintenance coefficients for a given road section for subsequent, neighboring, or similar locations. Thanks to the application of analytical relationships, it is possible to relate the obtained results to normative requirements in order to determine the class of road lighting.
Author Contributions
Conceptualization, P.T. and P.J.; methodology, P.T., P.J. and M.C.; software, P.T. and P.J.; validation, P.T., P.J. and M.C.; formal analysis P.J. and P.T., investigation, P.T., P.J. and M.C.; resources, P.T., P.J. and M.C.; data curation, P.J. and P.T., writing—original draft preparation, P.T., P.J. and M.C.; writing—review and editing, P.T. and P.J.; visualization, P.T. and P.J.; supervision, P.J. and P.T. All authors have read and agreed to the published version of the manuscript.
Funding
This research received no external funding.
Conflicts of Interest
The authors declare no conflict of interest.
Appendix A
Locations of measurement points in individual fields.
Figure A1.
Example of five illuminance measurements in field No. 2.
Figure A1.
Example of five illuminance measurements in field No. 2.
Figure A2.
Example of five illuminance measurements in field No. 3.
Figure A2.
Example of five illuminance measurements in field No. 3.
Figure A3.
Example of five illuminance measurements in field No. 5.
Figure A3.
Example of five illuminance measurements in field No. 5.
Figure A4.
Example of five illuminance measurements in field No. 6.
Figure A4.
Example of five illuminance measurements in field No. 6.
Figure A5.
Example of five illuminance measurements in field No. 7.
Figure A5.
Example of five illuminance measurements in field No. 7.
Figure A6.
Example of five illuminance measurements in field No. 10.
Figure A6.
Example of five illuminance measurements in field No. 10.
Figure A7.
Example of five illuminance measurements in field No. 11.
Figure A7.
Example of five illuminance measurements in field No. 11.
Figure A8.
Example of five illuminance measurements in field No. 13.
Figure A8.
Example of five illuminance measurements in field No. 13.
Figure A9.
Example of five illuminance measurements in field No. 18.
Figure A9.
Example of five illuminance measurements in field No. 18.
Figure A10.
Example of five illuminance measurements in field No. 25.
Figure A10.
Example of five illuminance measurements in field No. 25.
Appendix B
Table A1.
Example of the results for measurement field No. 2.
Table A1.
Example of the results for measurement field No. 2.
| Measurement Number | Direction | Illuminance
[lx]
|
|---|
| 1 | A | 9.14 |
| B | 16.10 |
| 2 | A | 9.56 |
| B | 15.67 |
| 3 | A | 9.01 |
| B | 15.76 |
| 4 | A | 8.50 |
| B | 16.12 |
| 5 | A | 8.75 |
| B | 15.76 |
Table A2.
Example of the results for measurement field No. 3.
Table A2.
Example of the results for measurement field No. 3.
| Measurement Number | Direction | Illuminance
[lx]
|
|---|
| 1 | A | 11.37 |
| B | 18.41 |
| 2 | A | 12.02 |
| B | 18.32 |
| 3 | A | 11.68 |
| B | 18.42 |
| 4 | A | 10.92 |
| B | 18.53 |
| 5 | A | 11,30 |
| B | 18.54 |
Table A3.
Example of the results for measurement field No. 5.
Table A3.
Example of the results for measurement field No. 5.
| Measurement Number | Direction | Illuminance
[lx]
|
|---|
| 1 | A | 10.74 |
| B | 19.25 |
| 2 | A | 11.17 |
| B | 20.53 |
| 3 | A | 11.26 |
| B | 21.29 |
| 4 | A | 11.31 |
| B | 20.11 |
| 5 | A | 11.30 |
| B | 20.43 |
Table A4.
Example of the results for measurement field No. 6.
Table A4.
Example of the results for measurement field No. 6.
| Measurement Number | Direction | Illuminance
[lx]
|
|---|
| 1 | A | 9.00 |
| B | 15.77 |
| 2 | A | 9.28 |
| B | 15.10 |
| 3 | A | 8.92 |
| B | 16.42 |
| 4 | A | 9.28 |
| B | 15.84 |
| 5 | A | 9.14 |
| B | 15.75 |
Table A5.
Example of the results for measurement field No. 7.
Table A5.
Example of the results for measurement field No. 7.
| Measurement Number | Direction | Illuminance
[lx]
|
|---|
| 1 | A | 6.18 |
| B | 12.67 |
| 2 | A | 6.18 |
| B | 12.74 |
| 3 | A | 5.86 |
| B | 13.76 |
| 4 | A | 6.24 |
| B | 12.68 |
| 5 | A | 6.17 |
| B | 13.26 |
Table A6.
Example of the results for measurement field No. 10.
Table A6.
Example of the results for measurement field No. 10.
| Measurement Number | Direction | Illuminance
[lx]
|
|---|
| 1 | A | 18.26 |
| B | 9.89 |
| 2 | A | 18.02 |
| B | 9.84 |
| 3 | A | 18.79 |
| B | 9.97 |
| 4 | A | 18.24 |
| B | 9.27 |
| 5 | A | 17.77 |
| B | 9.49 |
Table A7.
Example of the results for measurement field No. 11.
Table A7.
Example of the results for measurement field No. 11.
| Measurement Number | Direction | Illuminance
[lx]
|
|---|
| 1 | A | 17.72 |
| B | 8.75 |
| 2 | A | 17.59 |
| B | 9.07 |
| 3 | A | 17.55 |
| B | 9.03 |
| 4 | A | 17.62 |
| B | 8.45 |
| 5 | A | 17.23 |
| B | 8.88 |
Table A8.
Example of the results for measurement field No. 13.
Table A8.
Example of the results for measurement field No. 13.
| Measurement Number | Direction | Illuminance
[lx]
|
|---|
| 1 | A | 20.19 |
| B | 12.69 |
| 2 | A | 19.89 |
| B | 12.26 |
| 3 | A | 20.19 |
| B | 12.34 |
| 4 | A | 19.84 |
| B | 12.49 |
| 5 | A | 19.53 |
| B | 12.80 |
Table A9.
Example of the results for measurement field No. 18.
Table A9.
Example of the results for measurement field No. 18.
| Measurement Number | Direction | Illuminance
[lx]
|
|---|
| 1 | A | 19.94 |
| B | 12.66 |
| 2 | A | 21.17 |
| B | 12.74 |
| 3 | A | 20.38 |
| B | 12.50 |
| 4 | A | 19.00 |
| B | 12.76 |
| 5 | A | 17.98 |
| B | 13.20 |
Table A10.
Example of the results for measurement field No. 25.
Table A10.
Example of the results for measurement field No. 25.
| Measurement Number | Direction | Illuminance
[lx]
|
|---|
| 1 | A | 15.17 |
| B | 13.51 |
| 2 | A | 16.03 |
| B | 15.03 |
| 3 | A | 15.98 |
| B | 14.67 |
| 4 | A | 15.94 |
| B | 13.24 |
| 5 | A | 15.72 |
| B | 15.20 |
References
- Beyer, F.R.; Ker, K. Street lighting for prevention of road traffic injuries. Inj. Prev. 2009, 15, 282. [Google Scholar] [CrossRef]
- Elvik, R. Meta-analysis of evaluations of public lighting as accident countermeasure. Transp. Res. Rec. 1995, 1485, 112–123. [Google Scholar]
- Wanvik, P.O. Effects of road lighting: An analysis based on Dutch accident statistics 1987–2006. Accid. Anal. Prev. 2009, 41, 123–128. [Google Scholar] [CrossRef]
- Al-Rousan, T.M.; Umar, A.A.; Al-Omari, A.A.; Khalaylah, Y.A.; Alkuime, H.M.; Al-Rousan, A.H. A scoping study on driver’s perspective of distracting factors. Infrastructures 2021, 6, 139. [Google Scholar] [CrossRef]
- Cvahte Ojsteršek, T.; Topolšek, D. Influence of drivers’ visual and cognitive attention on their perception of changes in the traffic environment. Eur. Transp. Res. Rev. 2019, 11, 45. [Google Scholar] [CrossRef]
- Evans, T.; Stuckey, R.; Macdonald, W. Young drivers’ perceptions of risk and difficulty: Day versus night. Accid. Anal. Prev. 2020, 147, 105753. [Google Scholar] [CrossRef]
- Bhagavathula, R.; Gibbons, R.B.; Edwards, C.J. Relationship between roadway illuminance level and nighttime rural intersection safety. Transp. Res. Rec. 2015, 2485, 8–15. [Google Scholar] [CrossRef]
- Bullough, J.D.; Donnell, E.T.; Rea, M.S. To illuminate or not to illuminate: Roadway lighting as it affects traffic safety at intersections. Accid. Anal. Prev. 2013, 53, 65–77. [Google Scholar] [CrossRef]
- Goswamy, A.; Hallmark, S.; Litteral, T.; Pawlovich, M. Safety evaluation of destination lighting treatment at stop controlled cross-intersections. Transp. Res. Rec. 2018, 2672, 113–121. [Google Scholar] [CrossRef]
- Poland Police Headquarters. Available online: https://statystyka.policja.pl/ (accessed on 31 October 2022).
- Liu, C.; Wang, Q. Simulating human visual perception in tunnel portals. Sustainability 2021, 13, 3741. [Google Scholar] [CrossRef]
- Su, B.; Hu, J.; Zeng, J.; Wang, R. Traffic Safety Improvement via Optimizing Light Environment in Highway Tunnels. Int. J. Environ. Res. Public Health 2022, 19, 8517. [Google Scholar] [CrossRef] [PubMed]
- Lindh, U.W.; Jägerbrand, A.K. Perceived lighting uniformity on pedestrian roads: From an architectural perspective. Energies 2021, 14, 3647. [Google Scholar] [CrossRef]
- Patella, S.M.; Sportiello, S.; Carrese, S.; Bella, F.; Asdrubali, F. The effect of a LED lighting crosswalk on pedestrian safety: Some experimental results. Safety 2020, 6, 20. [Google Scholar] [CrossRef]
- Cho, Y.; Jeong, H.; Choi, A.; Sung, M. Design of a connected security lighting system for pedestrian safety in smart cities. Sustainability 2019, 11, 1308. [Google Scholar] [CrossRef]
- Stangierska, D.; Kowalczuk, I.; Juszczak-Szelągowska, K.; Widera, K.; Ferenc, W. Urban Environment, Green Urban Areas, and Life Quality of Citizens—The Case of Warsaw. Int. J. Environ. Res. Public Health 2022, 19, 943. [Google Scholar] [CrossRef]
- Svechkina, A.; Trop, T.; Portnov, B.A. How much lighting is required to feel safe when walking through the streets at night? Sustainability 2020, 12, 3133. [Google Scholar] [CrossRef]
- Abbasi, M.; Piccioni, C.; Sierpiński, G.; Farzin, I. Analysis of Crash Severity of Texas Two Lane Rural Roads Using Solar Altitude Angle Based Lighting Condition. Sustainability 2022, 14, 1692. [Google Scholar] [CrossRef]
- Jaber, A.; Juhász, J.; Csonka, B. An analysis of factors affecting the severity of cycling crashes using binary regression model. Sustainability 2021, 13, 6945. [Google Scholar] [CrossRef]
- Wei, F.; Cai, Z.; Wang, Z.; Guo, Y.; Li, X.; Wu, X. Investigating rural single-vehicle crash severity by vehicle types using full bayesian spatial random parameters logit model. Appl. Sci. 2021, 11, 7819. [Google Scholar] [CrossRef]
- Wiratama, B.S.; Hsu, L.M.; Yeh, Y.S.; Chen, C.C.; Saleh, W.; Liu, Y.H.; Pai, C.W. Joint Effect of Heavy Vehicles and Diminished Light Conditions on Paediatric Pedestrian Injuries in Backover Crashes: A UK Population-Based Study. Int. J. Environ. Res. Public Health 2022, 19, 1689. [Google Scholar] [CrossRef]
- Budzynski, M.; Gobis, A.; Guminska, L.; Jelinski, L.; Kiec, M.; Tomczuk, P. Assessment of the influence of road infrastructure parameters on the behaviour of drivers and pedestrians in pedestrian crossing areas. Energies 2021, 14, 3559. [Google Scholar] [CrossRef]
- Rodionova, M.; Skhvediani, A.; Kudryavtseva, T. Prediction of Crash Severity as a Way of Road Safety Improvement: The Case of Saint Petersburg, Russia. Sustainability 2022, 14, 9840. [Google Scholar] [CrossRef]
- Tomczuk, P.; Chrzanowicz, M.; Mackun, T.; Budzyński, M. Analysis of the results of the audit of lighting parameters at pedestrian crossings in warsaw. Arch. Transp. 2021, 59, 21–39. [Google Scholar] [CrossRef]
- Jackett, M.; Consulting, J.; Frith, W. How Does the Level of Road Lighting Affect Crashes in New Zealand—A Pilot Study; Opus International Consultants Central Laboratories: Lower Hutt, New Zealand, 2012. [Google Scholar]
- Peña-García, A.; Nguyen, T.P.L. A global perspective for sustainable highway tunnel lighting regulations: Greater road safety with a lower environmental impact. Int. J. Environ. Res. Public Health 2018, 15, 2658. [Google Scholar] [CrossRef] [PubMed]
- Zahran, E.S.M.M.; Tan, S.J.; Yap, Y.H.; Tan, E.H.; Pena, C.M.F.; Yee, H.F.; Uddin, M.R. An investigation into the impact of alternate road lighting on road traffic accident hotspots using spatial analysis. In Proceedings of the 4th International Conference on Intelligent Transportation Engineering ICITE 2019, Singapore, 6–8 September 2019; pp. 242–246. [Google Scholar] [CrossRef]
- Ackaah, W.; Apuseyine, B.A.; Afukaar, F.K. Road traffic crashes at night-time: Characteristics and risk factors. Int. J. Inj. Contr. Saf. Promot. 2020, 27, 392–399. [Google Scholar] [CrossRef]
- Das, S.; Dutta, A.; Sun, X. Patterns of rainy weather crashes: Applying rules mining. J. Transp. Saf. Secur. 2020, 12, 1083–1105. [Google Scholar] [CrossRef]
- Safari, M.; Alizadeh, S.S.; Bazargani, H.S.; Aliashrafi, A.; Maleki, A.; Moshashaei, P.; Shakerkhatibi, M. A Comprehensive Review on Risk Factors Affecting the Crash Severity. Iran. J. Health Saf. Environ. 2020, 6, 1366–1376. [Google Scholar]
- Bassani, M.; Mutani, G. Effects of environmental lighting conditions on operating speeds on Urban Arterials. Transp. Res. Rec. 2012, 2298, 78–87. [Google Scholar] [CrossRef]
- Jägerbrand, A.K.; Johansson, M.; Laike, T. Speed responses to speed humps as affected by time of day and light conditions on a residential road with light-emitting diode (LED) road lighting. Safety 2018, 4, 10. [Google Scholar] [CrossRef]
- Jägerbrand, A.K.; Sjöbergh, J. Effects of weather conditions, light conditions, and road lighting on vehicle speed. SpringePlus 2016, 5, 505. [Google Scholar] [CrossRef]
- Hu, J.; Guo, Y.; Wang, R.; Ma, S.; Yu, A. Study on the Influence of Opposing Glare from Vehicle High-Beam Headlights Based on Drivers’ Visual Requirements. Int. J. Environ. Res. Public Health 2022, 19, 2766. [Google Scholar] [CrossRef] [PubMed]
- Mehri, A.; Sajedifar, J.; Abbasi, M.; Tajbakhsh, M.A. The effect of veiling luminance on the disability glare of car headlamps designed in Iran. Int. J. Occup. Saf. Ergon. 2022, 28, 1213–1218. [Google Scholar] [CrossRef] [PubMed]
- Viktorová, L.; Mičková, K.; Stanke, L. Czech Drivers’ Glare Perception Survey. Sustainability 2022, 14, 8922. [Google Scholar] [CrossRef]
- Li, X.; Duarte, F.; Ratti, C. Analyzing the obstruction effects of obstacles on light pollution caused by street lighting system in Cambridge, Massachusetts. Environ. Plan. B Urban Anal. City Sci. 2021, 48, 216–230. [Google Scholar] [CrossRef]
- de Miguel, A.S.; Bennie, J.; Rosenfeld, E.; Dzurjak, S.; Gaston, K.J. First estimation of global trends in nocturnal power emissions reveals acceleration of light pollution. Remote Sens. 2021, 13, 3311. [Google Scholar] [CrossRef]
- Schulte-Römer, N.; Meier, J.; Söding, M.; Dannemann, E. The LED Paradox: How light pollution challenges experts to reconsider sustainable lighting. Sustainability 2019, 11, 6160. [Google Scholar] [CrossRef]
- Terrich, T.; Balsky, M. The Effect of Spill Light on Street Lighting Energy Efficiency and Light Pollution. Sustainability 2022, 14, 5376. [Google Scholar] [CrossRef]
- Bullock, K.L.; Malan, G.; Pretorius, M.D. Mammal and bird road mortalities on the Upington to Twee Rivieren main road in the southern Kalahari, South Africa. Afr. Zool. 2011, 46, 60–71. [Google Scholar] [CrossRef]
- Dean, W.R.J.; Seymour, C.L.; Joseph, G.S.; Foord, S.H. A review of the impacts of roads on wildlife in semi-arid regions. Diversity 2019, 11, 81. [Google Scholar] [CrossRef]
- Finch, D.; Smith, B.R.; Marshall, C.; Coomber, F.G.; Kubasiewicz, L.M.; Anderson, M.; Wright, P.G.R.; Mathews, F. Effects of artificial light at night (Alan) on european hedgehog activity at supplementary feeding stations. Animals 2020, 10, 768. [Google Scholar] [CrossRef] [PubMed]
- Jackson, H.D. A field survey to investigate why nightjars frequent roads at night. Ostrich 2003, 74, 97–101. [Google Scholar] [CrossRef]
- Agramelal, F.; Sadik, M.; El Hannani, A.; Moubarak, Y. A Traffic-Aware Street Lighting System Based on Fuzzy Logic Controller. In Proceedings of the 2022 IEEE 18th International Colloquium on Signal Processing & Applications (CSPA), Kula Lumpur, Malaysia, 12 May 2022; pp. 132–137. [Google Scholar] [CrossRef]
- Asif, M.; Shams, S.; Hussain, S.; Bhatti, J.A.; Rashid, M.; Zeeshan-ul-Haque, M. Adaptive Control of Streetlights Using Deep Learning for the Optimization of Energy Consumption during Late Hours. Energies 2022, 15, 6337. [Google Scholar] [CrossRef]
- Avotins, A.; Adrian, L.R.; Porins, R.; Apse-Apsitis, P.; Ribickis, L. Smart City Street Lighting System Quality and Control Issues To Increase Energy Efficiency and Safety. Balt. J. Road Bridg. Eng. 2021, 16, 28–57. [Google Scholar] [CrossRef]
- Gagliardi, G.; Lupia, M.; Cario, G.; Tedesco, F.; Gaccio, F.C.; Lo Scudo, F.; Casavola, A. Advanced adaptive street lighting systems for smart cities. Smart Cities 2020, 3, 1495–1512. [Google Scholar] [CrossRef]
- Tukymbekov, D.; Saymbetov, A.; Nurgaliyev, M.; Kuttybay, N.; Dosymbetova, G.; Svanbayev, Y. Intelligent autonomous street lighting system based on weather forecast using LSTM. Energy 2021, 231, 120902. [Google Scholar] [CrossRef]
- Ciobanu, I.; Ciurescu-ţibrian, M. Energy efficiency increase in public lighting systems. UPB Sci. Bull. Ser. C Electr. Eng. Comput. Sci. 2021, 83, 379–389. [Google Scholar]
- Duinea, A.M.; Stan Ivan, F.E. Solution for modernizing the public street lighting system with led type lamps and remote management. J. Sustain. Energy 2021, 12, 71–76. [Google Scholar]
- Cengiz, M.S. Role of Functional Illumination Urban Beautification: Qatar-Doha Road Illumination Case. Light Eng. 2022, 30, 34–42. [Google Scholar] [CrossRef]
- Lou, D.; Wei, Y. Vertical Illuminance Uniformity for LED Road Lighting. In Proceedings of the 2021 18th China International Forum on Solid State Lighting & 2021 7th International Forum on Wide Bandgap Semiconductors (SSLChina: IFWS), Shenzhen, China, 6–8 December 2021; pp. 180–183. [Google Scholar] [CrossRef]
- Zalesinska, M.; Wandachowicz, K. On the quality of street lighting in pedestrian crossings. Energies 2021, 14, 7349. [Google Scholar] [CrossRef]
- Jaskowski, P.; Tomczuk, P. Measurement systems used in measuring the illuminance of the road. In Proceedings of the Second Balkan Junior Conference on Lighting (Balkan Light Junior), Plovdiv, Bulgaria, 19–21 September 2019. [Google Scholar] [CrossRef]
- EN 13201-3:2015; Road lighting—Part 3: Calculation of Performance. European Committee for Standardisation: Brussels, Belgium, 2015.
- Gibbons, R.B.; Meyer, J. Development of a Mobile Measurement System for Roadway Lighting; National Surface Transportation Safety Center for Excellence: Blacksberg, VA, USA, 2018; p. 33. [Google Scholar]
- Johnson, M.; Fabregas, A.; Wang, Z.; Katkoori, S.; Lin, P.S. Embedded system design of an advanced illumination measurement system for highways. In Proceedings of the 8th Annual IEEE Systems Conference (SysCon 2014), Ottawa, ON, Canada, 31 March–3 April 2014; pp. 579–586. [Google Scholar] [CrossRef]
- Zhou, H.; Pirinccioglu, F.; Hsu, P. A new roadway lighting measurement system. Transp. Res. Part C Emerg. Technol. 2009, 17, 274–284. [Google Scholar] [CrossRef]
- Tomczuk, P.; Chrzanowicz, M.; Jaskowski, P.; Budzynski, M. Evaluation of street lighting efficiency using a mobile measurement system. Energies 2021, 14, 3872. [Google Scholar] [CrossRef]
- De Paula Veronese, L.; Badue, C.; Auat Cheein, F.; Guivant, J.; De Souza, A.F. A single sensor system for mapping in GNSS-denied environments. Cogn. Syst. Res. 2019, 56, 246–261. [Google Scholar] [CrossRef]
- Kozłowski, M.; Czerepicki, A.; Jaskowski, P.; Aniszewski, K. Analysis of the system of controlling paid parking zones. Sustainability 2021, 13, 4211. [Google Scholar] [CrossRef]
- Texas Instruments Product Sheet. Available online: https://www.ti.com/ (accessed on 31 October 2022).
- StatSoft The Internet Handbook of Statistics. Krakow. 2006. Available online: http://www.statsoft.pl/textbook/stathome.html (accessed on 31 October 2022).
- Yeh, T.-M.; Pai, F.-Y.; Huang, C.-W. Using Fuzzy Theory in %GR&R and NDC of Measurement System Analysis. Engineering 2015, 07, 161–176. [Google Scholar] [CrossRef]
- Mazu, M.J. Design and Analysis of Gauge R&R Studies. Technometrics 2006, 48, 305. [Google Scholar] [CrossRef]
- PN-EN 13201-2:2015; Oświetlenie dróg Część 2: Wymagania Eksploatacji. Europejski Komitet Normalizacyjny: Brussels, Belgium, 2015.
- Zarząd Dróg Miejskich w Warszawie (Municipal Roads Authority in Warsaw). Available online: https://zdm.waw.pl/ (accessed on 31 October 2022).
| Publisher’s Note: MDPI stays neutral with regard to jurisdictional claims in published maps and institutional affiliations. |
© 2022 by the authors. Licensee MDPI, Basel, Switzerland. This article is an open access article distributed under the terms and conditions of the Creative Commons Attribution (CC BY) license (https://creativecommons.org/licenses/by/4.0/).


