Article

Influencing Factors of a Cooling System Based on Low-Temperature Mine Water as a Direct Cooling Source

1
Yiliang Chihong Mining Co., Ltd., Zhaotong 657000, China
2
School of Safety Engineering, China University of Mining and Technology, Xuzhou 221116, China
*
Author to whom correspondence should be addressed.
Energies 2022, 15(23), 9071; https://doi.org/10.3390/en15239071
Submission received: 4 November 2022 / Revised: 25 November 2022 / Accepted: 28 November 2022 / Published: 30 November 2022

Abstract

:
With the depletion of shallow metal mineral resources, deep mining has become more common. In the process of deep mining, heat hazards in mines seriously threaten the health of personnel and the safety of mining operations. According to the flow and low-temperature characteristics of abundant water in Maoping Lead Zinc Mine, this paper proposes the direct use of the low-temperature water inflow of the mine as the cold source by which to conduct the heat exchange with a single spiral-tube heat exchanger for mine cooling. An experimental platform was built for the cooling system to allow us to explore the mechanism of the influence of the inlet air volume and air temperature and the inlet water temperature and flow on the cooling effect of the single spiral-tube heat exchanger. It was found that with the increase in the inlet air volume and inlet water temperature, the cooling efficiency of the heat exchanger decreased, while with the increase in the inlet air temperature, the cooling efficiency of the heat exchanger increased. Within the experimental range, 127.2 m3/h was found to be the optimum inlet air volume, and 33.0 °C was the most appropriate inlet air temperature; the water temperature of Maoping Coal Mine is about 20 °C throughout the year, and the industrial test site can reduce the wind temperature of 31.5 °C to 23.9 °C. The inlet water flow is positively related to the cooling effect. With the increase in the water flow, the outlet temperature of the air flow at each working point was continuously reduced, and the cooling effect of the heat exchanger was improved. The moisture content of the inlet air flow can be reduced by increasing the low-temperature inlet water flow. Through experiments, the feasibility of the cooling system that directly uses the mine’s low-temperature water as the cold source was verified. A multiple linear regression analysis equation for the cooling system model is proposed, which provides a reference for formulating effective measures to prevent and control heat hazards in mines.

1. Introduction

Metal mineral resources are indispensable strategic resources for the national economy and high-tech industries. In recent years, with the progress of science and technology in China, the mining capacity of mine resources has been greatly improved, and mines have gradually entered the deep mining stage. There are more than 100 metal mines with a mining depth of more than 1000 m abroad, and the maximum mining depth of some mines has reached 3000~4000 m [1]. At present, deep-well mining has three outstanding characteristics: high temperature, plateau rock stress, and high osmotic pressure [2]. The self-compression heat release when the air flow flows downward, geothermal heat, heat dissipation during the operation of mechanical and electrical equipment, and heat dissipation of minerals and gangue during transportation are the main causes of high temperatures in the mine [3]. High-temperature working environments cause workers to carry out their work in poor working conditions and affect production efficiency; they also increase the probability of accidents. More seriously, heat hazards can lead to a series of occupational health problems such as dehydration, sodium loss, reduced blood volume, increased blood pressure, and increased blood viscosity of the operators, leading to fatigue and heatstroke. In severe cases, heat cramps, collapse, and even death can occur, which can also cause chronic physical and mental diseases [4].
To date, scholars have conducted in-depth research on mine-cooling technology. Staden [5] proposed the optimization of mobile cooling devices, thereby reducing operating costs by saving power costs and improving underground ventilation air temperature. Chen [6] proposed an air conditioning system for compressed air cooling of mines, elaborated the basic principle of the air conditioning system, and carried out a feasibility analysis. Wang [7] and Cao et al. [8] successfully used heat electricity glycol technology to control deep-well heat hazards, which not only solved the gas problem of the coal mine, but also provided sufficient power for the coal mine. He et al. [9], based on the specific engineering background of Jiahe Coal Mine, proposed for the first time the establishment of a new cooling system with underground water inflow as the cold source, and innovatively proposed the high-temperature exchange machinery system (HEMS) and equipment. Zhang et al. [10] established a three-dimensional heat transfer model of the working face, and they found that the greater the distance from the air flow inlet, the more obvious the cooling effect. Pokhrel et al. [11] proposed that solar energy be used to deploy ice storage systems, and the ice generated can be used for cooling in deep mines through different heat exchangers. Wang et al. [12] proposed a new cooling method to solve the problem of the high cooling costs of mines. In the field of filling mining, the cooling function of cemented paste filling is endowed by mixing it with phase-change materials. Crawford et al. [13] proposed an optimized dynamic control strategy to optimize the control of the mine cooling system and proved that the strategy is effective in reducing costs, while showing significant performance improvements in South African mines. Zhang et al. [14] analyzed the energy consumption of each subsystem during the operation of a mine water cooling system, providing a theoretical basis and technical guidance for the efficient operation of cooling systems in the future. Wang et al. [15] established a local cooling system based on a water source heat pump; solved the problems of water supply, heat removal, and the cooling of the local cooling system; reduced the investment and operating costs; and improved the refrigeration efficiency. Nikodem et al. [16] investigated the actual air cooling efficiency through research on air cooling devices of six hard coal mines, and the results obtained allowed a more accurate identification of the factors that reduced the efficiency of the cooling system of the mining plant under analysis. Although the current literature is relatively comprehensive, there is still a lack of detailed discussion on the factors affecting the cooling effect of cooling systems.
Maoping Lead Zinc Mine is located in Yiliang County, Yunnan Province. The mining area is 5.3186 km2 in total, and the mine production scale is 150 kt/a. We propose a method that directly uses the low-temperature water inflow of the mine as the cold source of the single spiral-tube heat exchanger to cool the stope based on the thermal hazard present in Maoping Lead Zinc Mine and the characteristics of the water inflow of the same mine, which is sufficiently low and abundant. First, the heat source of the mine was analyzed. Then, the water quality of the mine’s water inflow was analyzed and tested to verify its feasibility as a direct cooling source. Finally, a cooling system based on the mine’s water inflow as a direct cooling source was established, and an experimental platform for the cooling system was built. Based on the platform, experiments were carried out to change four factors, namely, the air volume and temperature of the inlet air flow and the temperature and flow of the inlet low-temperature water flow. The effects of these four different factors on the cooling system were studied and analyzed, and we obtained the relevant laws. This method not only helped solve the thermal hazard problem of Maoping Lead Zinc Mine and reduce the cooling cost of the whole mine cooling system, but also achieved the unification of the mine’s water energy utilization and thermal hazard management, providing reference value for future projects [17].

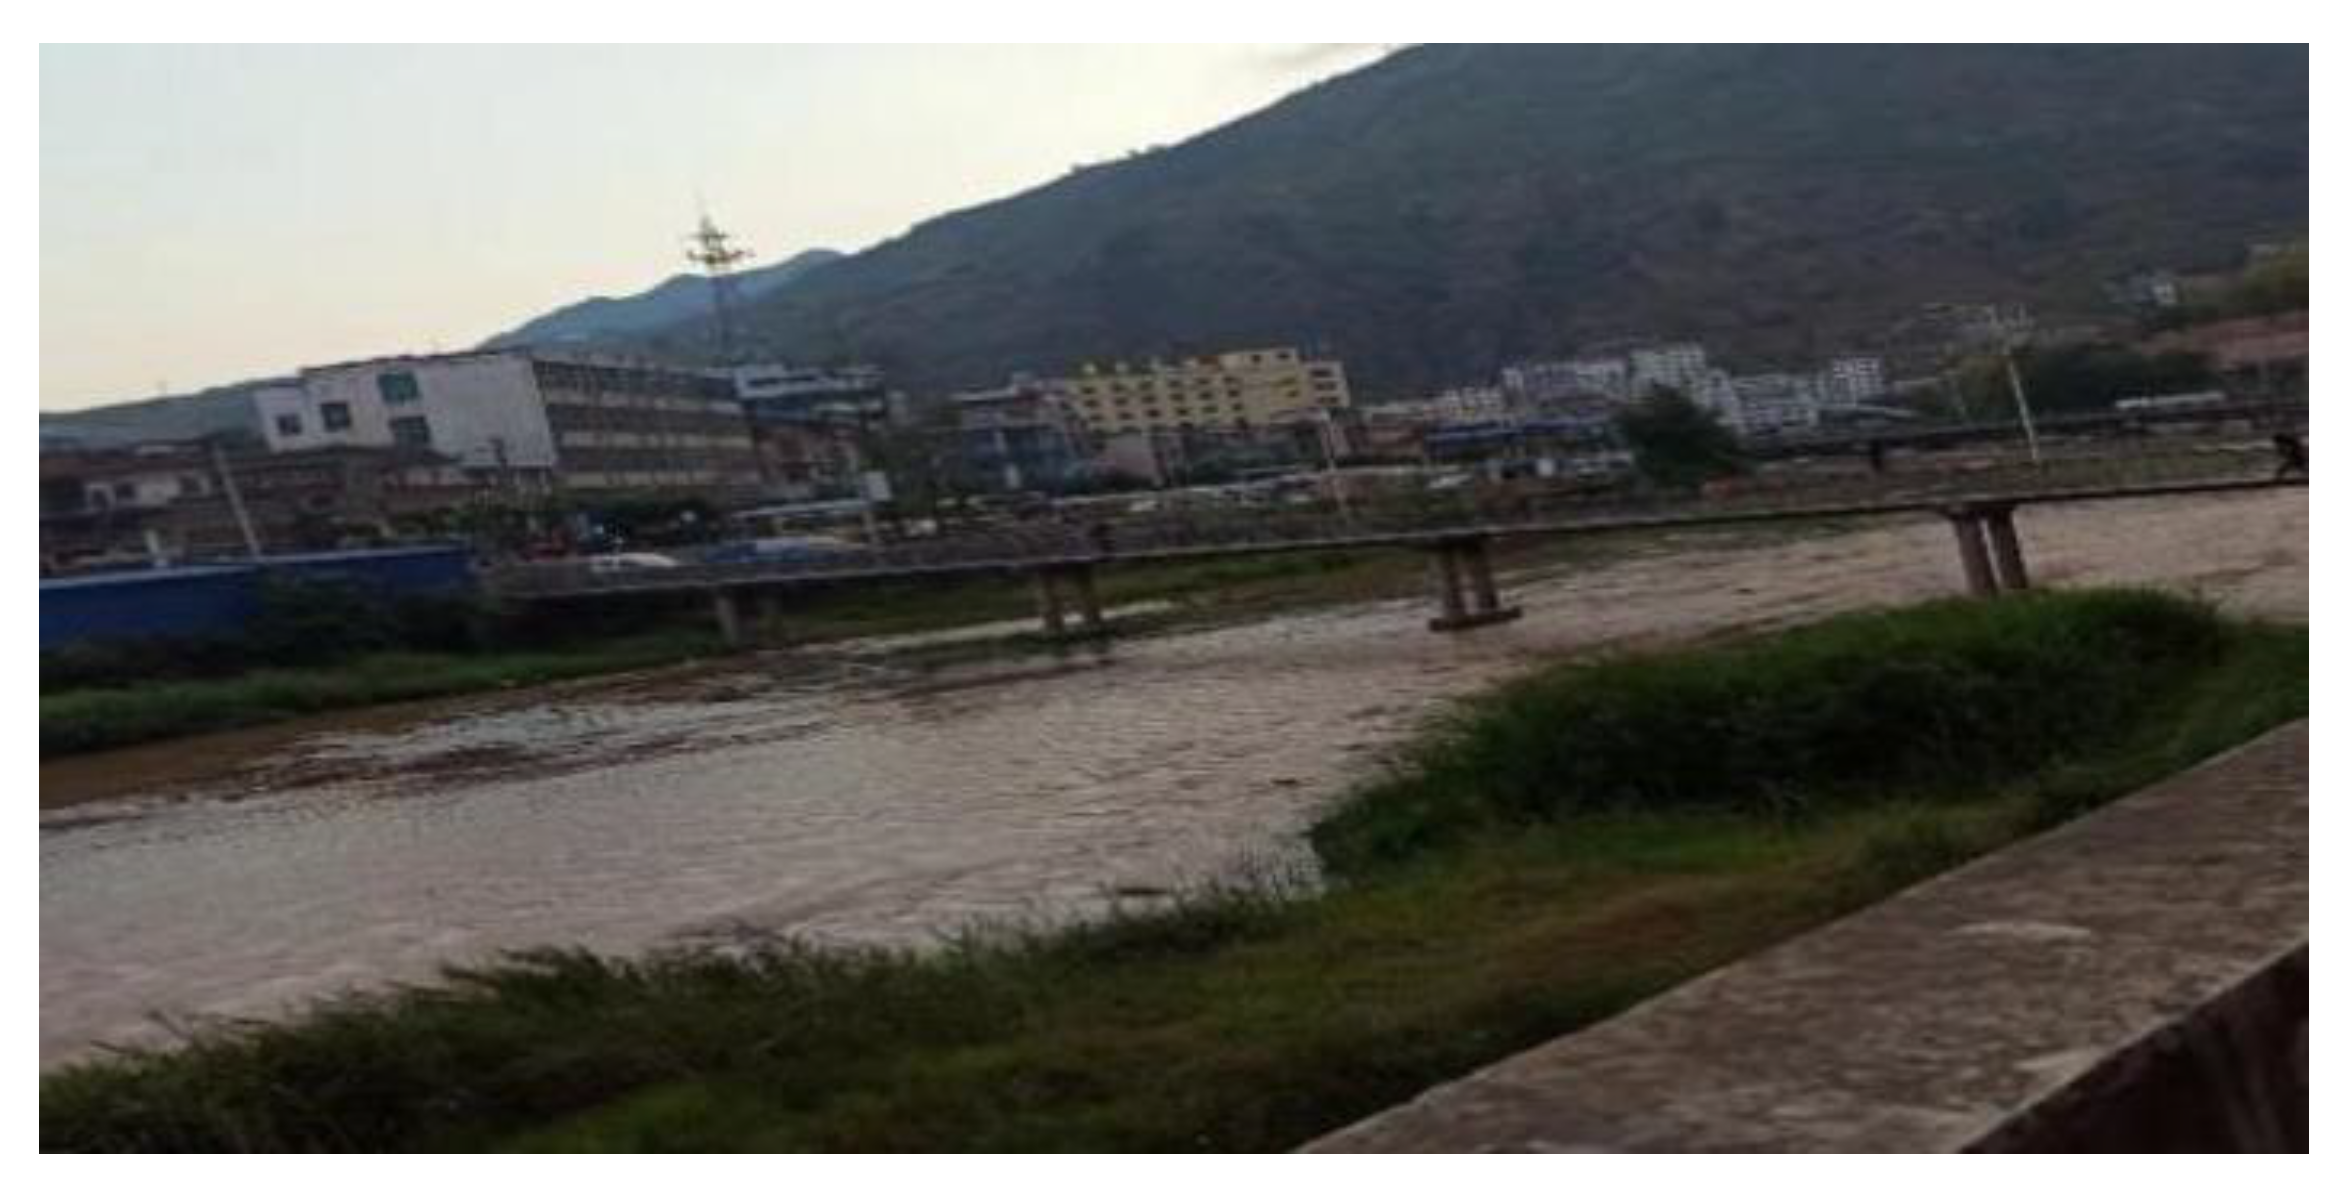
2. Analysis of Heat Source and Water Quality of Maoping Lead Zinc Mine

2.1. Heat Source Analysis

Metal mining and coal mining methods are different. Under normal circumstances, coal mines are mined using large mechanized equipment, while metal mines are often mined using the blasting and filling method [18]. The specific heat sources are summarized as shown in Table 1.

2.2. Water Quality Analysis of Mine Gushing Water

The water level elevation of the mine is 670~750 m. At present, the drainage volumes in the Hedong District and Hexi District of the mine are 23,000~28,000 m3/d and 4500~12,000 m3/d, respectively. The water samples were taken from the water tank in the middle 670 section of Maoping Lead Zinc Mine, the 5 # machine room in the middle 610 section, and the underground roadway. According to the requirements of each project, the test results were compared with the inspection standard limits. The results showed that the three water samples collected in different locations of Maoping Lead Zinc Mine were colorless, odorless, had low turbidity, and were basically free of sediment, that is, they could be used directly without sedimentation treatment; the PH value of the three water samples is about 7.5, all of which are neutral water and are basically non-corrosive to pipelines and downhole equipment. Compared with other testing standards, it was found that the water gushing under Maoping Lead Zinc Mine is basically lower than the detection limit, meeting the requirements for industrial water quality. According to a comprehensive analysis, we found that this water sample has no sediment, is not highly corrosive to equipment and pipes, and will not pollute the environment after discharge. Moreover, the water temperature of Maoping Lead Zinc Mine is kept at about 20 °C throughout the year, so it can be used as a water source for the mine cooling system. Mine drainage distribution map is shown in Figure 1.

3. Materials and Methods

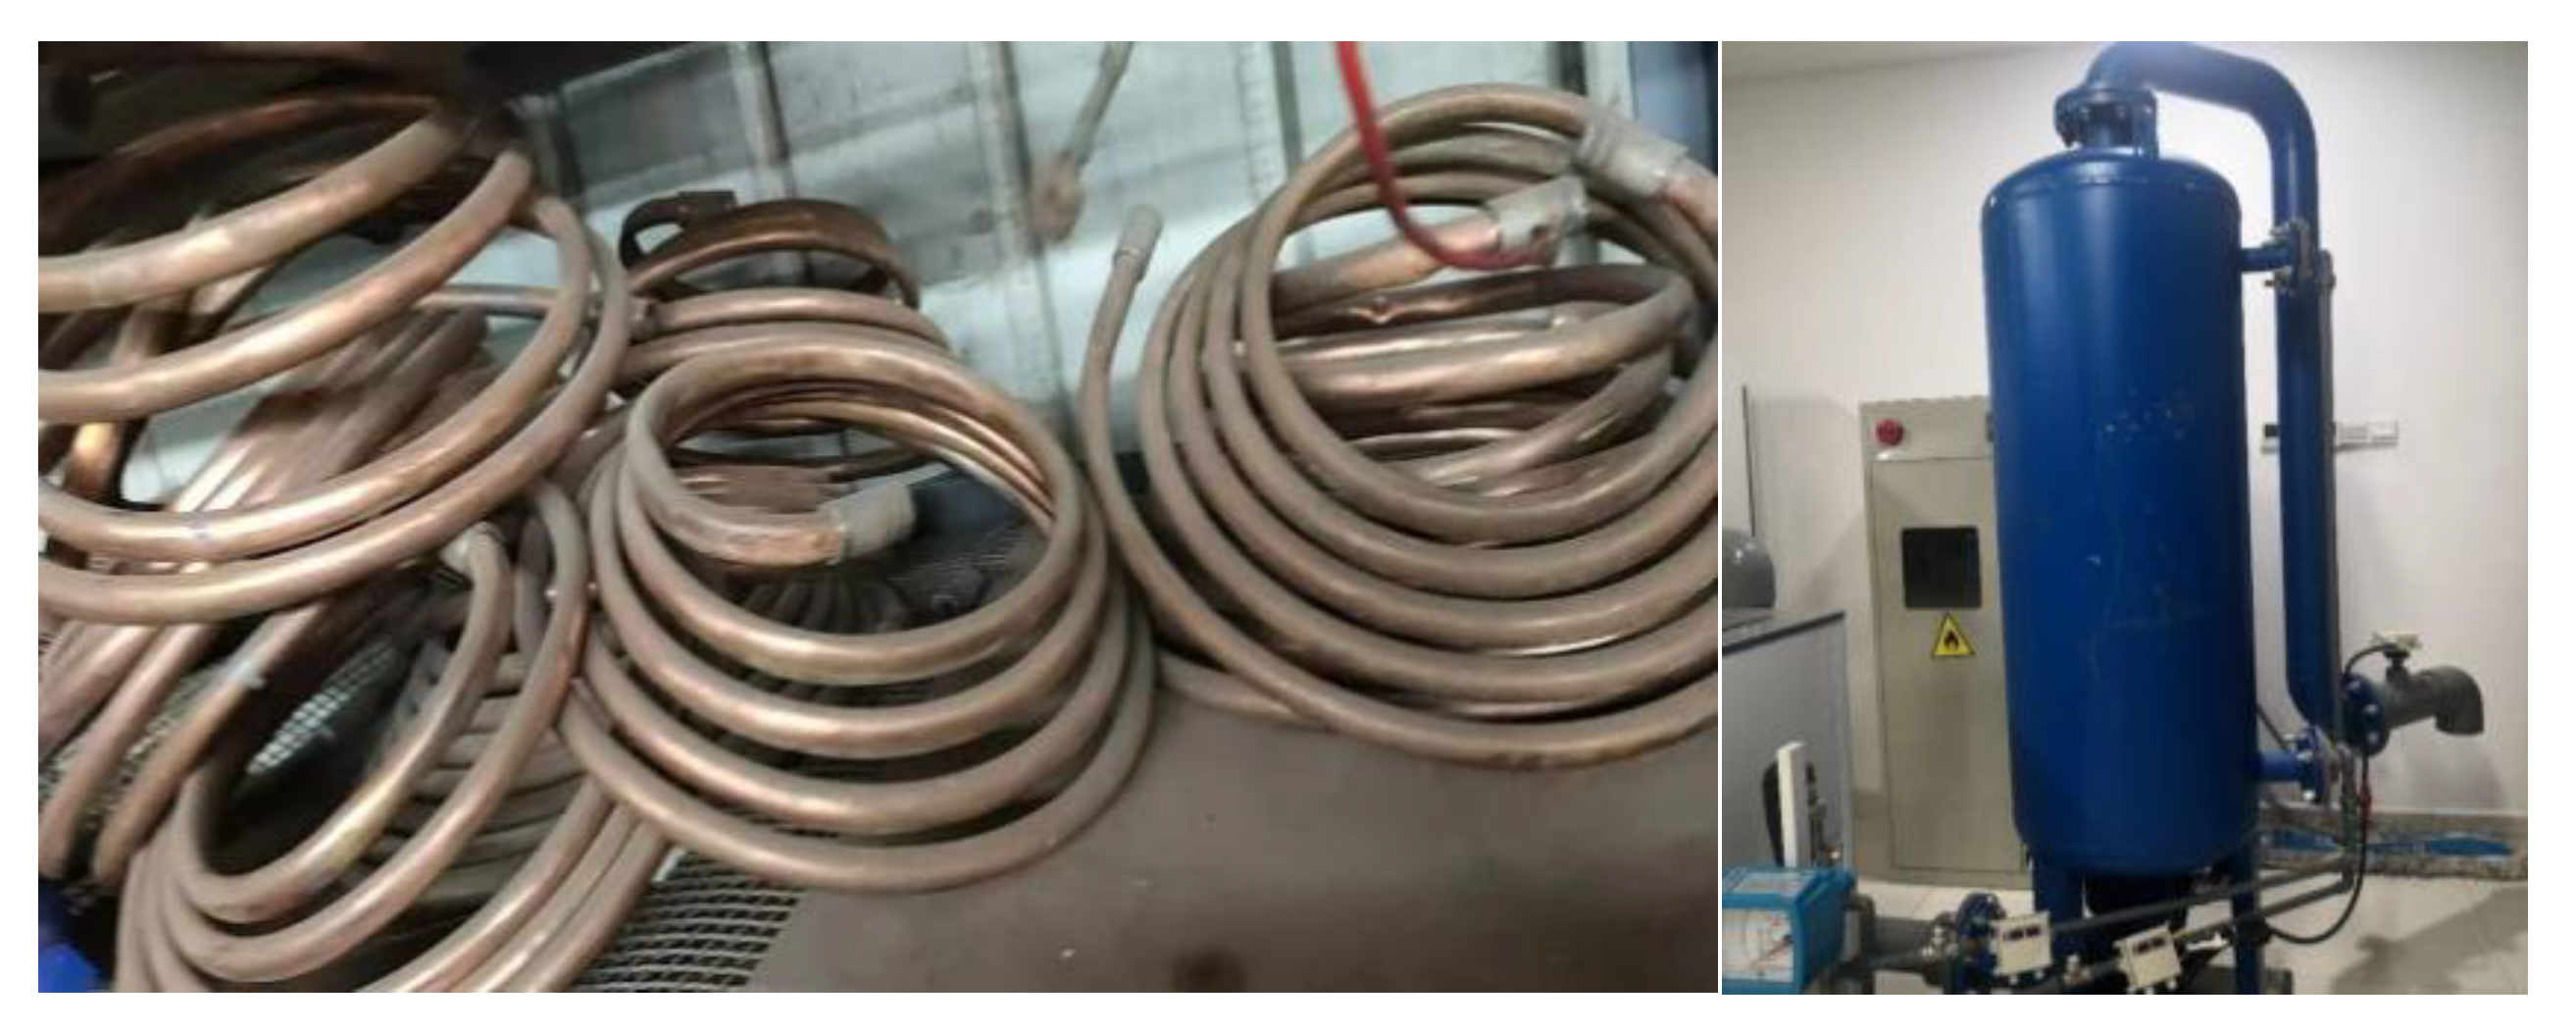
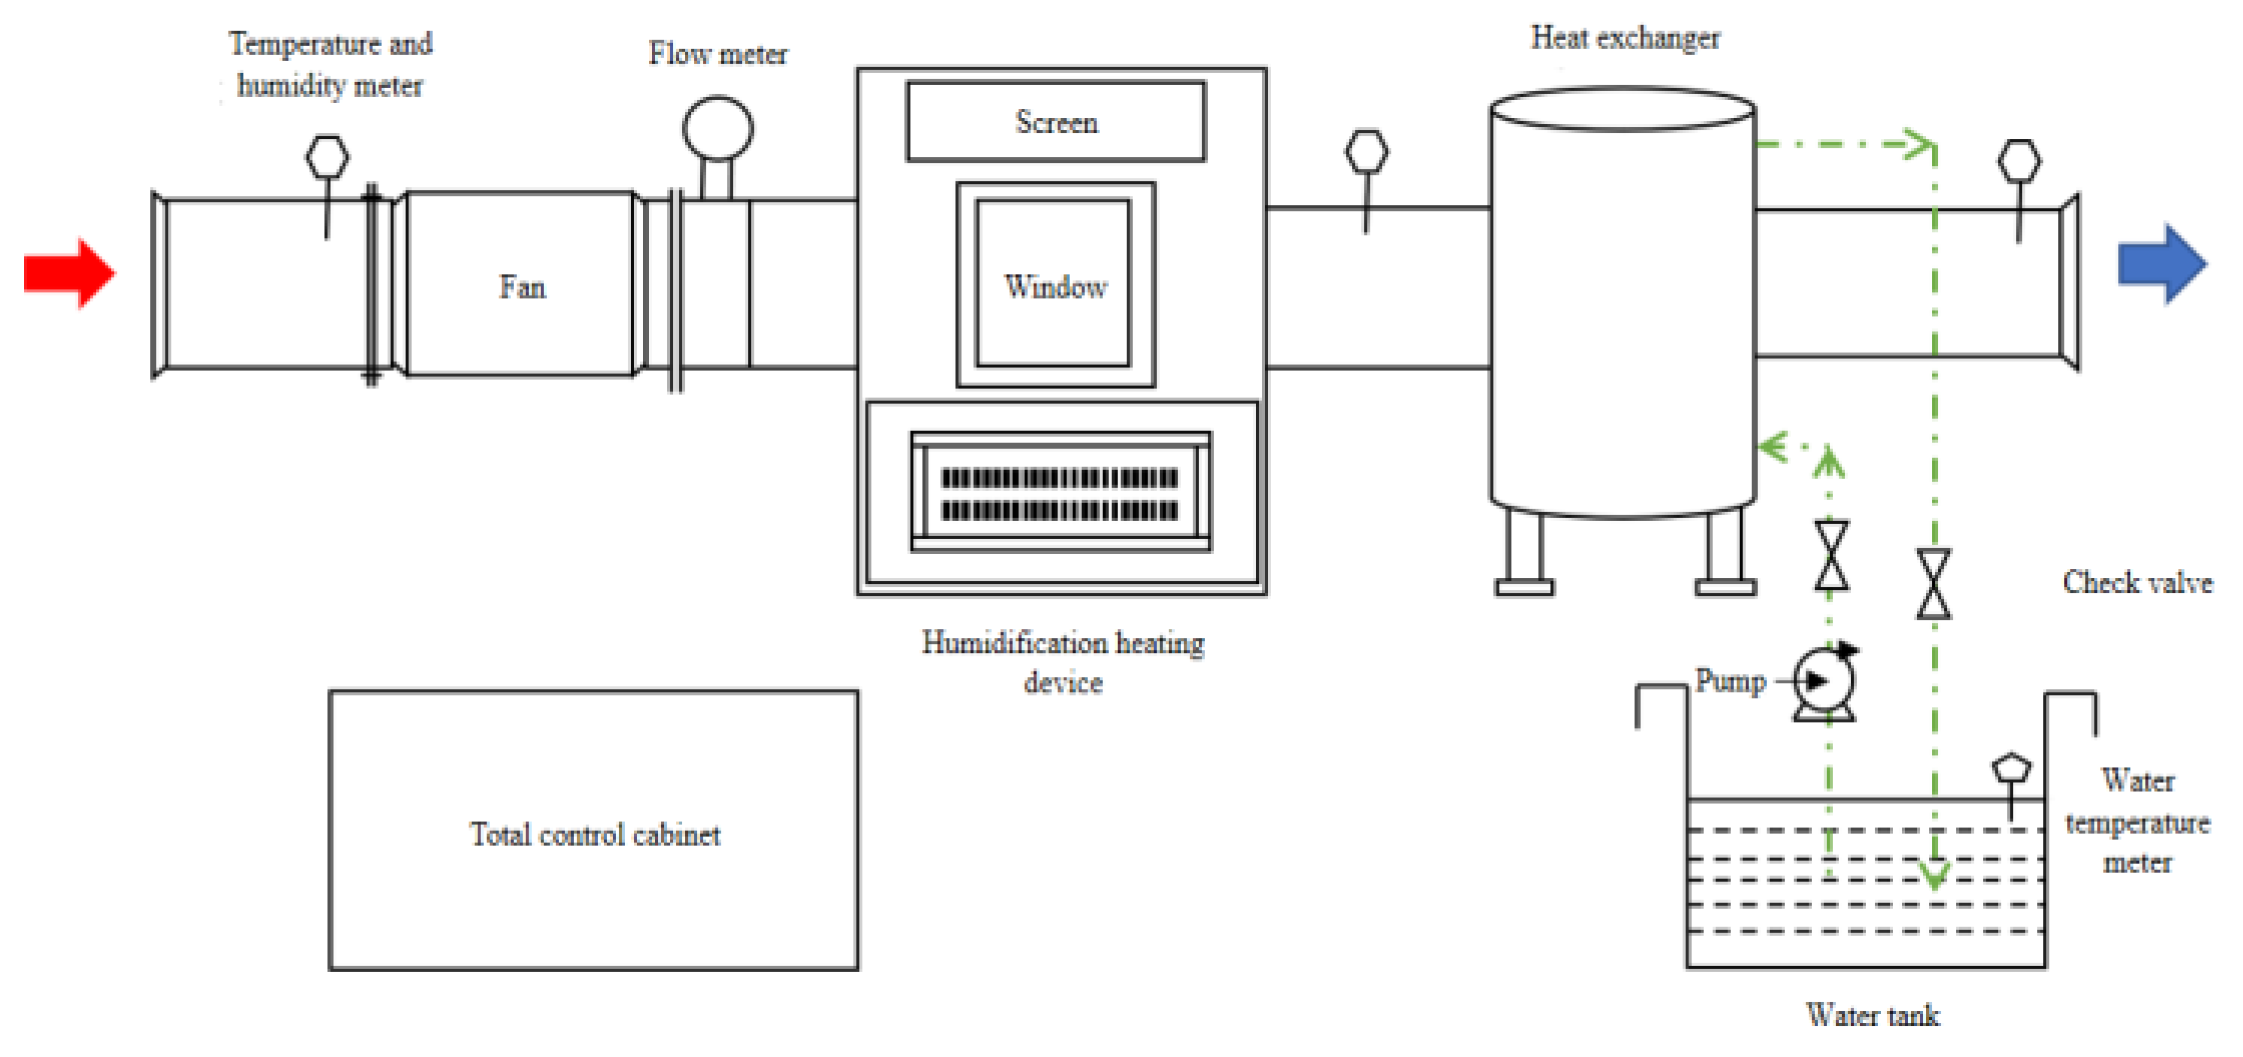
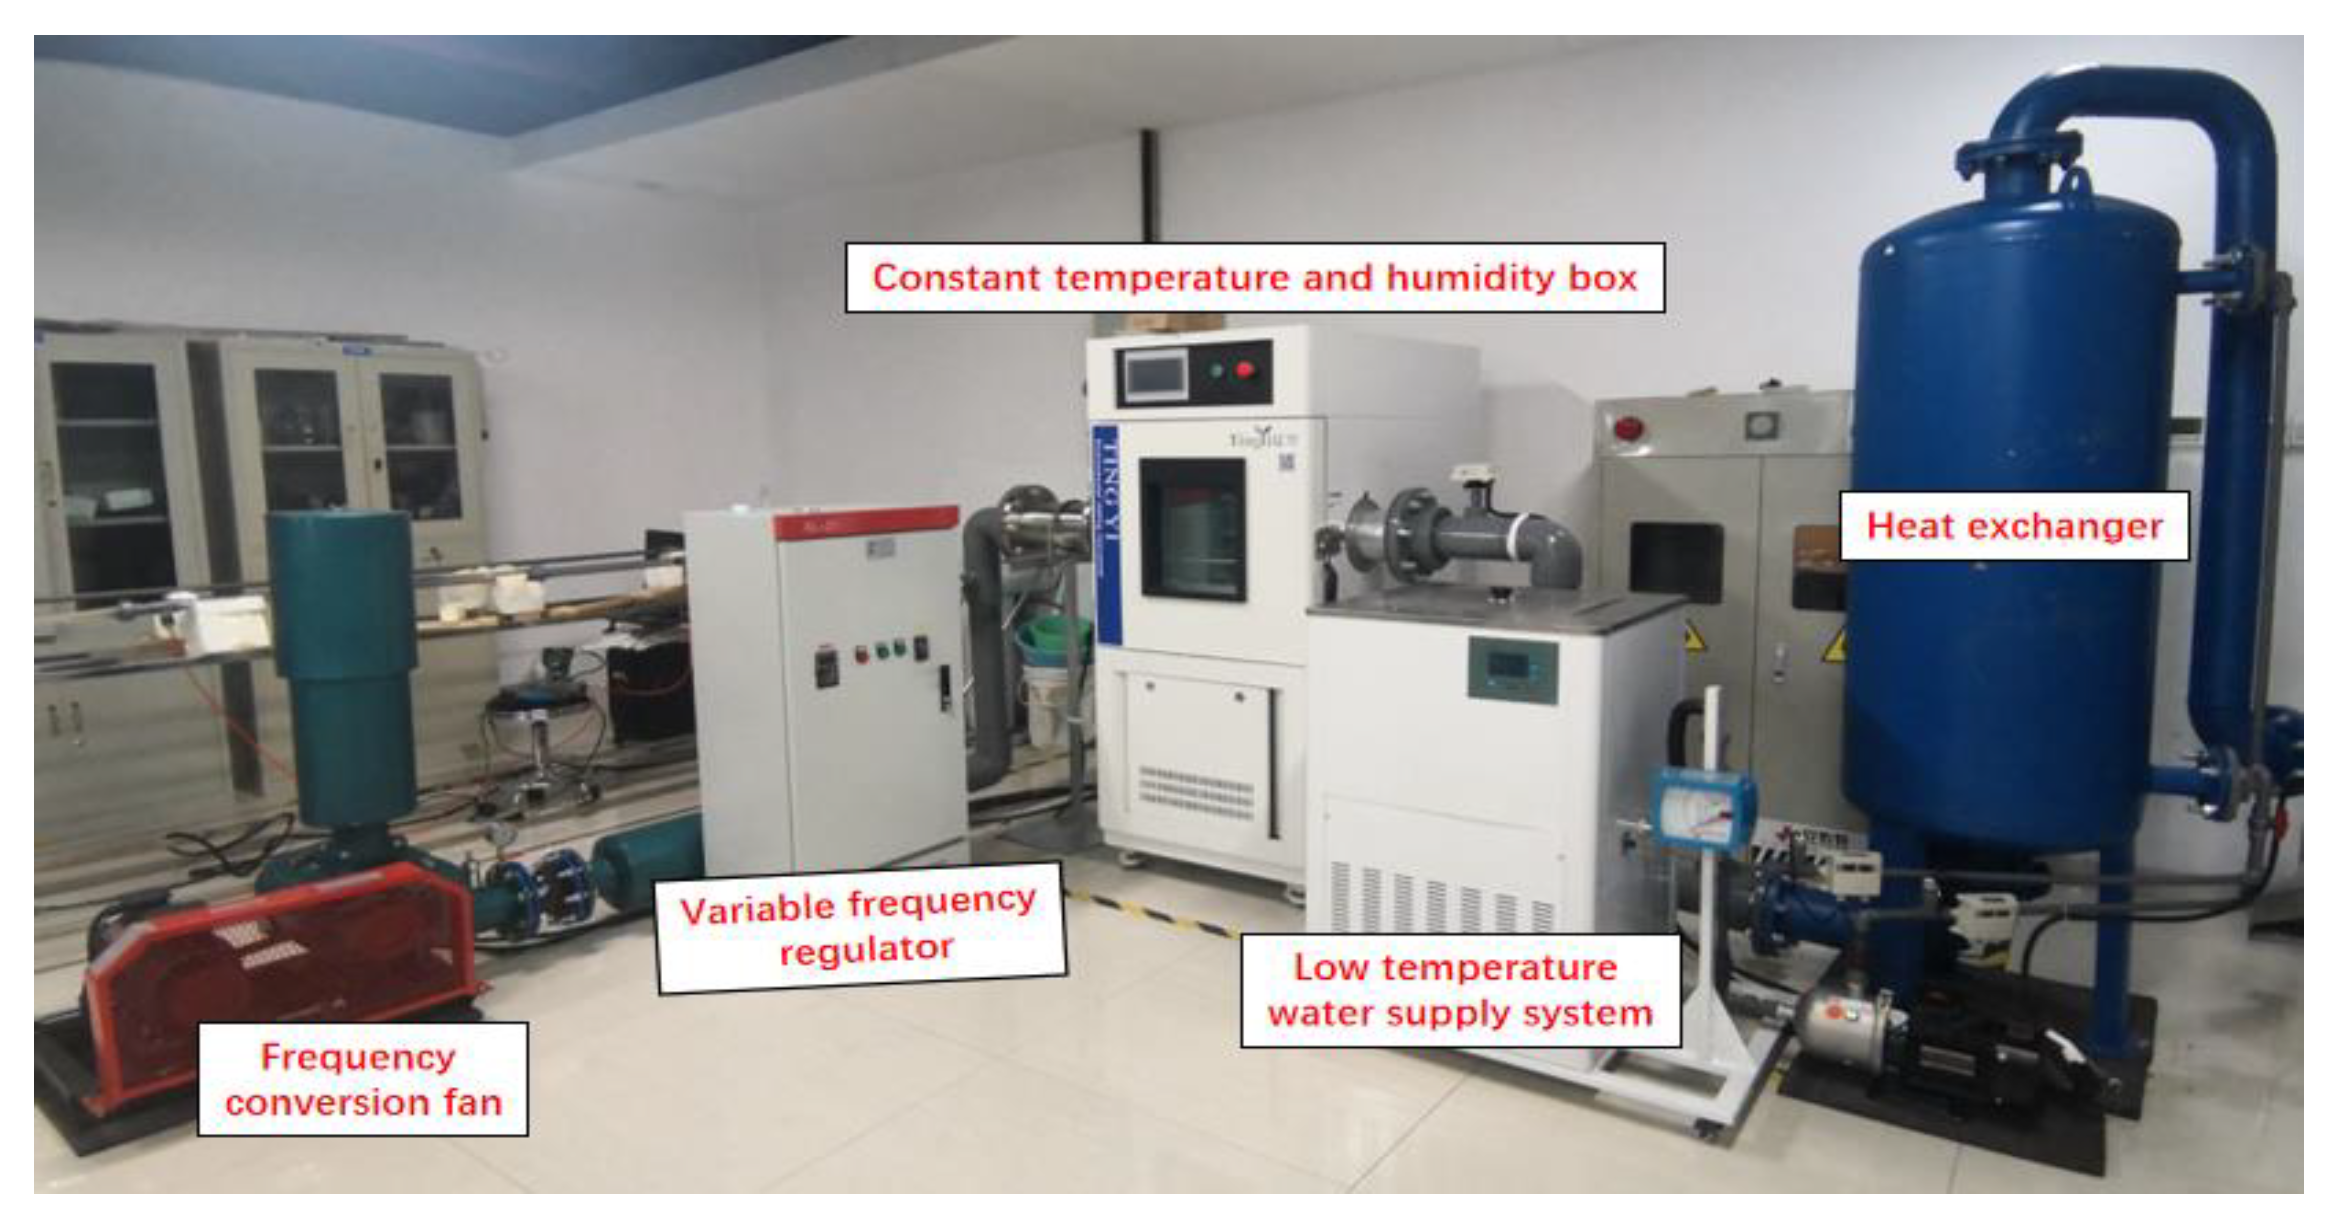
3.1. Parameters and Composition of the Experimental Platform

The underground cooling system is mainly composed of an air supply system, a water supply system, a heat exchange system, connecting pipelines, and various monitoring equipment. The heat exchange system is the core of the cooling system. The tank body has a diameter of 600 mm and a height of 1800 mm. The inside of the heat exchanger is a single spiral-wound copper tube with a diameter of 20 mm. Water at a constant temperature circulates continuously inside the spiral tube. The heat exchanger is the place where the air flow pipeline meets the water flow pipeline. The hot and wet air from the air inlet section exchanges heat with the low-temperature water inside the heat exchanger to achieve the purpose of cooling the air flow. The low-temperature air flow after cooling is discharged from the outlet of the heat exchanger, and the high-temperature water after heat absorption flows back to the low-temperature water tank from the outlet. The structure of the single spiral-tube heat exchanger is shown in Figure 2, and its working principle is shown in Figure 3.
According to the schematic diagram of the cooling system shown in Figure 3, a physical experiment platform for the cooling system based on low-temperature mine water as a direct cold source was built, as shown in Figure 4. The inlet air flow simulated the underground high-temperature and high-humidity air flow. According to the above section, the temperature of the middle working face was about 29~32 °C, and the underground relative humidity was about 90%. The low-temperature water inflow in the well was kept at 20 °C throughout the year.
When the air was in the standard state, the head-on wind speed could be selected between 1.4~4 m/s to avoid poor a heat transfer effect due to a low wind speed. The designed air duct’s diameter was 15 cm. When the wind speed reached 4 m/s, the air volume was 254.5 m3/h. In the process of heating and humidifying, when the air temperature was 18 °C and the relative humidity was 45%, or when the air temperature was 50 °C and the relative humidity was 90%, the total heating required according to the enthalpy difference method was 6.62 kW, of which the heating capacity for the air was 3.16 kW and the humidifying capacity for the air was 3.46 kW. In the refrigeration process, when the water at 32 °C was cooled to 24 °C, the required cooling capacity was 1.92 kW. According to the cooling capacity, the volume flow of the low-temperature water at 20 °C was 0.27 m3/h, and the estimated pump-regulating flow was 150~500 L/h. According to the calculation results, the equipment required for the various experimental platforms was selected.

3.2. Methods

The cooling effect of low-temperature water with different air volumes, air temperatures, and water volumes was studied through experiments. According to the literature, the wind speed under the experimental condition was selected to be between 2.0 m/s and 4.0 m/s, that is, the air volume at the inlet of the heat exchanger was 127.2 m3/h~254.5 m3/h; the temperature of the working face in the middle section was measured to be 29 °C~32 °C; and the temperature of the underground water inflow was maintained at about 20 °C throughout the year.
We set the inlet air parameters as follows: temperature: 28.5 °C, 30 °C, 31.5 °C, and 33 °C; relative humidity above 90%; inlet air volume: 127.2 m3/h, 159.1 m3/h, 190.9 m3/h, 222.7 m3/h, and 254.5 m3/h. The low-temperature water parameters were as follows: water temperature: 18.5 °C, 20 °C, and 21.5 °C and water volume: 60~600 L/h. By changing the fan power and the temperature and humidity control of the constant temperature and humidity box, and by changing the temperature and humidity of the air flow entering the pipe and the inlet air volume, the cooling capacities of the 18.5 °C, 20 °C, and 21.5 °C low-temperature water were compared under various air inlet parameters.
During the experiment, the readings were taken 30 min after each working environment point change to ensure the stability of the readings, and the average value of the three readings was taken to avoid experimental errors caused by inaccurate values.

4. Discussion

4.1. Analysis of Factors Influencing the Cooling System

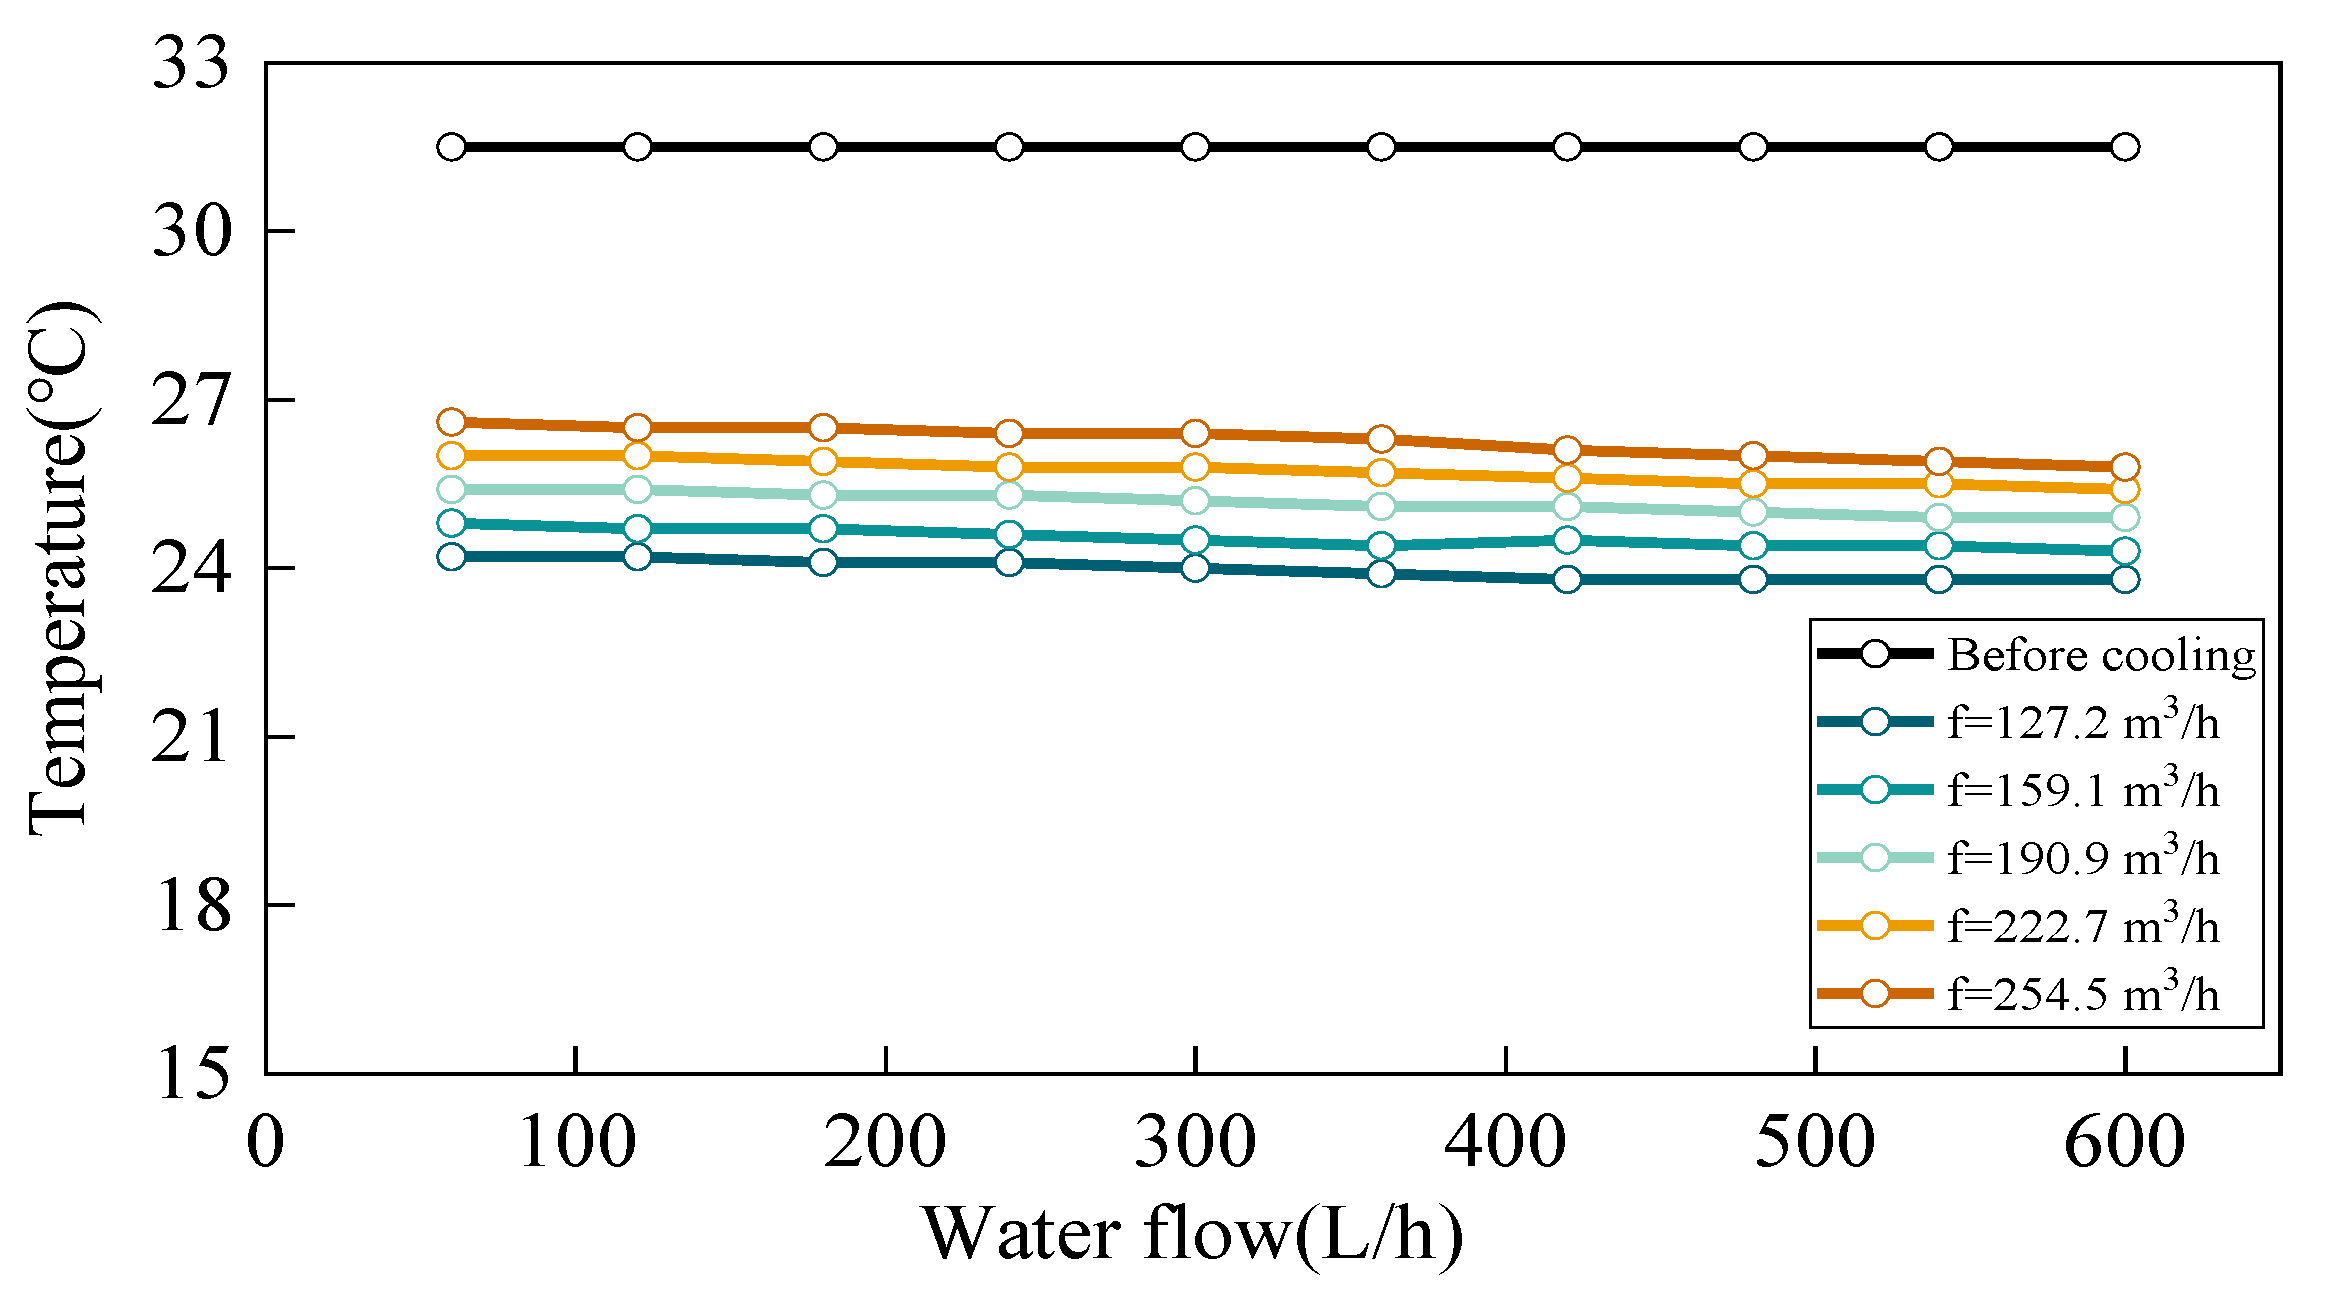
4.1.1. Impact of Inlet Air Volume on Cooling Effect

The temperature of the programmable constant temperature and humidity box was set to 46 °C and the humidity was set to 90% to ensure that the air temperature entering the heat exchanger could reach 31.5 °C and that the humidity could reach more than 90%; the water supply temperature of the water tank was set to 20 °C (closest to the actual situation of the mine); and the inlet air volumes were 127.2 m3/h, 159.1 m3/h, 190.9 m3/h, 222.7 m3/h, and 254.5 m3/h.
As shown in Figure 5, when the water source temperature was 20 °C and the air flow temperature was 31.5 °C, for the air flow with an inlet air volume of 127.2 m3/h, the temperature at the air flow outlet after cooling was about 23.9 °C, which decreased by 7.6 °C. When the inlet air volume increased to 159.1 m3/h, the outlet temperature rose to 24.4 °C and decreased by 7.1 °C; with the increase in air volume to 190.9 m3/h, 222.7 m3/h, and 254.5 m3/h, the air flow outlet temperature of the cooling system rose to about 25.1 °C, 25.7 °C, and 26.1 °C, respectively, which were decreases of 6.4 °C, 5.8 °C, and 5.3 °C, respectively; when the inlet air volume changed from 127.2 m3/h to 254.5 m3/h, the temperature difference between the inlet and outlet of the heat exchanger decreased from 7.6 °C to 5.3 °C, and the cooling efficiency of the cooling system decreased by 8.3%. It was found that when the inlet temperature, humidity, and cooling water temperature were unchanged, the air flow at the inlet of the heat exchanger was increased, and the temperature at the outlet of the air flow became increasingly higher, that is, the temperature of the outlet air flow increased with the increase in the inlet air flow.

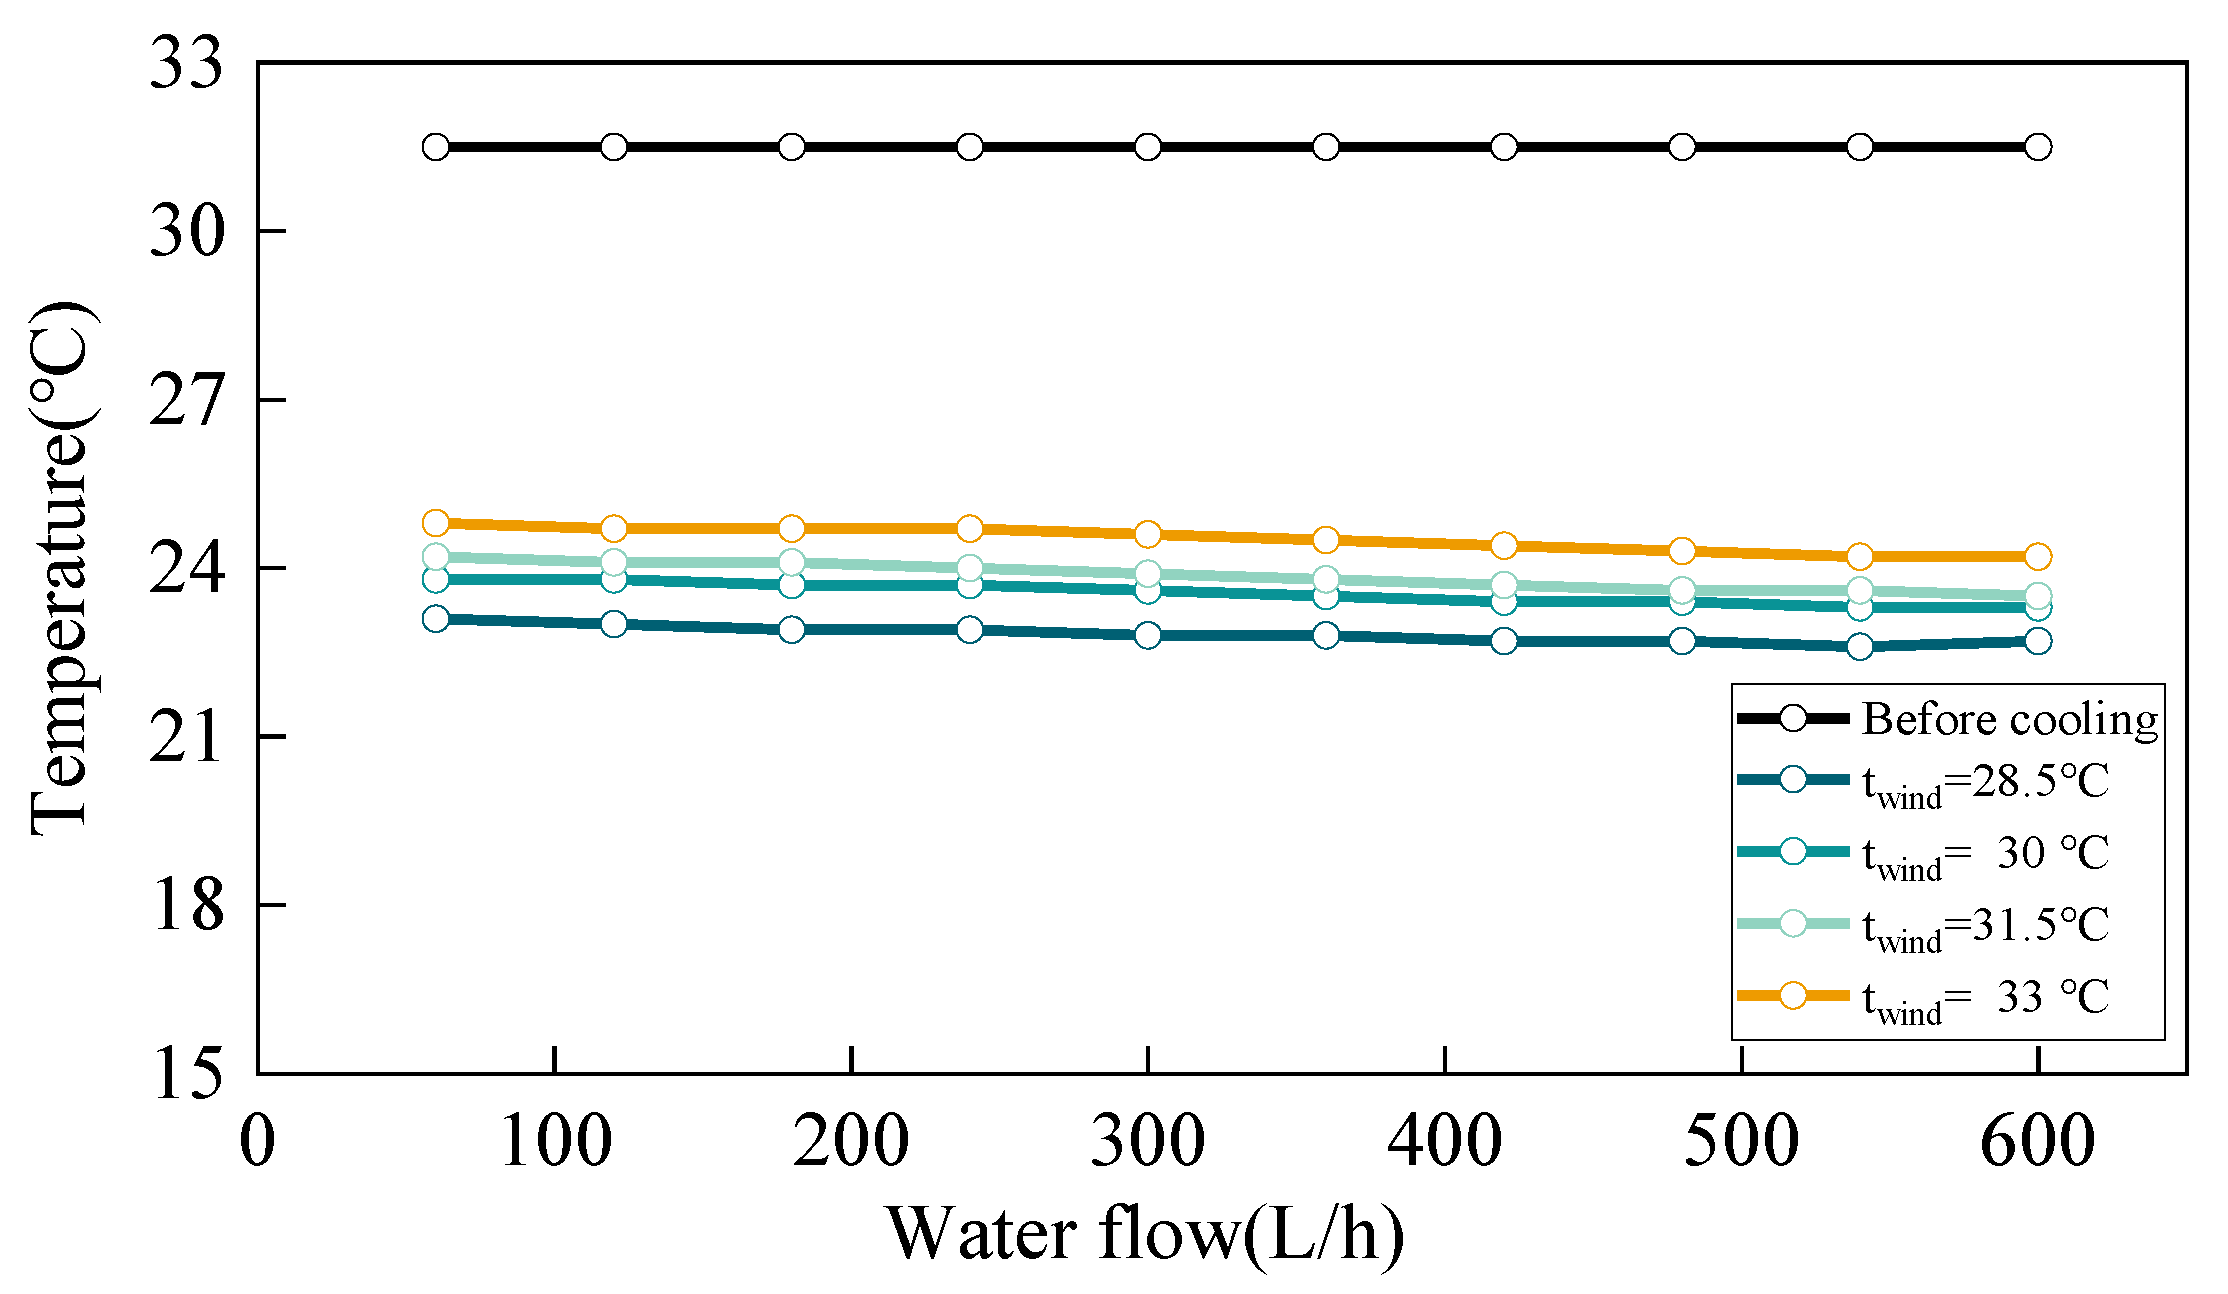
4.1.2. Impact of Inlet Air Temperature on Cooling Effect

The temperature of the water supply was set to 20 °C; the inlet flow rate was set to 127.2 m3/h; and the humidity of the programmable constant temperature and humidity box was set to 90%. The temperature of the inlet air flow was changed by changing the temperature of the programmable constant temperature and the humidity box to allow it reach 28.5 °C, 30.0 °C, 31.5 °C, and 33.0 °C for the cooling experiments.
As shown in Figure 6, when the air flow inlet flow was 127.2 m3/h, the high-temperature air flow of 28.5 °C could be cooled to about 22.9 °C using the low-temperature water with a water source temperature of 20.0 °C. The temperature difference before and after the cooling was 5.6 °C; when the air temperature rose to 30.0 °C, it dropped to about 23.4 °C, and the temperature difference before and after cooling was 6.6 °C; when the air temperature rose to 31.5 °C and 33.0 °C, the air flow outlet temperatures were 23.9 °C and 24.3 °C, respectively, and the temperature differences before and after cooling were 7.6 °C and 8.7 °C, respectively. In the process of changing the air temperature from 28.5 °C to 33.0 °C, the cooling efficiency of the cooling system increased by 6.7%. It was found that with the increase in the air flow temperature, the temperature difference before and after the air flow cooling of the cooling system increased, the cooling capacity was improved, and the air flow speed, humidity, and cooling water temperature remained unchanged. This is because the increase in the inlet air temperature increased the heat transfer temperature difference between the high-temperature air and the low-temperature cold water, thus enhancing the heat transfer inside the whole cooling system and improving the cooling efficiency of the cooling system. Therefore, under certain external conditions, the higher the inlet air temperature, the stronger the cooling capacity of the heat exchanger.

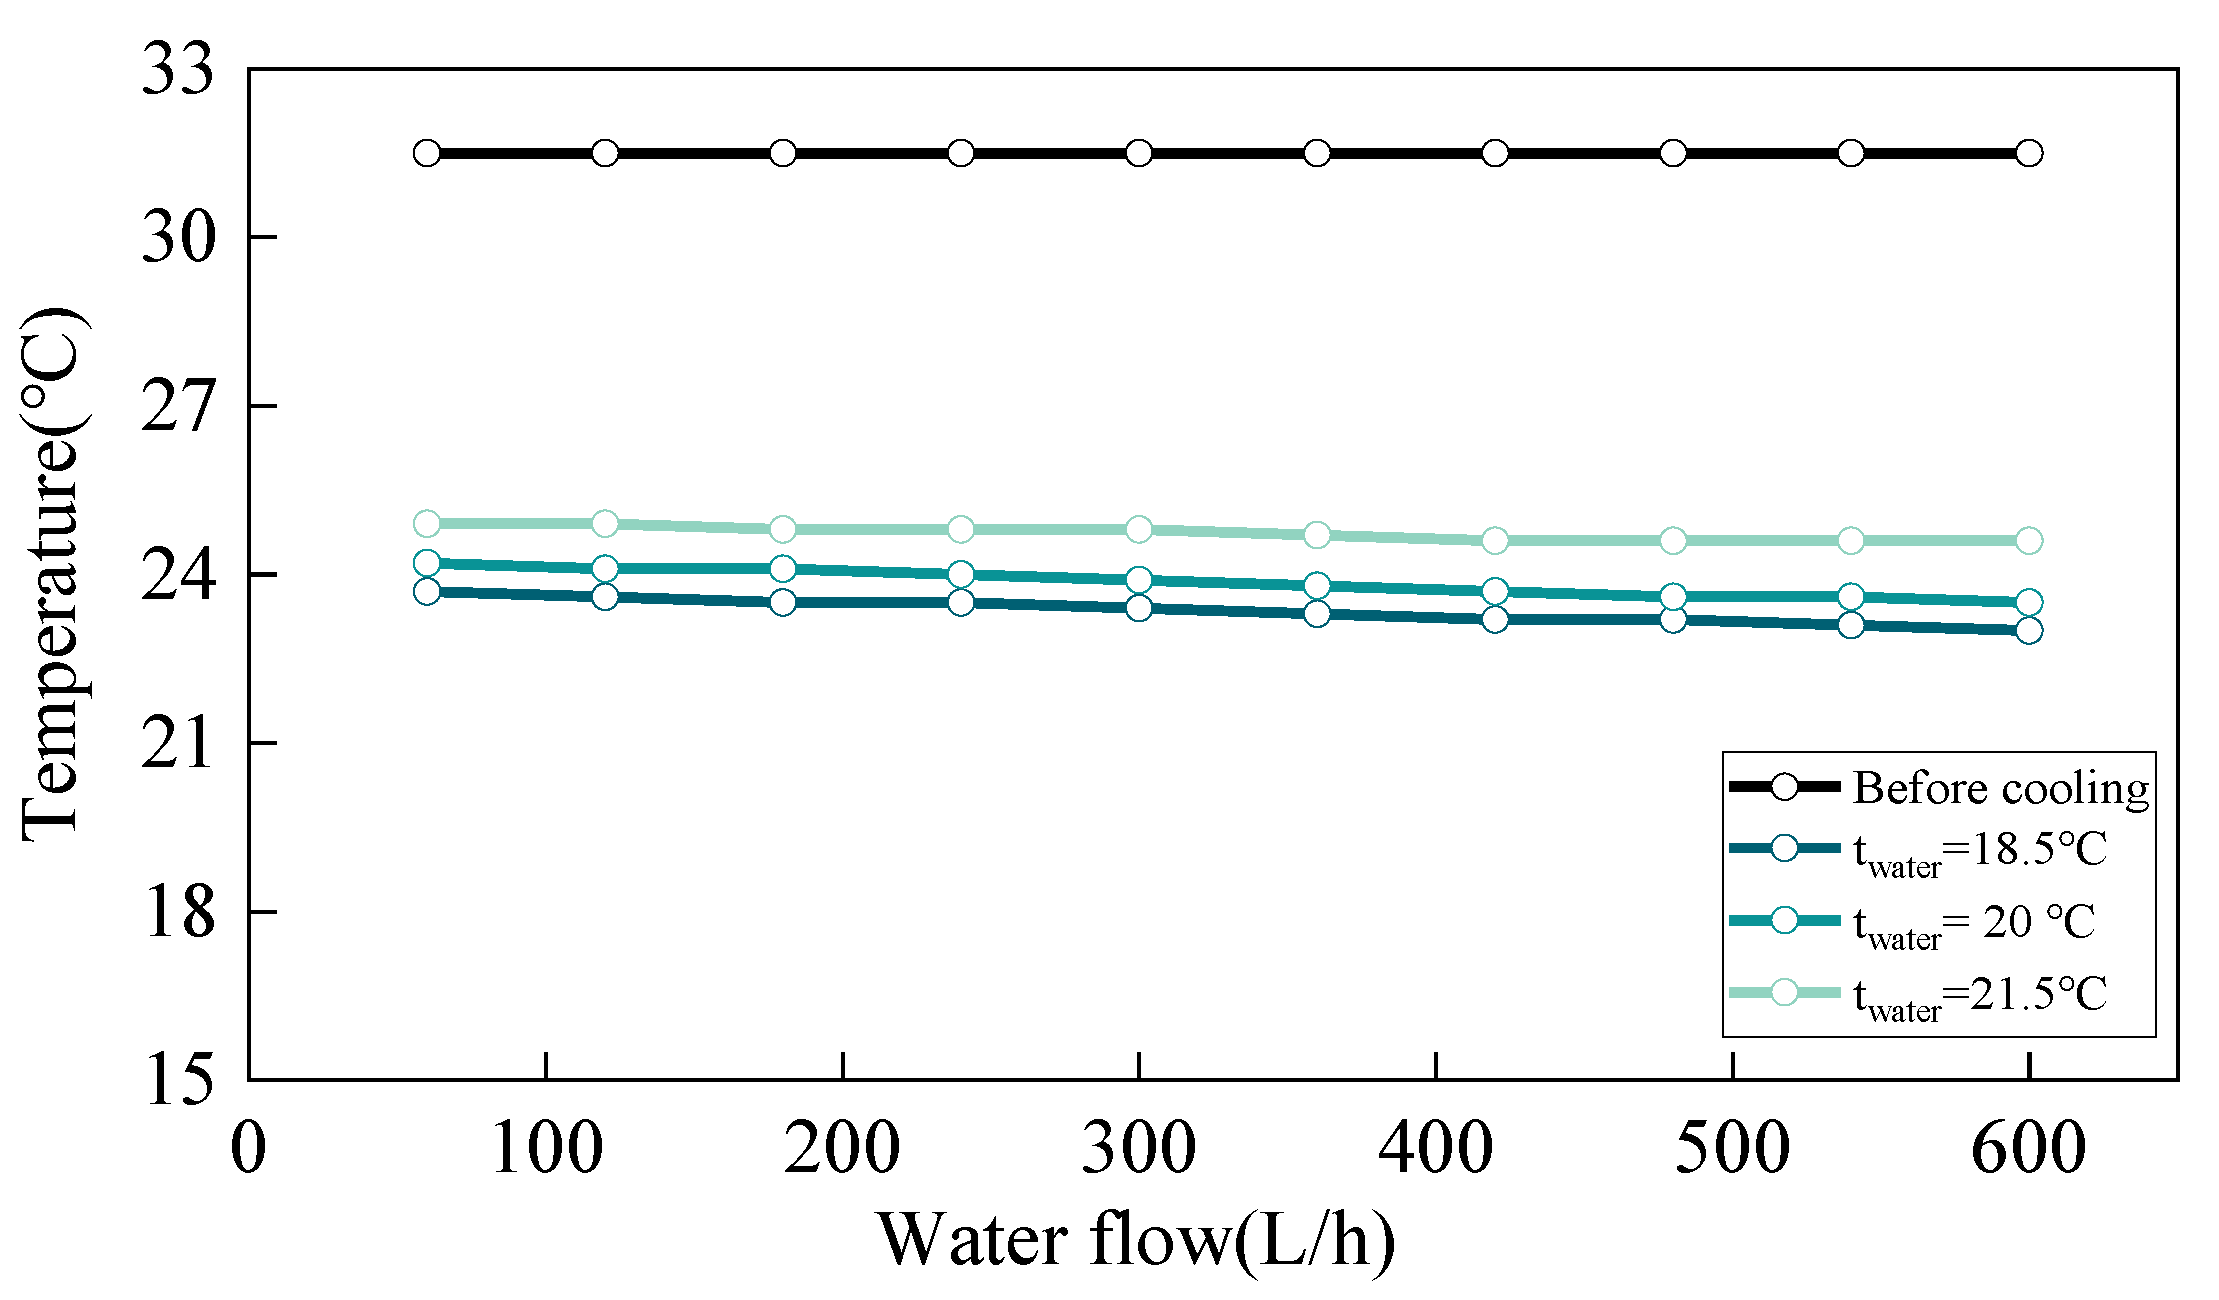
4.1.3. Impact of Pipeline Water Temperature on the Cooling Effect

In order to study the influence of the water inlet temperature on the cooling effect, the temperature and humidity of the programmable constant temperature and the humidity box were set with an inlet air temperature of 31.5 °C, humidity at 90%, and air inlet flow at 127.2 m3/h; the inlet water temperature of the pipeline was changed by changing the temperature of the low-temperature thermostatic water tank to allow temperatures of 18.5 °C, 20.0 °C, and 21.5 °C for the cooling experiments.
As shown in Figure 7, when the air flow inlet flow was 127.2 m3/h and the cold source temperature was 18.5 °C, the low-temperature water could cool the 31.5 °C high-temperature air flow to 23.2 °C, and the temperature difference before and after cooling was 8.3 °C. When the inlet water temperature rose to 20.0 °C and 21.5 °C, the air flow outlet temperatures were 23.9 °C and 24.9 °C, respectively, and the temperature differences before and after cooling were 7.6 °C and 6.9 °C, respectively. When the water temperature changed from 18.5 °C to 21.5 °C, the cooling efficiency of the cooling system decreased by 4.4%. It was found that when the air temperature, humidity, and air volume remained unchanged, the temperature of the inlet water source increased, and the temperature of the air flow outlet also increased. This is because the increase in the inlet water flow temperature reduced the heat transfer temperature difference between the high-temperature air and low-temperature cold water, thus reducing the heat transfer inside the whole cooling system and reducing the cooling capacity of the heat exchanger. Therefore, under certain external conditions, the lower the temperature of the inlet cold source, the stronger the cooling capacity of the heat exchanger.

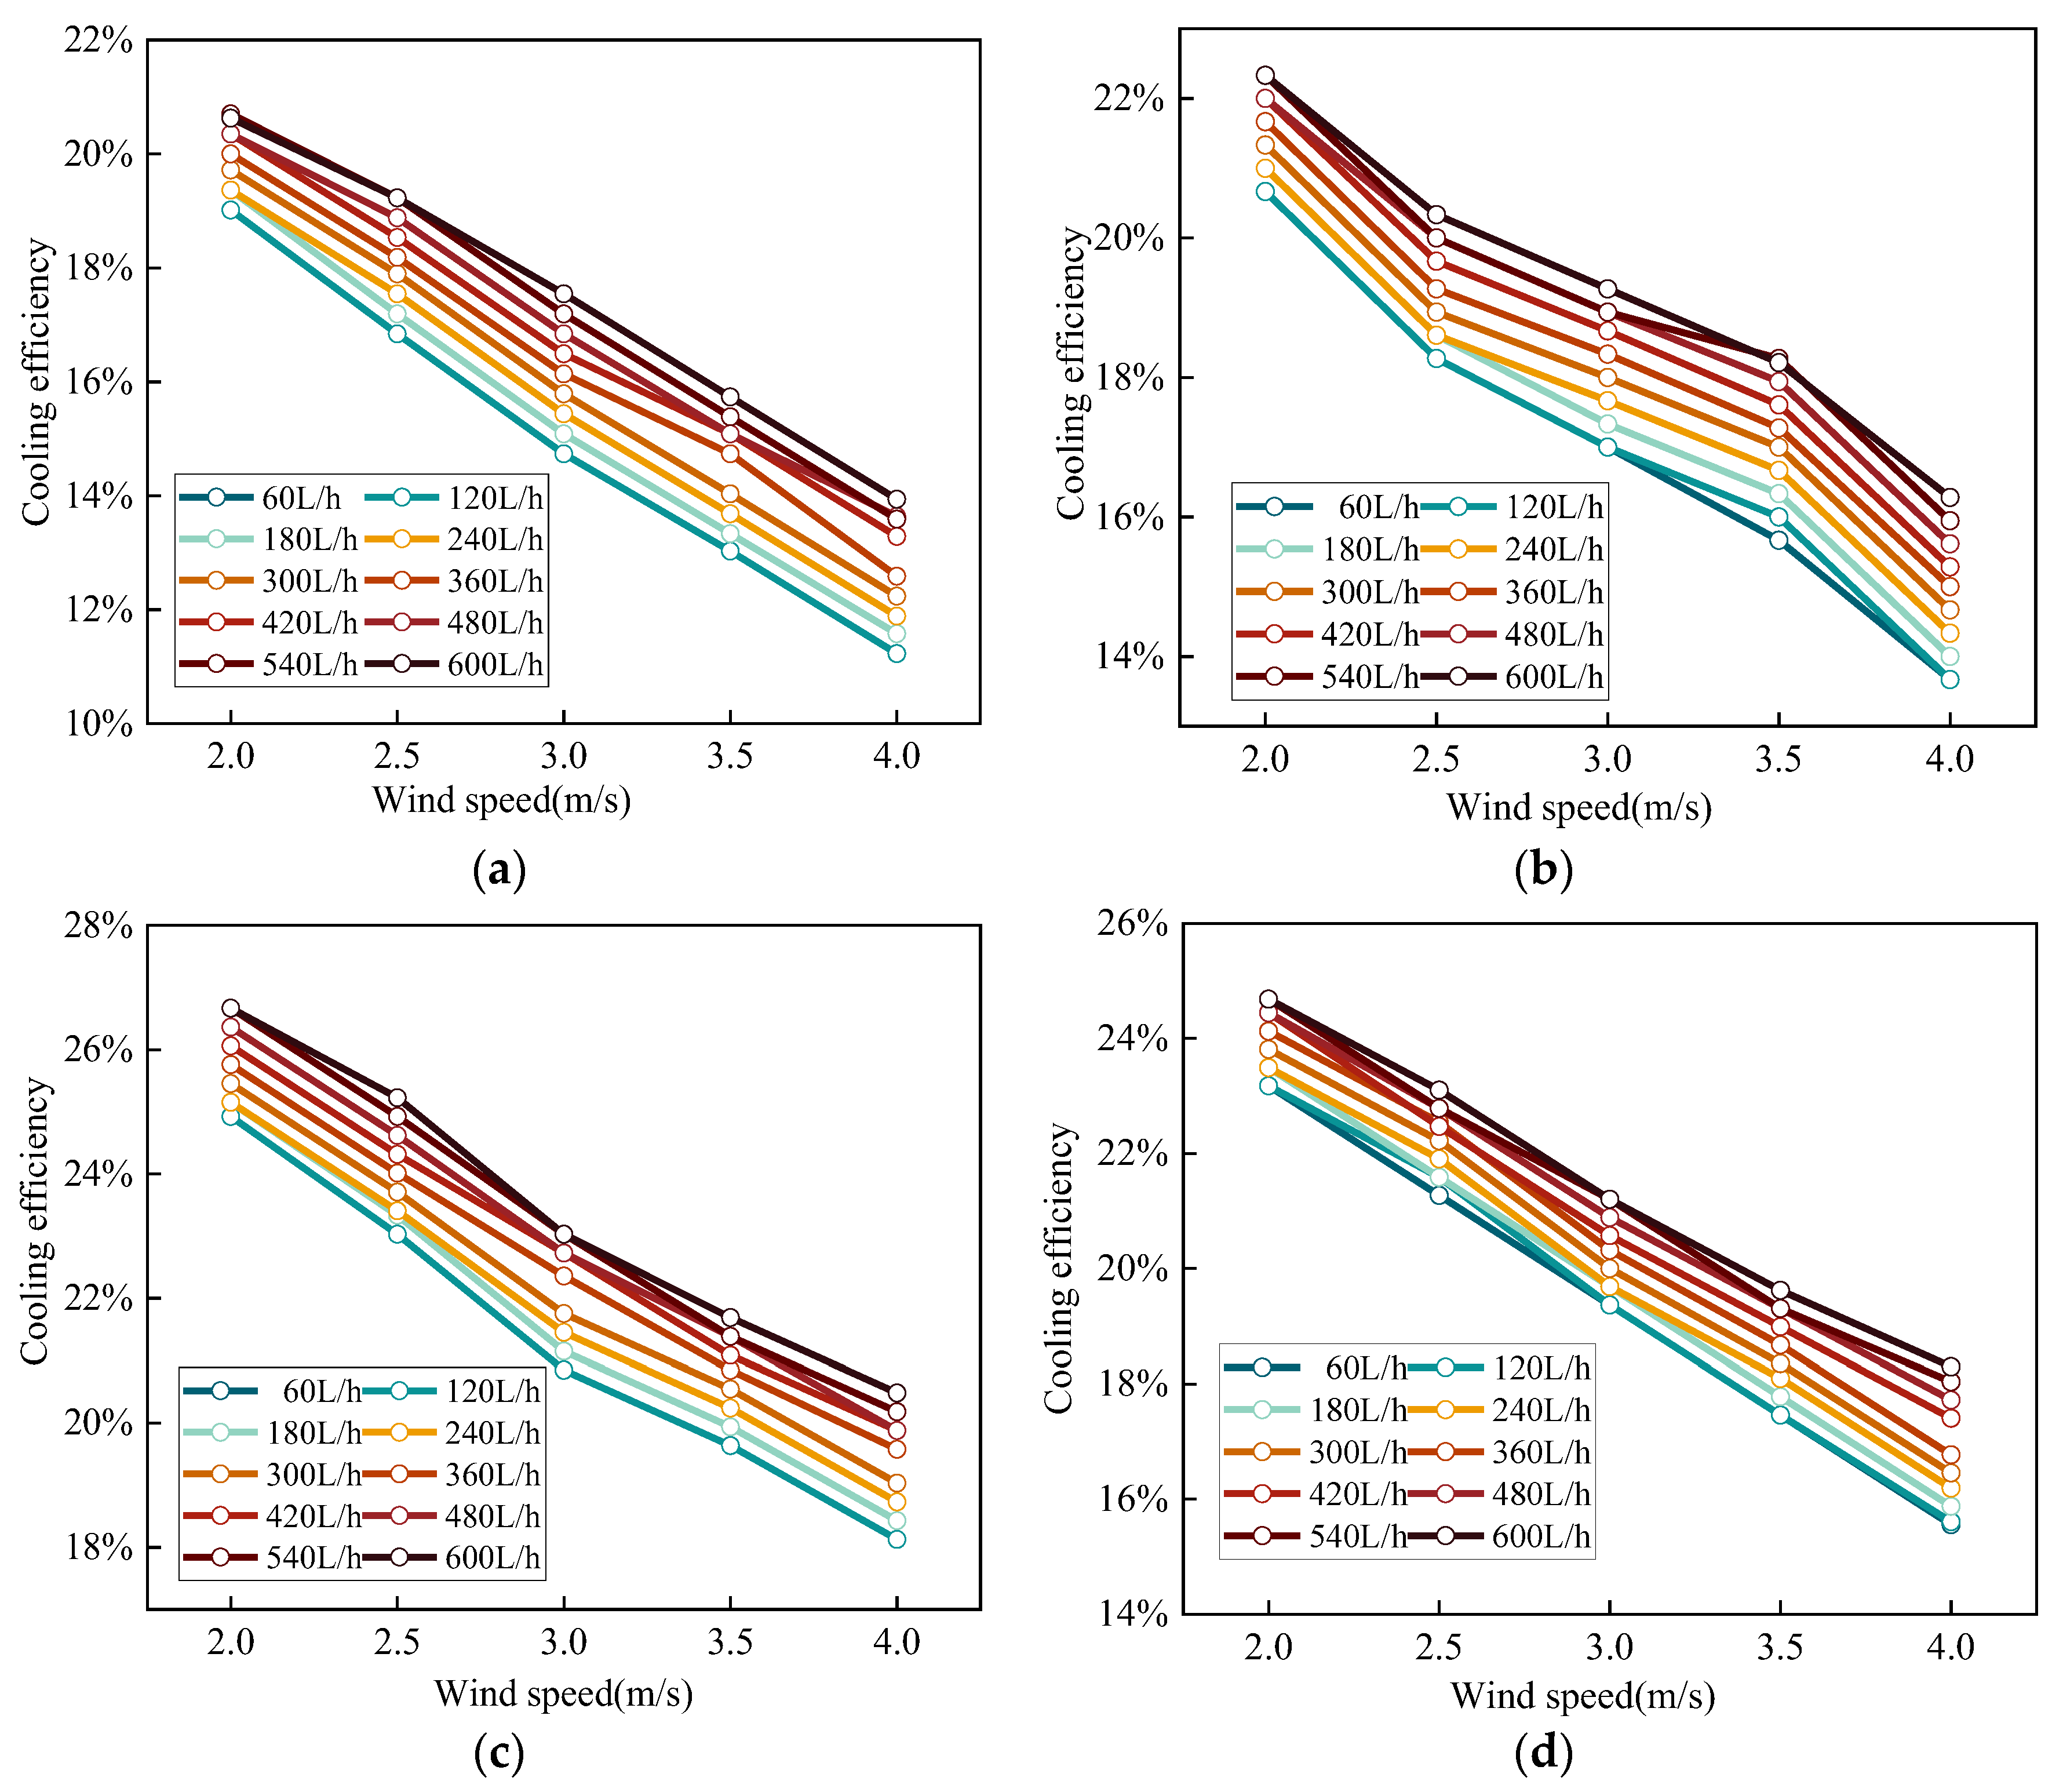
4.1.4. Impact of Pipeline Water Flow on the Cooling Effect

When the cold water temperature was 20 °C, the cooling efficiency under different working conditions of different air volumes, different air temperatures, and different cold water flow rates was calculated as shown in Equation (1) and plotted as shown in Figure 8.
η = Δ t t 1 × 100 %
where η is the cooling efficiency, Δ t is the temperature difference before and after cooling, and °C; t 1 is the temperature of the air flow inlet, °C.
It can be seen from Figure 8 that with the increase in water flow, the outlet temperature of the air flow at each operating point was continuously reduced, and the cooling effect of the cooling system was improved. This is due to the increase in the low-temperature water flow, which accelerated the flow rate of the low-temperature water in the pipeline, increased the cooling capacity inside the heat exchanger, and provided a greater cooling capacity for cooling. Additionally, this also increased the heat exchange between the high-temperature air flow and the low-temperature water, and improved the cooling capacity of the cooling system. When the inlet air volume was 127.2 m3/h, the cooling efficiency difference between different cold water flows was not significant. With the increase in wind speed, the efficiency difference between the different cold water flows became increasingly large. For the low-temperature water with a temperature of 20 °C, the cooling efficiency of the air flow was about 13~25%. When the cold water flow was 60~120 L/h, the cooling effect of the air flow was roughly the same; when the flow rate of the cold water was 360~420 L/h, the cooling efficiency of the cold water increased slightly; when the flow rate of cold water was 480~600 L/h, the increase in the cooling efficiency of the heat exchanger became slower. Therefore, the water flow of 420 L/h was selected as the most suitable flow for the heat exchanger.

4.2. Comprehensive Analysis of Cooling Effect

With a water source flow of 60~600 L/h, the water source temperatures were 18.5 °C, 20.0 °C, and 21.5 °C; the air temperatures were 28.5 °C, 30.0 °C, 31.5 °C, and 33.0 °C; the air flows were 127.2 m3/h, 159.1 m3/h, 190.9 m3/h, 222.7 m3/h, and 254.5 m3/h; and the air flow humidity was above 90%. The temperature difference at each operating point was calculated, and the change data of the temperature differences before and after cooling with the flow at each operating point are shown in Table 2.
According to the data shown in Table 2, for the same air volume and the same cold water source temperature, the gradient of the temperature difference curves of different air flow temperatures with water flow were roughly similar, that is, the air flow inlet temperature increased by 1.5 °C and the air flow outlet temperature increased by 0.5–0.7 °C. For each operating point, when the cold water flow changed from 60 L/h to 600 L/h, the temperature difference between the inlet and outlet of the heat exchanger increased by about 1 °C.
The 600 groups of experimental data were linearly fitted to guide the subsequent prediction of the cooling effect of the single spiral-tube heat exchanger under different working conditions in engineering practice. Considering that there were four variables in the experiment, the multiple linear regression equation was used to fit them.
The four variables of air volume, air temperature, water temperature, and cold water flow were set as X1 (m3/h), X2 (°C), X3 (°C), and X4 (L/h), respectively, and the temperature difference before and after cooling was set as y (°C). The multivariate linear regression equation was set as:
y = a + bX 1 + cX 2 + dX 3 + eX 4
There were 600 fitting points in total, and the fitting correlation coefficient was 0.99154 at this time, so the fitting effect was good. It can be concluded that the multiple linear regression analysis equation of the cooling system model is:
y = 0.469 0.016 X 1 + 0.623 X 2 + 0.50 X 3 + 0.001 X 4
For this multiple linear regression equation, different wind speeds, wind temperatures, water temperatures, and cold water flows could be brought in, respectively, to predict the temperature difference at this point before and after cooling. The fitting results, relevant errors, and confidence intervals of the multiple linear regression equation are shown in Table 3.

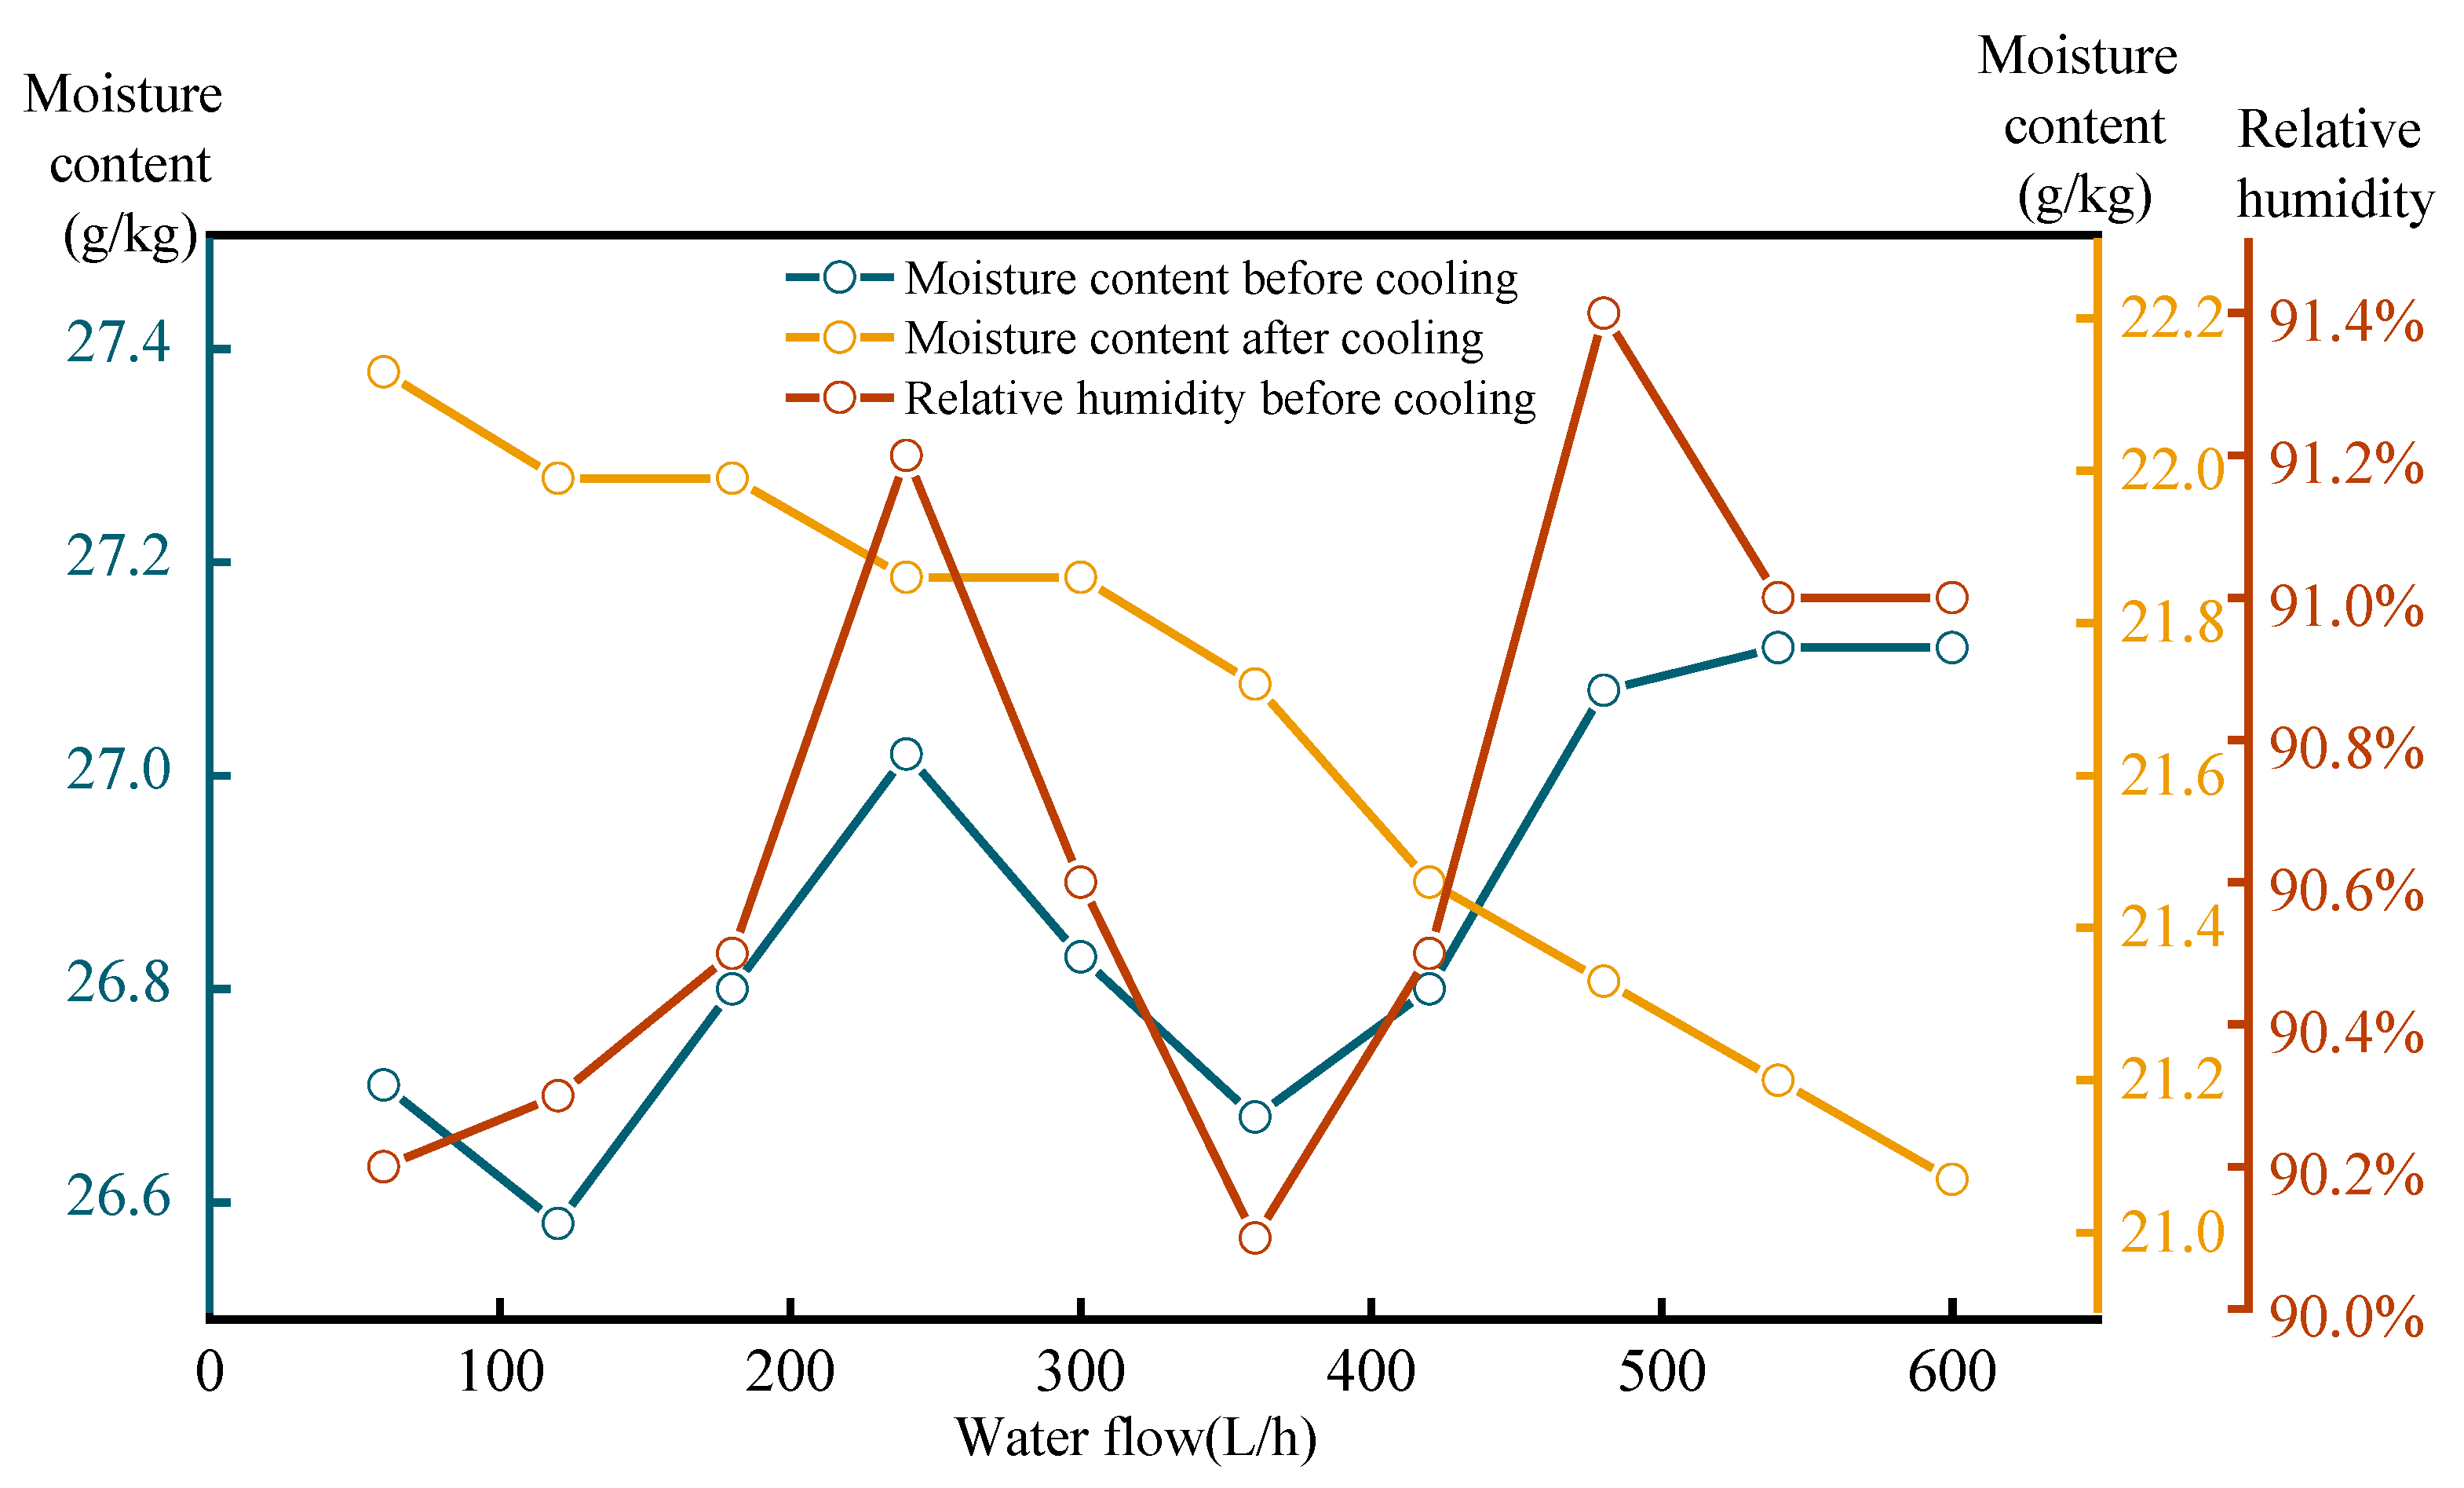
4.3. Analysis of Dehumidification Effect in the Cooling System

In the process of cooling high-humidity air, the air humidity gradually reached a saturation state. In this process, the sensible heat transfer between the media and the phase change of the water vapor condensation occurred. This showed that throughout the whole cooling process, the high-temperature humid air was saturated and released water droplets, which caused the moisture content of the air flow to continuously reduce during the cooling process. Therefore, the air flow in the heat exchanger is a process of cooling and dehumidification. The moisture content calculation formula is shown in Equation (4) as follows:
d = 622 φ P s P φ P s
where d is the moisture content, g/kg; φ is the relative humidity, %; P s is the partial pressure of the water vapor, Pa; and P is the air pressure, Pa.
In the cooling experiment of the heat exchanger, it was found that, for the air flow with 90% relative humidity, the relative humidity at the air flow outlet reached 99.9% after cooling because the temperature of the air flow after cooling was lower than the dew point temperature of the air flow under the original state. Under the working conditions of an air intake of 127.2 m3/h, an air temperature of 31.5 °C, and a cold water temperature of 20 °C, the changes in the air temperature, humidity, and moisture content with the water flow after cooling are shown in Table 4.
The relative humidity before air flow cooling and the change in the moisture content before and after air flow cooling were analyzed, as shown in Figure 9. Since the relative humidity after air flow cooling was 99.9%, this is not shown in the figure.
It can be seen from Figure 9 that during the cooling experiment with a wet air flow, the air temperature and moisture content both showed a downward trend, which is due to the process of cooling and dehumidification. At a certain temperature, with the increase in the relative humidity of the air flow, the moisture content of the air flow also increased; with the increase in the cold water flow, the air temperature decreased continuously, and the moisture content of the air decreased as a whole. For the wind speed of 2 m/s, a wind temperature of 31.5 °C, and a wind humidity of more than 90%, the low-temperature water at 20 °C was able to reduce the original moisture content of 26.8 g/kg to 21.6 g/kg, and the moisture content was reduced by 5.2 g/kg. The reason for this is that under different temperature and energy conditions, the water content of air is different. The lower the temperature, the lower the air moisture content, and the lower the humidity. After the cooling of the heat exchanger, due to the temperature drop, the water vapor gradually condensed in the air, reducing the water content of the air, so the moisture content in the air also decreased.

5. Conclusions

In this study, an experimental platform of a cooling system was built to simulate the high temperatures and humidity in mines, using a single spiral-tube heat exchanger as the core component. The influence of the air flow temperature, air flow rate, water inlet temperature, water inlet flow rate, and other factors on the cooling effect of the single-spiral heat exchanger was revealed. The technical feasibility was verified by a theoretical analysis, field measurements, and platform experiments. This method is not only helpful in solving the problem of thermal hazards in coal mine working faces, but also achieves the unification of water energy utilization and thermal hazard control in mines, thus saving on cooling costs. The main conclusions of this study are summarized as follows:
(1)
Under the same air flow temperature and inlet water temperature, as the inlet air volume increased, the outlet air temperature of the heat exchanger increased, and the heat exchanger’s cooling capacity decreased. Within the experimental range, 127.2 m3/h was found to be the optimum inlet air volume, and the air flow temperature decreased the most, from 31.5 °C to 23.9 °C. As the inlet air volume continued to increase, the cooling range and cooling efficiency were reduced; the water flow rate was positively related to the cooling effect. With the increase in the water flow rate, the outlet temperature of the air flow at each operating point was continuously reduced, and the cooling effect of the heat exchanger was improved. The cooling efficiency of low-temperature water with a temperature of 20 °C for the air flow was about 13~25%. When the flow rate of the cold water was 360~420 L/h, the cooling efficiency of the cold water increased significantly. Therefore, a water flow rate of 420 L/h was selected as the optimum matching flow rate for the heat exchanger.
(2)
Under the same inlet air volume and inlet water flow, with the increase in the inlet water temperature of the pipeline, the outlet air temperature of the heat exchanger also increased, and the cooling efficiency of the heat exchanger decreased. When the water temperature increased from 18.5 °C to 21.5 °C, the cooling efficiency of the heat exchanger decreased by 4.4%. The water temperature of Maoping Coal Mine is about 20 °C all year round, and the wind temperature of 31.5 °C can be reduced to 23.9 °C in the industrial test site; with the increase in the air flow temperature, due to the increase in the heat transfer temperature difference between high-temperature air and low-temperature cold water, the internal heat exchange of the cooling system was strengthened, and the cooling efficiency of the heat exchanger was increased. We found 33.0 °C to be the optimum inlet air temperature, and the air flow cooling range was the largest, with a decrease of 24.3 °C; when the inlet air temperature rose from 28.5 °C to 33.0 °C, the cooling efficiency of the heat exchanger increased by 6.7%.
(3)
At a certain temperature, with the increase in the relative humidity of the air flow, the moisture content of the air flow also increased; with the increase in the cold water flow, the air temperature decreased continuously, and the moisture content of the air decreased as a whole. With a wind speed of 2 m/s, a wind temperature of 31.5 °C, and a wind humidity of more than 90%, the low-temperature water at 20 °C was able to reduce the original moisture content of 26.8 g/kg to 21.6 g/kg, and the moisture content was reduced by 5.2 g/kg. The four variables of air volume, air temperature, water temperature, and cold water flow were set as X1 (m3/h), X2 (°C), X3 (°C), and X4 (L/h), respectively, and the temperature difference before and after cooling was set as y (°C). A multiple linear regression analysis equation of the cooling system model was also proposed.

Author Contributions

Conceptualization, H.J., S.C., X.M. and L.T.; methodology, C.C.; software, C.C.; validation, Y.W., C.C. and C.J.; formal analysis, X.M.; investigation, Y.W.; resources, L.T.; data curation, C.J.; writing—original draft preparation, Y.W.; writing—review and editing, H.J.; visualization, Y.W.; supervision, C.J.; project administration, L.T.; funding acquisition, H.J. and Y.W. All authors have read and agreed to the published version of the manuscript.

Funding

This research was funded by the Natural Science Foundation of Jiangsu Province (grant no. BK20211585).

Data Availability Statement

Not applicable.

Conflicts of Interest

The authors declare no conflict of interest.

References

  1. Zhao, X.D.; Zhou, X.; Zhao, Y.F.; Yu, W.L. Research progress of mining disaster prevention and control in deep metal mine. J. Cent. South Univ. (Sci. Technol. Ed.) 2021, 8, 2522–2538. [Google Scholar]
  2. Liu, H.X.; Wang, J.B.; Zhao, J.; Wang, X.; Zhu, D.M.; Xu, S. Key technical problems and solutions of deep well Mining. Min. Res. Dev. 2018, 5, 1–5. [Google Scholar]
  3. Chen, A.G. The causes, hazards and control measures of mine thermal damage. China Saf. Sci. J. 2004, 8, 6–9. [Google Scholar]
  4. Zhang, X.M.; Li, L.F.; Wang, Z.G. Thermal damage analysis and air flow temperature prediction in underground coal mine. J. Liaoning Tech. Univ. (Nat. Sci. Ed.) 2012, 6, 826–828. [Google Scholar]
  5. Staden, H.J.; Rensburg, J.F.; Groenewald, H.J. Optimal use of mobile cooling units in a deep-level gold mine. Int. J. Min. Sci. Technol. 2020, 4, 547–553. [Google Scholar] [CrossRef]
  6. Chen, P. A new type of mine centralized air conditioning system with compressed air supply. Min. Saf. Environ. Prot. 2004, 3, 1–3. [Google Scholar]
  7. Yang, D.D.; Wang, B.S.; Zhou, S.G. Application of cogeneration technology of heat, power and cooling in treatment of deep well heat damage. Coal Eng. 2012, 11, 118–120. [Google Scholar]
  8. Cao, Y. Application of thermoelectric cooling technology in mine. In Proceedings of the 2019 Symposium on Construction and Efficient Operation of Heating Engineering (Part 2); China Municipal Engineering North China Design and Research Institute Co., Ltd.: Tianjin, China, 2019; pp. 283–287. [Google Scholar]
  9. He, M.C. Research and Development of HEMS Deep well cooling system and Thermal damage control Countermeasures. Basic Sci. China 2008, 2, 11–16. [Google Scholar]
  10. Zhang, X.Y.; Bu, B.Y.; Liu, L.; Cao, T.R.; Ke, Y.P.; Du, Q.Q. Numerical simulation on cooling effect of working face under radiation cooling mode in deep well. Energies 2021, 14, 4428. [Google Scholar] [CrossRef]
  11. Pokhrel, S.; Kuyuk, A.F.; Kalantari, H. Techno-Economic trade-off between battery storage and ice thermal energy storage for application in renewable mine cooling system. Appl. Sci. 2020, 17, 6022. [Google Scholar] [CrossRef]
  12. Wang, M.; Liu, L.; Wang, S. Numerical investigation of heat transfer and phase change characteristics of cold load and storage functional CPB in deep mine. Front. Earth Sci. 2020, 8, 31. [Google Scholar] [CrossRef] [Green Version]
  13. Crawford, J.A.; Joubert, H.P.R.; Mathews, M.J.; Kleingeld, M. Optimised dynamic control philosophy for improved performance of mine cooling systems. Appl. Therm. Eng. 2019, 150, 50–60. [Google Scholar] [CrossRef]
  14. Zhang, Y.; Guo, D.M.; Jing, T. Energy consumption analysis of cooling system in Jiahe deep coal mine. In Applied Mechanics and Materials; Trans Tech Publications Ltd.: Bäch, Switzerland, 2011; pp. 117–119. [Google Scholar]
  15. Wang, C.L.; Cheng, L.; Hao, Y.J.; Jiang, M.W.; Chen, K.X.; Shao, K. Efficiency improvement and application of the groundwater heat pump cooling system in linglong gold mine. Geofluids 2022, 2022, 3191735. [Google Scholar] [CrossRef]
  16. Nikodem, S.; Dariusz, O.; Justyna, S. An evaluation of the functioning of cooling systems in the polish coal mine industry. Energies 2018, 11, 2267. [Google Scholar]
  17. Li, H.M.; Fu, K. Main technical problems and countermeasures of deep mining in coal mine. J. Min. Saf. Eng. 2006, 4, 468–471. [Google Scholar]
  18. Yuan, D.S.; Hou, J.J.; Jin, J.W. Analysis and calculation of heat source in high temperature mine. J. Henan Polytech. Univ. (Nat. Sci. Ed.) 2009, 3, 278–293. [Google Scholar]
Figure 1. Mine drainage distribution map.
Energies 15 09071 g001
Figure 2. Internal copper tube and external integral structure of single spiral-tube heat exchanger.
Energies 15 09071 g002
Figure 3. Schematic diagram of mine cooling system.
Energies 15 09071 g003
Figure 4. Cooling system experimental platform.
Energies 15 09071 g004
Figure 5. Influence of inlet air volume on outlet temperature.
Energies 15 09071 g005
Figure 6. Influence of different inlet air temperatures on the cooling effect.
Energies 15 09071 g006
Figure 7. Influence of different inlet water temperatures on outlet temperature.
Energies 15 09071 g007
Figure 8. Cooling efficiency diagram of different cold water flows. (a) twind = 28.5 °C; (b) twind = 30.0 °C; (c) twind = 31.5 °C; (d) twind = 33.0 °C.
Energies 15 09071 g008
Figure 9. Moisture content changes during cooling.
Energies 15 09071 g009
Table 1. Heat source summary.
Heat SourceHeat Release or Heat Absorption (kW)Proportion (%)
Heat release from backfill6505.0091.81
Heat release from mechanical and electrical equipment549.207.75
Exothermic blasting30.720.44
Surrounding endothermic rock78.50100.00
Table 2. Changes in temperature differences with flow before and after cooling at each operating point.
Wind Flow (m3/h)Wind Temperature (°C)Water Temperature (°C)Water Flow (L/h)
60120180240300360420480540600
Temperature Difference before and after Cooling (°C)
127.228.518.56.06.06.16.16.26.36.46.56.56.6
20.04.84.84.94.95.05.15.25.25.35.3
21.54.84.84.94.95.05.15.25.25.35.3
30.018.56.96.97.07.07.17.27.37.47.47.5
20.06.26.26.36.36.46.56.66.66.76.7
21.55.55.55.65.65.75.75.85.96.06.0
31.518.57.97.98.08.08.18.28.38.38.48.5
20.07.37.37.47.47.57.67.77.77.87.8
21.56.66.66.76.76.86.97.07.07.17.1
33.018.58.88.88.98.99.09.19.29.39.39.4
20.08.28.28.38.38.48.58.68.78.88.8
21.57.67.67.77.77.87.98.08.08.18.1
159.128.518.55.45.45.55.65.75.85.96.06.06.1
20.04.84.84.95.05.15.25.35.45.55.5
21.54.24.24.34.34.44.54.64.74.74.8
30.018.56.36.36.46.56.66.66.76.86.97.0
20.05.55.55.65.65.75.85.96.06.06.1
21.54.94.95.05.15.25.25.35.45.55.5
31.518.57.37.37.47.57.67.77.87.98.08.0
20.06.76.86.86.97.07.17.17.27.27.3
21.56.16.16.26.26.36.46.56.66.76.7
33.018.58.28.38.38.48.58.68.78.88.98.9
20.07.67.67.77.77.87.98.08.18.28.3
21.57.07.07.17.17.27.37.47.57.67.6
190.928.518.54.94.95.05.15.25.35.55.65.65.7
20.04.24.24.34.44.54.64.74.84.95.0
21.53.53.53.63.73.83.94.14.24.34.4
30.018.55.85.85.96.06.06.16.26.36.46.4
20.05.15.15.25.35.45.55.65.75.75.8
21.54.44.44.54.64.64.74.84.84.95.0
31.518.56.86.86.97.07.17.27.37.47.47.5
20.06.16.16.26.26.36.46.56.66.76.7
21.55.45.45.55.65.75.85.96.06.16.1
33.018.57.77.77.87.98.08.18.28.38.38.4
20.06.96.97.07.17.27.47.57.57.67.6
21.56.26.26.36.36.46.56.66.76.86.9
222.728.518.54.54.54.64.74.84.95.05.15.25.3
20.03.73.73.83.94.04.24.34.34.44.5
21.52.92.93.03.13.23.33.53.63.63.7
30.018.55.45.45.55.65.75.86.06.16.16.2
20.04.74.84.95.05.15.25.35.45.55.5
21.53.73.73.83.94.04.14.34.44.54.6
31.518.56.36.36.46.56.66.76.86.97.07.1
20.05.55.55.65.75.85.96.06.16.16.2
21.54.74.84.95.05.15.25.35.45.55.6
33.018.57.37.47.57.67.77.87.98.08.08.1
20.06.56.56.66.76.86.97.07.17.17.2
21.55.75.75.85.96.06.26.36.46.46.5
254.528.518.54.24.24.34.44.54.64.74.84.95.0
20.03.23.23.33.43.53.63.83.93.94.0
21.52.32.32.42.52.62.72.82.93.03.0
30.018.55.15.15.25.35.45.55.75.85.85.9
20.04.14.14.24.34.44.54.64.74.84.9
21.53.23.23.33.43.53.63.73.73.83.9
31.518.56.06.06.16.26.36.46.66.76.76.8
20.04.94.95.05.15.25.35.55.65.75.8
21.54.14.14.24.34.44.54.64.74.84.9
33.018.57.07.07.17.27.37.47.57.67.77.8
20.06.06.06.16.26.36.56.66.66.76.8
21.55.05.15.25.35.45.55.65.75.75.8
Table 3. Numerical table of fitting results.
ValueStandard ErrorConfidence Interval
a−0.469040.13584−0.73597~−0.20212
b−0.016130.00012−0.01636~−0.01589
c0.622580.003240.61621~0.62894
d−0.504670.00444−0.51338~−0.49595
e0.001410.000030.00135~0.00147
Table 4. Air temperature, humidity, and moisture content change table.
Water Flow (L/h)Inlet Temperature
(°C)
Inlet Relative Humidity
(%)
Moisture Content
(g/kg)
Dew Point Temperature
(°C)
Outlet Temperature
(°C)
Outlet Relative Humidity
(%)
Moisture Content
(g/kg)
6031.590.226.7130.1726.699.922.13
12031.490.326.5830.0826.599.921.99
18031.590.526.8030.1726.599.921.99
24031.591.227.0230.2126.499.921.86
30031.690.626.8330.3126.499.921.86
36031.690.126.6830.3726.399.921.72
42031.690.526.830.3326.199.921.46
48031.691.427.0830.3526.099.921.33
54031.691.027.1230.3125.999.921.20
60031.791.027.1230.3325.899.921.07
Publisher’s Note: MDPI stays neutral with regard to jurisdictional claims in published maps and institutional affiliations.

