
Analysis of an Evaporative Condensation System Coupled to a Microchannel-Separated Heat Pipe for Data Centers


Abstract
1. Introduction
2. Description of Complex Evaporative-Condensing and Microchannel-Separated Heat Pipe Unit
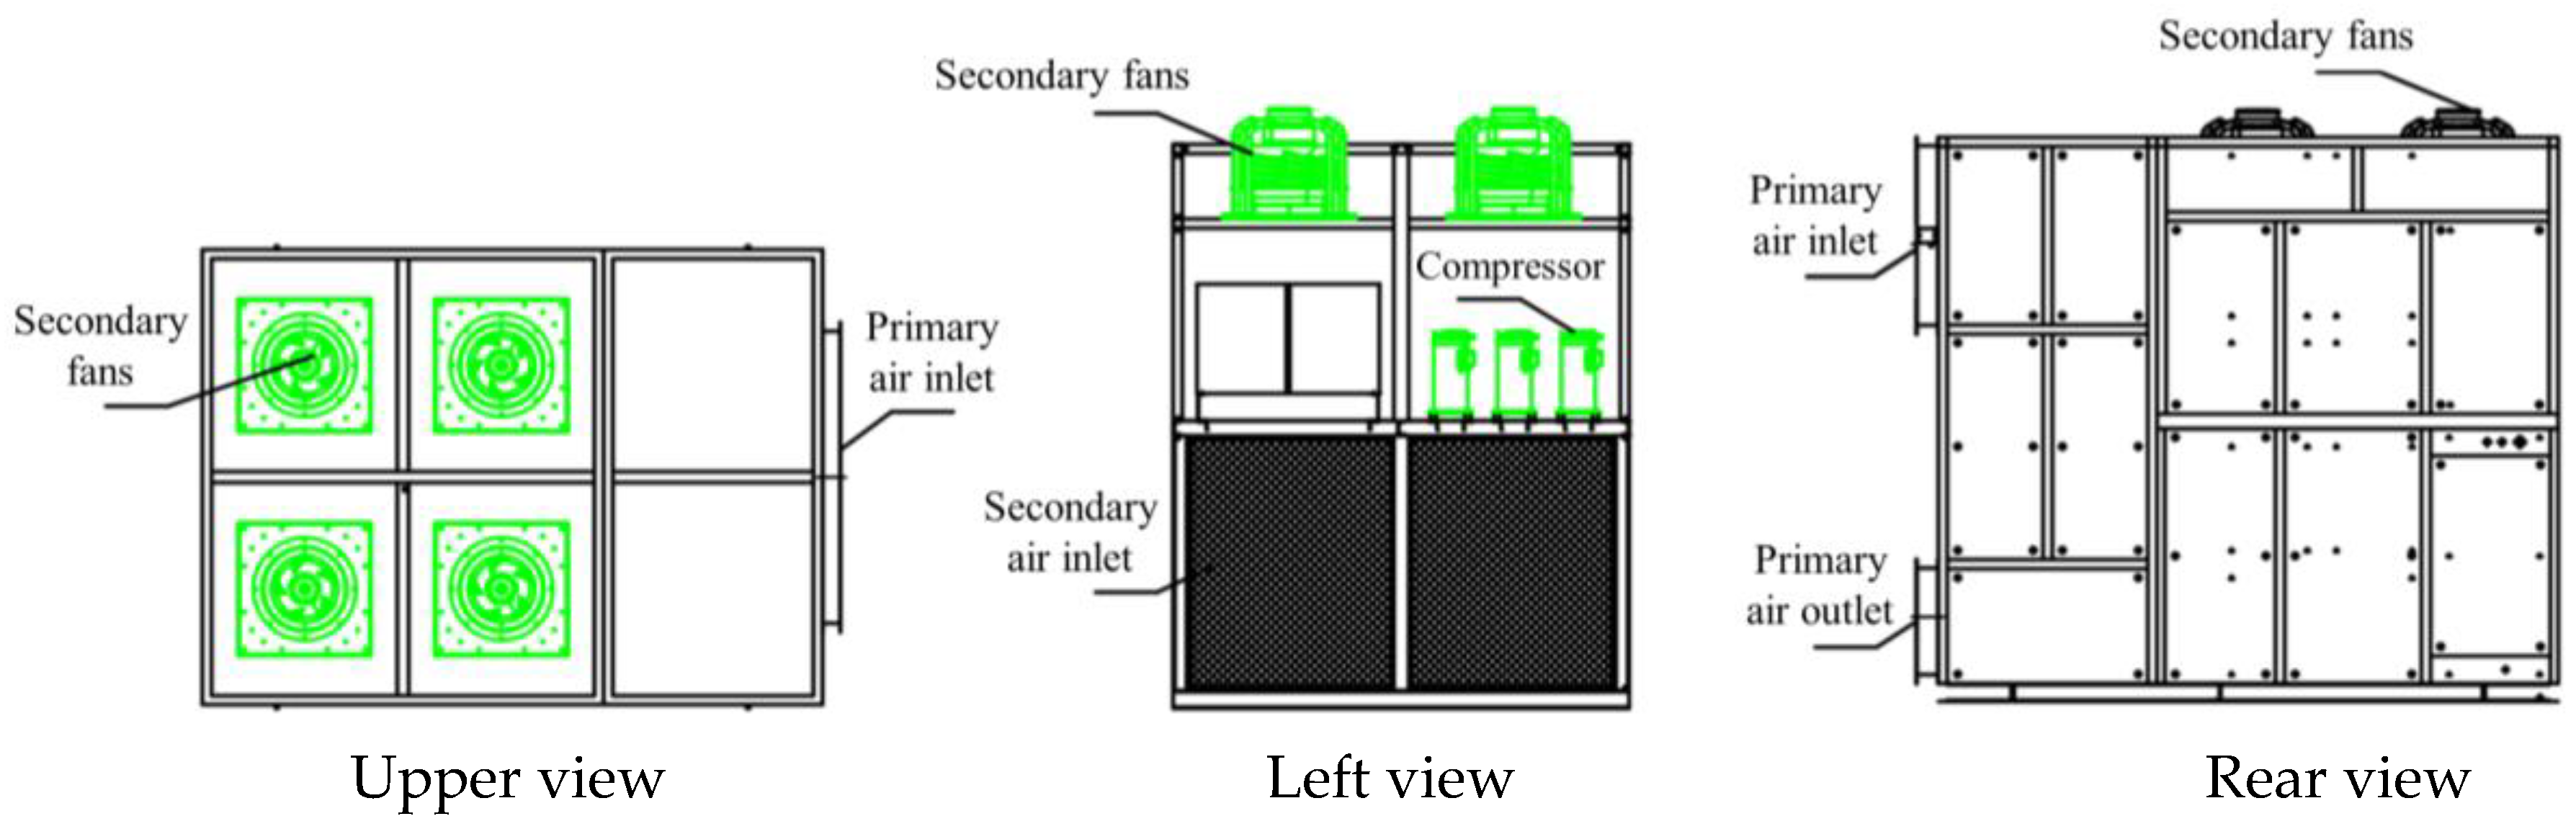
2.1. Evaporative-Condensing and Microchannel-Separated Heat Pipe Unit
2.2. Design Parameters of the Hybrid Cooling System
2.3. Hybrid Cooling System Operation Mode
3. Design of Separated-Microchannel Heat Pipe
3.1. The Dimensions of the Microchannel Heat Exchangers
3.1.1. Parameters of the Air Side outside the Flat Pipe
3.1.2. The Work-Side Parameters in the Flat Tube
3.2. Design of the Heat Pipe Evaporator
3.2.1. The Calculation of the Heat Transfer Coefficient on the Air Side
3.2.2. The Coefficient of Heat Transfer on the Working-Mass Side
3.3. Heat Pipe Condenser Design
3.4. Calculation of Pressure Drop in Heat Pipe System
3.4.1. Frictional Pressure Drop
3.4.2. Gravitational Pressure Drop
3.4.3. Accelerated Pressure Drop
3.4.4. Pressure Drop Caused by Sudden Expansion and Contraction
4. Performance Evaluation Methods
5. Testing Processes, Results, and Discussion
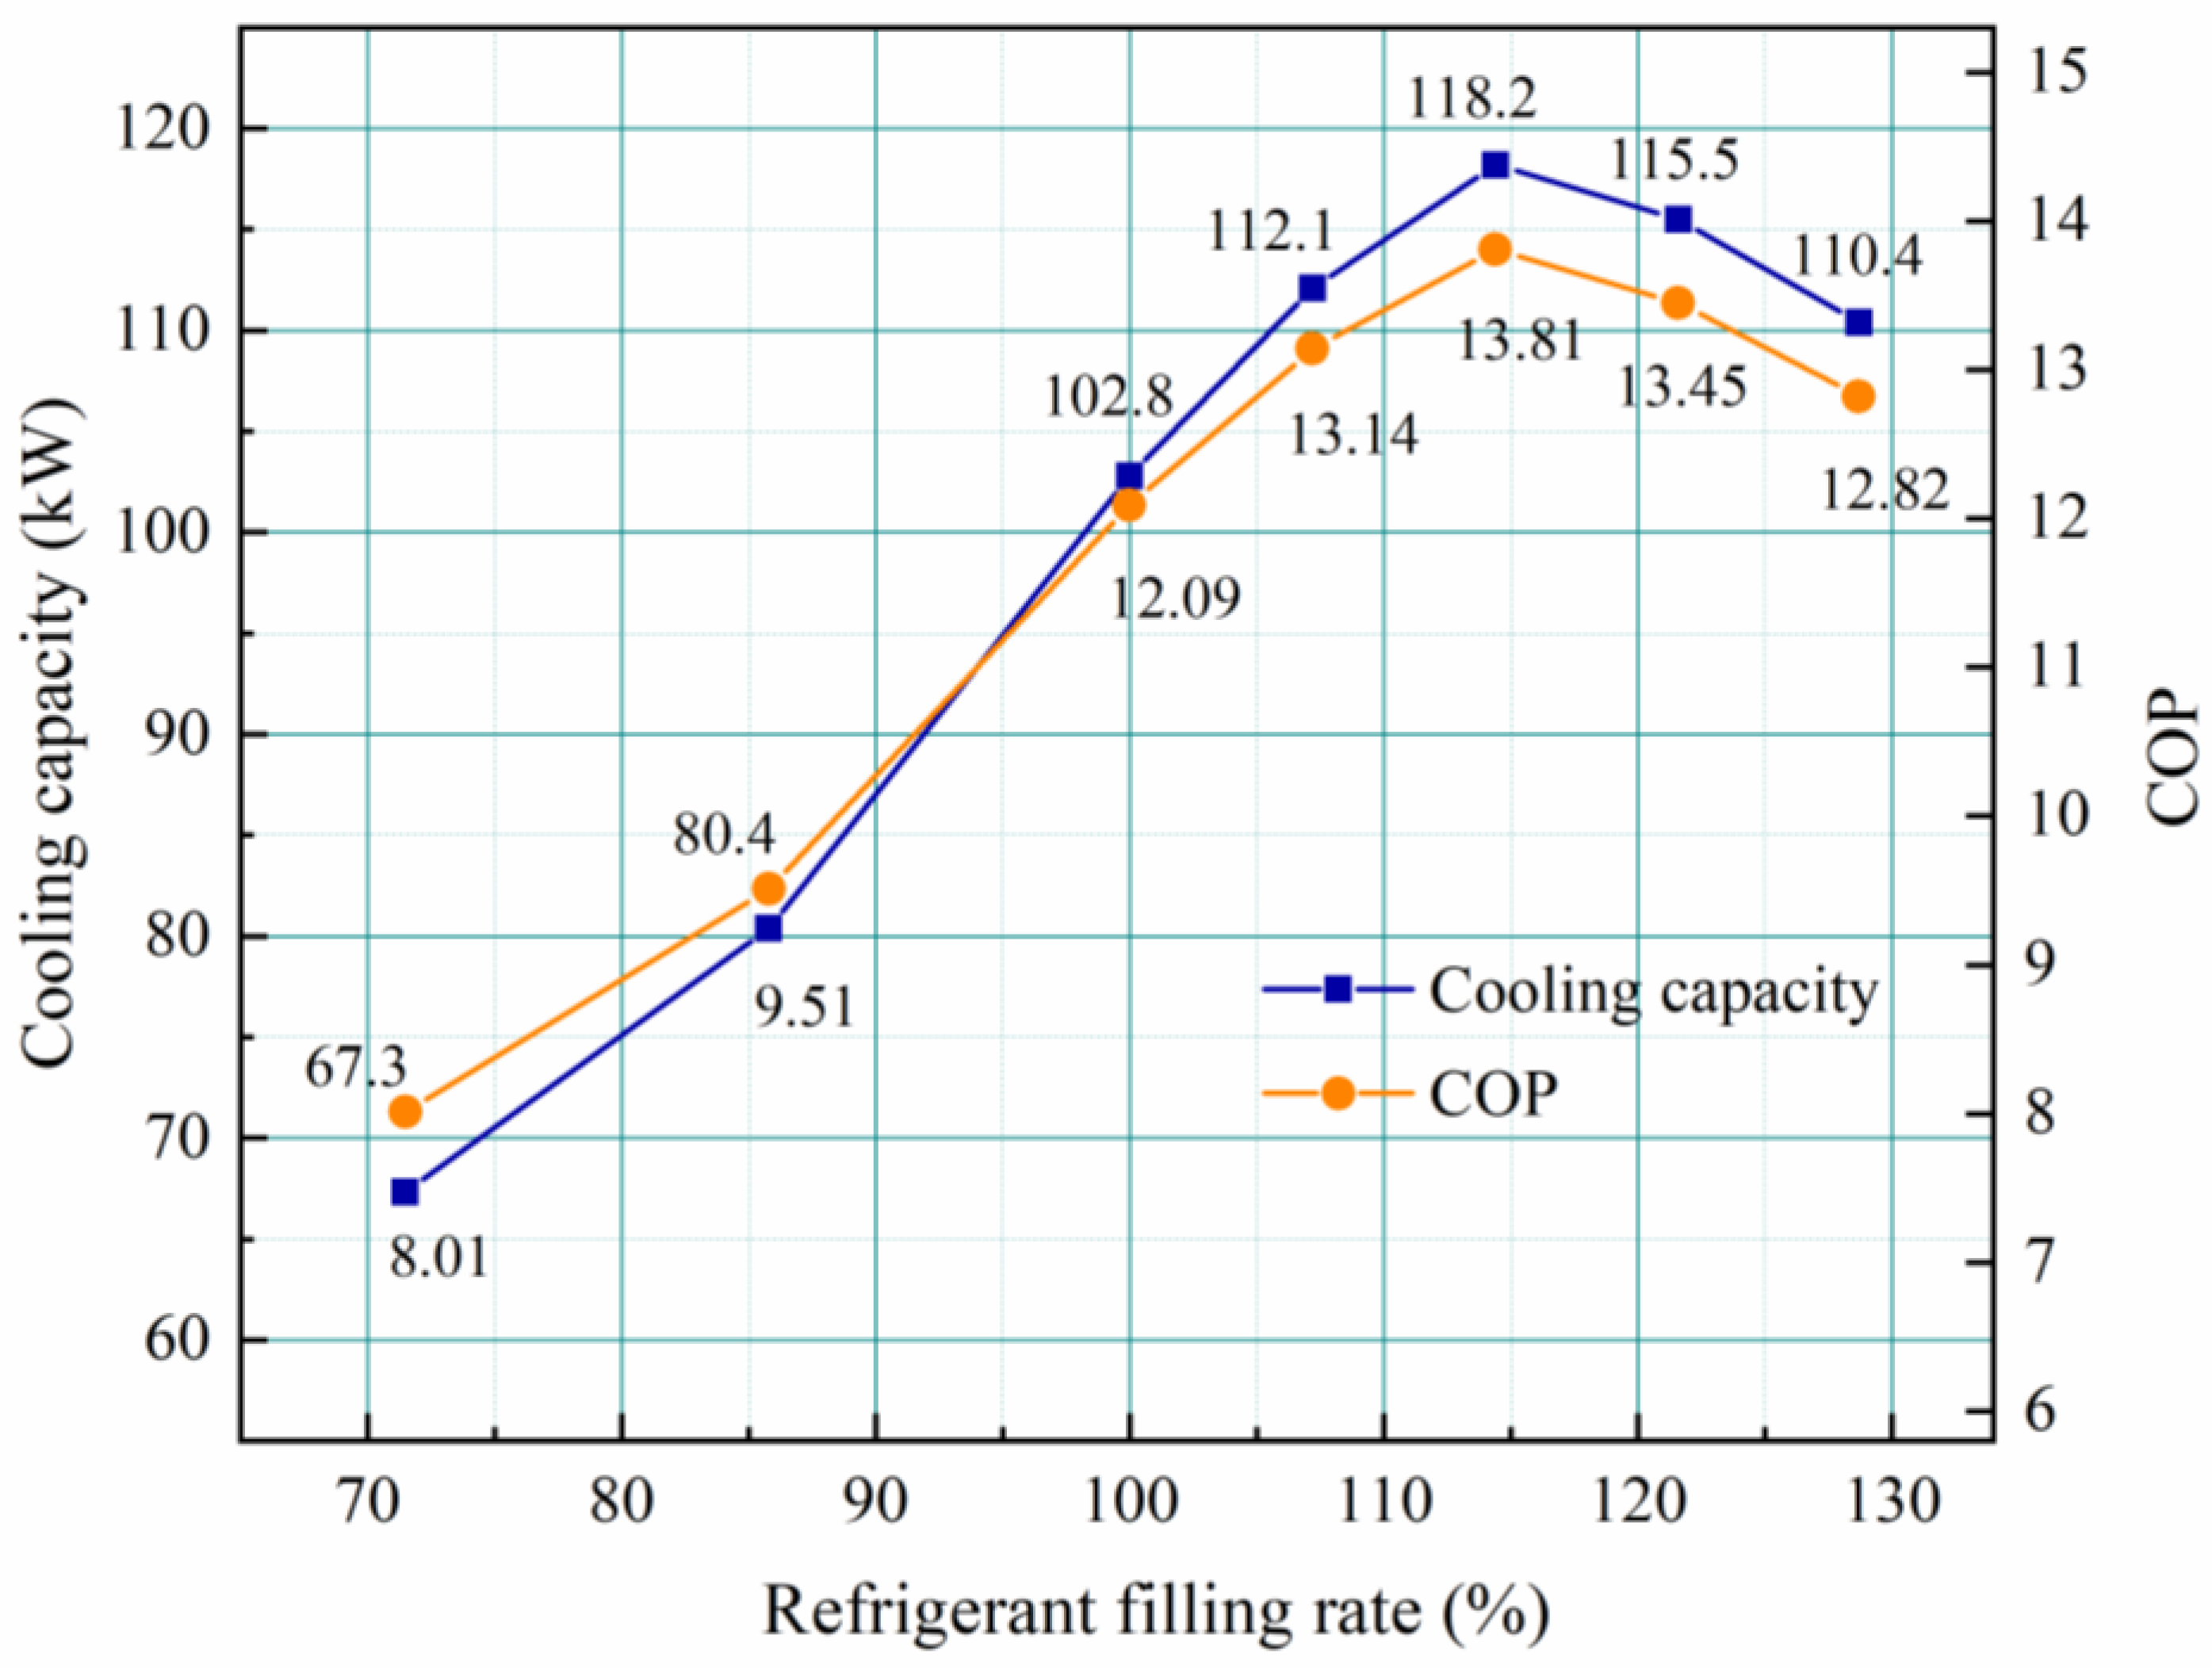
5.1. Optimal Liquid-Filling Rate for Power Heat Pipe Systems
5.2. Energy-Saving Analyses of the Hybrid Cooling Systems
6. Conclusions
Author Contributions
Funding
Conflicts of Interest
References
- China Green Data Center Development Report (2020); Electronics Association: Beijing, China, 2021.
- Department of Information and Communication Development, Ministry of Industry and Information Technology. National Data Center Application Development Guidelines (2018); Department of Information and Communication Development, Ministry of Industry and Information Technology: Beijing, China, 2018.
- Ebrahimi, K.; Jones, G.F.; Fleischer, A.S. A review of data center cooling technology, operating conditions and the corresponding low-grade waste heat recovery opportunities. Renew. Sustain. Energy Rev. 2014, 31, 622–638. [Google Scholar] [CrossRef]
- Meijer, G.I. Cooling energy-hungry data centers. Science 2010, 328, 318–319. [Google Scholar] [CrossRef] [PubMed]
- Hu, J.X.; Zhou, Q.L.; Gu, G.D. Exploration and research on energy consumption status and energy saving direction of data center. Comput. Program. Skills Mainten. 2019, 4, 93–95. (In Chinese) [Google Scholar]
- Siriwardana, J.; Jayasekara, S.; Halgamuge, S.K. Potential of air-side economizers for data center cooling: A case study for key Australian cities. Appl. Energy 2013, 104, 207–219. [Google Scholar] [CrossRef]
- Yuan, X.; Zhou, X.; Pan, Y.; Kosonen, R.; Cai, H.; Gao, Y.; Wang, Y. Phase change cooling in data centers: A review. Energy Build. 2021, 236, 110764. [Google Scholar] [CrossRef]
- Zhang, K.; Zhang, Y.; Liu, J.; Niu, X. Recent advancements on thermal management and evaluation for data centers. Appl. Therm. Eng. 2018, 142, 215–231. [Google Scholar] [CrossRef]
- Miller, R.; Google’s Chiller-less data center. Data Center Knowledge. Available online: https://www.datacenterknowledge.com/archives/2009/07/15/googles-chiller-less-data-center/ (accessed on 15 July 2009).
- Park, J.; Open Compute Project Data Center v1.0. The Open Compute Project. 2011. Available online: https://docshare.tips/open-compute-project-data-center-v10 (accessed on 22 October 2022).
- Mu, Z.H.; Wang, Y. Air conditioning design of cloud computing data center in Zhongwei, Ningxia. HVAC 2016, 46, 23–26. [Google Scholar]
- Ham, S.W.; Kim, M.H.; Choi, B.N.; Jeong, J.W. Energy saving potential of various air-side economizers in a modular data center. Appl. Energy 2015, 138, 258–275. [Google Scholar] [CrossRef]
- Pan, J.; Wang, K.Y.; Wang, C.P. Development trend of cooling technology in data centers. Telecommun. Inf. 2019, 2, 43–44. (In Chinese) [Google Scholar]
- Niu, X.; Xia, C.; Sun, G. Air conditioning system design with lake water cooling technology of a data center in Qiandao Lake. Heat. Ventilat. Air Condit. 2016, 46, 14–17. [Google Scholar]
- Lee, K.P.; Chen, H.L. Analysis of energy saving potential of air-side free cooling for data centers in worldwide climate zones. Energy Build. 2013, 64, 103–112. [Google Scholar] [CrossRef]
- Liu, C. How is PUE less than 1.10 achieved? Uncovering the Tencent T-block Data Center. Ups Appl. 2016, 6, 16–18. [Google Scholar]
- Weerts, B.A.; Gallaher, D.; Weaver, R.; Vangeet, O. Green data center cooling: Achieving 90% reduction: Airside economization and unique indirect evaporative cooling. In Proceedings of the 2012 IEEE Green Technologies Conference, Tulsa, OK, USA, 19–20 April 2012; pp. 1–6. [Google Scholar]
- DOE. NSIDC Data Center: Energy Reduction Strategies Airside Economization and Unique Indirect Evaporative Cooling. U.S. Department of Energy. Federal Energy Management Program. 2012. Available online: https://www.energy.gov/eere/femp/downloads/nsidc-data-center-energy-reduction-strategies (accessed on 22 October 2022).
- Bi, Y.; Wang, Y.; Ma, X.; Zhao, X. Investigation on the energy saving potential of using a novel dew point cooling system in data centres. Energies 2017, 10, 1732. [Google Scholar] [CrossRef]
- Tozer, R.; Flucker, S. zero refrigeration for data centres in the USA. ASHRAE Trans. 2012, 118, 261–268. [Google Scholar]
- Ndukaife, T.A.; Nnanna, A.G.A. Optimization of Water Consumption in Hybrid Evaporative Cooling Air Conditioning Systems for Data Center Cooling Applications. Heat Transf. Eng. 2019, 40, 559–573. [Google Scholar] [CrossRef]
- Ling, L.; Zhang, Q.; Yu, Y.; Liao, S. A state-of-the-art review on the application of heat pipe system in data centers. Appl. Therm. Eng. 2021, 199, 117618. [Google Scholar] [CrossRef]
- Ding, T.; Chen, X.; Cao, H.; He, Z.; Wang, J.; Li, Z. Principles of loop thermosyphon and its Application in data center cooling systems: A review. Renew. Sustain. Energy Rev. 2021, 150, 111389. [Google Scholar] [CrossRef]
- Li, Q.H.; Huang, H.; Zhang, Z.B. Performance experiment of heat pipe type air. Heat. Vent. Air Cond. 2010, 40, 145–148. (In Chinese) [Google Scholar]
- Han, X.L.; Tu, S.P.; Li, X.Z. Calculation of natural cooling unit for fluorine pumps used in data center. Refrigeration 2018, 37, 75–79. (In Chinese) [Google Scholar]
- Lin, Y.C.; Liu, J.P.; Xu, X.W.; Liu, Z.; Li, G.L. Experimental research on air conditioning system of a computer room based on refrigerant pump pressurization. Refrigeration 2020, 41, 83–88. (In Chinese) [Google Scholar]
- Xu, Z.; Zhang, Y.; Li, B.; Wang, C.C.; Li, Y. The influences of the inclination angle and evaporator wettability on the heat performance of a thermosyphon by simulation and experiment. Int. J. Heat Mass Transf. 2018, 116, 675–684. [Google Scholar] [CrossRef]
- GB 50174-2017; Data Center Design Specification. China Planning Press: Beijing, China, 2017.
- Kim, M.H.; Bullard, C.W. Air-side thermal hydraulic performance of multi-louvered fin aluminum heat exchangers. Int. J. Refrig. 2002, 25, 390–400. [Google Scholar] [CrossRef]
- Bhatti, M.S.; Shah, R.K. Turbulent and transition flow convective heat transfer in ducts. In Handbook of Single-Phase Convective Heat Transfer; Kakaç, S., Shah, R.K., Aung, W., Eds.; Wiley: New York, NY, USA, 1987; pp. 4.1–4.166. [Google Scholar]
- Kandlikar, S.G.; Steinke, M.E. Predicting heat transfer during flow boiling in minichannels and microchannels. ASHRAE Trans. 2003, 109, 667. [Google Scholar]
- Gnielinski, V. New Equations for Heat and Mass Transfer in Turbulent Pipe and Channel Flows. Int. Chem. Eng. 1976, 16, 359–368. [Google Scholar]
- Friedel, L. Improved Friction Pressure Drop Correlation for Horizontal and Vertical Two-Phase Pipe Flow. Proc. Eur. Two-Phase Flow Group Meet. Ispra Italy 1979, 18, 485–491. [Google Scholar]
- Zhang, P.; Wang, B.; Shi, W.; Han, L.; Li, X. Modeling and performance analysis of a two-phase thermosyphon loop with partially/fully liquid-filled downcomer. Int. J. Refrig. 2015, 58, 172–185. [Google Scholar] [CrossRef]
- ASHRAE. ASHRAE Handbook Fundamentals Volume: SI Edition; American Society of Heating, Refrigerating and Air-Conditioning Engineers: Atlanta, GA, USA, 2009; Chapter 4; p. 4.18. [Google Scholar]
- Jin, A.C.; Shi, Z.C.; Shao, S.Q.; Tian, C.Q. Experimental study on the performance of split heat pipe air conditioner using microchannel heat exchanger. Low Temp. Supercond. 2016, 44, 64–68. [Google Scholar]


| Parameter | Device | Range | Accuracy | Quantity |
|---|---|---|---|---|
| Dry-bulb temperature | RHLOG-T-H | −25~55 °C | ±0.3 °C | 8 |
| Relative humidity | E + E210 | 2~98% RH | ±2.5% | 8 |
| Air velocity | SwemaAir300 | 0.1~30 m/s | ±0.1 m/s | 5 |
| Air pressure meter | Setra266 | 0~250 Pa | ±1% FS | 2 |
| Water meter | LYH-8 | 0~600 L/h | ±0.005 L | 1 |
| Fan power meter | ABB, M2 M LCD | 0~60 kW | ±1% | 6 |
| Pump power meter | TTi, EL155RDC | 0~2 kW | ±0.5% | 2 |
| Parameters | Unit | Value |
|---|---|---|
| Cooling capacity Q | kW | 120 |
| Heat pipe condenser inlet air temperature t0,m | °C | 14 |
| Heat pipe evaporator inlet air temperature t1 | °C | 38 |
| Primary air volume (machine room return air) M1 | m3/h | 30,000 |
| Secondary air volume (outdoor fresh air) M2 | m3/h | 66,000 |
| Primary return air temperature/humidity t1/φ1 | °C/% | 38 °C/25% |
| Primary air supply temperature/humidity t2/φ2 | °C/% | 25 °C/50% |
| Condensation temperature of the working mass tc | °C | 22 |
| Workpiece evaporation temperature te | °C | 22.5 |
| Mass flow rate of the working mass G | kg/s | 0.606 |
| Operation Mode | Fluorine Pumps | Compressors | Circulating-Water Pump | Outdoor Air Conditions |
|---|---|---|---|---|
| Power Heat Pipe | Open | Close | Close | td ≤ 14 ℃ |
| Power heat pipe and evaporative condensing | Open | Close | Open | td > 14 °C and tw ≤ 13 °C |
| Mechanical refrigeration-based cooling | Open | Open | Open | td > 14 °C and tw > 13 °C |
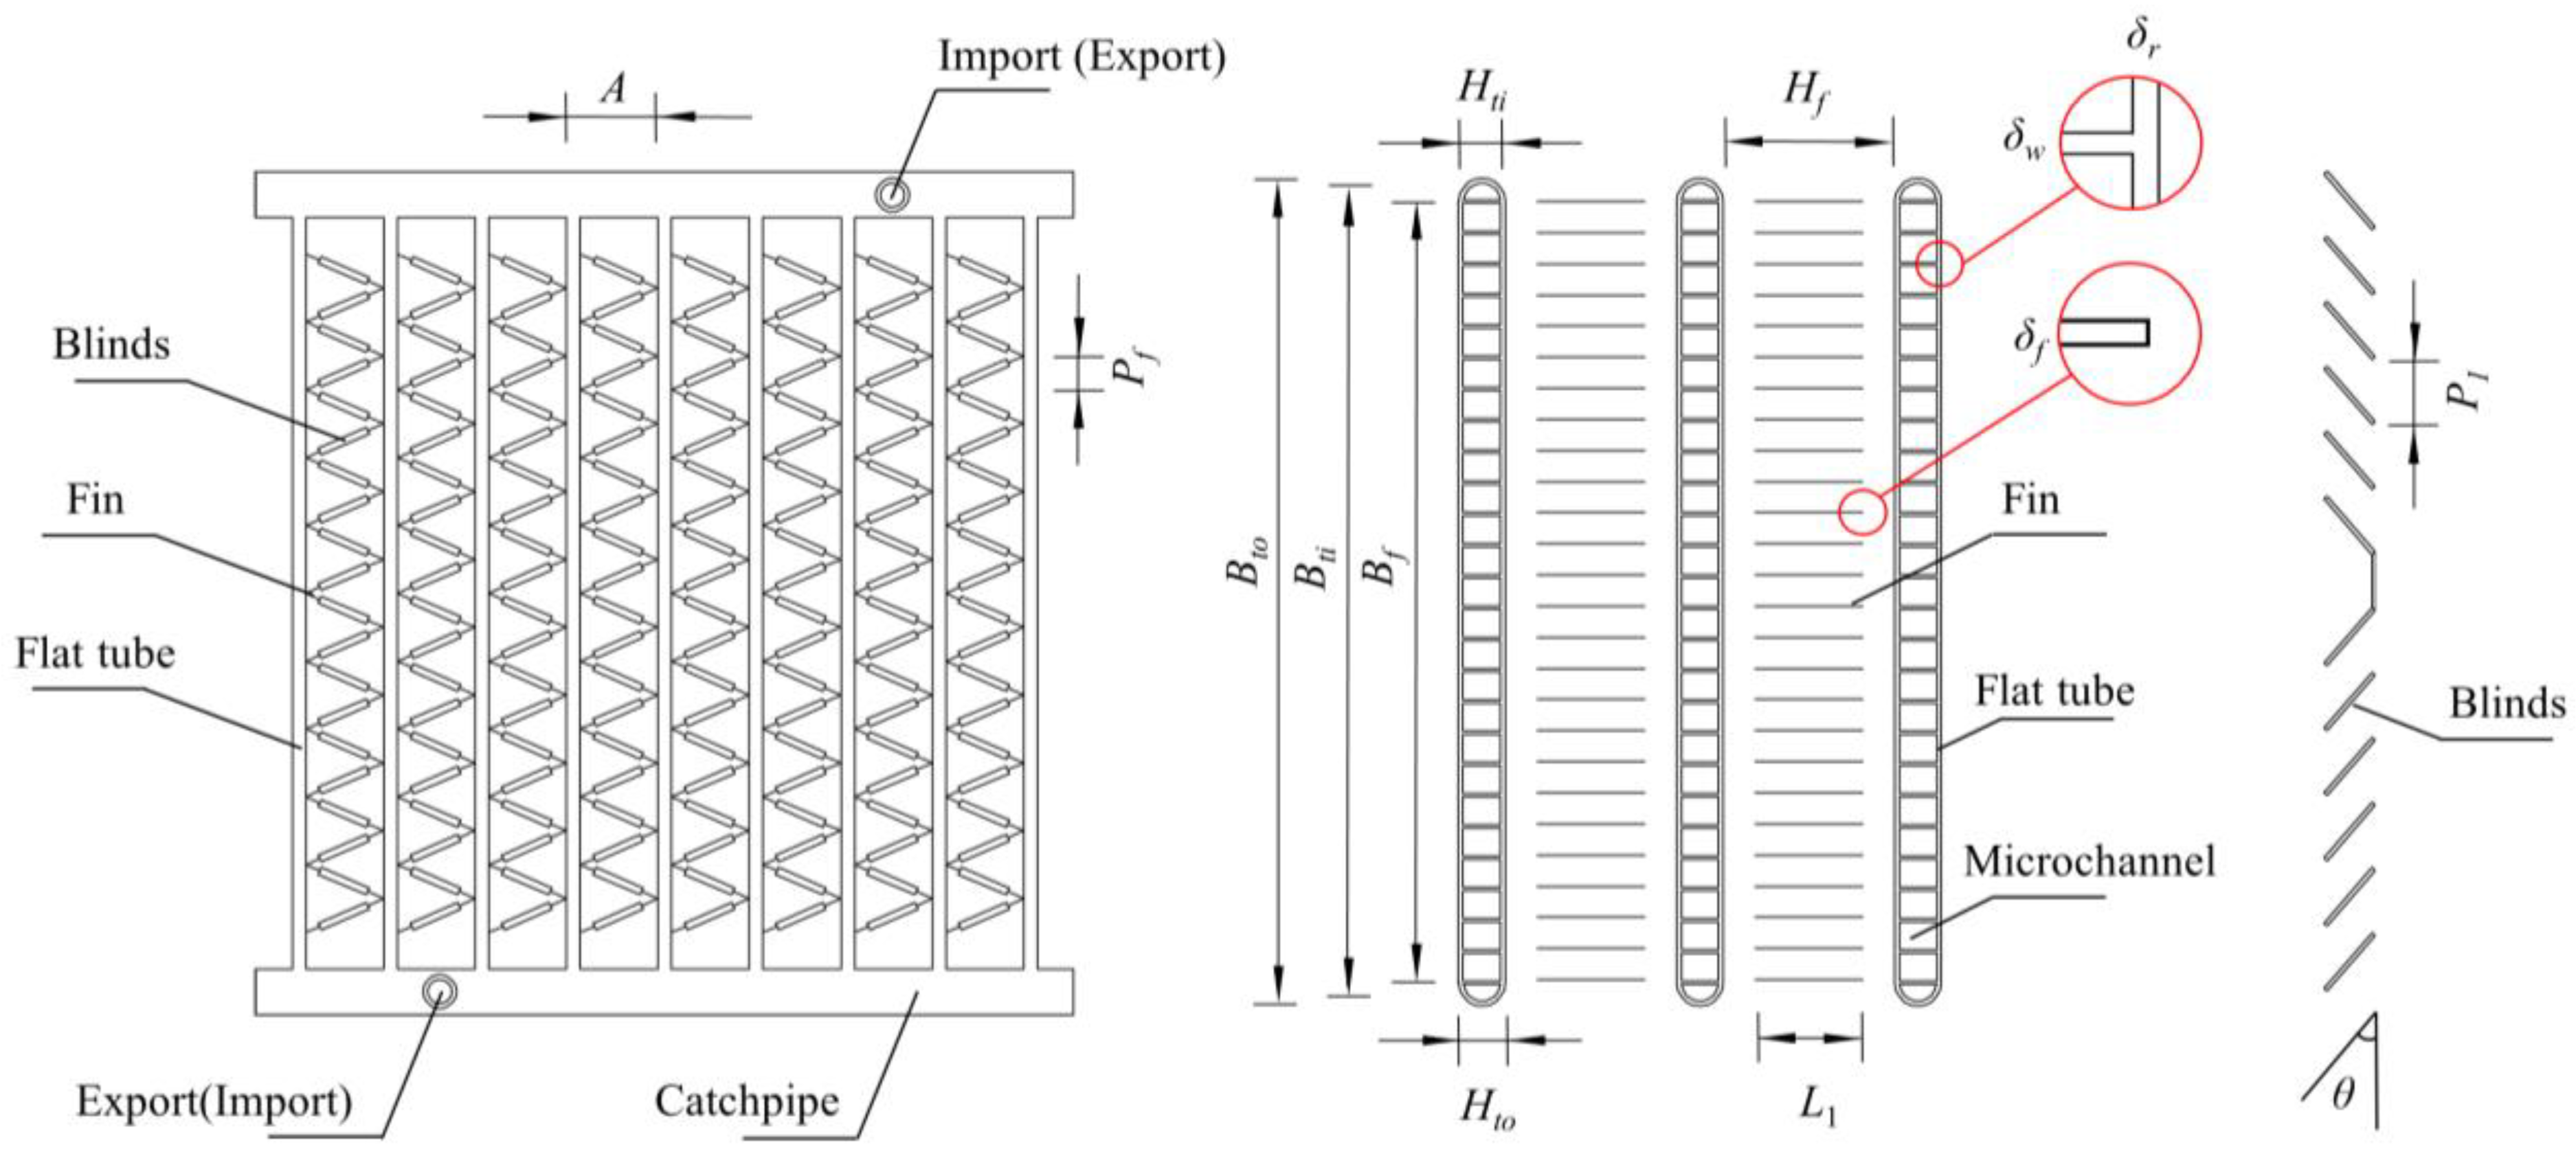
| Structure Parameters | Value (mm) | Structure Parameters | Value (mm) |
|---|---|---|---|
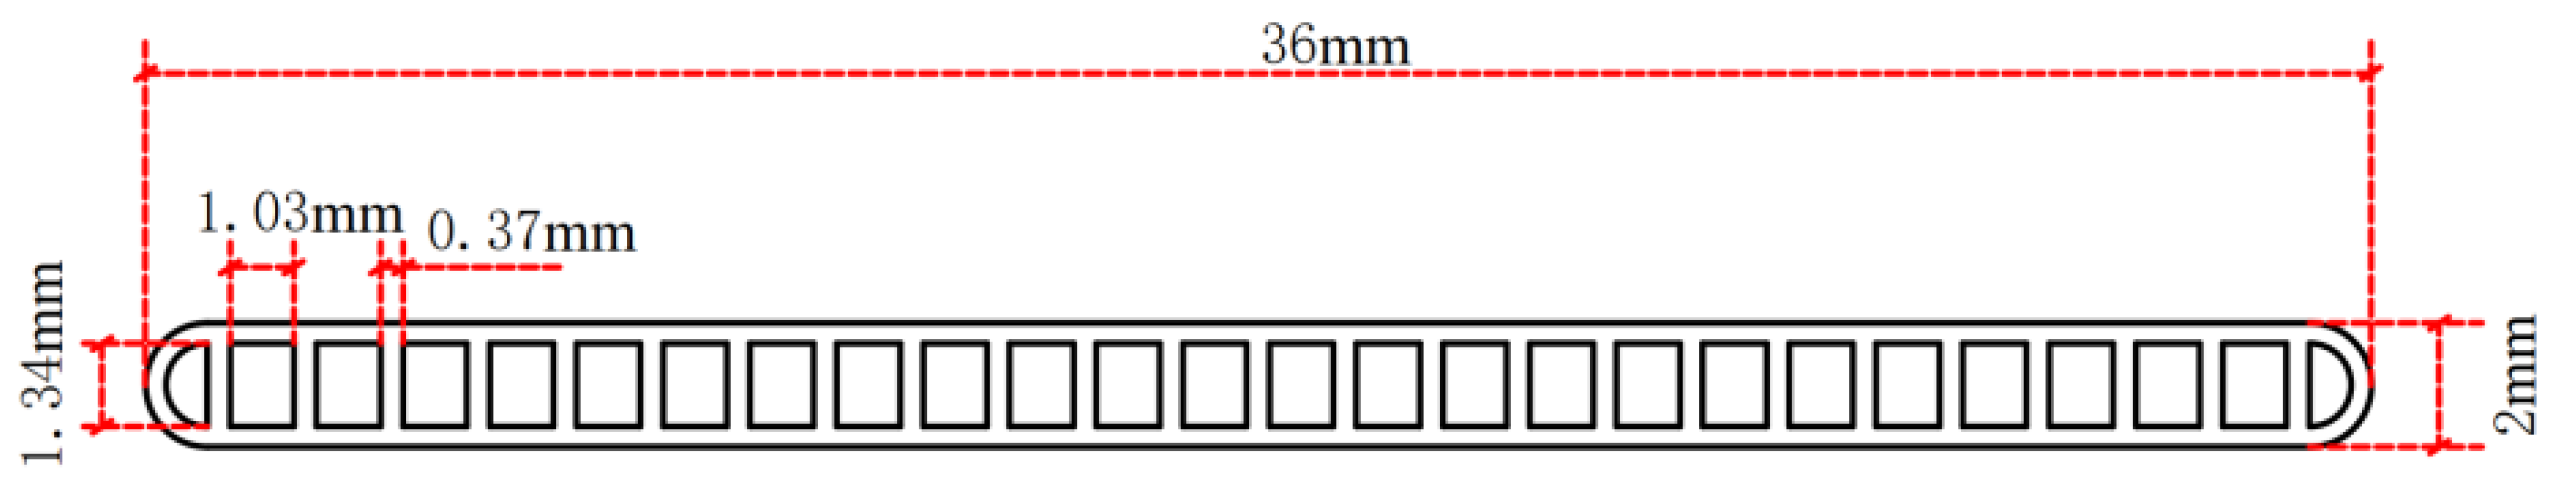
| Flat tube outer width Bto | 36 | Fin width Bf | 36 |
| Flat tube inner width Bti | 34.6 | Fin height Hf | 8 |
| Flat tube outer height Hto | 2 | Fin pitch Pf | 1.3 |
| Flat tube inner height Hti | 1.34 | Shutter angle the ta | 30° |
| Number of flakes Nw | 25 | Shutter length Ll | 6.8 |
| Sheet thickness δw | 0.37 | Shutter spacing Pl | 1 |
| Flat pipe spacing A | 10 | Fin thickness δf | 0.08 |
| Thickness of flat tube δr | 0.33 |
| Evaporator Heat Load Qe (kW) | Air-Side Heat Transfer Coefficient hae (W/(m2·K)) | Refrigerant Heat Transfer Coefficient hre (W/(m2·K)) | Total Heat Transfer Coefficient he (W/(m2·K)) | Heat Exchange Area Ae (m2) | Single Tube Length Le (mm) | Number of Flat Tubes |
|---|---|---|---|---|---|---|
| 120.31 | 131.54 | 2033.18 | 658.53 | 25.58 | 1.6 | 230 |
| Condenser Heat Load Qc (kW) | Air-Side Heat Transfer Coefficient hac (W/(m2·K)) | Refrigerant Heat Transfer Coefficient hrc (W/(m2·K)) | Total Heat Transfer Coefficient hc (W/(m2·K)) | Heat Exchange Area Ac (m2) | Single Tube Length Lc (mm) | Number of Flat Tubes |
|---|---|---|---|---|---|---|
| 120.31 | 169.07 | 1748.2 | 461.60 | 32.58 | 2.1 | 230 |
| Heat Pipe Evaporator | Heat Pipe Condenser | Air Ducts | Liquid Tube | ||
|---|---|---|---|---|---|
| Frictional pressure drop (Pa) | 9157.4 | 12,630.2 | 8.2 | 699.3 | |
| Accelerated pressure drop (Pa) | −1615.9 | 1636.1 | |||
| Gravitational pressure drop (Pa) | 1561 | −1597.2 | |||
| Sudden expansion (Pa) | 628.7 | 6855.6 | |||
| Sudden contraction (Pa) | −28 | −2.6 | |||
| Gas–liquid separator and reservoir (bar) | 0.5 | ||||
| Total system refrigerant resistance (bar) | 0.799 | ||||
| Indoor Environmental Parameters | Outdoor Environmental Parameters | Secondary Air Volume (m3/h) | Primary Air Volume (m3/h) | Filled with Liquid-Phase Quality of Workpiece (kg) | Liquid-Filling Rate (%) | ||
|---|---|---|---|---|---|---|---|
| Inlet Air Dry Bulb Temperature (°C) | Inlet Air Wet Bulb Temperature (°C) | Inlet Air Dry Bulb Temperature (°C) | Inlet Air Wet Bulb Temperature (°C) | ||||
| 38.0 | 22.0 | 14.0 | 10.6 | 66,000 | 30,000 | 10 | 71.5 |
| 12 | 85.8 | ||||||
| 14 | 100.0 | ||||||
| 15 | 107.2 | ||||||
| 16 | 114.4 | ||||||
| 17 | 121.6 | ||||||
| 18 | 128.7 | ||||||
| Temperature (°C) | ≤11 | 11~14 | 14~18 | 18~22 | 22~26 | 26~30 | ≥30 |
|---|---|---|---|---|---|---|---|
| Working time (h) | 3523.6 | 628.8 | 1093.4 | 1157.6 | 1052.2 | 798.4 | 506 |
| Cooling capacity of heat pipe (kW) | 120 | 120 | 94.49 | 32.96 | 3.28 | 0 | 0 |
| Cooling capacity of mechanical cooling (kW) | 0 | 0 | 25.51 | 87.04 | 116.72 | 120 | 120 |
| Total cooling capacity (kW) | 120 | 120 | 120 | 120 | 120 | 120 | 120 |
| Total heat pipe power consumption (kW) | 7.63 | 7.83 | 6.47 | 2.15 | 1.98 | 0 | 0 |
| Total power consumption of evaporative condensation (kW) | 0.47 | 0.68 | 0.75 | 0.75 | 0.75 | 0.75 | 0.75 |
| Total power consumption of mechanical cooling (kW) | 0 | 0 | 9.66 | 23.74 | 29.35 | 32.68 | 34.34 |
| Total power consumption (kW) | 8.10 | 8.51 | 16.88 | 26.64 | 32.08 | 33.43 | 35.09 |
| COP | 14.81 | 14.10 | 7.11 | 4.50 | 3.74 | 3.59 | 3.42 |
| Average COP | 9.43 | ||||||
| Cooling System | Rated Cooling Capacity (kW) | Annual Energy Consumption (kWh) | Annual Average COP | Energy Saving Proportion |
|---|---|---|---|---|
| CRAC | 120 | 328,545 | 3.4 | 3.4 |
| hybrid cooling system | 120 | 124,726 | 9.43 | 62.04% |
Publisher’s Note: MDPI stays neutral with regard to jurisdictional claims in published maps and institutional affiliations. |
© 2022 by the authors. Licensee MDPI, Basel, Switzerland. This article is an open access article distributed under the terms and conditions of the Creative Commons Attribution (CC BY) license (https://creativecommons.org/licenses/by/4.0/).
Share and Cite
Wang, Y.; Huang, X.; Chu, J.; Du, Y.; Tang, X.; Dai, C.; Ma, G. Analysis of an Evaporative Condensation System Coupled to a Microchannel-Separated Heat Pipe for Data Centers. Energies 2022, 15, 9056. https://doi.org/10.3390/en15239056
Wang Y, Huang X, Chu J, Du Y, Tang X, Dai C, Ma G. Analysis of an Evaporative Condensation System Coupled to a Microchannel-Separated Heat Pipe for Data Centers. Energies. 2022; 15(23):9056. https://doi.org/10.3390/en15239056
Chicago/Turabian StyleWang, Ying, Xiang Huang, Junjie Chu, Yan Du, Xing Tang, Cong Dai, and Gang Ma. 2022. "Analysis of an Evaporative Condensation System Coupled to a Microchannel-Separated Heat Pipe for Data Centers" Energies 15, no. 23: 9056. https://doi.org/10.3390/en15239056
APA StyleWang, Y., Huang, X., Chu, J., Du, Y., Tang, X., Dai, C., & Ma, G. (2022). Analysis of an Evaporative Condensation System Coupled to a Microchannel-Separated Heat Pipe for Data Centers. Energies, 15(23), 9056. https://doi.org/10.3390/en15239056