Abstract
In this study, the authors explored the issues of the Soderbergh electrolysis cell’s increase in economic efficiency. This result was achieved by analyzing the temperature fields of the electrolysis cell in order to determine the overheating points. As a result, it led to the determination of the points of the hearth bottom’s subsequent breakdown, causing the failure of the electrolysis cell. In this paper, the mathematical modeling of the temperature fields using a spatially distributed mathematical model and conducted experimental studies were carried out. The mathematical model also provides the opportunity to measure the temperature field in the hearth bottom (at the bottom) of the OA-300M electrolysis cell. The results of the given research can be used to solve the experimental determination of the hearth bottom internal defect problem.
1. Introduction
The growth of the consumer market [1] requires the manufacturer to constantly increase the production volumes and improve the product quality. It is impossible to imagine modern phones and tablets weighing several kilograms. To reduce the weight of products, manufacturers use lightweight and durable materials. One of these materials is aluminum. In recent years, the demand for this lightweight and durable material has increased many times over. The main method for producing aluminum is electrolysis. The method proposed by Soderbergh at the beginning of the 20th century has changed little to the present day. Volumes have increased, while the technology has largely remained the same. At the same time, the efficiency of the electrolysis process has increased significantly from 2–5% in the early 20th century to 40% in the present day. Currently, the transition to inert anodes is being carried out. These anodes do not oxidize during electrolysis. Their use increases the efficiency of the electrolysis cell up to 50–60% [2,3,4] and reduces emissions into the atmosphere, but does not remove the need for better control of the process. The main parameter influencing the electrolysis process is an electric current that creates an electromagnetic field that ensures the electrolysis process. However, it is only possible to evaluate the parameters of electrolysis by indirect parameters. One of these parameters is the temperature field of the bath. By measuring the bath’s temperature field, it is possible to determine the degree of the bath wear, the temperature and quality of the electrolyte, the rate of metal production, etc. with an accuracy of up to a day.
There is a classical differential equation of heat conduction in the Cartesian coordinate system that is used to build a mathematical model of the temperature field behavior for a spatially distributed object. The model is supplemented with uniqueness conditions, which are represented by the boundary and initial conditions of the temperature field. Since the input parameters are anodes located in some points, the temperature field in this case is determined using the Green’s function or the impact function of the heat point source.
2. Description of the Technological Process and Formulation of the Problem
The maintenance of an industrial electrolysis cell is reduced to the sequential execution of a number of operations. They must be in accordance with the technical regulations to conduct the technological process and the control of physical parameters that determine the quality of the flow of physical and electrochemical processes. The parameters depending on the external environmental factors are also included.
Thus, an indicator of the current operation of the electrolysis cell is the totality of the influence of the objective external and internal subjective factors, characteristic visual signs of the physical and chemical environment, and the state of the electrolysis cell and its parts.
The thermal balance of the electrolysis cell is one of the main interrelated factors that determine the technological process of electrolysis. It is characterized by a complex of external and internal parameters including environmental conditions, design features, and indicators of the internal heat balance of the chemical environment of the electrolyte.
Methods for controlling and maintaining the heat balance represent an extensive set of measures aimed at ensuring the optimal process of the electrolysis of molten salts.
Therefore, for example, to ensure the internal thermal balance of the electrolysis cell, the electrolyte crust must be strong and uniform over the entire area of the anode array and the filling of the mixture of alumina and recycled crushed cryolite must have a calculated height relative to the upper part of the anode fork with nipples. Furnace encrustations and hearth accretions should correspond to the optimal shape of the working space. The color of the lights from burning anode gases should visually be bright purple. The electrolyte should be “cold” and have a burgundy hue, there should be no foam and residues of a destroyed crust on the surface, and gas evolution should be observed along the entire perimeter of the anode array [5,6,7].
The electrolyte temperature is one of the main indicators reflecting the current technological properties of the electrolyte. The cryolite ratio (composition) of the melt (NaF:AlF3) and the amount of additives used in the melt (CaF2, LiF, MgF2. NaC) have a direct effect on the melting point of the electrolyte [8,9,10]. Electrolyte temperature adjustment during technological operations is carried out by changing the voltage on the electrolysis cell, which makes it possible to provide an optimal working cryolite ratio equal to 2.2–2.36. This significantly reduces the volatility of the electrolyte components and increases its electrical conductivity, and, as a result, the quality of the produced raw aluminum [11,12,13].
Temperature measurement is carried out under conditions of high chemical activity of the electrolyte, so the sensitive elements of the measuring instruments must be reliably protected from the effects of the medium being measured. The range of measured temperatures averages from 200 to 1100 °C [14,15,16]. Existing measurement methods used in industrial production are based on the direct and indirect measurement of physical quantities directly related to their temperature change.
However, it is important to note the need to take into account the liquidus temperature (overheating). The solubility of alumina depends on its value [17,18,19,20,21,22,23,24,25,26,27,28,29,30]. Based on this, it can be concluded that by controlling the actual temperature of the electrolyte with a certain frequency during the technological cycle and in the presence of statistics of melt recipes relative to their temperatures, it is possible to predict the chemical composition of the electrolyte in an operation electrolysis cell.
At the same time, measurements are of scientific interest during the “cold” run (935–940 °C) and “hot” run (980–1100 °C). In these technological modes, the electrolyte has a specific liquids temperature determined for it, and the operational control of the internal heat balance in the electrolyte environment can improve the quality of the electrolysis process control relative to the boundary temperature values.
The results of the computer simulation show the homogeneity of the temperature field. However, as part of the industrial operation of electrolysis cells, it has been shown that such a homogenous field is unlikely. This is due to the fact that the cryolite ratio is determined by the technical parameters and the effect of the electrolyte on the refractory layer is theoretically homogeneous. However, the most aggressive (hot) spots can have the greatest impact: (1) in areas of intense electrolyte flow during MHD instability caused by a magnetic field; and (2) in areas with the highest current conductivity with uneven current separation in the current-carrying elements of the hearth and cathode. This fact leads to local overheating of the lining, its local destruction, and the intense electro-corrosion of metal elements.
Thus, we set the task of modeling and monitoring the temperature field of the OA-300M electrolysis cell, followed by a comparison of the results.
3. Research Methodology
To describe spatially distributed rectangular objects, a classical equation of the form is used:
where a2 is the coefficient of thermal conductivity.
The boundary and initial conditions of the control object are [28,29,30]:
where τ is time; x, y are the spatial coordinates; lx, ly are the overall parameters of the control object.
Since the input parameters for the system are point anodes (in the mathematical representation, point input actions), the temperature field is determined using the Green’s function. To describe the hearth with electrodes–anodes integrated into the technological process, let us convert it to the following form:
where G is the temperature value at points x, y, at time t, with an input action at point p, v. Schematically, this can be represented as Figure 1 (l1 and l2 are the geometric parameters of the object):
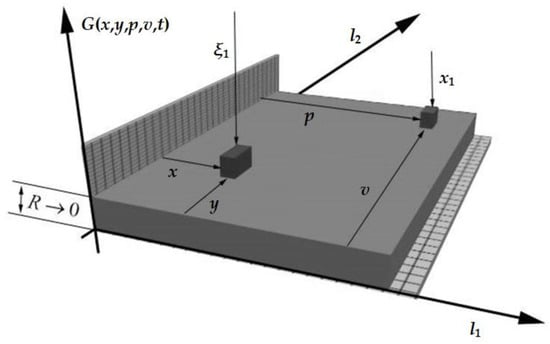
Figure 1.
The object in question.
The temperature field was calculated for the following system parameters: l1 = l2 = 10, a2 = 0.00001, x1 = ξ1 = 1, Tset = 0.3, d = 9, ξ1 = {1,2,3,4,5,6,7,8,9}.
Then:
The temperature field behavior was simulated in all areas of the object under study. Graphically, this can be represented in the form of Figure 2.
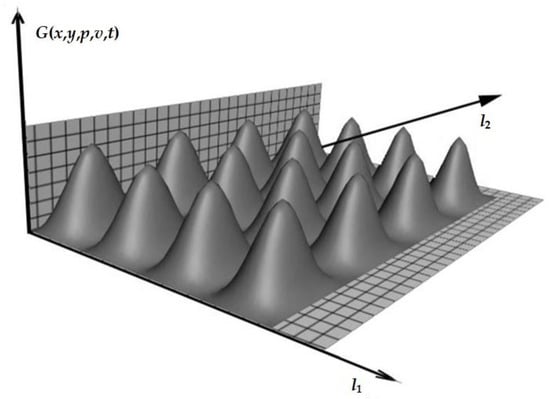
Figure 2.
First heating pulse (the temperature and scale of the object are indicated in conventional units).
Over time, without constant exposure, the temperature will drop and take the form shown in Figure 3.
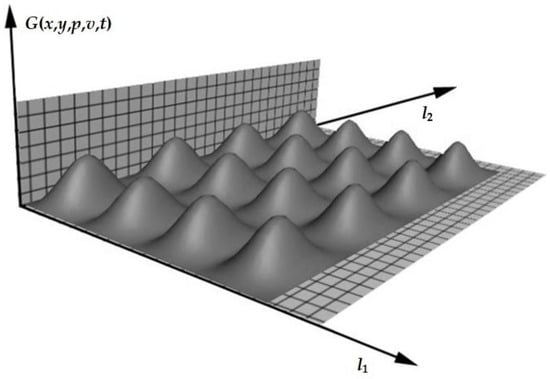
Figure 3.
The system is in the process of reaching a stable state (the temperature and scale of the object are indicated in conventional units).
As can be seen from the graph, the temperature field of one source affects the sources located in the immediate vicinity. Therefore, the dynamic temperature field can be determined by the following formula:
The resulting equation shows the rate of propagation of the temperature field in an object with geometric parameters denoted as l1, l2, taking into account the initial heating function, which is the input action at point z(p), with number d, at time τp. The dynamic temperature field was calculated. The results can be observed in Table 1.

Table 1.
Study of the bottom of the electrolysis cell.
After analyzing the data in the table, we obtained an intermediate conclusion: in the study of objects with a homogeneous structure, thermal processes proceed in the same way in all directions.
However, this conclusion takes place in the analysis of ideal objects. When considering industrial facilities, the data may differ. Experimental studies were carried out on monitoring the thermal field of the OA-300M electrolysis cell.
4. Experimental Research
The OA-300M heavy-duty electrolysis cell, shown in Figure 4, is the main source of the industrial production of aluminum.
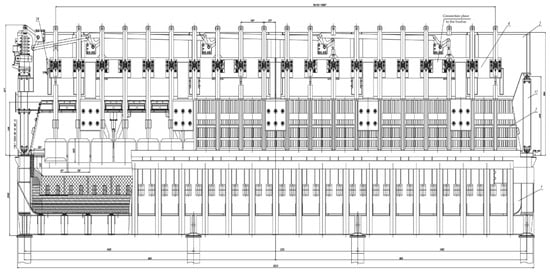
Figure 4.
Longitudinal section of the OA-300M electrolysis cell [31].
The main characteristics of the OA-300M electrolysis cell are presented in Table 2. As can be seen from the table, the operating temperature of the electrolysis cell is 950 degrees. Therefore, to monitor the temperature field, means of measuring the temperature field in the range up to 1000 degrees can be used. Outside the cell, the temperature rises no higher than 300 degrees.
Table 2.
The main characteristics of the electrolytic cell OA-300M [21,22,23,24,25,26,27,28,29,30,31,32,33].
The temperature field formed in the cell, which due to the heterogeneity of the structure and the constant movement of the electrolyte was heated unevenly. In the case of damage to the inner part of the lining, overheating spots could also be observed. To conduct research, temperature sensors were installed in the middle and end parts of the bottom of the OA-300M electrolysis cell. As an object of study, the electrolytic cell of the Irkutsk Aluminum Plant was considered. The temperature was measured by contact sensors based on the Hall effect, and parallel control was carried out by a contact temperature sensor of the TK-5.01 type.
5. End Part Research
The hearth bottom is a rectangular bath. From the bottom of the bath, cathode risers exit, which transfer energy through a flexible connection to the busbar. The exit point of the cathode from the hearth bottom is one of the most vulnerable places in the hearth bottom. Thanks to the combined connection of the hearth bottom and cathode, the temperature field of the molten metal is transferred to the outer part of the hearth bottom. The sensors were installed to register the temperature field in the area of cathode exit No. 5. With the help of a specially developed software module, we can display the obtained data on a scale.
The graphs in Figure 5 show the distribution of the temperature field in the area of the equidistant location of 49 sensors, forming a grid of seven sensors in width and seven sensors in length. Figure 5 shows that the temperature field had a slight overheating in the region of cathode 5. Cathode parts 4 and 6 had a lower temperature. The difference between the heated cathode 5 and the colder cathodes 4 and 6 was 30 degrees. This can be caused by a huge number of factors including hearth bottom failure, crust formation, new backfill, unstable melt hydrodynamics, etc. Due to active and passive thermal insulation, the temperature field of an overheated cathode is not transmitted to adjacent cathodes operating in the normal mode.
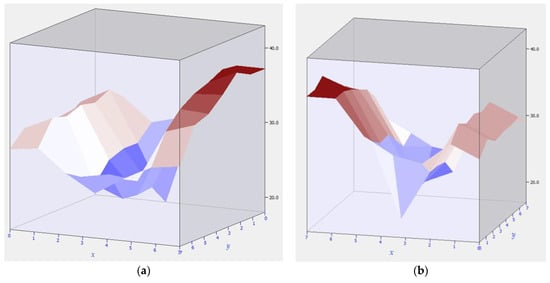
Figure 5.
Overheating of cathode No. 5 and part of the electrolysis cell bottom: (a) overheating area 4–5; (b) overheating area 5–6.
Let us monitor the cathodes of the entire space of the bottom in order to identify existing defects. Figure 6a shows the temperature field of cathode No. 12. This cathode was overheated on one side only. Such a field structure gives grounds to assume mechanical damage to the cathode riser on the left side.
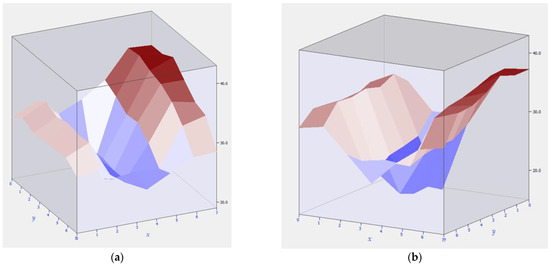
Figure 6.
Overheating of the cathode part of the electrolysis cell bottom: (a) Hearth bottom with pronounced overheating of the right side (cathode 12); (b) Hearth bottom with pronounced overheating of both cathodes (cathodes 17–18).
In turn, cathodes 17 and 18 are also overheated. But the temperature field is located evenly, which indicates damage to the inner lining.
The corner parts of the hearth bottom were studied. Usually, heat outflow is observed in the end parts of the electrolysis cell. The study was carried out in two phases. The first phase is the phase in which the accumulated aluminum was extracted from the electrolysis cell. The second phase is the phase of the final stage of aluminum production. The first phase of operation is shown in Figure 7a.
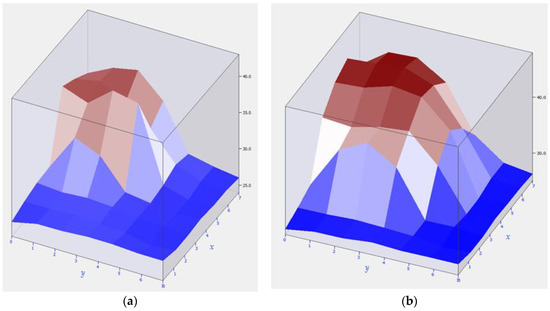
Figure 7.
Overheating of the corner part of the hearth bottom at different phases of operation: (a) Overheating area at the initial phase of aluminum production; (b) Overheating area at the final phase of aluminum production.
In the initial mode of operation, in the absence of accumulated aluminum, the formed temperature field had a low temperature spread. Figure 7a shows that there was practically no overheating, and the temperature field was evenly distributed. This distribution was associated with the absence of the thermal motion of aluminum in the electrolysis cell.
Over time, aluminum is produced in the electrolysis cell. The electromagnetic field involved in the electrolysis process, due to its uneven distribution, sets in motion molten aluminum, which, in turn, participates in the formation of new electromagnetic and thermal fields. Aluminum has a physical impact on the inner part of the hearth bottom—the lining, which is deformed under mechanical stress. In cathode terminal elements, this has the maximum effect. Breaking off of the refractory lining leads to greater thermal conductivity of the hearth, its burnout, and subsequent breakdown. Figure 7b shows the overheating point of the hearth. Knowing the rate of burnout of the hearth wall, it is possible to calculate the breakdown time.
6. Comparison of Results
Let us compare the results of mathematical modeling with the results of the experimental studies.
The results showed a significant difference in the results of full-scale tests compared with the mathematical modeling. The reason for this difference lies in the technological process of aluminum electrolysis, and a rather simplified mathematical model that does not take into account the material flows, the influence of an electric field, the formation of accretions, etc. In the process of the industrial production of aluminum, the human factor has a huge influence. Anode leads are manually welded, which leads to a current drop on the anode–electrolyte bond. Due to this, an inhomogeneous field is formed, setting in motion the accumulated aluminum. Bad contacts of the anode bath lead to a drop in current, and, in the worst case, a change in the polarity of the movement of currents. These and other factors caused by manual labor cannot be taken into account in a mathematical model. However, when drawing up a conceptual model, these errors can be minimized for a particular production. However, even in this case, there are no guarantees of a stable flow of the technological process. Thus, the need to monitor the technical parameters of the electrolysis cell in real-time is once again confirmed.
7. Discussion
The issues of increasing energy efficiency have been dealt with for a long time. Most of these works have been aimed at eliminating specific defects of the electrolysis cell. For example, Mintsis, M.Ya. [4] described the need to take into account the electromagnetic component of the electrolysis cell by considering the degree of influence on the cryolite ratio. Martynova E.S. [32], in turn, suggested the use of various types of computer simulation for these tasks, and Boikov A.V. (e.g., [33,34,35]) constructed complex integer models. Accounting for the spatial distribution of the object has been described by Pershin I.M. [36,37,38]. Scientists from different countries are trying to build complex models of electrolyzers. This task is reduced to the construction of a regression model of the process of aluminum electrolysis. Petrov P.A., in turn, offered a communication of all functions within the framework of one computer complex. Summarizing the knowledge of these authors and other sources, the team of authors in this study demonstrated the need for continuous monitoring of the cell parameters. In the study, the authors monitored the thermal field, which is an indirect parameter of the generated electromagnetic field, and a direct parameter of the technical condition of the electrolysis cell bottom. It is important to note that, based on the statistical data provided by the Irkutsk Aluminum Plant, the influence of the human factor on the technological process of aluminum electrolysis was proven, which significantly expanded the scope of the results obtained in this study [39,40,41,42,43].
8. Conclusions
In this study, the authors considered the possibility of reducing the cost of aluminum production due to the experimental determination of internal defects in the hearth bottom. Within the framework of this study, the following results were obtained:
- The mathematical model of heat transfer of a spatially distributed object was built.
- Experimental studies were carried out to measure the temperature field of the electrolysis cell OA-300M bottom.
- Conclusions were drawn about the possibility of the experimental determination of internal defects of the hearth bottom.
It is also important to note that in the case of determining the thermal field at the stages of commissioning, primary operation, and permanent operation, it is possible to determine the burn-out rate of the electrolysis cell lining, which in the future will make it possible to predict emergency situations and determine the time for economically profitable decommissioning of the hearth bottom from operation.
Author Contributions
Conceptualization, Y.V.I. and T.V.K.; Methodology, T.V.K.; Software, Y.V.I. and M.-A.M.A.; Validation, T.V.K. and M.-A.M.A.; Formal analysis, T.V.K.; Investigation, M.-A.M.A.; Resources, Y.V.I.; Data curation, T.V.K.; Writing—original draft preparation, T.V.K.; Writing—review and editing, Y.V.I. and M.-A.M.A.; Visualization, T.V.K.; Supervision, Y.V.I.; Project administration, M.-A.M.A.; Funding acquisition, Y.V.I. All authors have read and agreed to the published version of the manuscript.
Funding
This research received no external funding.
Institutional Review Board Statement
Not applicable.
Informed Consent Statement
Not applicable.
Data Availability Statement
Not applicable.
Acknowledgments
The authors express their gratitude to Oleg Aleksandrovich Belyayevskiy for the possibility of the physical full-scale tests and provision of the statistical measurement data on the electrolysis cells of the Irkutsk Aluminum Plant.
Conflicts of Interest
The authors declare no conflict of interest.
References
- Aluminum Market: Global Demand, Growth Analysis & Opportunity Outlook 2020–2024. Available online: https://www.yahoo.com/now/aluminum-market-global-demand-growth-050000911.html (accessed on 9 September 2022).
- Kvande, H. Production of primary aluminium. In Fundamentals of Aluminium Metallurgy; Production, Processing and Applications; Woodhead Publishing Series in Metals and Surface Engineering: Cambridge, UK, 2011; pp. 49–69. Available online: www.sciencedirect.com/science/article/pii/B9781845696542500031 (accessed on 9 September 2022).
- Ferrous and Non-Ferrous Metallurgy at Metallolome.ru. Available online: https://metallolome.ru// (accessed on 9 September 2022).
- Mintsis, M.Y. Current Distribution in Aluminum Electrolyzers. In Monograph; SibGIU: Novokuznetsk, Russia, 2002; 126p. (In Russian) [Google Scholar]
- Pershin, I.M.; Malkov, A.M.; Drovosekova, T.I. The study of periodic effects on parameters of hydrolytospheric processes. In Proceedings of the International Science and Technology Conference, Vladivostok, Russia, 1–2 March 2019; p. 8725353. [Google Scholar] [CrossRef]
- Pershin, I.M.; Malkov, A.V.; Pomelyayko, I.S. Design of a Distributed Debit Management Network of Operating Wells of Deposits of the CMW Region. Commun. Comput. Inf. Sci. 2021, 1396 CCIS, 317–328. [Google Scholar] [CrossRef]
- Plotnikova, N.V.; Skeeba, V.Y.; Martyushev, N.V.; Miller, R.A.; Rubtsova, N.S. Formation of high-carbon abrasion-resistant surface layers when high-energy heating by high-frequency currents. IOP Conf. Ser. Mater. Sci. Eng. 2016, 156, 012022. [Google Scholar] [CrossRef]
- Novoselov, A.G.; Sorokin, S.A.; Baranov, I.V.; Martyushev, N.V.; Rumiantceva, O.N.; Fedorov, A.A. Comprehensive Studies of the Processes of the Molecular Transfer of the Momentum, Thermal Energy and Mass in the Nutrient Media of Biotechnological Industries. Bioengineering 2022, 9, 18. [Google Scholar] [CrossRef]
- Skeeba, V.Y.; Ivancivsky, V.V.; Martyushev, N.V. Peculiarities of high-energy induction heating during surface hardening in hybrid processing conditions. Metals 2021, 11, 1354. [Google Scholar] [CrossRef]
- Wei, W.; Geng, S.; Wang, F. Evaluation of Ni-Fe base alloys as inert anode for low-temperature aluminium electrolysis. J. Mater. Sci. Technol. 2021, 107, 216–226. [Google Scholar] [CrossRef]
- Martirosyan, A.V.; Martirosyan, K.V.; Yanukyan, E.G. Methods of complex object’s transfer function calculation for distributed control system. J. Math. Stat. 2014, 10, 408–413. [Google Scholar] [CrossRef]
- Kim, M.; Kang, J.; Kim, J.; Kim, J. Corrosion Protection Oxide Scale Formed on Surface of Fe-Ni m (M = Al, Cr, Cu) Inert Anode for Molten Salt Electrolysis. Materials 2022, 15, 719. [Google Scholar] [CrossRef]
- Huang, R.; Li, Z.; Cao, B. Dynamic plant-wide process monitoring based on distributed slow feature analysis with inter-unit dissimilarity. Korean J. Chem. Eng. 2022, 39, 275–283. [Google Scholar] [CrossRef]
- Liu, X.; Licht, G.; Wang, X.; Licht, S. Controlled Growth of Unusual Nanocarbon Allotropes by Molten Electrolysis of CO2. Catalysts 2022, 12, 125. [Google Scholar] [CrossRef]
- Korshunov, G.I.; Eremeeva, A.M.; Drebenstedt, C. Justification of the use of a vegetal additive to diesel fuel as a method of protecting underground personnel of coal mines from the impact of harmful emissions of diesel-hydraulic locomotives. J. Min. Inst. 2021, 247, 39–47. [Google Scholar] [CrossRef]
- Meshkov, A.A.; Korshunov, G.I.; Kondrasheva, N.K.; Eremeeva, A.M.; Seregin, A.S. Method of Reducing Air Pollution of the Coal Mines Working Areas with Diesel Locomotives Harmful Emissions. Bezop. Tr. V Promyshlennosti. 2020, 1, 68–72. (In Russian) [Google Scholar] [CrossRef]
- Eremeeva, A.M.; Kondrasheva, N.K.; Korshunov, G.I. Method to reduce harmful emissions when diesel locomotives operate in coal mines. Top. Issues Ration. Use Nat. Resour. 2020, 1, 10–16. [Google Scholar] [CrossRef]
- Bakesheva, A.T.; Fetisov, V.G.; Pshenin, V.V. A refined algorithm for leak location in gas pipelines with determination of quantitative parameters. Int. J. Eng. Res. Technol. 2019, 12, 2867–2869. [Google Scholar]
- Nikolaev, A.K.; Dokoukin, V.P.; Lykov, Y.V.; Fetisov, V.G. Research of processes of heat exchange in horizontal pipeline. IOP Conf. Ser. Mater. Sci. Eng. 2018, 327, 032041. [Google Scholar] [CrossRef]
- Fetisov, V.; Mohammadi, A.H.; Pshenin, V.; Kupavykh, K.; Artyukh, D. Improving the economic efficiency of vapor recovery units at hydrocarbon loading terminals. Oil Gas Sci. Technol. 2021, 76, 38. [Google Scholar] [CrossRef]
- Golovina, E. Environmental peculiarities of transboundary groundwater management. Int. J. Mech. Eng. Technol. 2019, 10, 511–519. [Google Scholar]
- Golovina, E.; Chvileva, T. Key aspects in the field of state management of groundwater production for commercial use. ARPN J. Eng. Appl. Sci. 2017, 12, 5023–5028. [Google Scholar]
- Saveliev, D.S.; Sidorenko, S.A. Effects of competitive martial arts on first-year students’ psychophysiological potential. Teor. I Prakt. Fiz. Kult. 2017, 5, 43–45. [Google Scholar]
- Ivanov, V.V.; Sidorenko, S.A. Transportless mining system in developing the suite of three horizontal seams carbonate rocks. Int. J. Pharm. Technol. 2016, 8, 27216–27224. [Google Scholar]
- Sidorenko, S.A.; Panchenko, I.A. Substantiation of parameters of the technology of mining thick flat beds by underground method with splitting the bed into two. Biosci. Biotechnol. Res. Asia 2015, 12, 2921–2928. [Google Scholar] [CrossRef]
- Beloglazov, I.; Savchenkov, S.; Bazhin, V.; Kawalla, R. Synthesis of Mg–Zn–Nd master alloy in metallothermic reduction of neodymium from fluoride–chloride melt. Crystals 2020, 10, 985. [Google Scholar] [CrossRef]
- Savchenkov, S.A.; Bazhin, V.Y.; Volkova, O. Tendencies of innovation development of the russian iron and steel industry on the base of patent analytics for the largest national metallurgical companies. CIS Iron Steel Rev. 2020, 20, 76–82. [Google Scholar] [CrossRef]
- Meshkov, A.A.; Kazanin, O.I.; Sidorenko, A.A. Improving the efficiency of the technology and organization of the longwall face move during the intensive flat-lying coal seams mining at the kuzbass mines. J. Min. Inst. 2021, 249, 342–350. [Google Scholar] [CrossRef]
- Bazhin, V.Y.; Issa, B. Influence of heat treatment on the microstructure of steel coils of a heating tube furnace. J. Min. Inst. 2021, 249, 393–400. [Google Scholar] [CrossRef]
- Trushko, V.L.; Utkov, V.A.; Bazhin, V.Y. Topicality and possibilities for complete processing of red mud of aluminous production. J. Min. Inst. 2017, 227, 547–553. [Google Scholar] [CrossRef]
- Shanin, I.M. Multi-Level Control of Heavy-Power Electrolysis Cell Taking into Account the Thermal State. Ph.D. Thesis, St. Petersburg Mining University, Saint Petersburg, Russia, 2017. (In Russian). [Google Scholar]
- Pedro, A.A.; Bazhin, V.Y.; Suslov, A.P.; Firsov, A.Y.; Martynova, E.S. Power control of an open electric arc of an electrode furnace. Steel 2017, 7, 21–23. [Google Scholar]
- Boikov, A.V.; Payor, V.A.; Savelev, R.; Kolesnikov, A. Synthetic Data Generation for Steel Defect Detection and Classification Using Deep Learning. Symmetry 2021, 13, 1176. [Google Scholar] [CrossRef]
- Boikov, A.V.; Savelev, R.V.; Payor, V.A.; Potapov, A. Universal Approach for DEM Parameters Calibration of Bulk Materials. Symmetry 2021, 13, 1088. [Google Scholar] [CrossRef]
- Vasilyeva, N.V.; Boikov, A.V.; Erokhina, O.O.; Trifonov, A.Y. Automated digitization of radial charts. J. Min. Inst. 2021, 247, 82–87. [Google Scholar] [CrossRef]
- Malkov, A.V.; Pershin, I.M.; Pomelyayko, I.S. Designing a Control System for Underground Water Intakes. IOP Conf. Ser. Earth Environ. Sci. 2019, 272, 022026. [Google Scholar] [CrossRef]
- Drovosekova, T.I.; Pershin, I.M. Peculiarities of modelling hydro-lithospheric processes in the region of Kavkazskiye Mineralnye Vody (caucasus mineral springs). In Proceedings of the 19th International Conference on Soft Computing and Measurements, Saint Petersburg, Russia, 25–27 May 2016; pp. 215–217. [Google Scholar] [CrossRef]
- Evseeva, M.M.; Rud’, N.I.; Pershin, I.M. The environmental conditions of the Kavkazskie Mineralnye Vody (Caucasian Mineral Waters) health resort region, methods for their monitoring and improvement. Vopr. Kurortol. Fizioter. I Lech. Fiz. Kult. 2012, 5, 68–71. [Google Scholar]
- Golovina, E.I.; Grebneva, A.V. Management of groundwater resources in transboundary territories (on the example of the Russian Federation and the Republic of Estonia). J. Min. Inst. 2021, 252, 788–800. [Google Scholar] [CrossRef]
- Gerasimova, I.G.; Oblova, I.S.; Golovina, E.I. The demographic factor impact on the economics of the arctic region. Resources 2021, 10, 117. [Google Scholar] [CrossRef]
- Korshunov, G.I.; Eremeeva, A.M.; Seregin, A.S. Justification of reduction in air requirement in ventilation of coal roadways with running diesel engines. Min. Inf. Anal. Bull. 2022, 3, 47–59. [Google Scholar] [CrossRef]
- Kirsanova, N.; Lenkovets, O.; Hafeez, M. Issue of accumulation and redistribution of oil and gas rental income in the context of exhaustible natural resources in arctic zone of Russian Federation. J. Mar. Sci. Eng. 2020, 8, 1006. [Google Scholar] [CrossRef]
- Ivanov, A.V.; Smirnov, Y.D.; Chupin, S.A. Development of the concept of an innovative laboratory installation for the study of dust-forming surfaces. J. Min. Inst. 2021, 251, 757–766. [Google Scholar] [CrossRef]
Publisher’s Note: MDPI stays neutral with regard to jurisdictional claims in published maps and institutional affiliations. |
© 2022 by the authors. Licensee MDPI, Basel, Switzerland. This article is an open access article distributed under the terms and conditions of the Creative Commons Attribution (CC BY) license (https://creativecommons.org/licenses/by/4.0/).