
Improving Structural Safety of L-Type Flange Joint for Wind Towers


Abstract
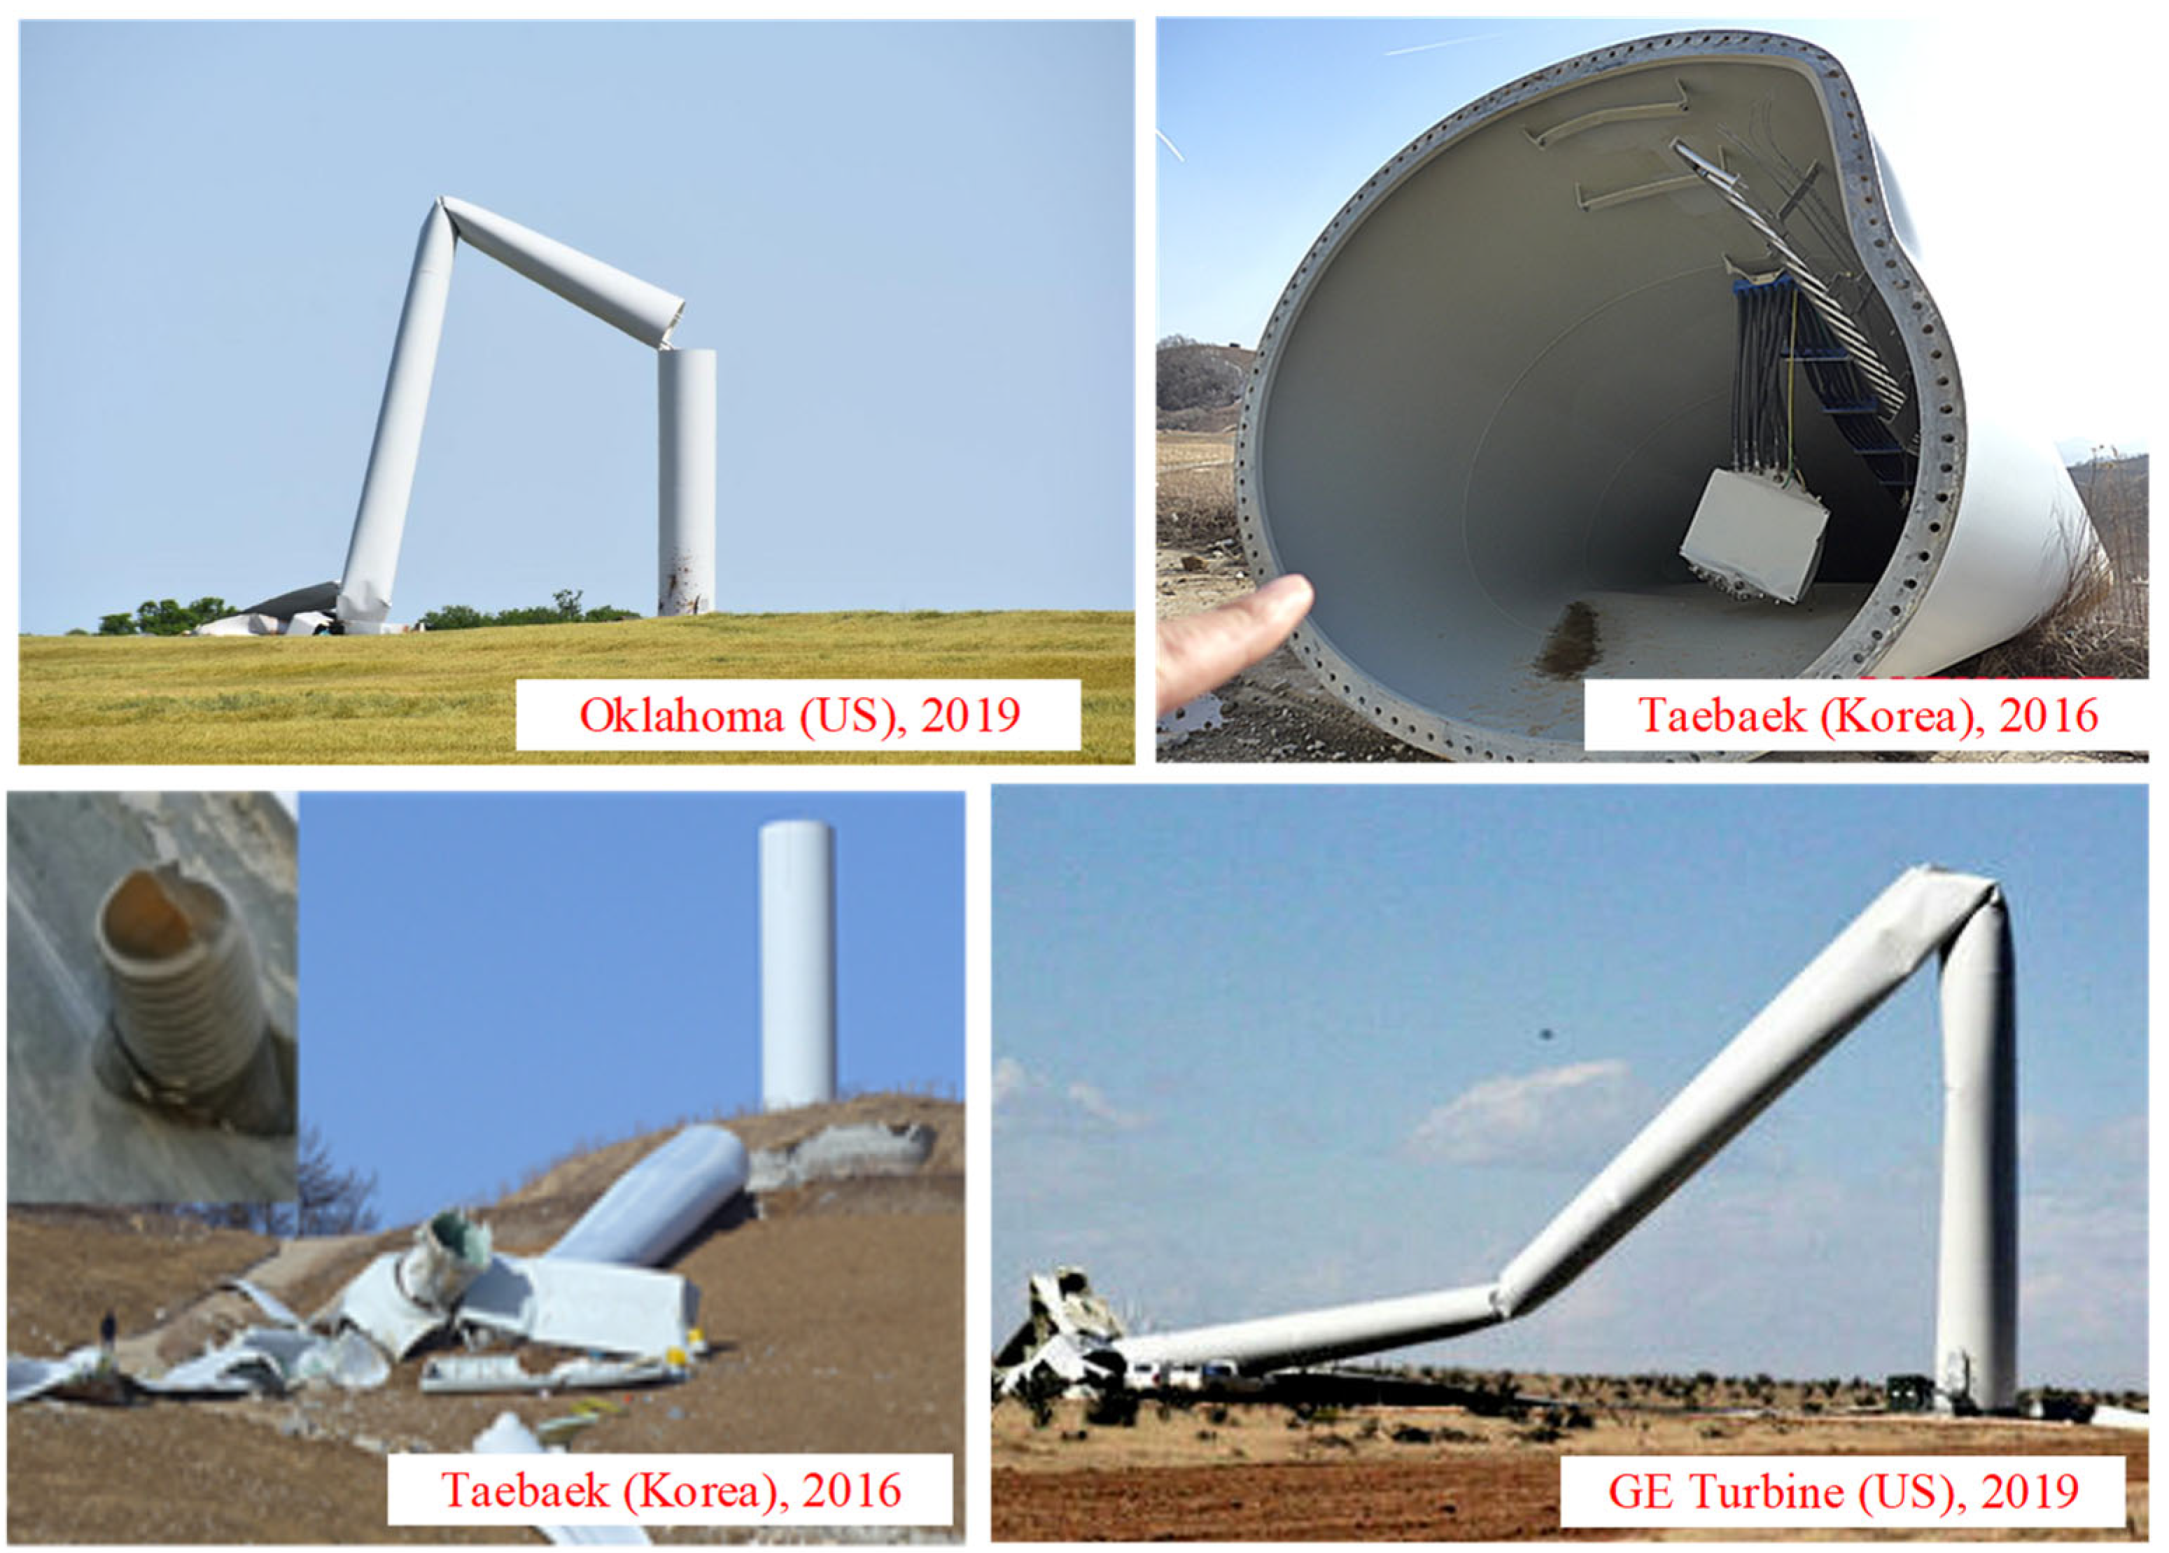
:1. Introduction
2. Numerical Simulation of the Existing Flange Joints
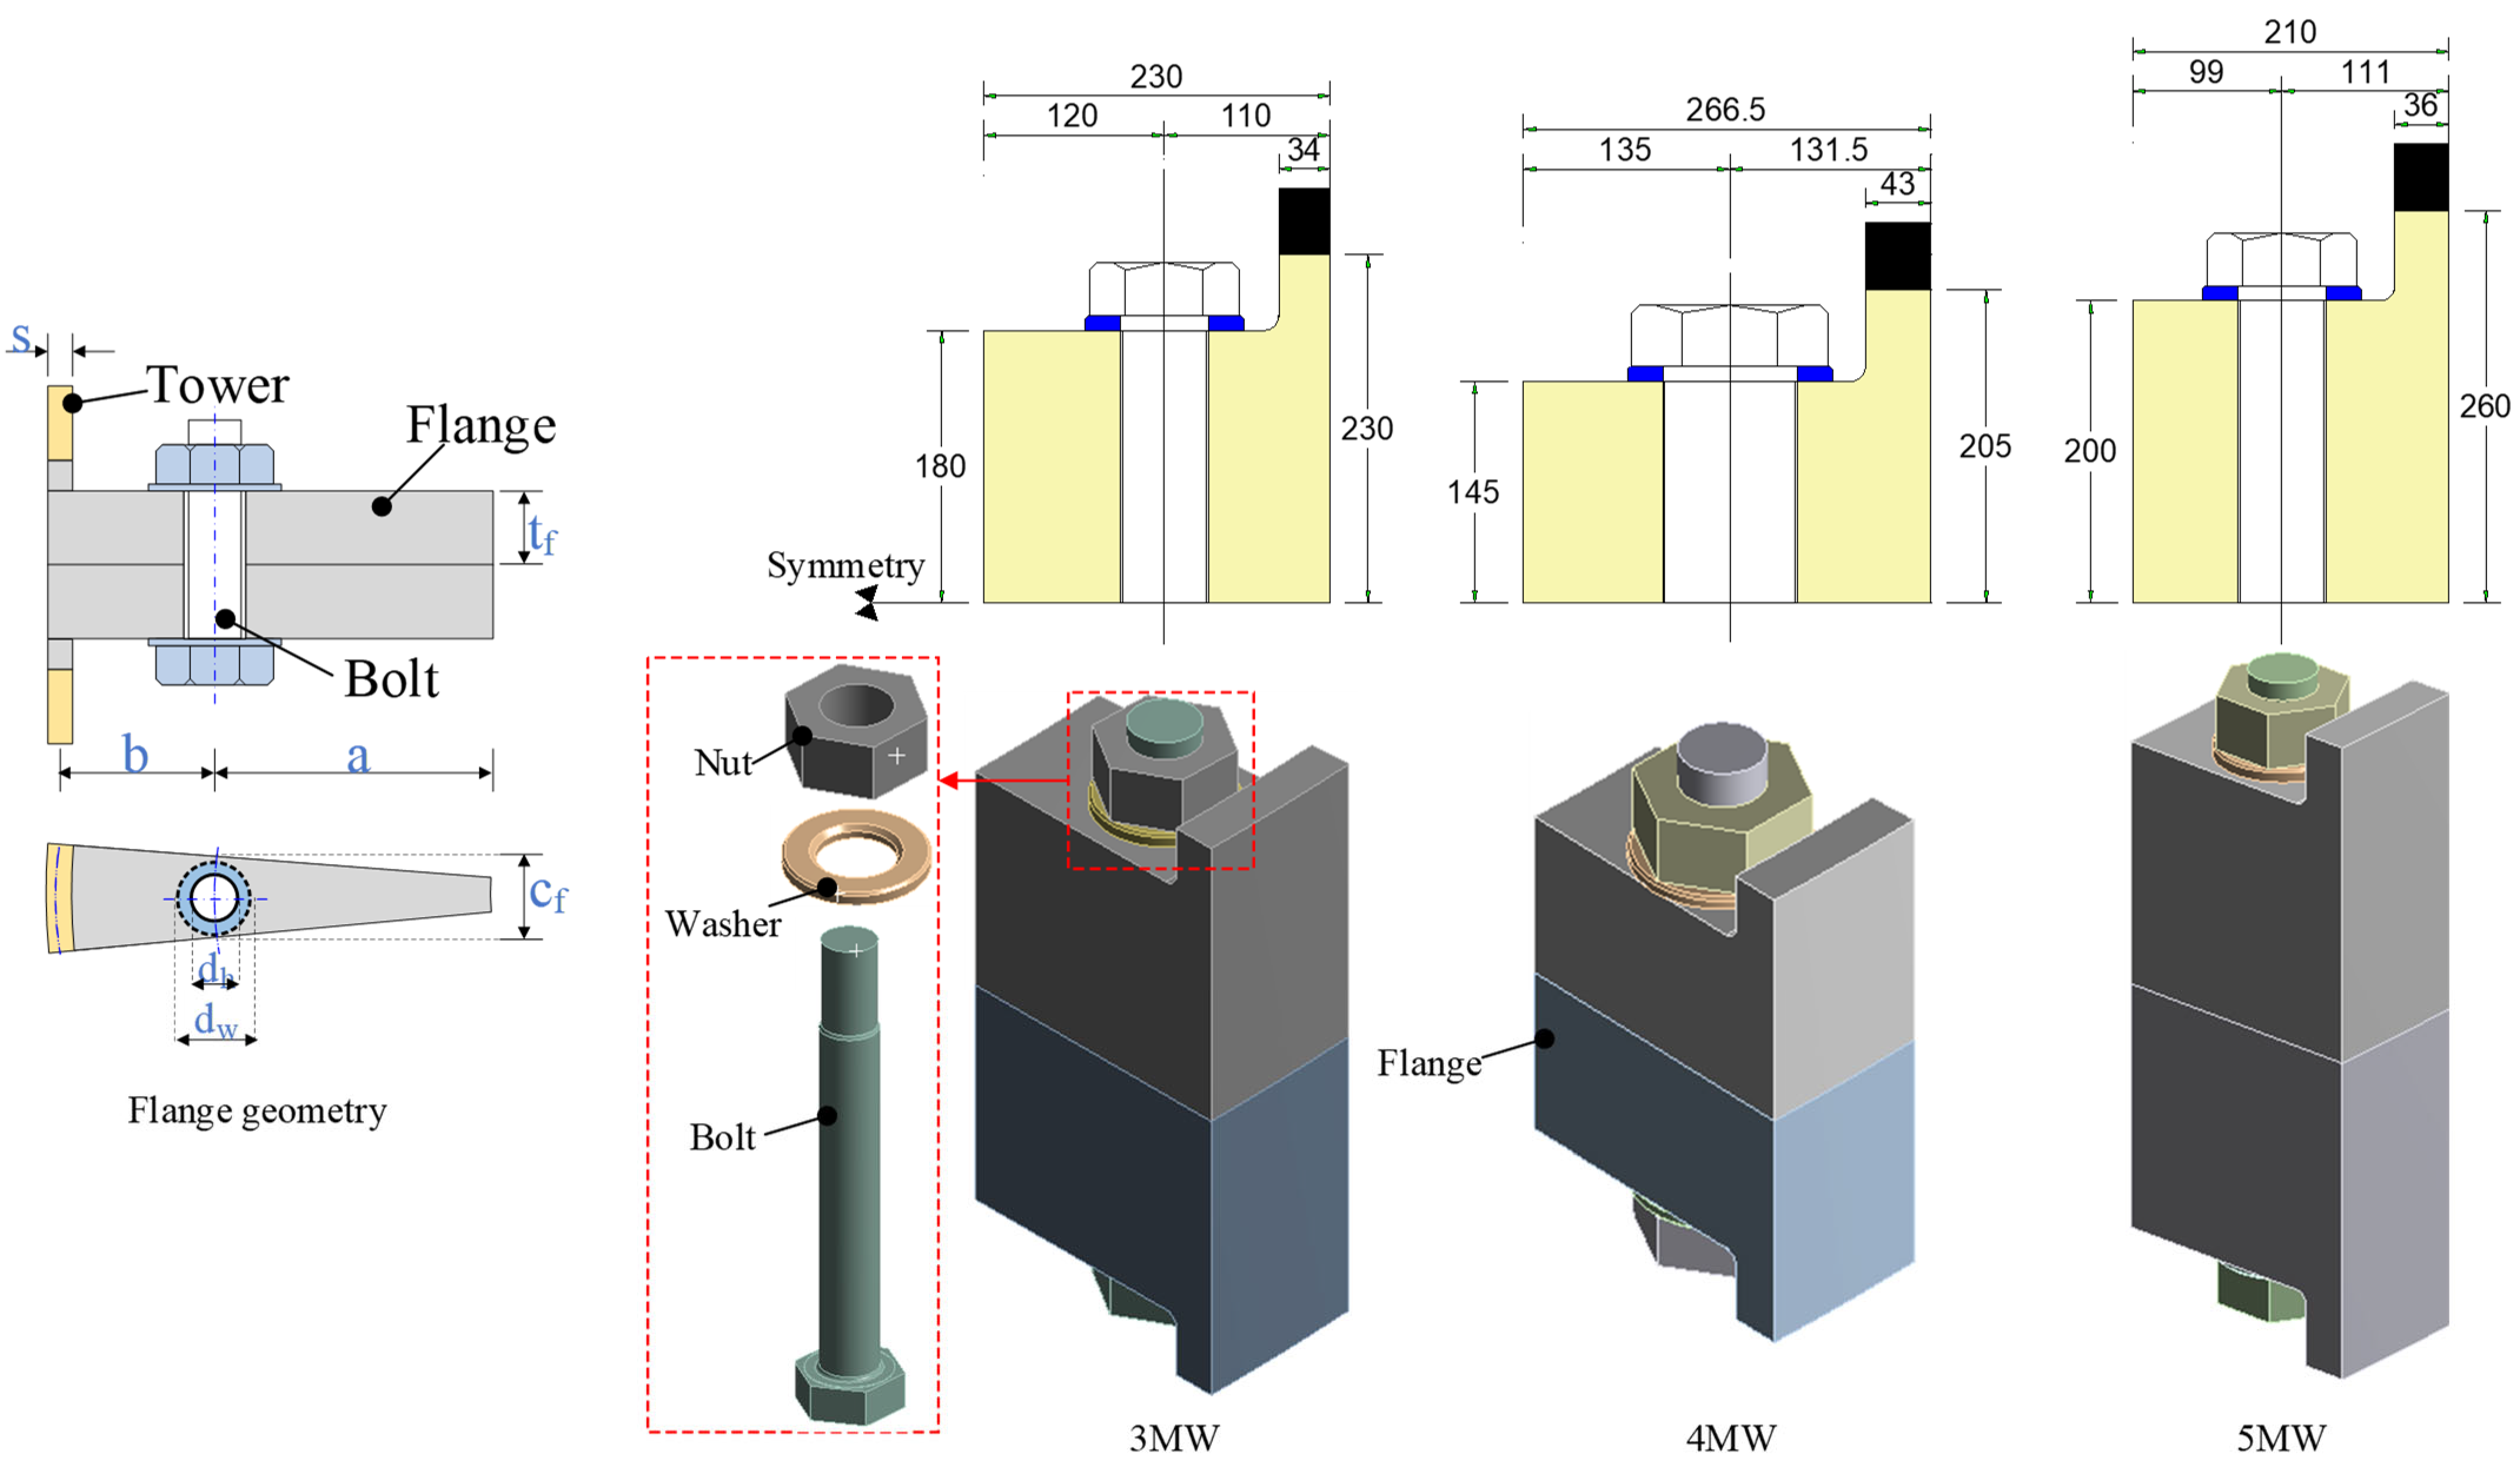
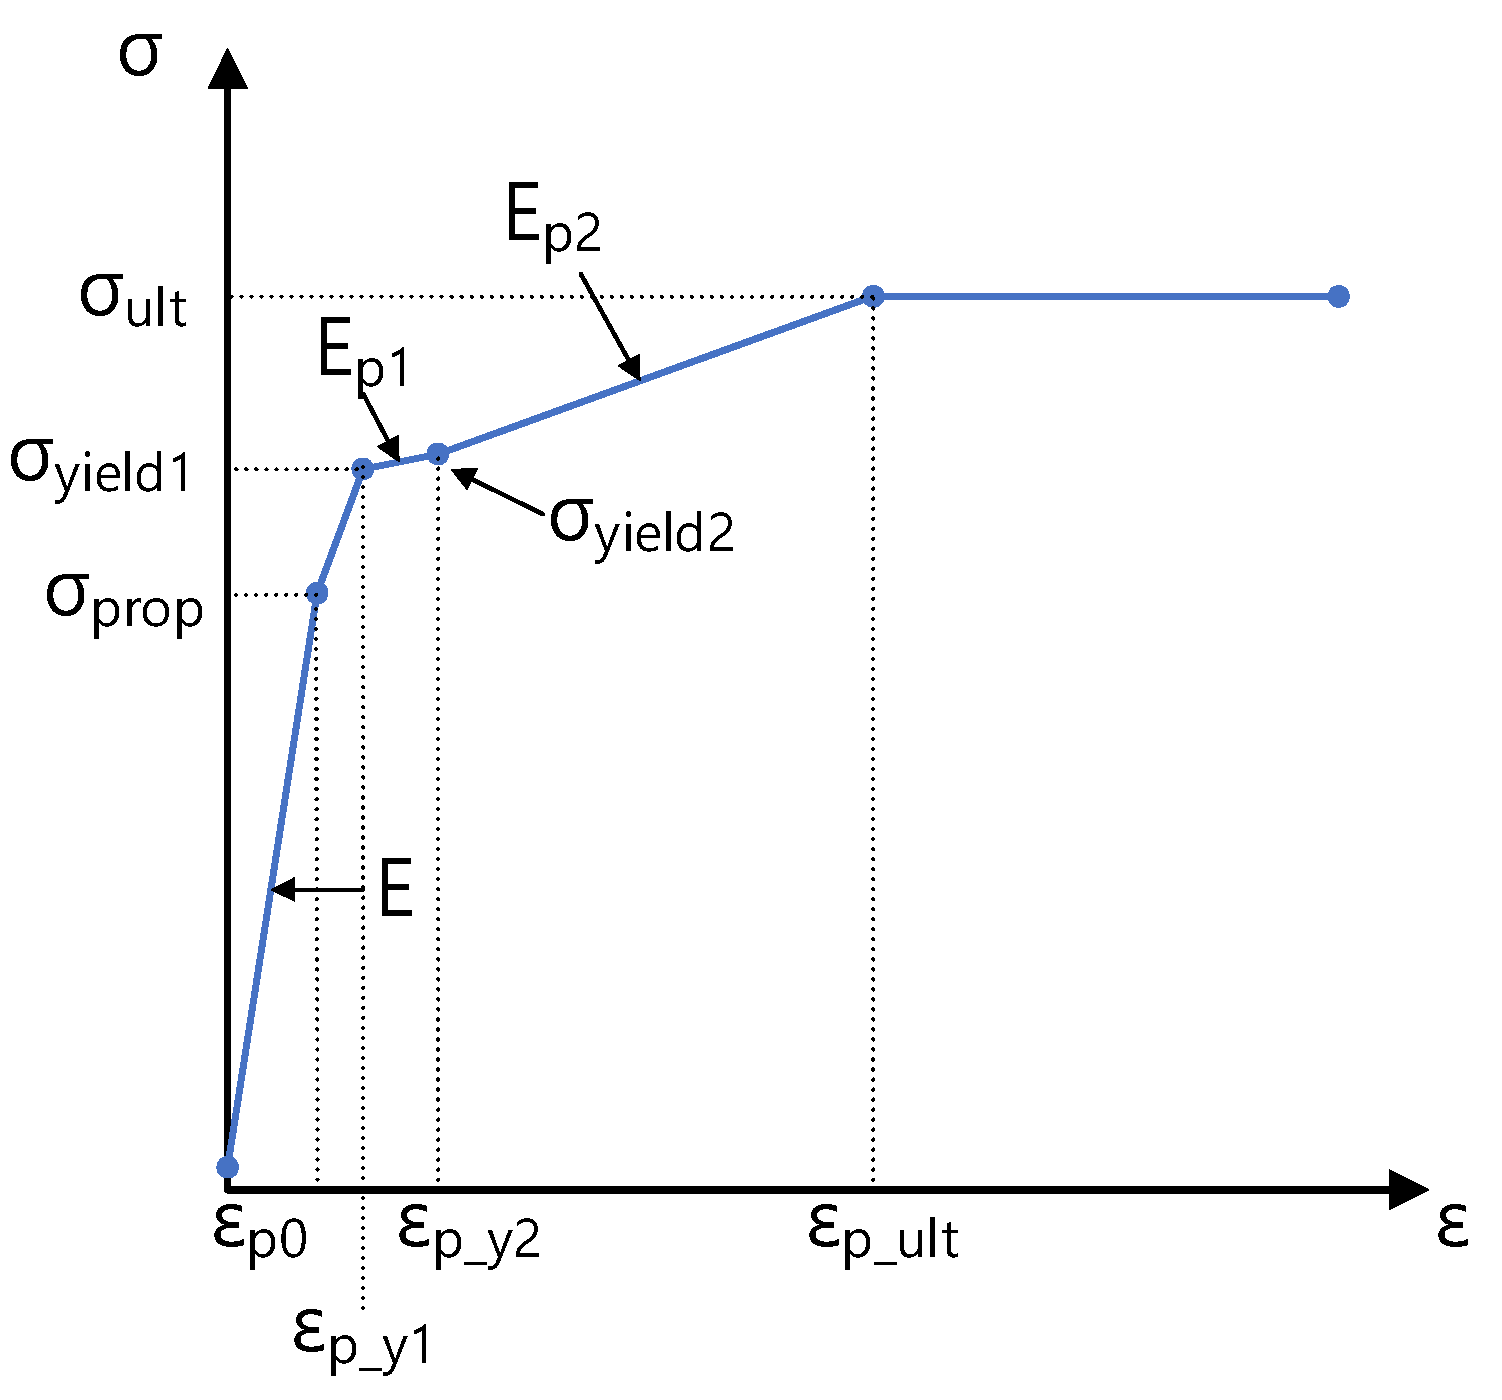
2.1. Finite Element Modeling
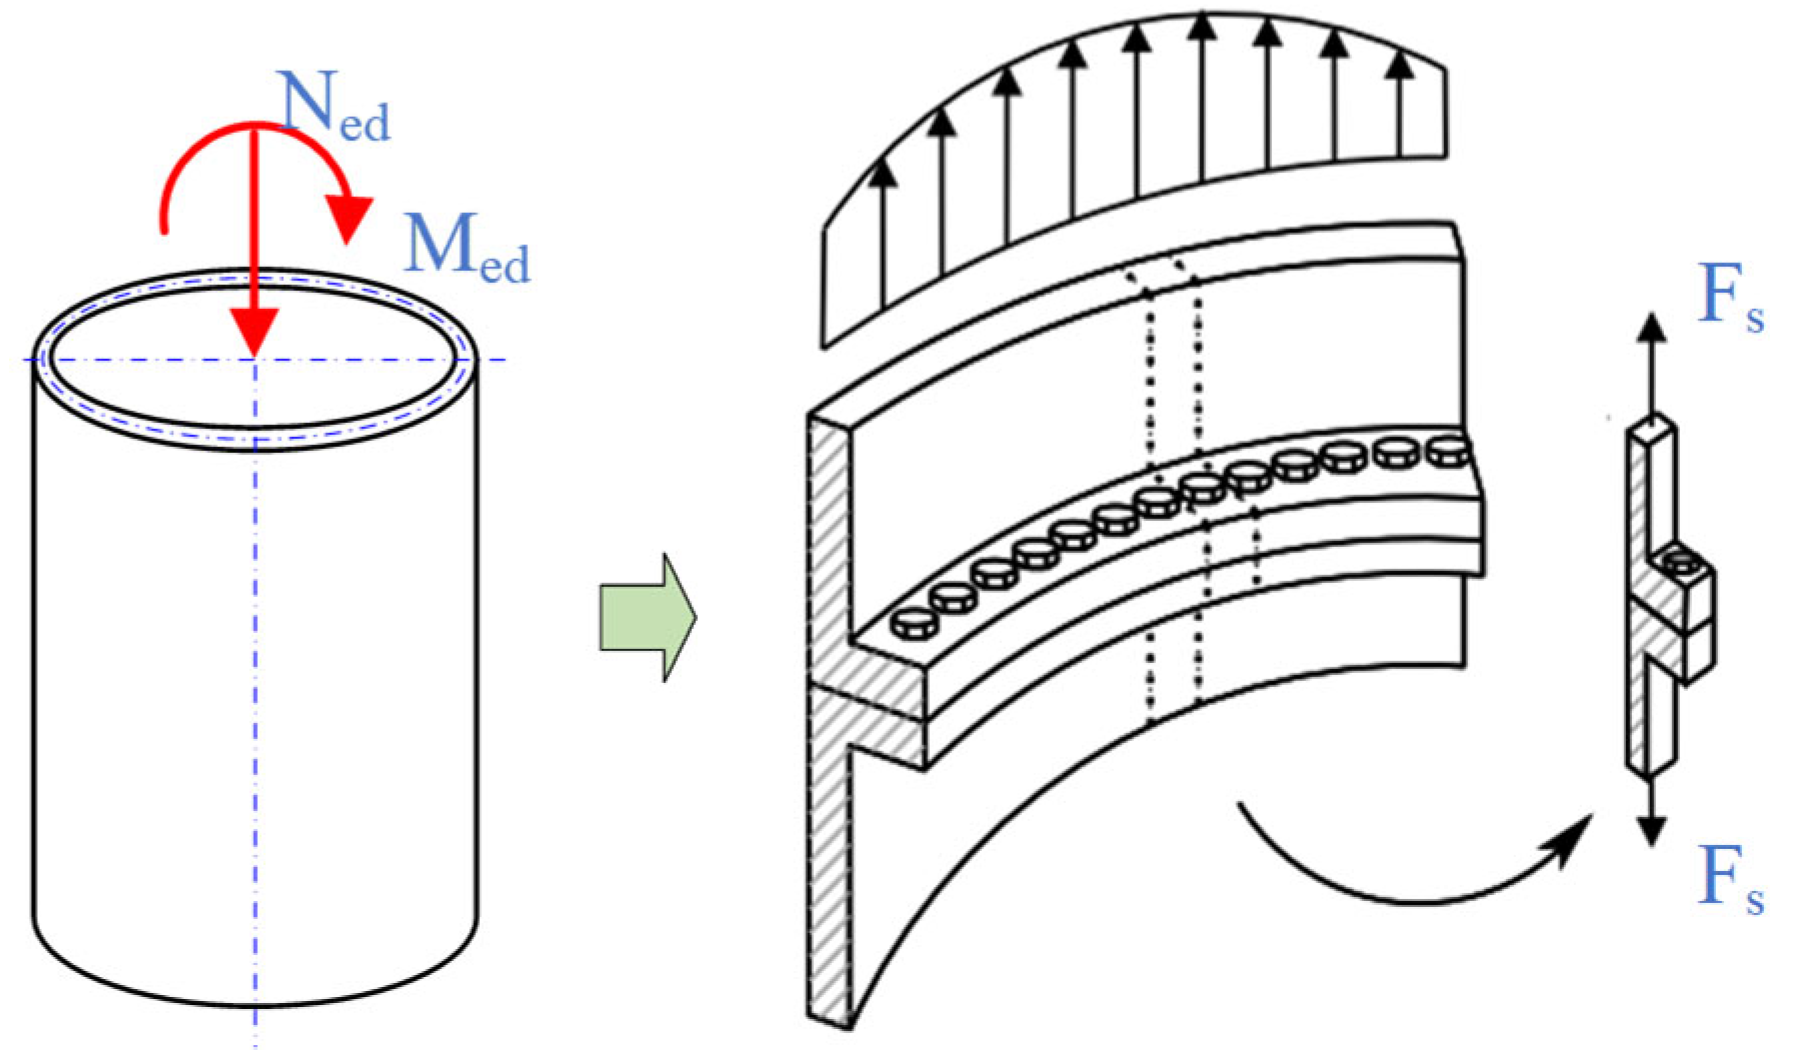
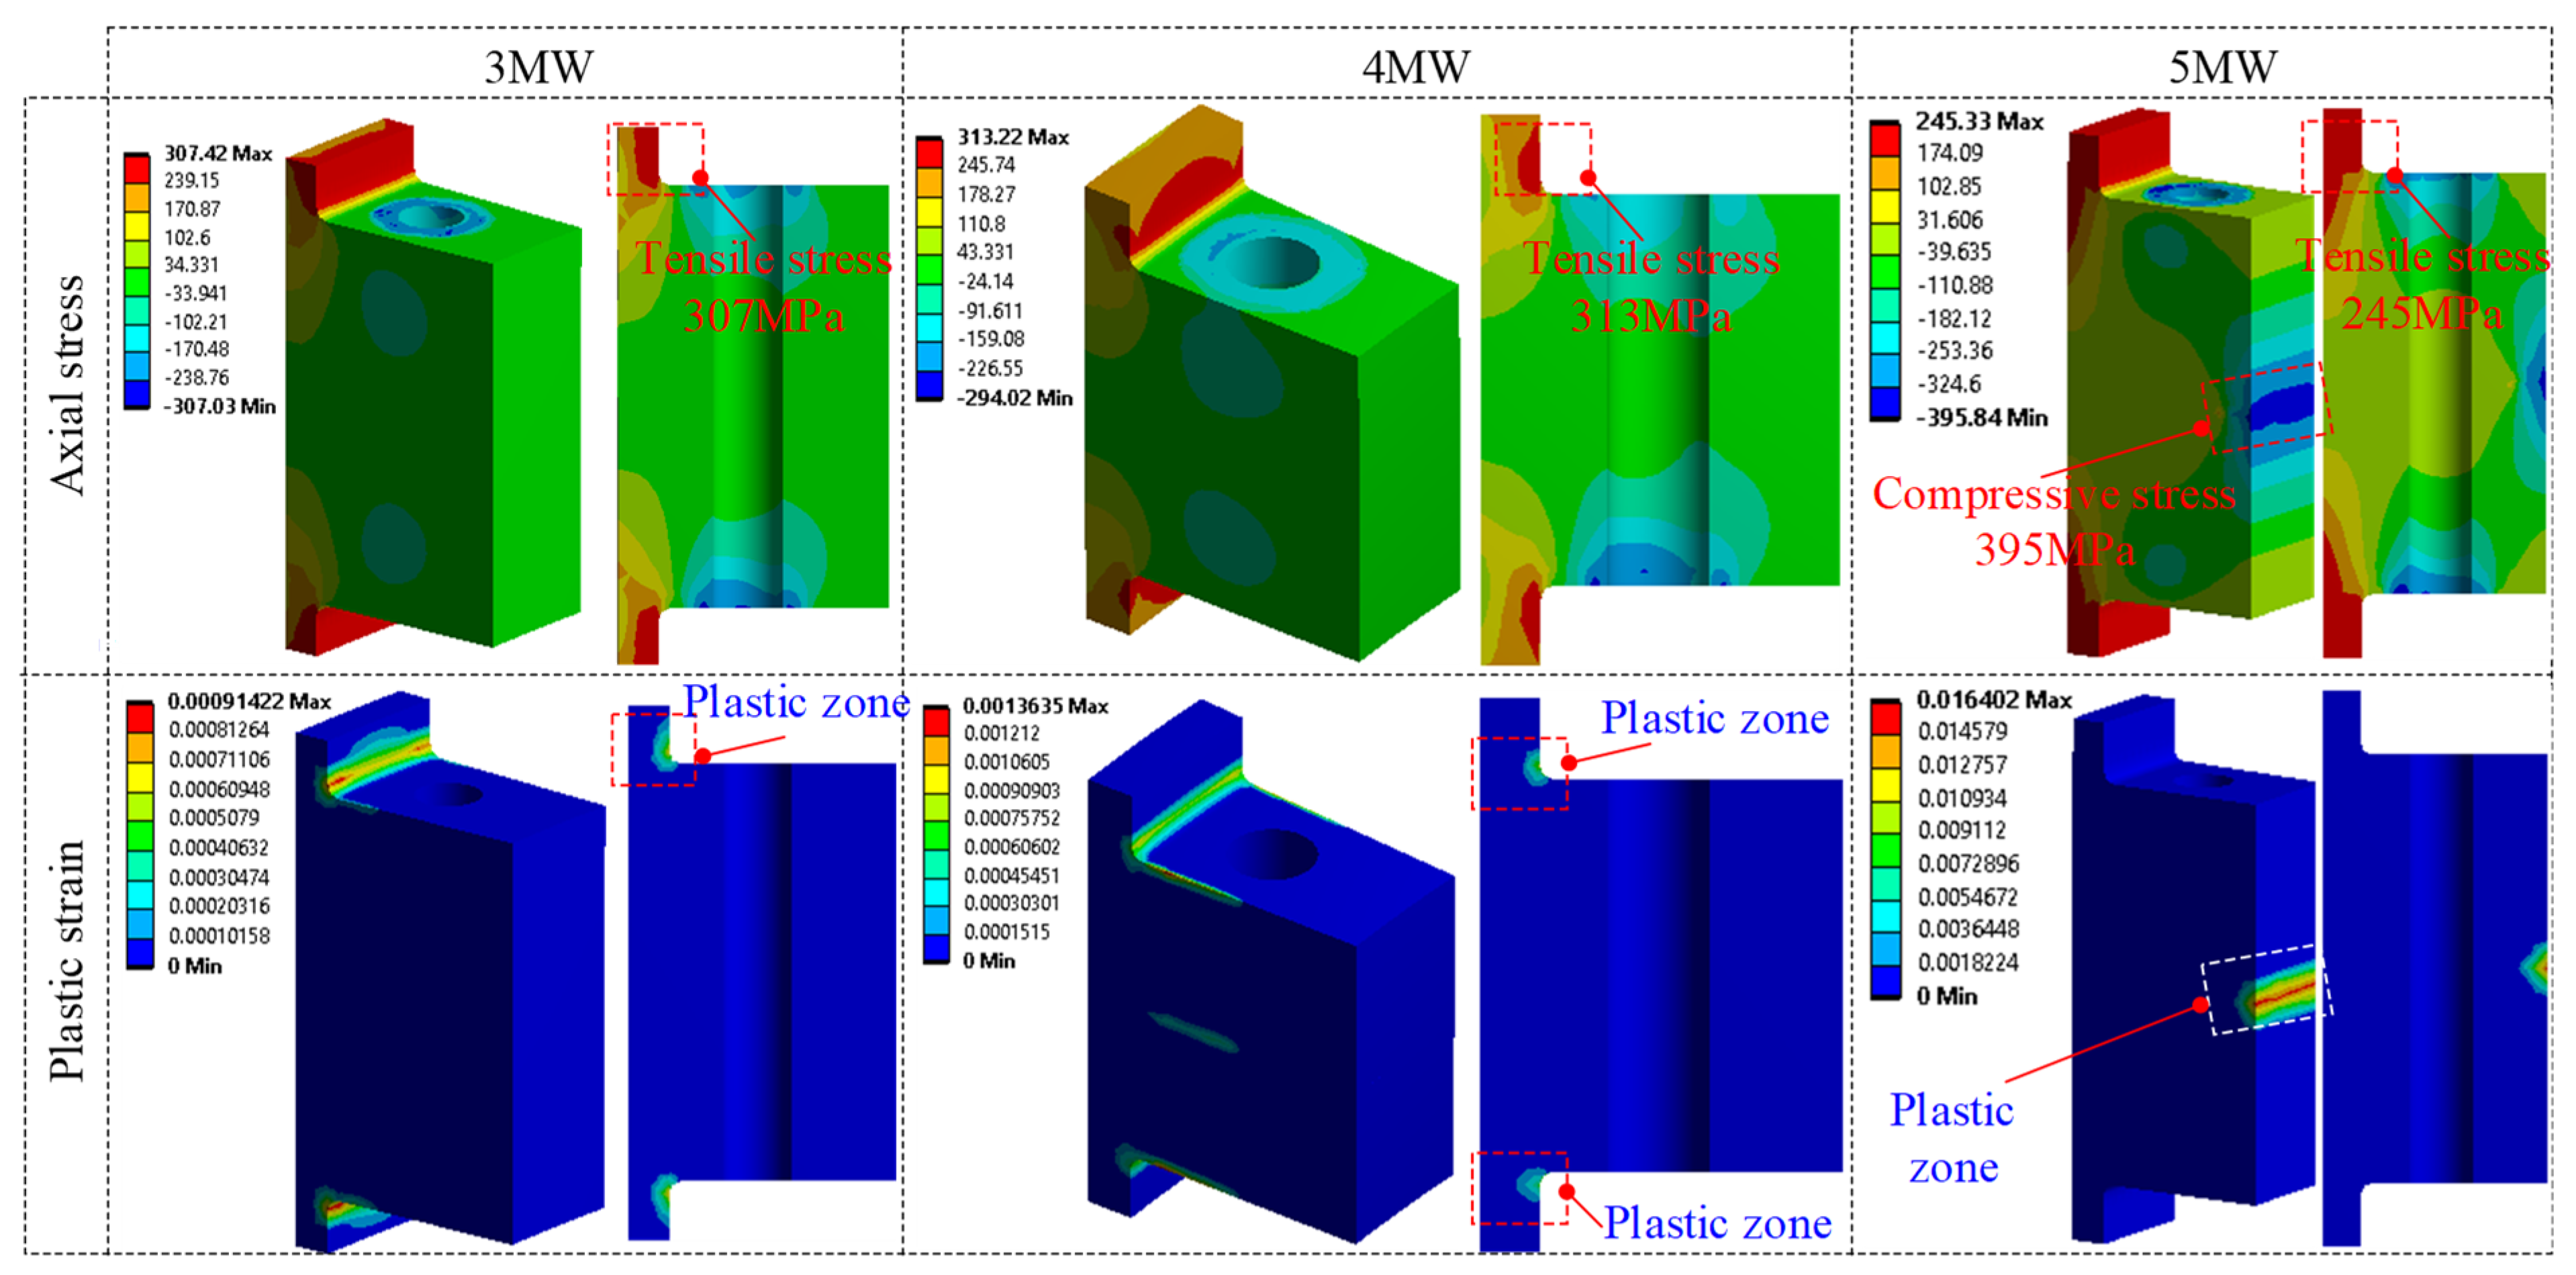
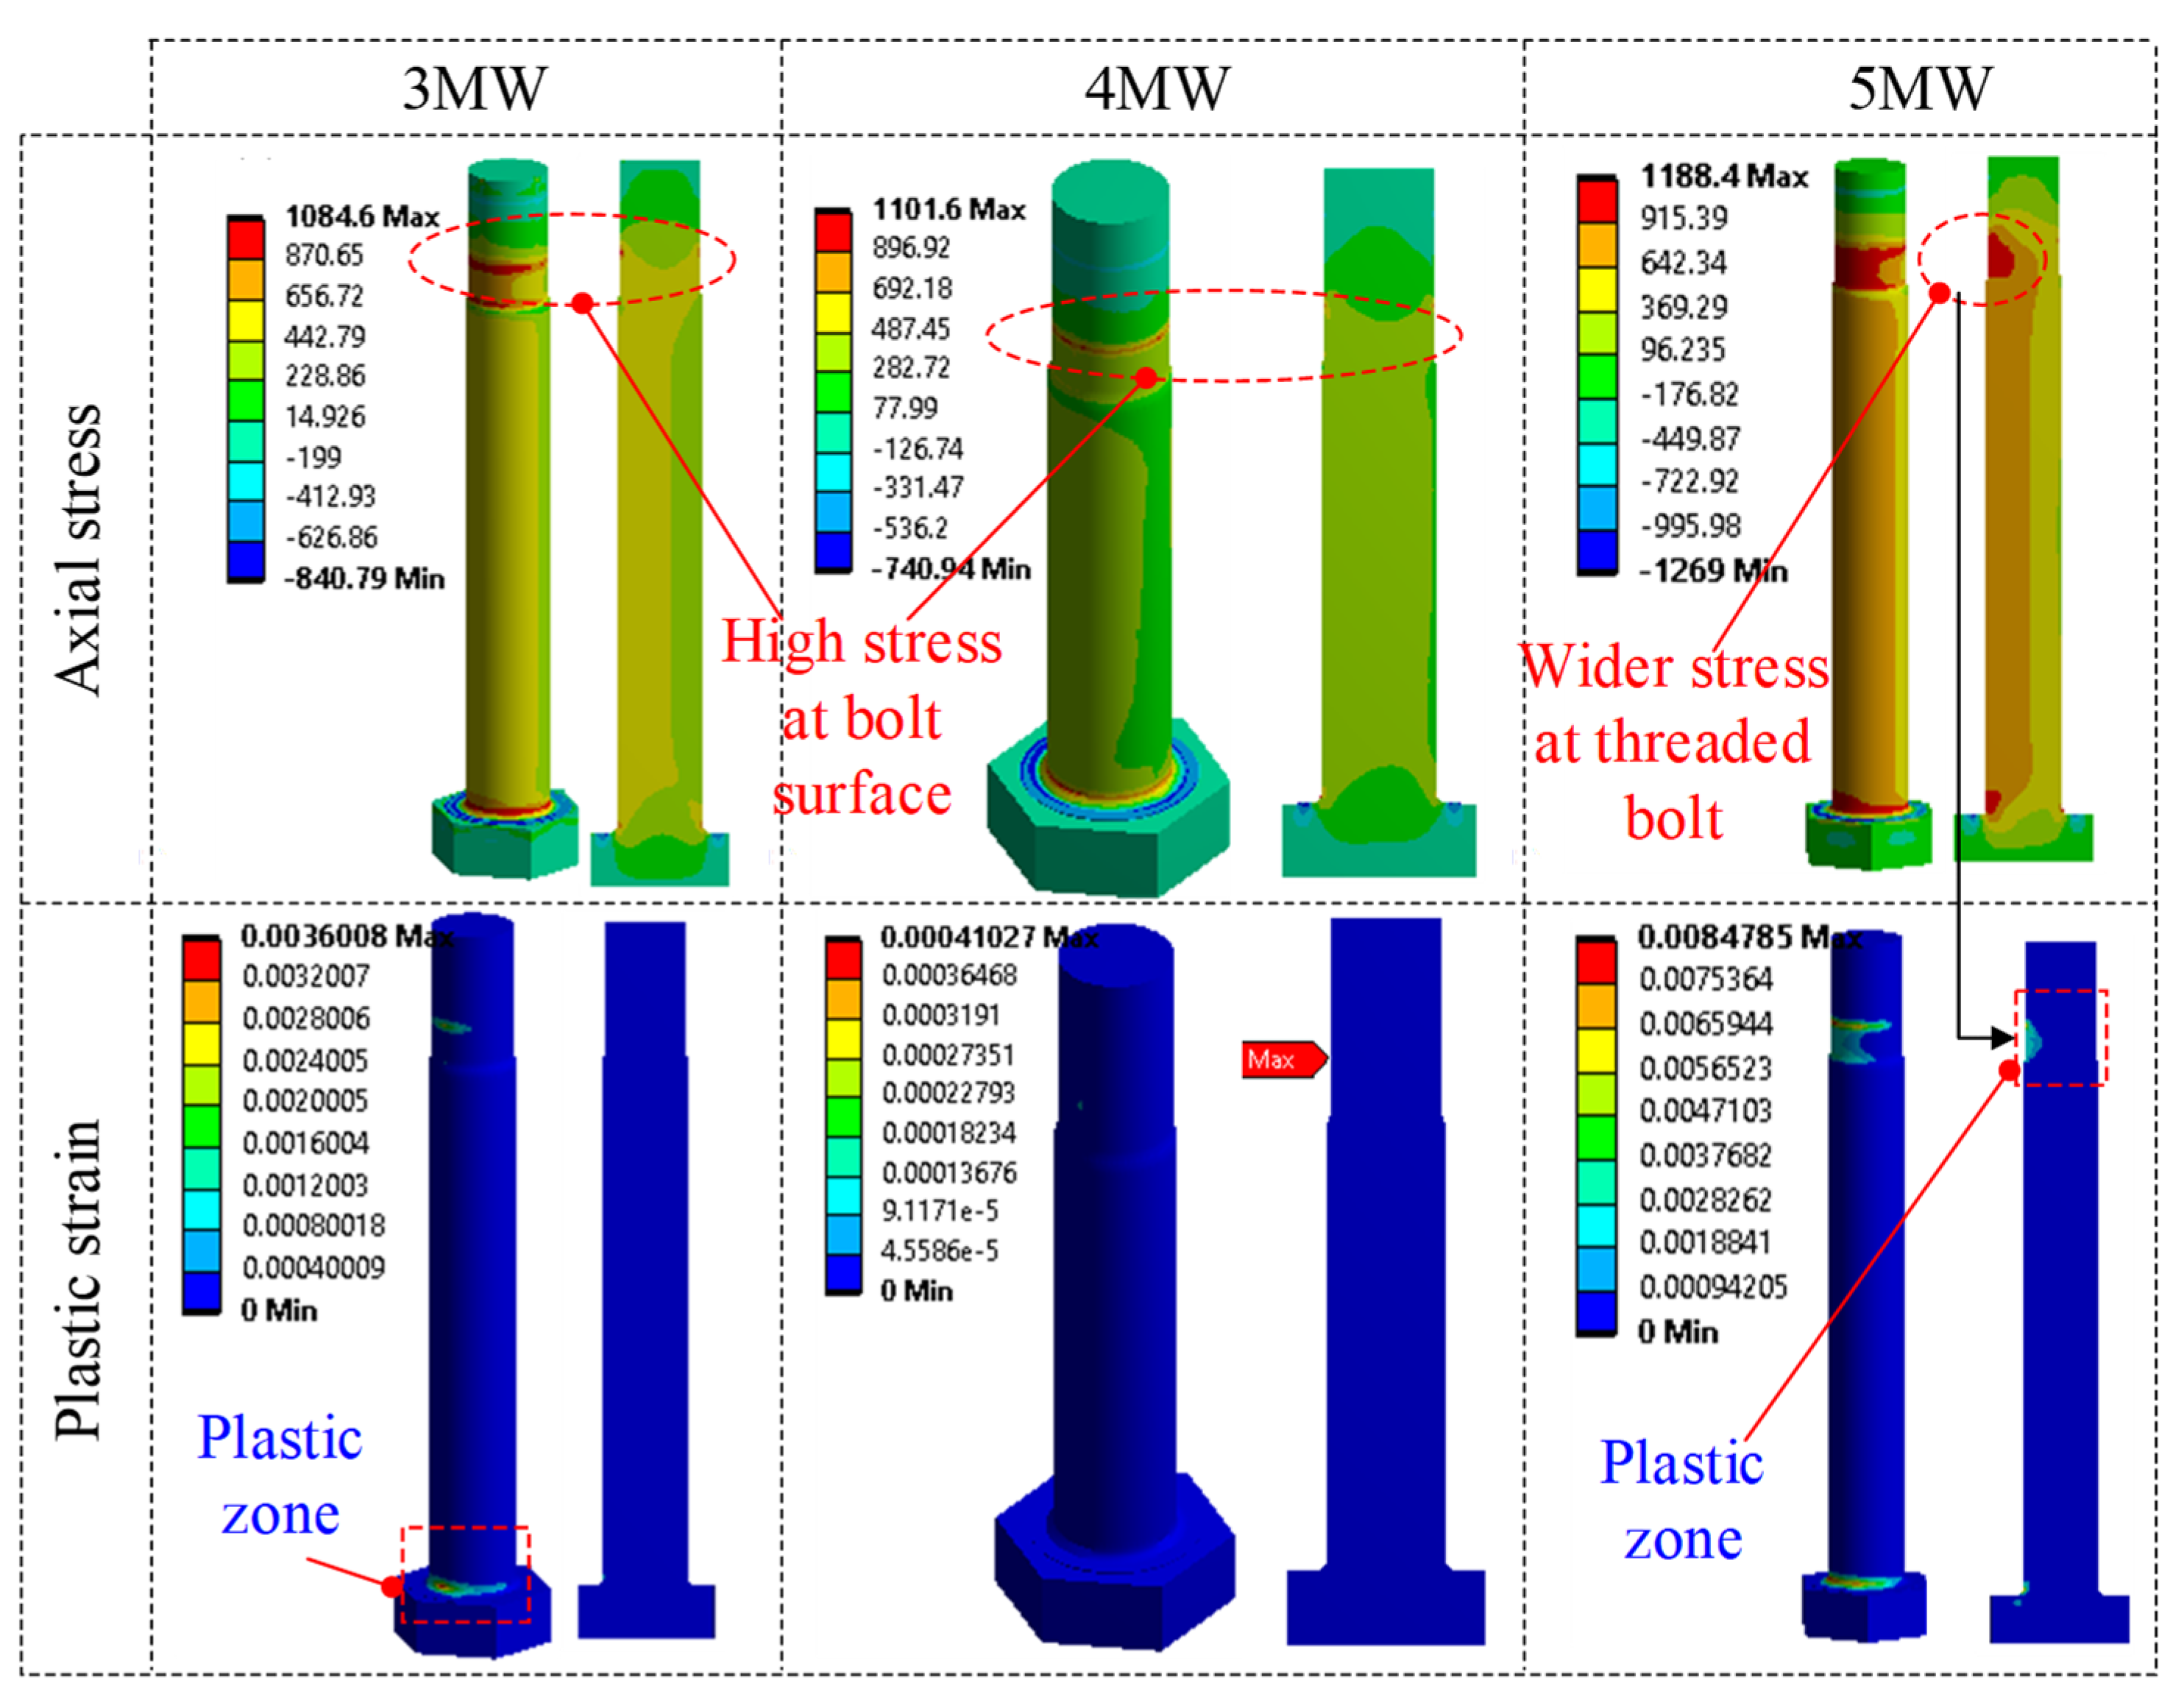
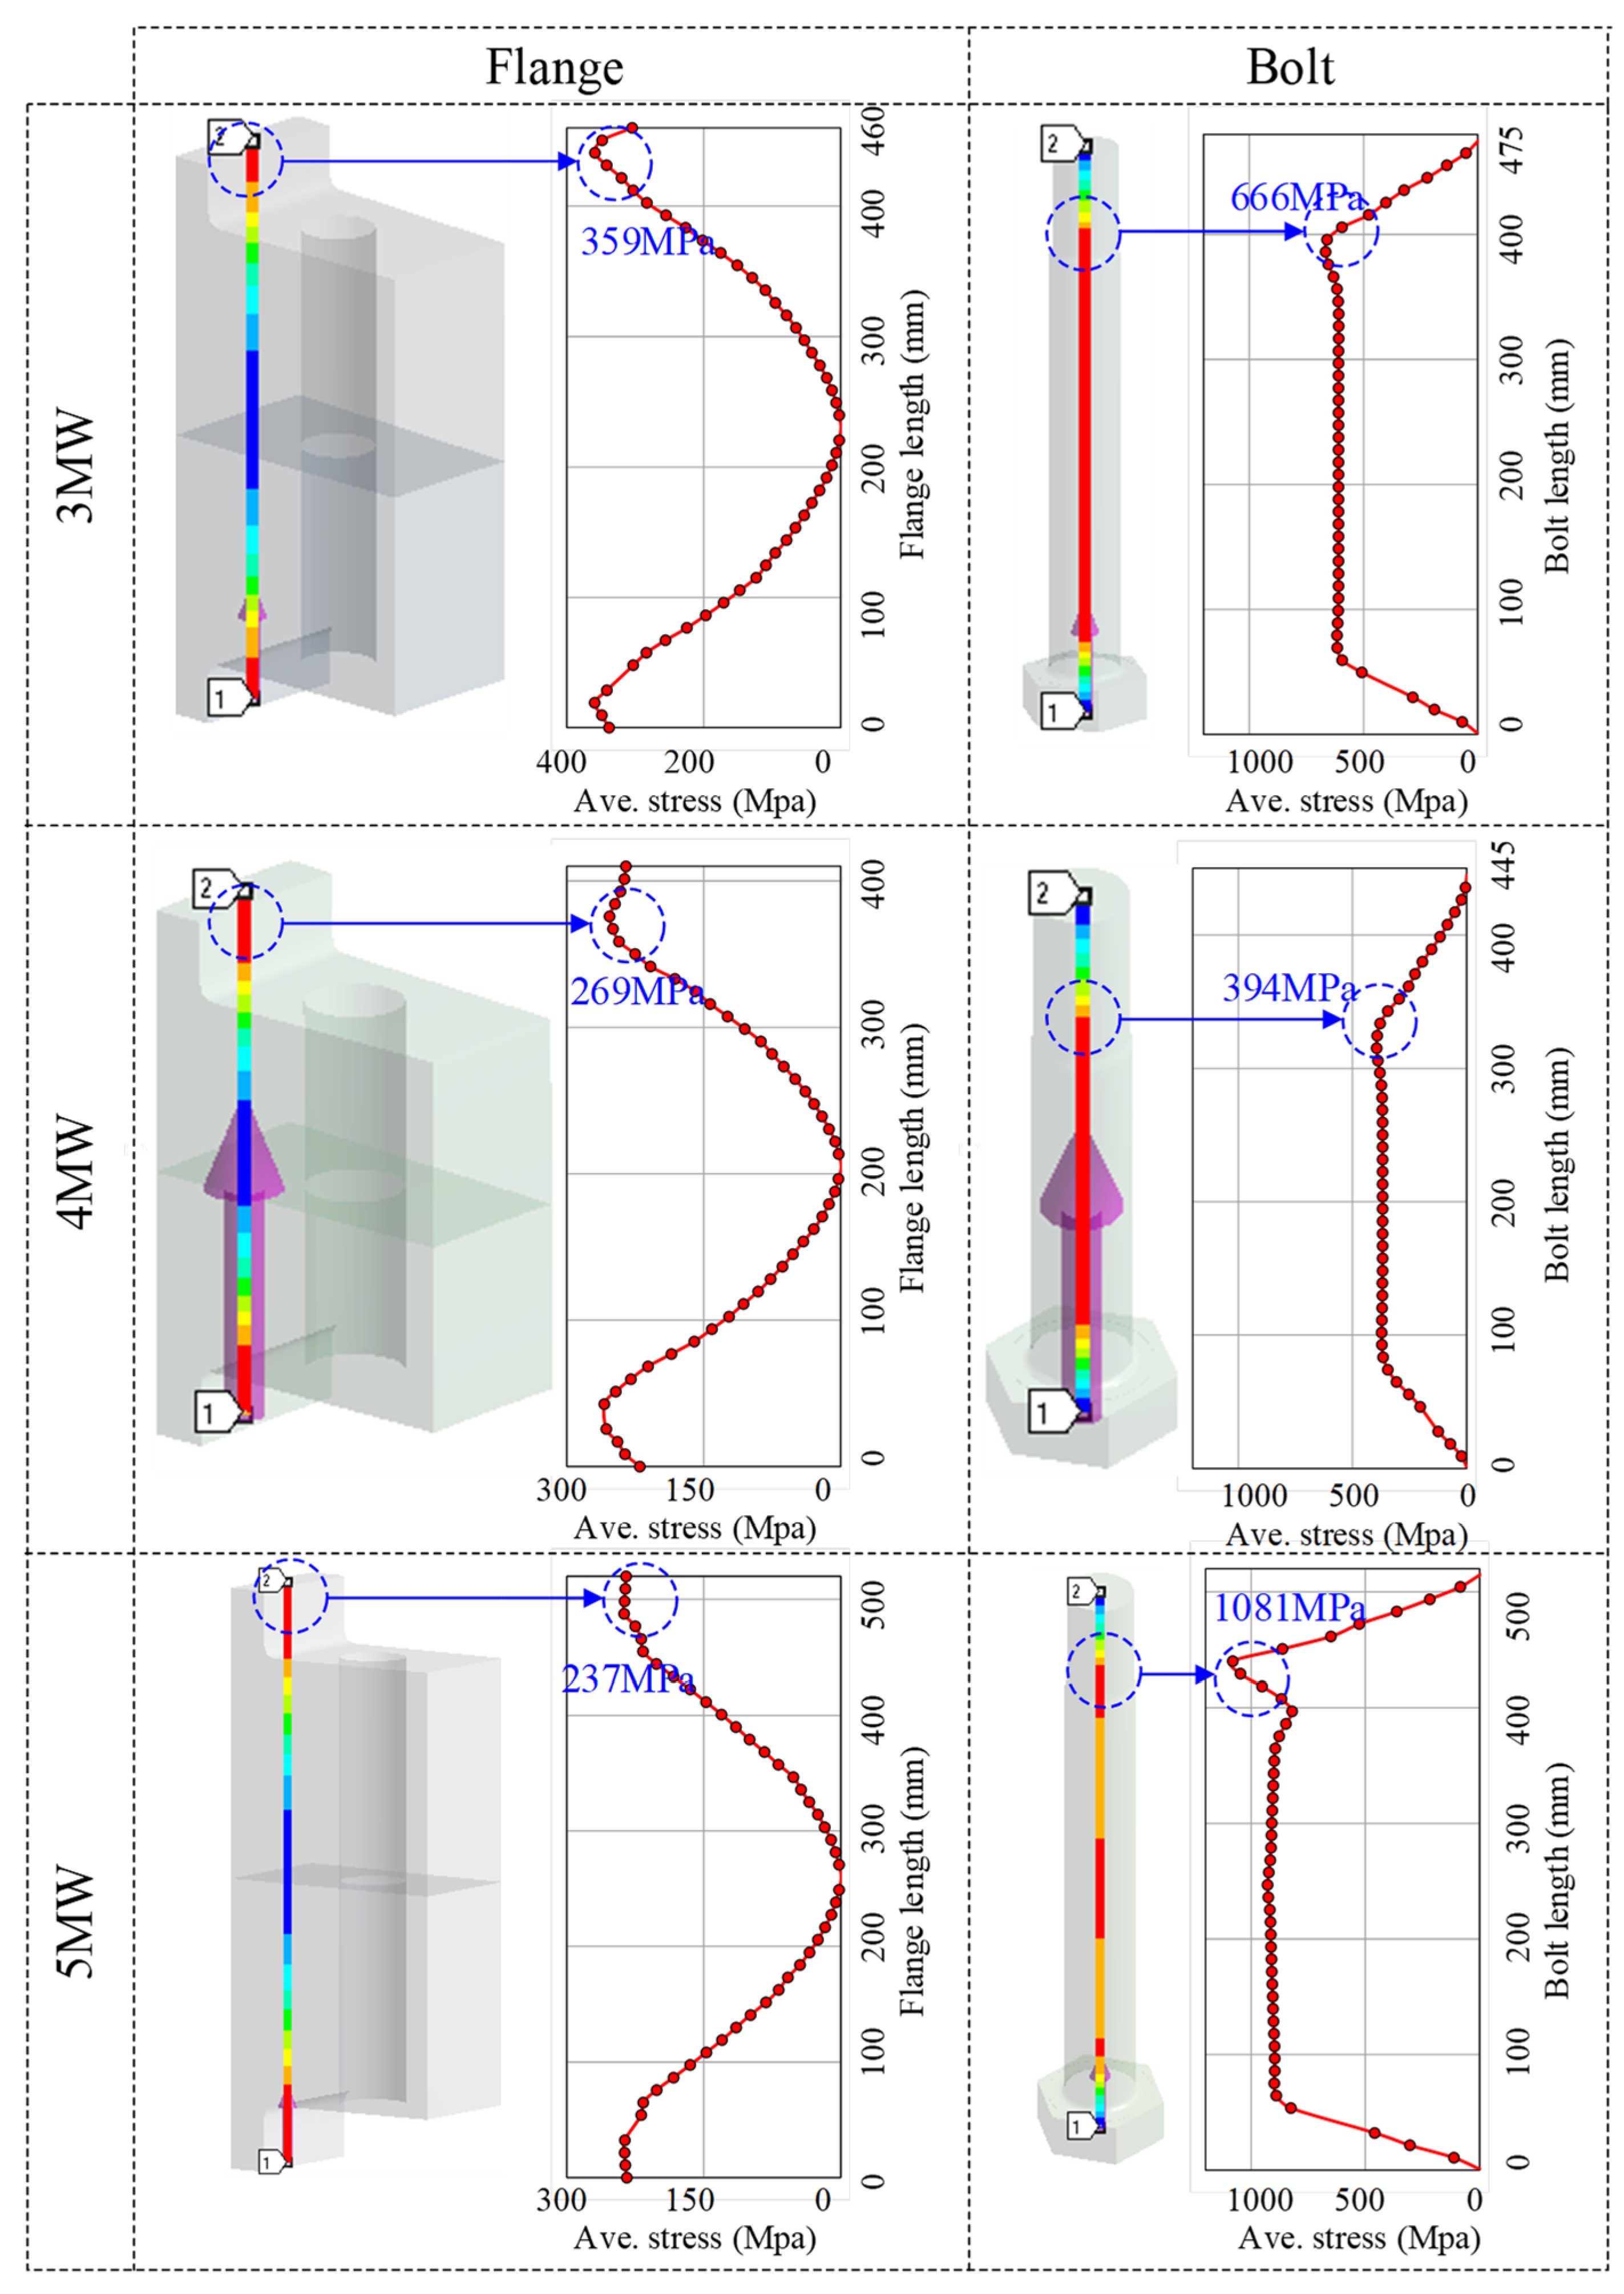
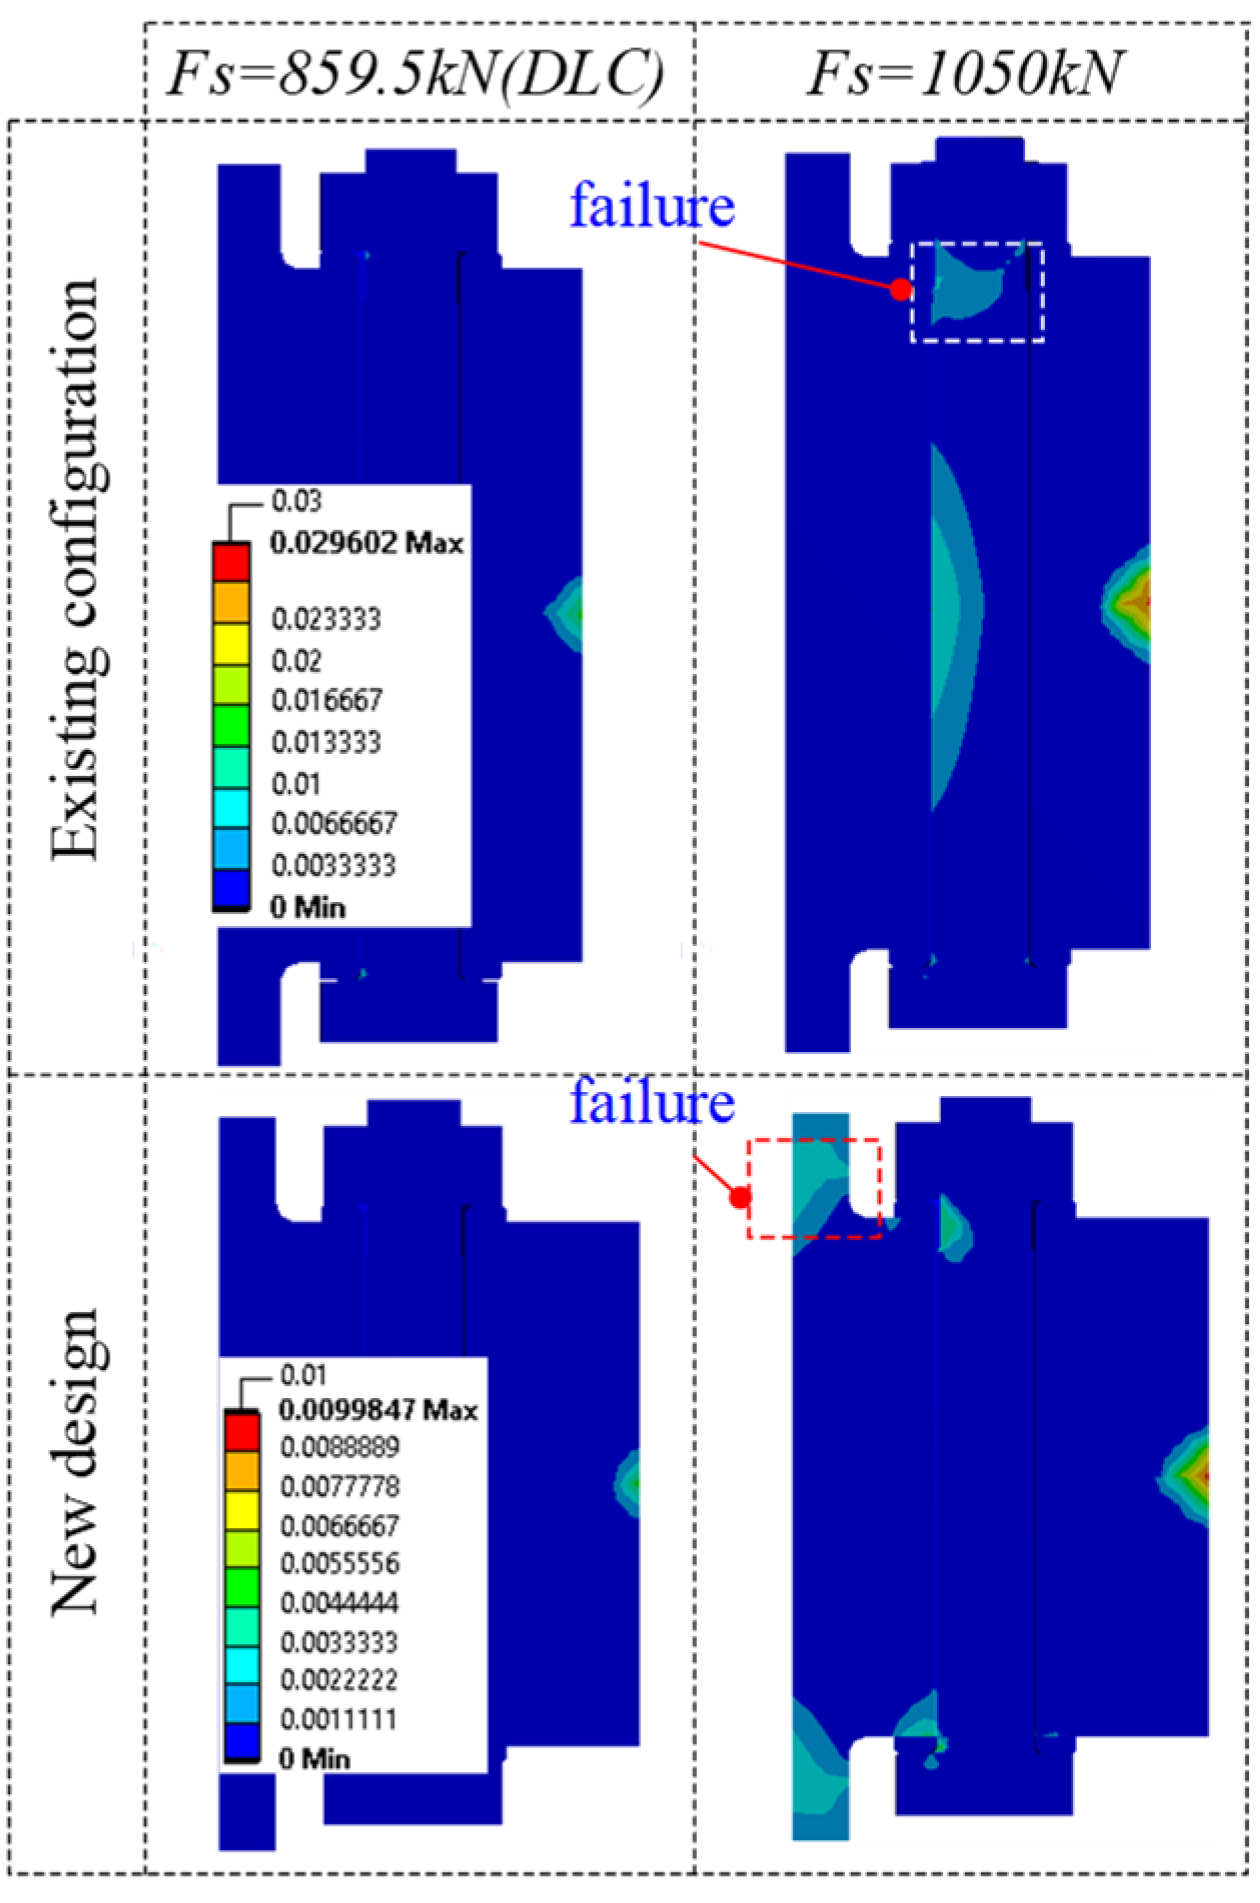
2.2. Discussion on the Failure Mode of Flange Joints
- 3 MW: failure at the flange-to-shell junction.
- 4 MW: failure at the flange-to-shell junction.
- 5 MW: failure at the threaded bolt.
2.3. Limitations of the Current Design Practice
3. Redesign of the 5 MW Flange Joint
3.1. Parametric Studies
- Group 0 is the original model.
- Group 1 includes models with flange thicknesses ranging from 150 to 170 mm.
- Group 2 includes models with shell thicknesses ranging from 32 to 34 mm.
- Group 3 includes models with aspect ratios ranging from 1.17 to 1.39 mm.
- Group 4 includes models with flange widths ranging from 99.42 to 139.42 mm.
3.2. Analysis Results
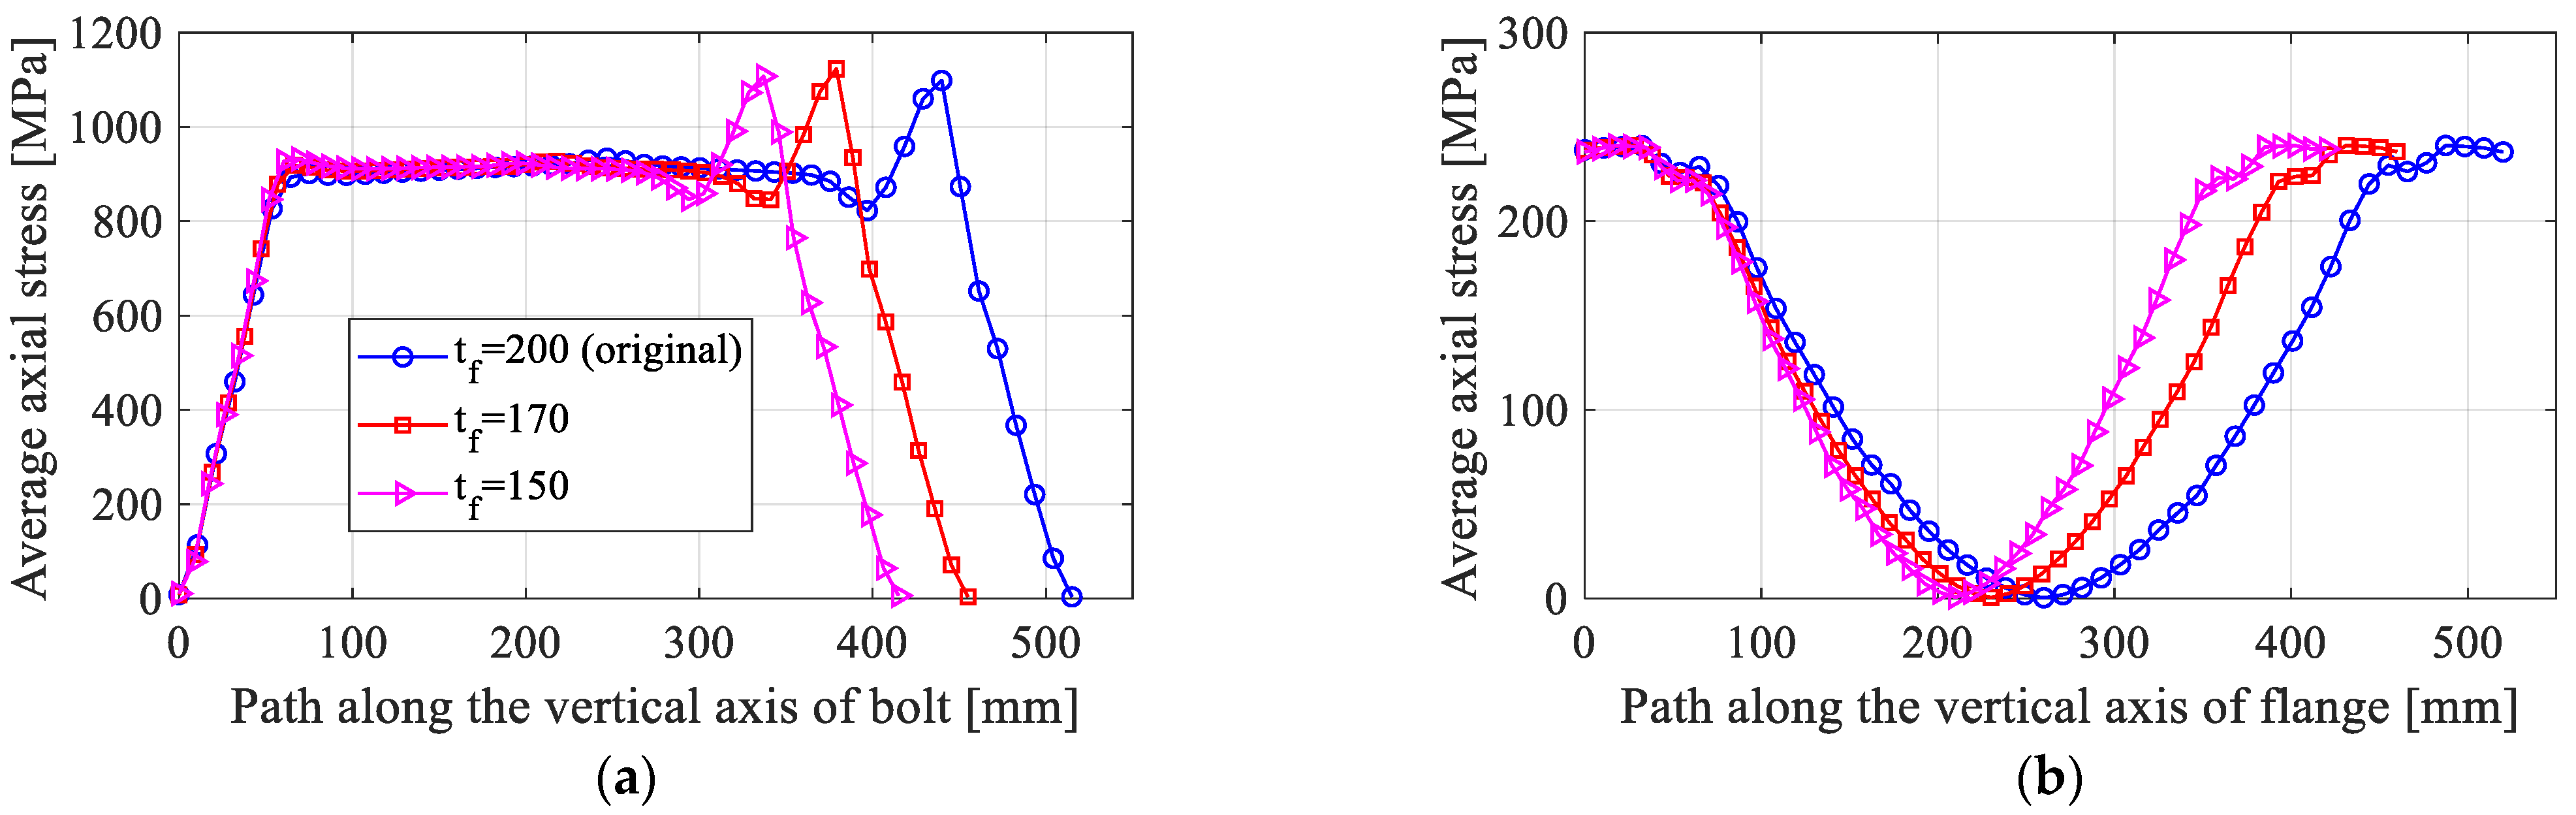
3.2.1. Effect of the Flange Thickness,
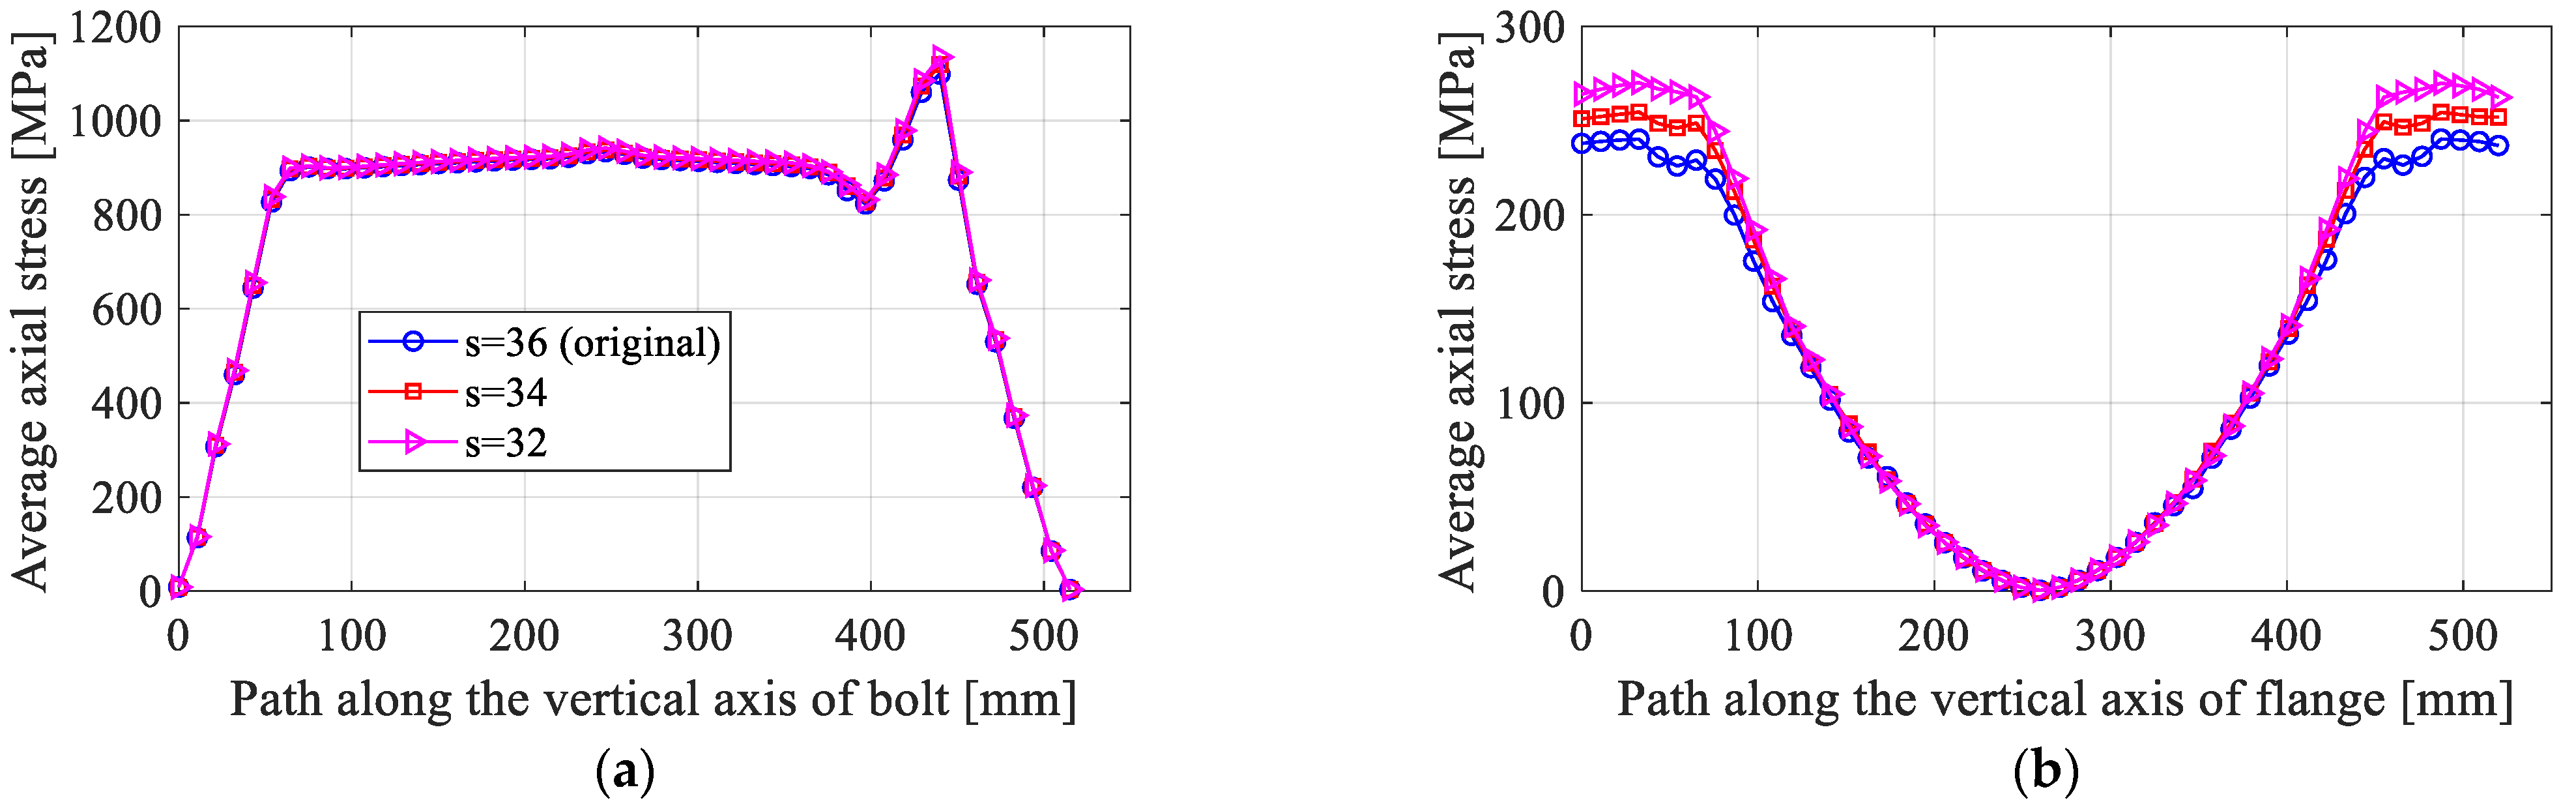
3.2.2. Effect of the Tower Thickness,
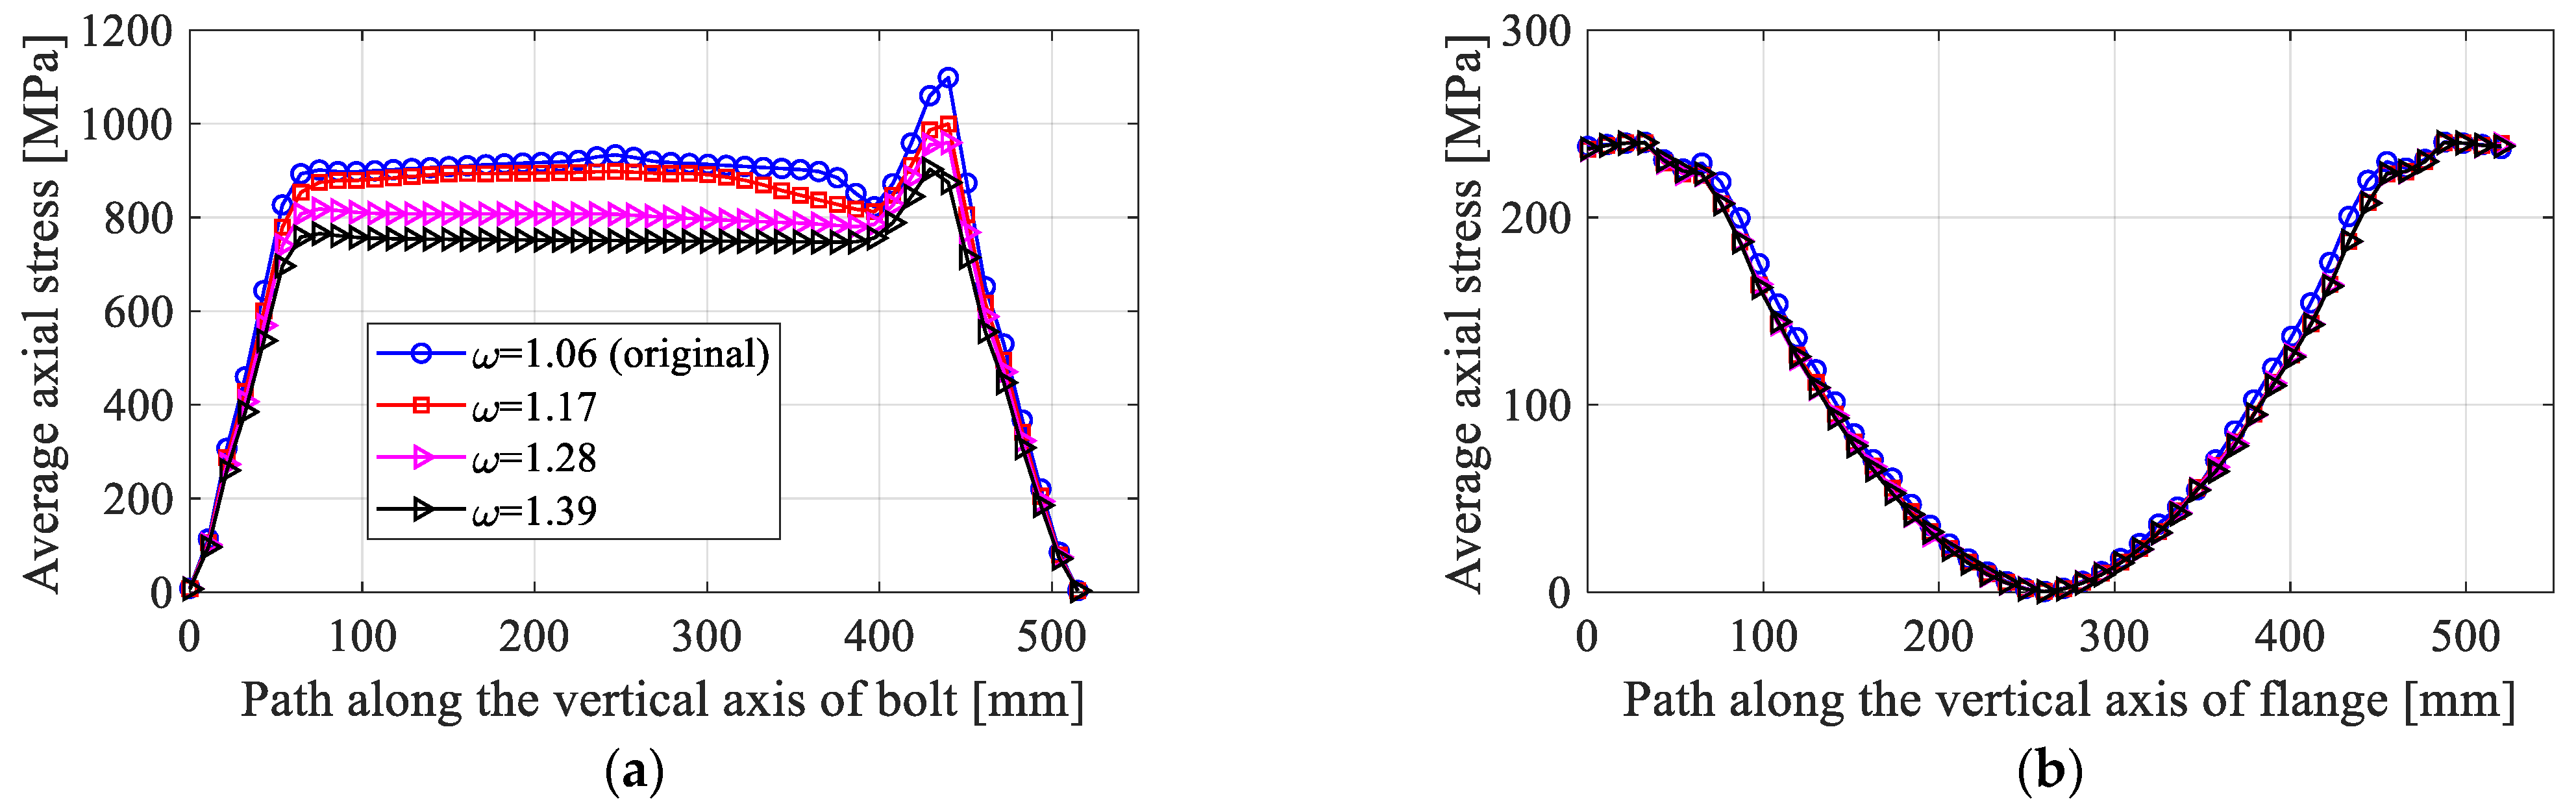
3.2.3. Effect of the Aspect Ratio,
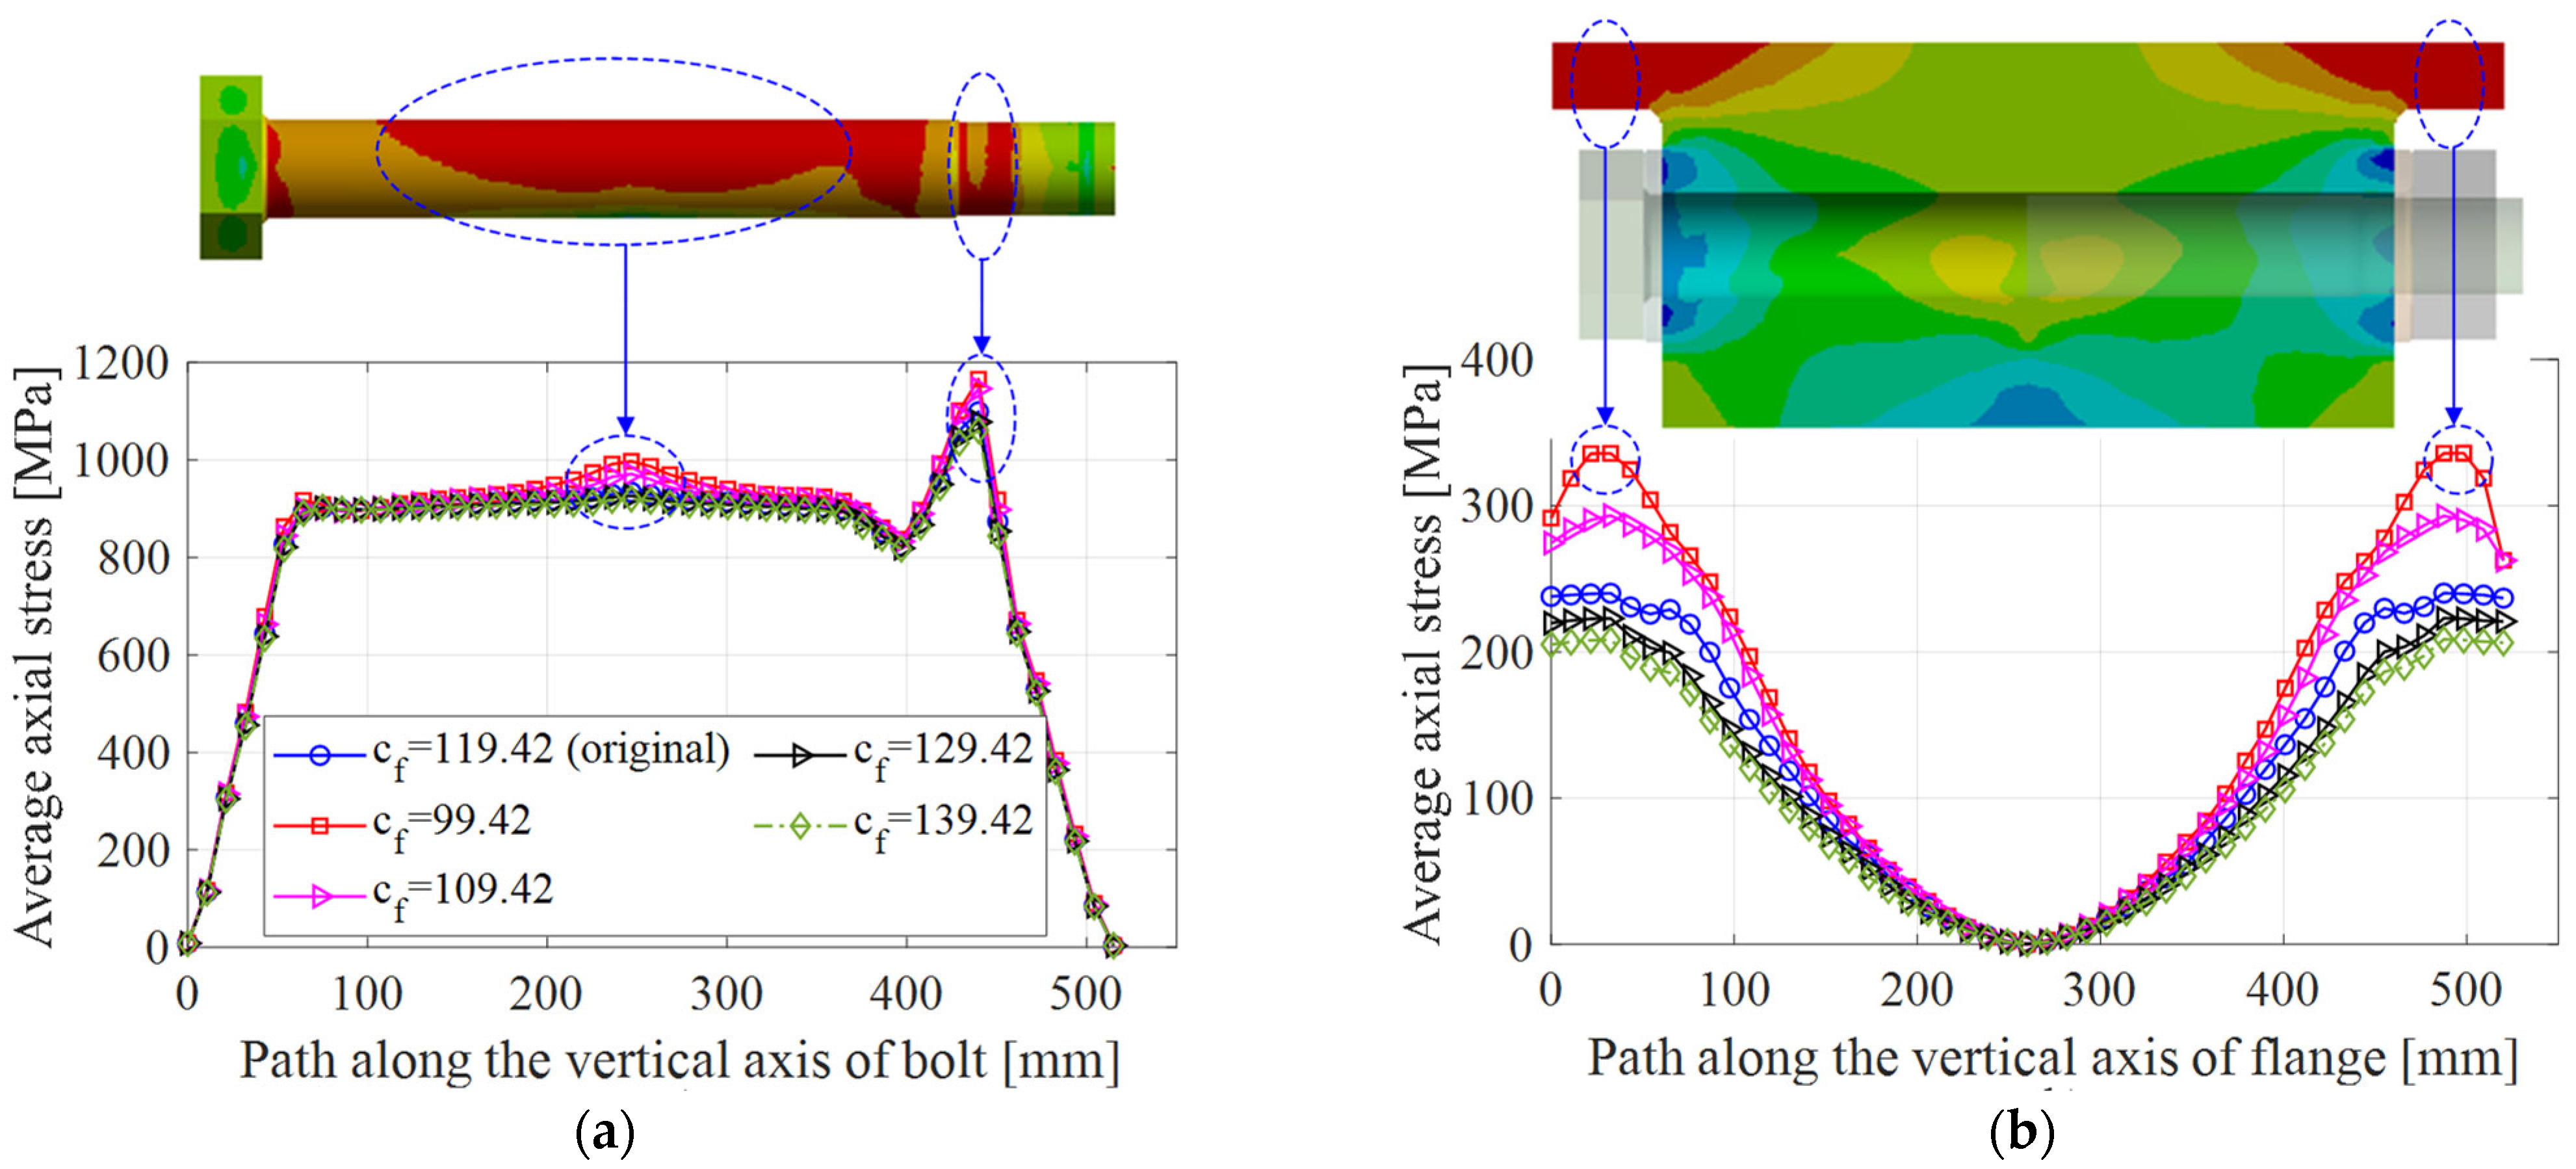
3.2.4. Effect of the Flange Width,
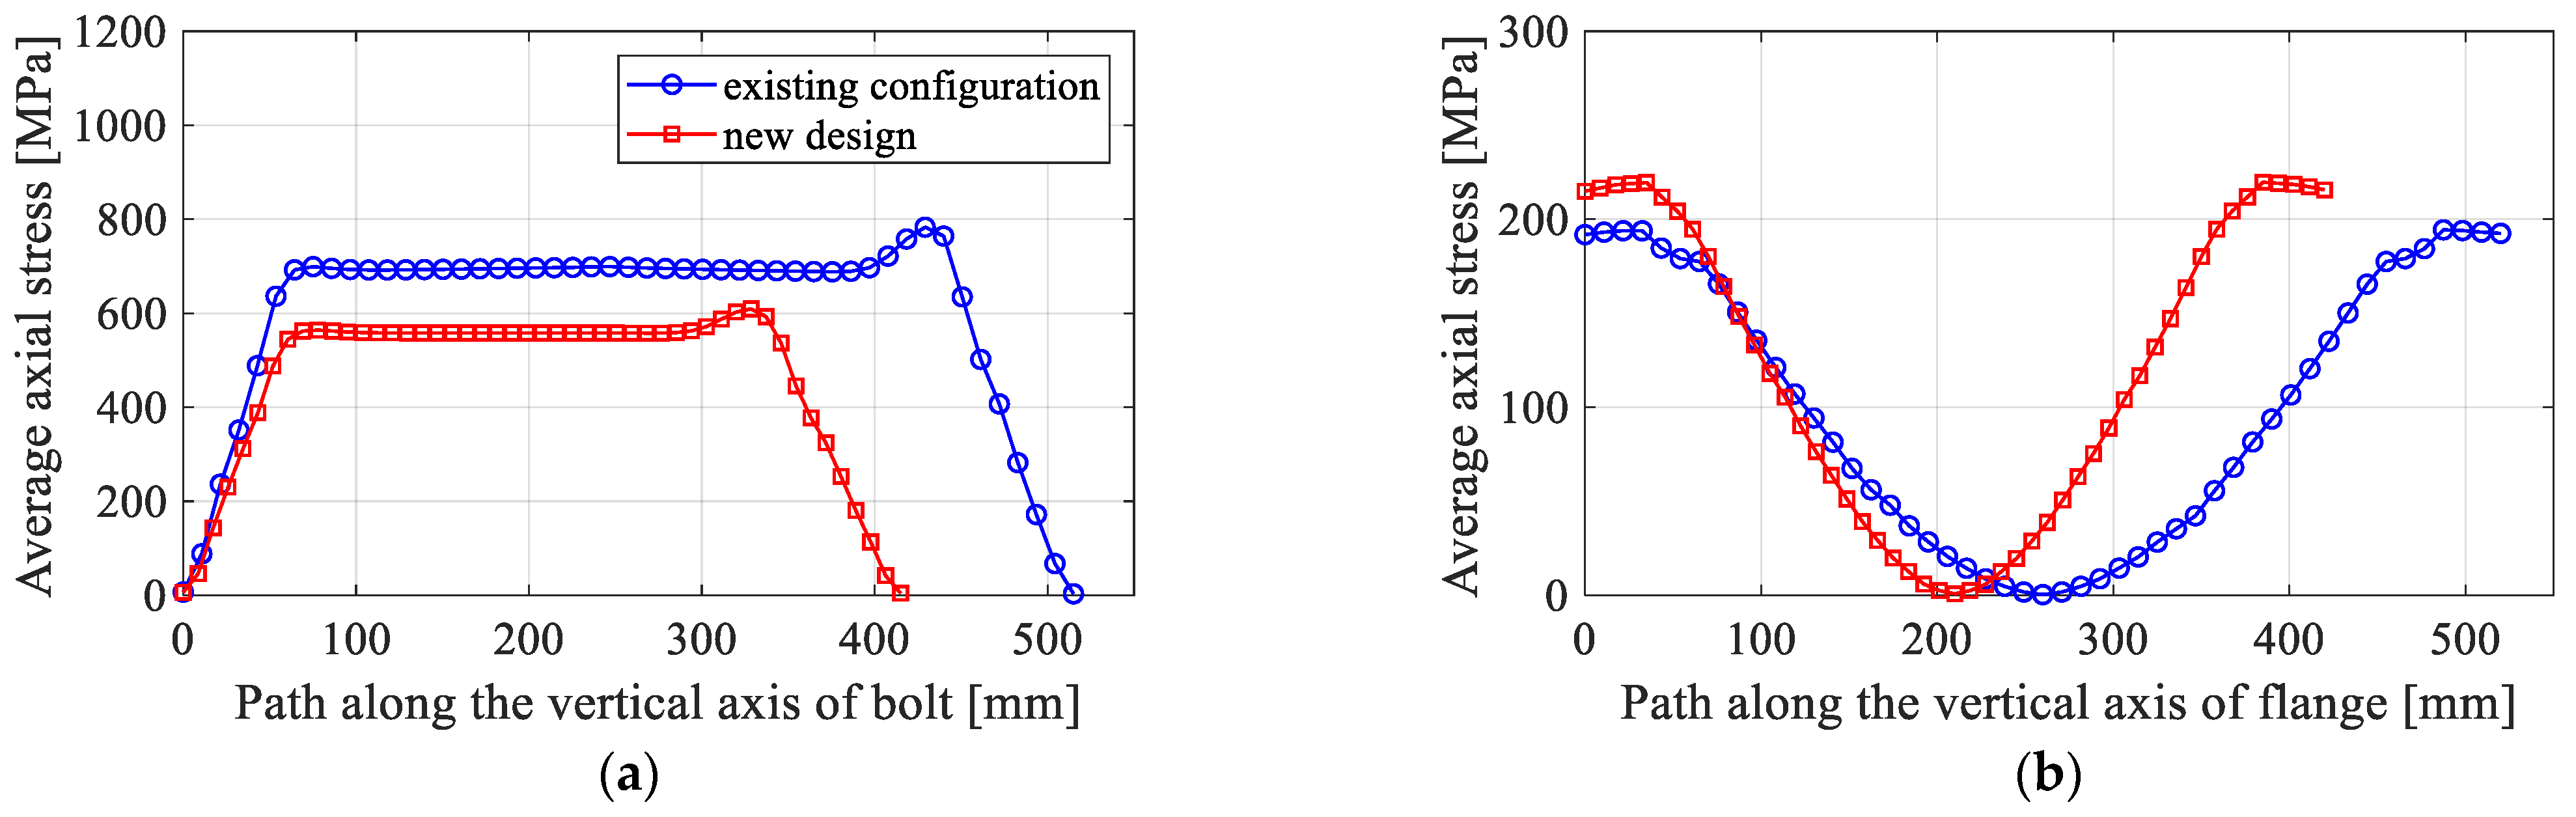
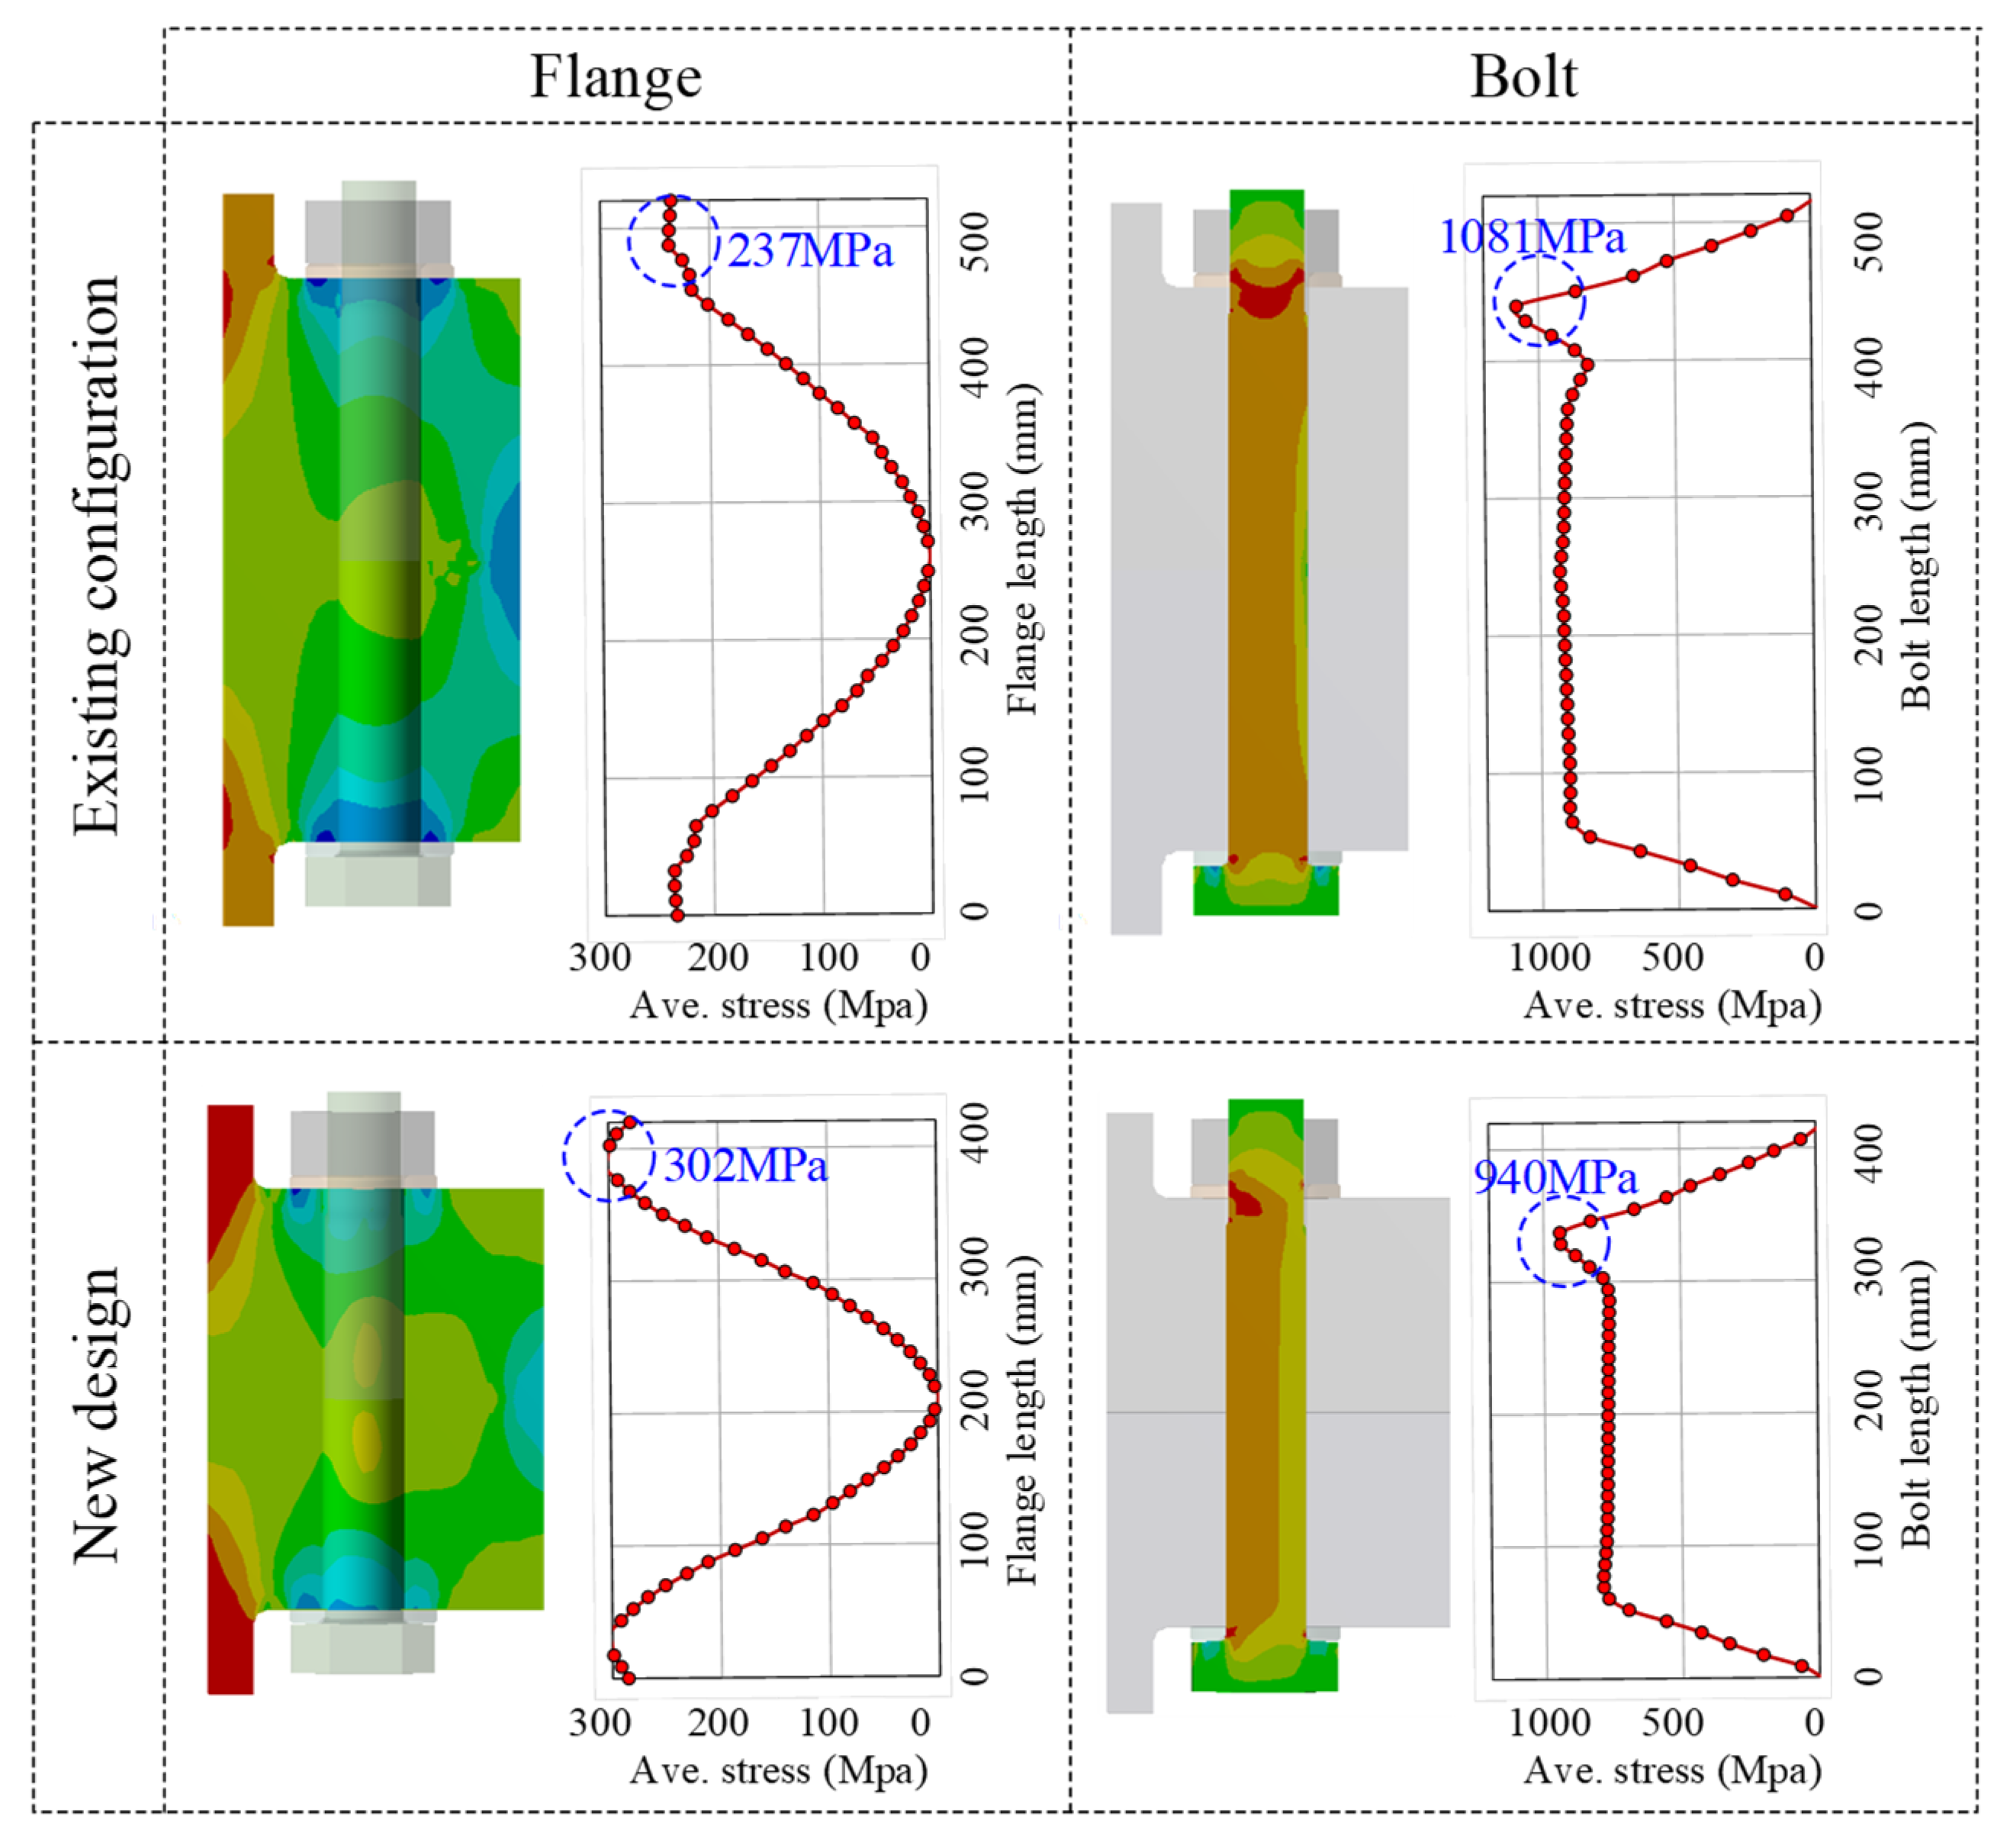
3.3. New Design of the Existing 5 MW Flange Joint
- Decrease the flange width : this aims to control the failure at the flange joint.
- Increase the aspect ratio : this aims to increase the safety of the bolt member and reduce the compressive stress at the inner flange–flange.
- Moreover, the flange thickness can be decreased to save material costs.
4. Conclusions
- Numerical simulation is an effective way to simulate various failure modes of the flange joints. The observed outcomes indicate that threaded bolt and flange-to-shell junction are the critical locations, leading to the failure in the flange joint.
- Following the parametric studies, it is found that the aspect ratio plays an important role in increasing the structural safety of the flange joint. The width of the flange segment will weaken the stiffness of the flange-to-shell junction. These parameters are useful in controlling the failure mode of the flange joint. Additionally, the flange and tower thicknesses have small influences on the performance of the connection.
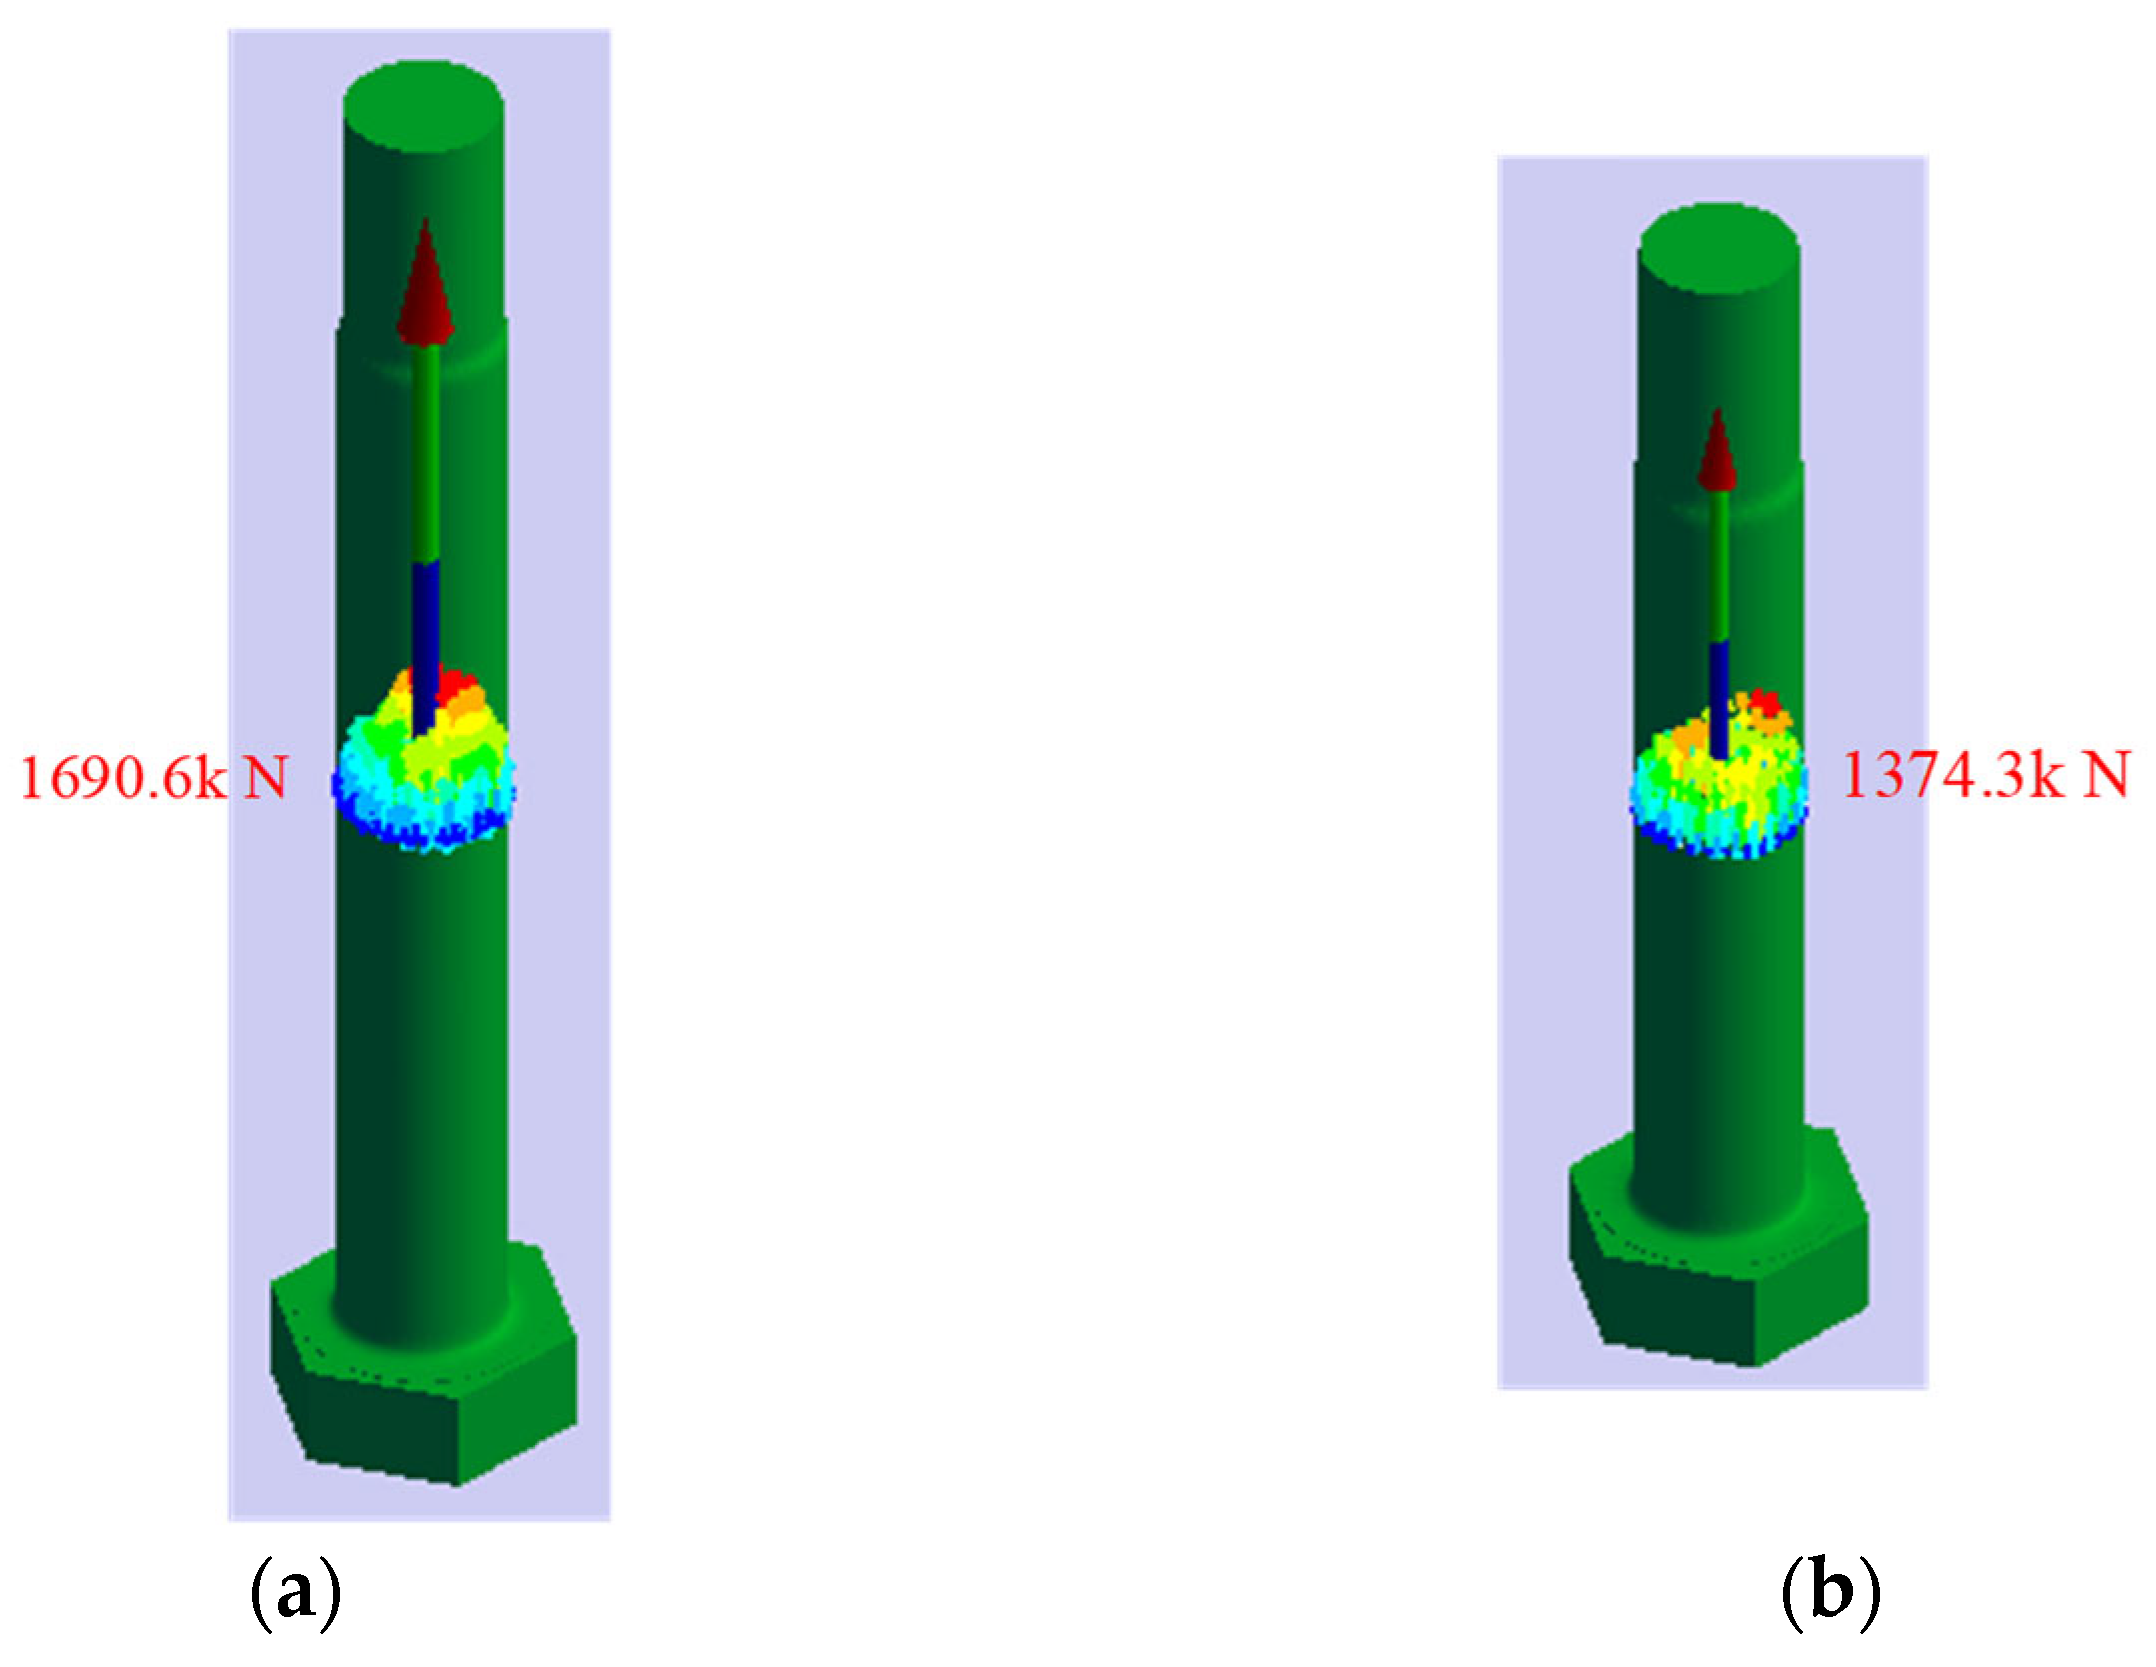
- A design modification of an existing 5 MW flange joint is carried out to enhance its structural safety. In comparison with the existing configuration, the new design shows a better performance, with a 22% reduction of the maximum stress in the bolt member.
Author Contributions
Funding
Data Availability Statement
Conflicts of Interest
Appendix A
References
- CWIF Wind Turbine Accident and Incident Compilation. Available online: https://docs.wind-watch.org/fullaccidents.pdf (accessed on 20 November 2022).
- Shokrieh, M.M.; Rafiee, R. Simulation of Fatigue Failure in A Full Composite Wind Turbine Blade. Compos. Struct. 2006, 74, 332–342. [Google Scholar] [CrossRef]
- Lee, K.S.; Bang, H.J. A Study on the Prediction of Lateral Buckling Load for Wind Turbine Tower Structures. Int. J. Precis. Eng. Manuf. 2012, 13, 1829–1836. [Google Scholar] [CrossRef]
- Chou, J.S.; Tu, W.T. Failure Analysis and Risk Management of a Collapsed Large Wind Turbine Tower. Eng. Fail. Anal. 2011, 18, 295–313. [Google Scholar] [CrossRef]
- Tran, T.T.; Lee, D. Development of jacket substructure systems supporting 3MW offshore wind turbine for deep water sites in South Korea. Int. J. Nav. Archit. Ocean Eng. 2022, 14, 100451. [Google Scholar] [CrossRef]
- Campione, G.; Cannella, F.; Zizzo, M.; Pauletta, M. Buckling Strength of Steel Tube for Lifting Telescopic Wind Steel Tower. Eng. Fail. Anal. 2021, 121, 105153. [Google Scholar] [CrossRef]
- Ma, Y.; Martinez-Vazquez, P.; Baniotopoulos, C. Buckling analysis for wind turbine tower design: Thrust load versus compression load based on energy method. Energies 2020, 13, 5302. [Google Scholar] [CrossRef]
- Chen, X.; Li, C.; Tang, J. Structural Integrity of Wind Turbines Impacted by Tropical Cyclones: A Case Study from China. J. Phys. Conf. Ser. 2016, 753, 042003. [Google Scholar] [CrossRef]
- Alonso-Martinez, M.; Adam, J.M.; Alvarez-Rabanal, F.P.; del Coz Díaz, J.J. Wind Turbine Tower Collapse due to Flange Failure: FEM and DOE Analyses. Eng. Fail. Anal. 2019, 104, 932–949. [Google Scholar] [CrossRef]
- Schaumann, P.; Seidel, M. Failure Analysis of Bolted Steel Flanges. Struct. Fail. Plast. 2000, 507–512. [Google Scholar] [CrossRef]
- Seidel, M.; Stang, A.; Wegener, F.; Schierl, C.; Schaumann, P. Full-scale Validation of FE Models for Geometrically Imperfect Flange Connections. J. Constr. Steel Res. 2021, 187, 106955. [Google Scholar] [CrossRef]
- Zhao, Z.; Dai, K.; Camara, A.; Bitsuamlak, G.; Sheng, C. Wind Turbine Tower Failure Modes under Seismic and Wind Loads. J. Perform. Constr. Facil. 2019, 33, 04019015. [Google Scholar] [CrossRef]
- Tran, T.-T.; Lee, D. Ultimate Load Capacity Assessment of the L-Type Flange Connection of An Existing 5 MW Wind Tower. In Proceedings of the Asia-Pacific Forum on Renewable Energy, Jeju, Republic of Korea, 31 October–3 November 2021; p. 146. [Google Scholar]
- Petersen, C. Tragfähigkeit Imperfektionsbehafteter Geschraubter Ringflansch-Verbindungen. Der Stahlbau 1990, 59, 97–104. [Google Scholar]
- DNVGL-ST-0126; Support Structures for Wind Turbines. DNV GL: Oslo, Norway, 2018.
- Tran, T.T.; Kim, E.; Lee, D. Development of a 3-legged Jacket Substructure for Installation in the Southwest Offshore Wind Farm in South Korea. Ocean Eng. 2022, 246, 110643. [Google Scholar] [CrossRef]
- Tran, T.-T.; Kang, S.; Lee, J.-H.; Lee, D. Directional Bending Performance of 4-Leg Jacket Substructure Supporting a 3 MW Offshore Wind Turbine. Energies 2021, 14, 2725. [Google Scholar] [CrossRef]
- Okorn, I.; Nagode, M.; Klemenc, J.; Oman, S. Analysis of Additional Load and Fatigue Life of Preloaded Bolts in a Flange Joint Considering a Bolt Bending Load. Metals 2021, 11, 449. [Google Scholar] [CrossRef]
- Ślęczka, L.; Leń, D. Prying Action in Bolted Circular Flange Joints: Approach Based on Component Method. Eng. Struct. 2021, 228, 111528. [Google Scholar] [CrossRef]
- Petersen, C. Stahlbau: Grundlagen der Berechnung und baulichen Ausbildung von Stahlbauten; Springer: Berlin/Heidelberg, Germany, 2012. [Google Scholar]
- Seidel, M. Zur Bemessung Geschraubter Ringflanschverbindungen Von Windenergieanlagen; Leibniz Universität Hannover: Hannover, Germany, 2001. [Google Scholar]
- Tobinaga, I.; Ishihara, T. A Study of Action Point Correction Factor for L-Type Flanges of Wind Turbine Towers. Wind Energy 2018, 21, 801–806. [Google Scholar] [CrossRef]
- DNVGL-RP-C208; Determination of Structural Capacity by Non-Linear Finite Element Analysis Methods. DNV: Oslo, Norway, 2013.
- Deutscher Ausschuss für Stahlbau DASt-Richtlinie 021: Schraubenverbindungen Aus Feuerverzinkten Garnituren M39 bis M72; Stahlbau Verlags- und Service GmbH: Düsseldorf, Germany, 2013.
- EN 1993-1-8; Eurocode 3: Design of Steel Structures—Part 1-8: Design of Joints. European Union: Brussel, Belgium, 2005.
- Seidel, M.; Schaumann, P. Measuring Fatigue Loads of Bolts in Ring Flange Connections. In Proceedings of the European Wind Energy Conference, Copenhagen, Denmark, 2–6 July 2001. [Google Scholar]
- Tran, T.-T.; Lee, D. Understanding the behavior of l-type flange joint in wind turbine towers: Proposed mechanisms. Eng. Fail. Anal. 2022, 142, 106750. [Google Scholar] [CrossRef]
- DNVGL RP-C203; Fatigue Design of Offshore Steel Structures. DNV: Oslo, Norway, 2016.
- Thage, K.J. Investigation of Flange Connection Capacity for Offshore Wind Turbine Foundations. Doctoral Dissertation, Technical University of Denmark, Lyngby, Denmark, 2017. [Google Scholar]

| Bolt | Tower (mm) | Flange (mm) | ||||||
|---|---|---|---|---|---|---|---|---|
| Size | ||||||||
| 3 MW | M56 | 102 | 4500 | 34 | 180 | 230 | 120 | 93 |
| 4 MW | M72 | 88 | 4200 | 43 | 145 | 266.5 | 135 | 110 |
| 5 MW | M56 | 152 | 6000 | 36 | 200 | 210 | 99 | 93 |
| Specimen | Part | Material | Thickness | |||||||
|---|---|---|---|---|---|---|---|---|---|---|
| [mm] | [MPa] | [MPa] | [MPa] | [MPa] | [-] | [-] | [-] | |||
| 3 MW | Tower | EN355 | 34 | 310.5 | 345.0 | 348.4 | 470.0 | 0.004 | 0.02 | 0.15 |
| Flange | EN355 | 180 | 264.7 | 294.4 | 297.5 | 411.0 | 0.004 | 0.02 | 0.15 | |
| Bolt | 10.9 | - | - | 900.0 | - | 1000.0 | 0.00429 | 0.015 | 0.09 | |
| 4 MW | Tower | EN355 | 43 | 301.5 | 335.0 | 338.4 | 450.0 | 0.004 | 0.02 | 0.15 |
| Flange | EN355 | 145 | 275.3 | 306.1 | 309.3 | 423.2 | 0.004 | 0.02 | 0.15 | |
| Bolt | 10.9 | - | - | 900.0 | - | 1000.0 | 0.004 | 0.02 | 0.15 | |
| 5 MW | Tower | EN355 | 36 | 310.5 | 345.0 | 348.4 | 470.0 | 0.004 | 0.02 | 0.15 |
| Flange | EN355 | 200 | 258.6 | 287.7 | 290.7 | 404.1 | 0.004 | 0.02 | 0.15 | |
| Bolt | 10.9 | - | - | 900.0 | - | 1000.0 | 0.004 | 0.02 | 0.15 |
| Specimen | DLC | Moment [kNm] | Force [kN] | ||||||||
|---|---|---|---|---|---|---|---|---|---|---|---|
| 3 MW | y | Max | −2445.4 | −85,509 | 85,544 | −1726.8 | −1119.5 | 40.2 | 1120.2 | −5148.6 | 7.52 × 10² |
| 4 MW | Max | −95,607 | 83,008 | 126,614 | 4110.7 | 1106 | 1450.6 | 1824.2 | −5067.9 | 1.33 × 10³ | |
| 5 MW | y | Max | 183,406 | −38,277 | 187,357 | 8070.5 | −189.3 | −2385.7 | 2393.2 | −8436.2 | 8.59 × 10² |
| Group | Tower | Bolt Size | Flange | ||||||
|---|---|---|---|---|---|---|---|---|---|
| [mm] | [mm] | [-] | [mm] | [mm] | [mm] | [mm] | [mm] | [-] | |
| Group 0 | 6000 | 36 | M56 | 200 | 119.42 | 210 | 99 | 93 | 1.06 |
| Group 1 | 6000 | 36 | M56 | 170 | 119.42 | 210 | 99 | 93 | 1.06 |
| 6000 | 36 | M56 | 150 | 119.42 | 210 | 99 | 93 | 1.06 | |
| Group 2 | 6000 | 34 | M56 | 200 | 119.42 | 210 | 100 | 93 | 1.08 |
| 6000 | 32 | M56 | 200 | 119.42 | 210 | 101 | 93 | 1.09 | |
| Group 3 | 6000 | 36 | M56 | 200 | 119.42 | 220 | 109 | 93 | 1.17 |
| 6000 | 36 | M56 | 200 | 119.42 | 230 | 119 | 93 | 1.28 | |
| 6000 | 36 | M56 | 200 | 119.42 | 240 | 129 | 93 | 1.39 | |
| Group 4 | 6000 | 36 | M56 | 200 | 109.42 | 210 | 99 | 93 | 1.06 |
| 6000 | 36 | M56 | 200 | 99.42 | 210 | 99 | 93 | 1.06 | |
| 6000 | 36 | M56 | 200 | 129.42 | 210 | 99 | 93 | 1.06 | |
| 6000 | 36 | M56 | 200 | 139.42 | 210 | 99 | 93 | 1.06 | |
| Model | Geometry | Weight | Number of Bolts | ||||||
|---|---|---|---|---|---|---|---|---|---|
| Tower | Flange | ||||||||
| [mm] | [mm] | [mm] | [mm] | [mm] | [mm] | [mm] | [T] | [-] | |
| Existing configuration | 6000 | 36 | 200 | 119.42 | 210 | 99 | 93 | 6.315 | 152 |
| New design | 6000 | 32 | 150 | 99.42 | 240 | 131 | 93 | 5.396 | 166 |
Publisher’s Note: MDPI stays neutral with regard to jurisdictional claims in published maps and institutional affiliations. |
© 2022 by the authors. Licensee MDPI, Basel, Switzerland. This article is an open access article distributed under the terms and conditions of the Creative Commons Attribution (CC BY) license (https://creativecommons.org/licenses/by/4.0/).
Share and Cite
Tran, T.-T.; Kang, S.; Lee, D. Improving Structural Safety of L-Type Flange Joint for Wind Towers. Energies 2022, 15, 8967. https://doi.org/10.3390/en15238967
Tran T-T, Kang S, Lee D. Improving Structural Safety of L-Type Flange Joint for Wind Towers. Energies. 2022; 15(23):8967. https://doi.org/10.3390/en15238967
Chicago/Turabian StyleTran, Thanh-Tuan, Sangkyun Kang, and Daeyong Lee. 2022. "Improving Structural Safety of L-Type Flange Joint for Wind Towers" Energies 15, no. 23: 8967. https://doi.org/10.3390/en15238967
APA StyleTran, T.-T., Kang, S., & Lee, D. (2022). Improving Structural Safety of L-Type Flange Joint for Wind Towers. Energies, 15(23), 8967. https://doi.org/10.3390/en15238967