Abstract
A heat pipe is an energy-efficient heat transfer device that relies on evaporation and condensation processes for energy transfer. The main purpose of this study is to simulate a two-phase closed thermosyphon, at moderate temperature, that can be used in industrial applications such as steam power plants. After creating a computational network in the Gambit software, the thermosyphon is simulated in Fluent software using the VOF model. Special oil is employed as the working fluid. Based on the CFD results, the efficiency of the system reaches approximately 96%, and the thermal resistance decreases to 0.54 K/W. The contours of the boiling and evaporation process at differing filling ratios, ranging between 30–90%, is visually investigated and the best performance is obtained for 30% of the filling ratio in thermosyphon. At higher filling ratios, more giant bubbles are generated in thermosyphon, which can attach to the inner wall of the system and reduce the thermal performance. The steady-state condition is obtained 84 s after the start of the process.
1. Introduction
One of the most crucial study areas in the field of engineering is the efficiency of thermal devices. Due to their outstanding heat transfer capability, heat pipes are regarded as one of the most acceptable technologies and economical thermal control options. Heat pipes are energy transfer devices based on the evaporation and condensation of a working fluid in a closed pipe. In the evaporator part, the energy is absorbed by the working fluid and transferred to the heat sink in the condenser part of the heat pipe. In a two-phase closed thermosyphon (TPCT), the vapor is fed back to the evaporator through gravity. Due to its ow thermal resistance, as well as the fact it requires less space, the heat pipe is a suitable device for many different applications, such as for electronic cooling equipment, solar collectors, and heat exchangers [1,2,3,4,5]. Due to the simple structure and low price of the TPCT, they have attracted more attention than other types of heat pipes [6].
Geometrical parameters such as aspect ratio, filling ratio (FR) and tilt angle have an important effect on the thermal behavior of the TPCT [7]. Various mass and heat transfer phenomena, including phase changes, conductive and convective heat transfer, surface interactions of different phases, surface evaporation, and nuclear boiling, are involved in a conventional heat pipe. Therefore, the simulation of TPCTs is a very complex problem, which requires an in-depth understanding of the relevant physical phenomena, as well as the choice of suitable theoretical models, to produce an accurate picture of the actual nature of its heat and mass transfer processes.
Simulation through Computational Fluid Dynamics (CFD) is a suitable tool for investigating complicated physical phenomena of phase changes in TPCTs. In this regard, Gamboa et al. [8] have assessed available models in ANSYS Fluent software to examine the effect of turbulence, condensation, phase change and interphase interface on heat transfer and mass transfer in a TPCT. Their numerical results have shown that the use of a turbulent viscous model is not essential, and a variable density model can simulate the temperature distribution inside the TPCT well.
Wang et al. [9] have predicted the flow pattern in a TPCT using CFD software. Different mass transfer coefficients were used in their simulation. The preliminary results show that the evaporation and condensation coefficients are in reasonable agreement with the existing experimental data. In addition, the three-dimensional models qualitatively implemented in this study predict the phase change and the basic flow pattern in a TPCT. A pressure-based phase change model has been proposed by Wang et al. [10] to set the thermal balance and investigate the effect of hydrostatic pressure on the boiling process. Then, this model was to develop a simulation for TPCT, based on the volume of fluid (VOF) approach. Their CFD results have been confirmed by experimental data for TPCTs with ammonia as the working media.
Alizadehdakhel et al. [11] have investigated the CFD modelling of the energy and flow transfer process in a TPCT. In this study, the liquid-gas flow and phase change phenomenon were modelled simultaneously. The VOF approach was considered to simulate the phase interactions. The output results of the simulation predict the temperature profile in the TPCT and are in good agreement with experimental measurements. Fadhl et al. [12,13] have studied A CFD analysis of the temperature distribution for two-phase flow in a thermosyphon. Distilled water, R404a and 134a, were used as the working media. The simulation of the vapor-liquid phase change processes in the TPCT has been improved by writing a user-defined function (UDF) to the CFD software. The average wall temperature of TPCTs was compared with the experimental values in similar conditions and demonstrated that the expected and empirical findings are in good agreement.
Nanofluids as a new medium of heat transfer have been studied by researchers for various applications [14,15]. Due to their specific thermal characteristics, they can also be used as a working media in TPCTs. Asmaie et al. [16] have evaluated the thermal behavior of nanofluids in a TPCT using CFD modelling. Huminic et al. [17] have numerically investigated the heat transfer in TPCTs using nanofluid. In this study, the authors primarily focused on the effect of nanofluid concentration and operating temperature on the thermal behavior of TPCTs. Based on the experimental and numerical results, when a TPCT is charged by a nanofluid, it shows better heat transfer characteristics than water.
A 3D unsteady state model for a TPCT to model the flow patterns has been reported by Temimy et al. [18]. The VOF model has been used to simulate a vertical copper pipe. The simulation results clearly show the behavior of both the rising hot vapor and the condensed stream flowing down near the inner tube wall. Jouhara et al. [19] have presented a new and comprehensive 3D model of a TPCT, in which both the complex characteristics of the multi-phase heat transfer and mass transfer in the boiling and condensing process and the thermal properties of the coolant in the heat exchanger of the condenser have been investigated. The geyser-boiling phenomenon is influenced by many factors, such as heat load, FR, and two-phase temperature reported in their modelling. When the FR is large, and the heat input is not sufficient, the geyser effect can be observed in the heat pipe [20]. Wang et al. [21] have observed the geyser effect during a numerical study when the evaporator and condenser part of TPCT reach 95 °C and 30 °C, respectively.
Alammar et al. [22], by introducing a new CFD simulation in a TPCT, have studied the effect of the FR and also the tilt angle on thermal behavior by Fluent software and showed that in the lower FRs and inclination angles, a substantial rise in the temperature of the evaporator occurs. In addition, according to their investigations, it has been concluded that the lowest thermal resistance is created at FR = 65% and the inclination angle of 90° for all heat input values, and relatively small bubbles for the filling ratio of 25% and 35% are observed. Ahmed et al. [23] have conducted comprehensive modelling and simulation to study the thermal behavior of a TPCT. The simulation results have been evaluated in terms of temperature and velocity distribution, and volume fractions have shown that the best performance in the input power of 250 W, an inclination angle of 90°, and FR = 50% has been obtained.
Zhao et al. [24] have investigated the transient thermal performance of phase change, heat transfer, and mass transfer in a TPCT by presenting a CFD model. The changes of the average wall temperature showed that the TPCT reaches its steady state after 19 s. A vertical TPCT by a two-fluid method in the Eulerian multiphase domain has been numerically analyzed by Kafeel et al. [25]. A full-scale axisymmetric model was used to simulate the thermosyphon, initially, and then the model was used to forecast how the TPCT would behave under various heating conditions. When the input power of the evaporator part of the TPCT is relatively high, the drying of the liquid film occurs with the evaporation of the condensed liquid. It causes a quick vapor stream to the condenser section. Rizky et al. [26] have evaluated this phenomenon with a transient CFD simulation of a two-dimensional model. The results have shown that the drying effect of the liquid film in FR of 50%, 60% and 70% occurs in 1.35, 45.8 and 65.9 s, respectively. Fartahi et al. [27] have performed a CFD analysis to simulate the process of boiling and condensation and the creation of the liquid film in a TPCT. They applied the VOF technique to solve the model. Their results were compared with the laboratory observations, and the studies showed a good agreement between them. Thermosyphon is one of the most successful systems for solar energy conversion. In this regard, Qasim et al. [28] and Freegah et al. [29] have investigated the natural convection process in a solar thermosyphon system using a CFD code. Their results have shown that the spiral tube is more efficient than the straight tube in the heating section, for the same operating conditions.
In order to use TPCT heat exchangers, rather than Ljungstrom, one of the most widely used boiler air preheaters in steam power plants, it is necessary to simulate a thermosyphon in the medium temperature range. However, most parts of the available experimental and CFD investigations on thermosyphons have been conducted at low or very high operating temperatures. At moderate operating temperatures (200 to 250 ), the performance of the TPCT has not been evaluated carefully. In this research, by simulating a single TPCT at a moderate-temperature range, the two-phase flow pattern and temperature distribution in different filling ratios are investigated, and the optimal filling ratio that leads to the lowest thermal resistance is presented.
2. Governing Equations and Simulation Details
The first step in solving the problem is approximating the unknown variables of flow by simple functions in the governing equations. The next step is the discretization of the equations by replacing the approximations and, finally, solving the algebraic equations [30]. In this research, the modelling of the desired problem has been conducted in the Ansys Fluent software. The Euler-Euler model has been used, taking into consideration that the volume percentage of the dispersed phase is greater than 10% [12].
The numerical solution, according to the finite volume method for multiphase flows, is more complicated than for single-phase flows. The reason for this is the non-stationary connection line between the phases, which causes changes in the physical properties in the connections line. Therefore, to solve the problem, a lot of computational effort is needed. The volume of fluid (VOF) is a suitable technique to solve this kind of problem by specifying the movement of both vapor and liquid phases. To track the movement of different phases in the Navier-Stokes equations, a volume fraction is defined for each phase, and in the VOF model [31]. The VOF model is based on the fact that each cell in the computational domain is occupied by a vapor or liquid phase, or both phases. Liquid and vapor volume fraction is named and respectively. When , it means that the cell is occupied by liquid and vapor [32].
In the present study, the governing equations are used to demonstrate the movement of the fluid in the TPCT. In addition, due to the physics of the problem, the velocity of both phases is low, and they establish a laminar flow inside the thermosyphon. The continuity equation for the VOF model is obtained as follows:
The purpose of Equation (1) is to examine the phase interface. The conservation of the mass equation for the secondary phase and the equation of motion for the VOF model are described by Equations (2) and (3), respectively [12]:
The impact of surface tension on the liquid-vapor interface is considered in Equation (3) by the term [33]. The energy equation for the VOF model is demonstrated as follows [12]:
and in Equations (2) and (4) are mass and energy terms used to compute the amount of mass and heat transferred during vapor-liquid phase change, respectively [13]. The classical equation to predict the density, viscosity, and thermal conductivity of the mixture (liquid and vapor) can be expressed as follows:
The internal energy in Equation (4) can be calculated based on the average variable as follow:
A UDF has been used to model the evaporation and condensation process in the TPCT to complete the existing Fluent code. The development of the UDF and the related controlling equations, in this case, have been reported by De Schepper et al. [31], in 2009. Other researchers, such as Fadhl et al. [12,13], later used the same UDF code in. In the current simulation, we attempted to apply the same equations (mass and energy generation terms) used by De Schepper [31] to model the process of evaporation and condensation in the TPCT as a UDF to complete the existing Fluent code.
For the liquid and vapor phases, a series of relationships to calculate the amount of heat and mass transfer between the vapor and liquid phase during the evaporation (T > Tsat) and condensation (T < Tsat) processes were presented in the literature [12,13,31]. The mass and energy generation terms ( and ) have been added to the continuity and energy equations, respectively. The mass and energy generation terms include the relationships between the saturation temperature, phase density, latent heat, and α coefficient. Special liquid oil is considered as the primary phase, and oil vapor as the secondary phase. In this simulation, the SIMPLE algorithm is used for the coupling of the pressure and velocity and the first order equation is applied to determine the momentum and energy in the simulation. To avoid the error of Courant number in the software, the time step can be reduced, or the mesh size of the system can be increased. By considering 0.00001 to be a time step and choosing a non-uniform mesh size for the system (finer at the boundaries and coarser at points far from the boundaries), this problem was solved, and the modelling was carried out to its steady state in the Fluent software. Table 1 summarizes the parameters considered in the present simulation.

Table 1.
Summary of the parameters in simulation.
3. Results and Discussion
As there is no information regarding the application of TPCTs at a moderate temperature that can be used in steam power plants (100–350 ), the output results of Fadhl et al.’s [12] research, is used to test and validate the accuracy of the current numerical simulation.
3.1. Validation
Water vapor is regarded as the primary phase (vapor), and liquid water as the secondary phase (liquid). As the relative vacuum is considered in TPCT at the initial state, for calculations of energy and mass transfer during the phase change, the boiling temperature of 348 K is applied. The length of the evaporator, adiabatic, and condenser parts is set to be 0.2, 0.1, and 0.2 m, respectively. Three different grid sizes, with 40,000, 80,000 and 120,000 (rounded figures) computational cells, are generated and evaluated to check the grid independency of the system. As a thin liquid film is formed near the wall, 12 mesh layers are used as the boundary layer to capture all changes near the inner wall. The static temperature distribution in the evaporator and condenser section of the TPCT are shown in Table 2, when the input power is set to be 172.87 W. A slight difference can be seen in the prediction of the wall temperature of the TPCT between the 80,000 and 120,000 computational cells. Therefore, to reduce the calculation costs, the grid size with 80,000 cells is selected in the simulation (Figure 1).

Table 2.
The results of the grid independency for validation part.
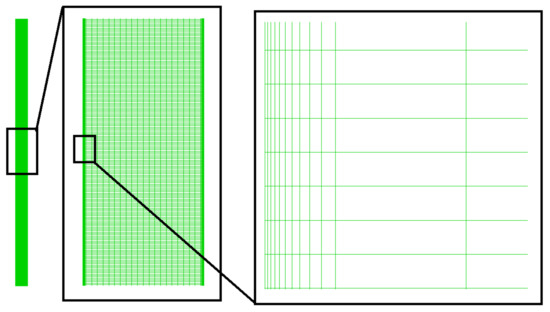
Figure 1.
Mesh with 80,000 computing cells for validation.
As reported in Ref. [12], the wall temperature of the TPCT has been measured at eight points. In the evaporator, adiabatic and condensers, one, two, and five places are considered for temperature measurement, respectively. Table 3 shows the position of the thermocouples, the experimental temperature values and the temperature value obtained from the current simulation. The relative error varies between 1.73 and 6.99%. Considering the error values, it found that the present numerical simulation is valid and can be used for other temperature ranges of thermosyphons.

Table 3.
Validation check based on temperature changes in the inner side of TPCT.
The average temperature difference between the evaporator and condenser parts of the TPCT, divided by the input power, is known as the thermal resistance of TPCT. The thermal resistance, based on the current CFD compared with the existing experimental data [12], is reported in Table 4. As seen in this Table, the thermal resistance, according to the CFD analysis conducted by Fadhl et al. [12], has a significant difference from their experimental results. However, in the present simulation, by modifying the input parameters in the Fluent software, somewhat more acceptable results have been obtained. The efficiency of TPCTs, which is regarded as the ratio of the energy given to the heat sink in the condenser to the input power from the heat source in the evaporator [7], is calculated to be 84%.

Table 4.
Comparison of thermal resistance for validation.
The volume fraction of the liquid and vapor phase for pool boiling in the evaporator section of the TPCT is depicted in Figure 2. The red and blue color is related to the vapor and liquid phase, respectively. The number one in the color map represents the pure vapor phase and the number zero represents the pure liquid phase. In the boundaries between the two phases, which is shown with green colors, there is a combination of liquid and vapor states. In a TPCT, heat is transferred through a phase change. The energy that is transferred from the TPCT wall in the evaporator section to the fluid inside the thermosyphon causes its phase to change. The liquid pool in the TPCT boils quickly due to the low pressure inside the thermosyphon, and this means that tiny bubbles are formed near the wall, which move upwards and can join with others and create more giant bubbles.
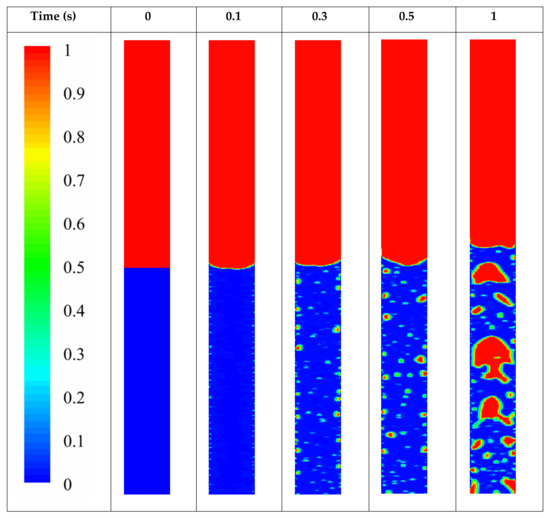
Figure 2.
Contours of volume fraction in the evaporator part of TPCT charged by distilled water at different times for validation.
3.2. Simulation of TPCT at Moderate Temperature
The simulation process of the thermosyphon in an unsteady state is a very complicated and time-consuming process, even with the use of high-speed computers. Relative vacuum (15 kPa absolute) is applied inside the TPCT, at the initial state, for calculations of energy and mass transfer during the phase change. The value of latent heat in the UDF code is considered to be approximately 2648.9 kJ/kg. The constant temperatures of 493 K and 298 K are applied as boundary conditions on the evaporator and condenser walls, respectively. An appropriate working fluid must not be decomposed at those temperatures, and the boiling and condensation process should occur at higher temperatures than conventional TPCT. A specific high-temperature oil has been selected as the working fluid for this simulation, which has the same thermophysical properties as C15H32 (Table 5).

Table 5.
Thermophysical properties of working fluid.
The current research is the first part of a multi-year comprehensive program. The main purpose of this program is to investigate and evaluate the feasibility of replacing the Ljungstrom air preheater, used in steam power plants, with heat pipe heat exchangers. In the first step, which is also the main goal of this study, the simulation of the single heat pipe heat exchanger is conducted to measure the ability of the proposed working fluid in the system. In future stages, the pilot scale of the system will be built. Therefore, the dimensions of the heat pipe in the current simulation are selected according to the laboratory set-up in which the next stages of the comprehensive program will be built. The geometric characteristics of the studied TPCT are shown in Table 6 and Figure 3. A copper pipe with an inner and outer diameter of 28 and 32 mm, respectively, is considered. The total length of this TPCT is considered to be 1.1 m. The length of the evaporator section is considered larger than the other sections, because in real situations in the power plant, when the hot gases flow in this section, the maximum possible thermal power can be absorbed. The length of the adiabatic section is also considered to be 30 cm to ensure the separation of hot flow (smoke) and cold flow (air) and their non-mixing in real situations.

Table 6.
Geometric characteristics of the TPCT in CFD study.
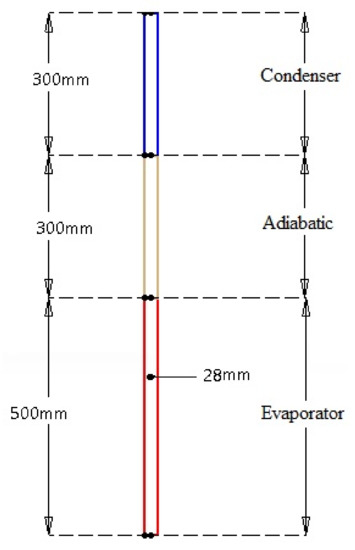
Figure 3.
Dimension of the TPCT in CFD study.
In this CFD study, 55,000, 110,000 and 180,000 (rounded figures) computational cells are considered to test the independence of the solution from the computational grid. The temperature distribution of the condenser and evaporator wall, at 20 s after the start of the process, is used to test the grid independency. Table 7 shows the average temperature of the evaporator and condenser section. It is evident that the temperature difference between the 110,000 and 180,000 mesh sizes is not significant. Therefore, in this CFD research, the 110,000 computing-cell is selected and used non-uniformly to reduce the computing time, as depicted in Figure 4. The compression of the mesh grid near the walls and their greater distance at points far from the walls are visible in this figure.

Table 7.
The results of the grid independency for CFD study of oil in TPCT.
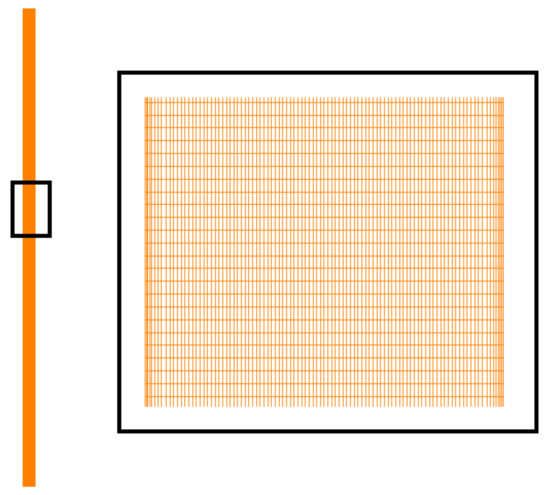
Figure 4.
Mesh with 110,000 computing cells for CFD study of oil in TPCT.
The boiling process in the TPCT, for filling ratios of 50, 70 and 90%, are shown in Figure 5, Figure 6 and Figure 7, respectively. At the start of the process, the liquid pool at the bottom of the TPCT is heated; when the temperature of the pool reaches to saturation temperature, the liquid to vapor phase change occurs. The vapor is transferred to the condenser section, where condensation occurs along the cold walls, and a thin liquid layer is formed on the inner wall of the thermosyphon pipe. Due to the energy transfer to the working fluid from the walls, the boiling and phase change begins, and bubbles are generated. Then, the number of bubbles and their size increase. It can be seen that as the filling ratio increases, more bubbles are seen in the liquid phase, which is due to the enhancement of the heat transfer surface between the wall and the oil. The main reason for the thermal resistance against heat transfer in a TPCT is the generation of these bubbles in the liquid pool of the evaporator section. As liquid has a considerably higher convective heat transfer coefficient than vapor, more heat is transferred from the evaporator to the liquid phase. As a result, it is expected that the amount of boiling and bubble formations increases with the increase of the filling ratio. More giant bubbles lead to more thermal resistance, preventing the energy exchange between the TPCT wall’s solid and liquid phase. Therefore, at the lower filling ratio, the thermal resistance is less.
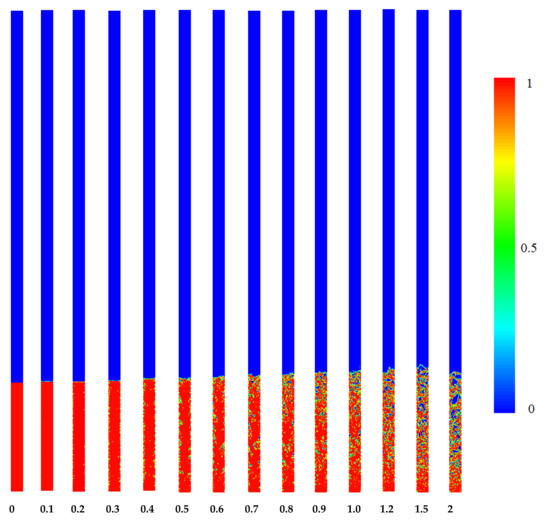
Figure 5.
Contours of volume fraction in entire parts of TPCT at different times for FR = 50%.
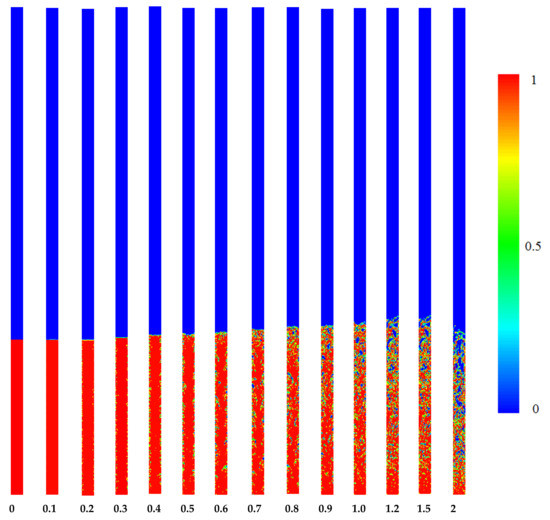
Figure 6.
Contours of volume fraction in entire parts of TPCT at different times for FR = 70%.
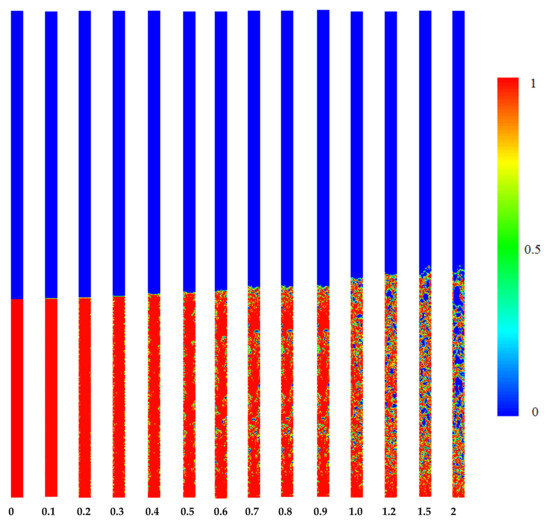
Figure 7.
Contours of volume fraction in entire parts of TPCT at different times for FR = 90%.
To obtain a better comparison between the formation and growth of bubbles in different filling ratios, the contour of the liquid volume fraction in the evaporator part, for two times of 0.7 and 2 s, are presented in Figure 8. Relatively tiny bubbles are observed for the filling ratio of 50%, while more and more giant bubbles are generated at higher filling ratios. When the FR is equal to 90%, the interconnectedness of the bubbles in the areas near the border of the adiabatic part can also confirm the higher thermal resistance of the TPCT at higher filling ratios.
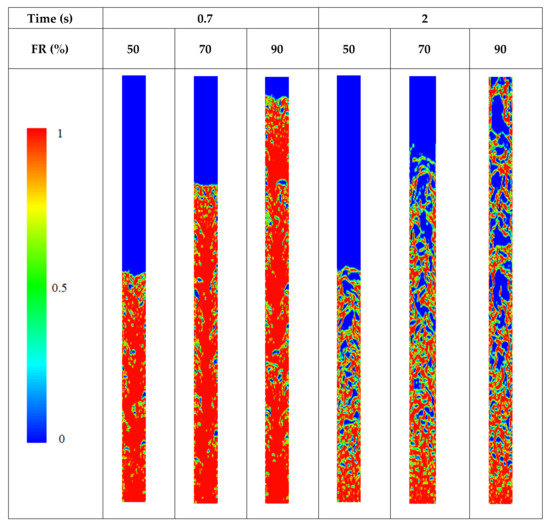
Figure 8.
Comparison of liquid volume fraction contours in evaporator for different filling ratios at two different times.
The temperature distribution for the studied filling ratio at 0.7 and 2 s in the evaporator section of the TPCT is illustrated in Figure 9. Through the vaporization of the liquid, the produced vapor moves upwards due to the buoyancy effect. At FR = 50% and time = 0.7 s, the movement of vapor in the form of a jet from the interface of the liquid and vapor towards the condenser section of the TPCT is noticeable and the differentiation of its temperature contours compared to its surrounding points is also evident in this figure. At time = 2 s, the movement of the vapor towards the condenser part is similar to turbulent flow. It covers a larger part of the cross-section, which shows that the vapor occupies a larger volume of the space above the liquid with the higher temperature.
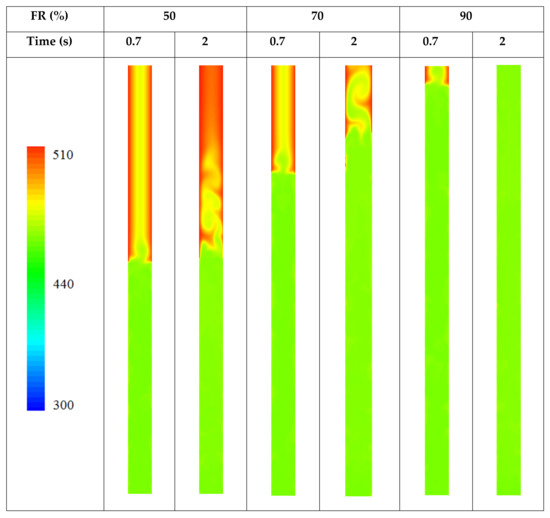
Figure 9.
Comparison of temperature contours for different filling ratios at two different times.
It is worth mentioning that the volume of the boiling liquid pool in the evaporator part of the TPCT increases when more time passes. Therefore, the interface between the liquid and the vapor advances towards the condenser section.
The contours of the liquid volume fraction, from 0 to 2 s, for the studied TPCT at FR = 30% is shown in Figure 10. In this figure, the process of boiling and bubble formation can be seen. When time passes, more energy is transferred to the liquid phase through the wall in the evaporator section, and more phase changes in the bubbles’ shapes are observed. The thermal resistance of the TPCT has been checked in the initial stages of the process and it has been determined that at FR = 30%, the system has the lowest thermal resistance.
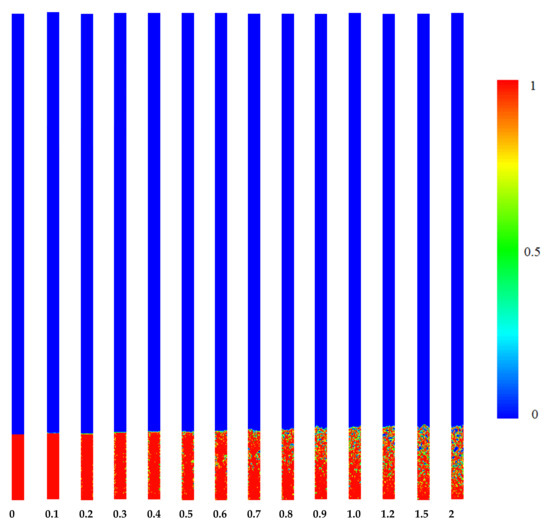
Figure 10.
Contours of volume fraction in entire parts of TPCT at different times for FR = 30%.
Figure 11 shows the liquid volume fraction and the static temperature distribution contours in a steady state for a filling ratio of 30%. From the moment that the process begins, the system is in a relative vacuum state. The thermal energy applied to the evaporator section of the TPCT leads to the evaporation of the working fluid, the fluid particles enter the vapor phase from the surface of the boiling pool, and the pressure of the system increases. The vapor phase is condensed on the condenser wall and a film of liquid is formed. As a result of gravity, the liquid film moves downward. With the passage of time, the pressure inside the TPCT increases and, accordingly, the temperature of the working fluid throughout the pipe is affected and changes. This change in the system’s temperature profile and mass contours continues until the system reaches its saturation state.
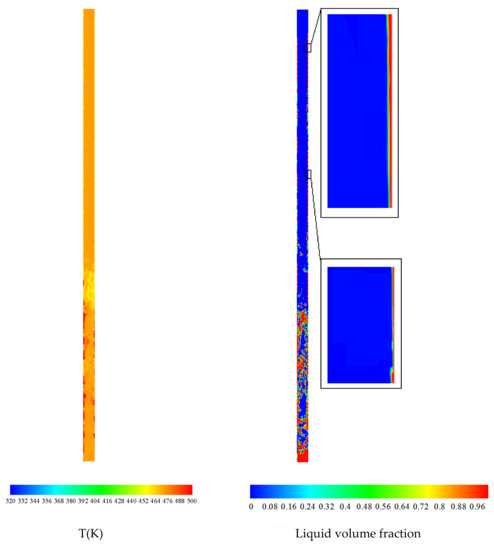
Figure 11.
Steady state (84 s) liquid volume fraction contours and the static temperature distribution for FR = 30%.
The simulation results show the behavior of both the rising hot vapor and the condensed liquid stream flowing down in the TPCT. Near the wall, the liquid and vapor phases collide, but the higher momentum phase keeps moving and pushes the other phase away from the wall. This flow characteristic causes the condensed liquid and vapor to move in an upward and downward flow, respectively. The average temperature of the inner wall of the TPCT in the evaporator, adiabatic, and condenser section was monitored systematically with the passage of time. After 84 s from the start of the process, no significant change was observed in these average temperatures, and it can be concluded that the system has reached its steady state. In other words, in a steady state, there is a balance between the evaporation and condensation processes. As much as the liquid evaporates, the same amount of vapor condenses, and this cycle repeats. As clearly shown in Figure 11, the oil as the working fluid approaches the temperature of the evaporator and condenser wall at the lower and upper sections of the TPCT, respectively. The efficiency of this thermosyphon, which is charged with oil, is approximately 96%. As a result of the high computational cost of the simulation, the simulation is conducted for the optimal filling ratio of the system (FR = 30%) until reaching the steady state of the system. For other filling ratios, it is enough to check the process and compare them up to limited seconds after the start of the process, as described in Figure 5, Figure 6, Figure 7, Figure 8 and Figure 9. It should be noted that obtaining the steady state results in TPCT requires approximately a month of time with our available high-speed computers.
The liquid film formation is directly dependent on the cooling rate; in other words, the amount of heat taken from the TPCT in the condenser section. As mentioned in Table 1, a constant temperature of 298 K has been applied as a boundary condition on the pipe wall in the condenser section. In the upper part of the tube, no liquid film appears to have formed, or liquid droplets have formed but have not appeared as a film layer. It seems that by increasing the cooling rate in the condenser part of the system, the formation rate of the liquid film layer in the upper part of the TPCT can also be intensified. As it is not possible to create a full vacuum using conventional vacuum pumps in heat pipes, in the industrial applications of heat pipes, some non-condensable gases, such as air, always remain in the upper part of the system, which can affect the liquid film generation in that part as well.
The wall temperature distribution along the thermosyphon at 0.1, 0.5, 1 and 2 s after the start of the process for a filling ratio of 30% is illustrated in Figure 12. It is evident that the temperature of the thermosyphon decreases from the evaporator to the condenser. The thermal resistance of the thermosyphon for the time of 0.1, 0.5, 1 and 2 s is obtained to be 0.59, 0.59, 0.58 and 0.58, respectively.
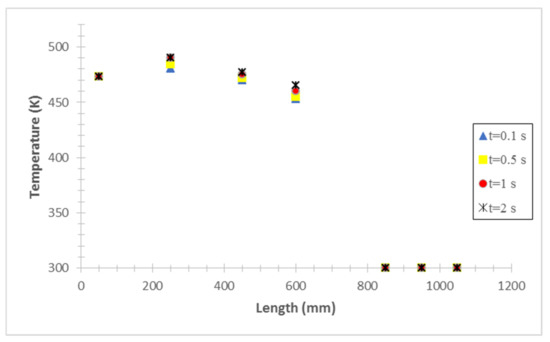
Figure 12.
Temperature distribution on TPCT for different times at FR = 30%.
Figure 13 shows the steady state temperature of different points on the TPCT wall when FR = 30%. According to this figure, the thermal resistance of the TPCT is calculated to be 0.54 W/K.
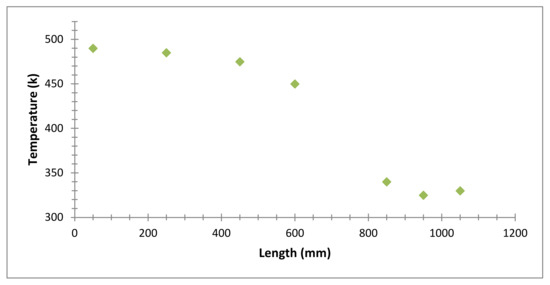
Figure 13.
Steady state temperature distribution on TPCT for FR = 30%.
4. Conclusions
A CFD analysis has been presented in this study to simulate the performance of a TPCT for moderate temperature, which can be used in steam power plants instead of Ljungstrom. After creating the computing network in the Gambit software, the thermosyphon is simulated in the Fluent software, using the VOF model. The validation is conducted with the available experimental data in the literature. Four different filling ratios of 30, 50, 70 and 90% are studied, and the contours of the boiling and evaporation process of each filling ratio are presented. The most important findings of this research can be expressed as follows:
The unique working fluid used in the system works well for the intended application and improves the efficiency of the system by up to 96%.
In this case, the thermal resistance of the system is 0.54 K/W.
By comparing the thermal efficiency and thermal resistance of the studied system for different filling ratios, we conclude that the 30% filling ratio shows the best performance.
The time required for the system to reach its steady state for a filling ratio of 30% is approximately 84 s.
At a filling ratio of 90%, more giant bubbles are formed in the evaporator section. Therefore, the thermal resistance of the TPCT is higher for this filling ratio compared to other investigated filling ratios. In other words, the system shows the lowest thermal efficiency at a filling ratio of 90%.
Author Contributions
Conceptualization, K.S.; Methodology, M.K.; Software, K.S.; Investigation, K.S. and M.K.; Writing—original draft, M.K.; Writing—review & editing, M.H.A. and M.Z.; Supervision, M.K. and M.H.A. All authors have read and agreed to the published version of the manuscript.
Funding
This research received no external funding.
Conflicts of Interest
The authors declare no conflict of interest.
Nomenclature
| Symbol | Description | Unit |
| cross section | ||
| specific heat | ||
| energy | ||
| force | ||
| shear force | ||
| gravity force | ||
| friction coefficient | - | |
| - | mass flux | |
| gravity acceleration | ||
| convective heat transfer coefficient | ||
| thermal conductivity | ||
| length | ||
| mass | ||
| pressure | Pa | |
| gas pressure on the interface | ||
| liquid pressure on the interface | ||
| heat transfer rate | ||
| volumetric flow rate | ||
| thermal resistance | ||
| mass generation term | ||
| energy generation term | ||
| temperature | ||
| time | ||
| phase velocity | ||
| local velocity | ||
| drift velocity | ||
| volume | ||
| velocity | ||
| mass flow rate | ||
| Greek letters | ||
| volume fraction | ||
| efficiency | ||
| dynamic viscosity | ||
| density | ||
| surface tension | ||
| stress | ||
| Subscripts | ||
| exp | experimental | |
| phase | ||
| gas | ||
| liquid | ||
| sat | saturation | |
| wall | ||
| Abbreviations | ||
| FR | Filling Ratio | |
| TPCT | Two Phase Closed Thermosyphon | |
| UDF | User Defined Function | |
| VOF | Volume Of Fluid |
References
- Zhao, X.; Zhu, Y.; Li, H. Micro-Channel Oscillating Heat Pipe Energy Conversion Approach of Battery Heat Dissipation Improvement: A Review. Energies 2022, 19, 7391. [Google Scholar] [CrossRef]
- Voigt, I.; Lutke, N.; Thusing, K.; Winkler, M.; Drossel, W. Development and Examination of an Internally Switchable Thermosiphon. Energies 2022, 15, 3891. [Google Scholar] [CrossRef]
- Eshghi, H.; Kahani, M.; Zamen, M. Cooling of Photovoltaic Panel Equipped with Single Circular Heat Pipe: An Experimental Study. Renew. Energy Res. Appl. 2022, 3, 229–235. [Google Scholar]
- Alhajjaji, A.; Chiasson, A.; Aljabr, A. Simulation-Based Analysis of a Novel CO2 Ground Source Heat Pipe (GSHP) to Reduce Temperature Fluctuations in Pavements in Different Climatic Conditions. Energies 2022, 15, 3343. [Google Scholar] [CrossRef]
- Rajski, K.; Sohani, A.; Jafari, S.; Danielewicz, J.; Sayegh, M. Energy Performance of a Novel Hybrid Air Conditioning System Built on Gravity-Assisted Heat Pipe-Based Indirect Evaporative Cooler. Energies 2022, 15, 2613. [Google Scholar] [CrossRef]
- Kahani, M.; Vatankhah, G. Thermal performance prediction of wickless heat pipe with Al2O3/water nanofluid using artificial neural network. Chem. Eng. Commun. 2019, 206, 509–523. [Google Scholar] [CrossRef]
- Noie, S.H.; Zeinali Heris, S.; Kahani, M.; Nowee, S.M. Heat transfer enhancement using Al2O3/water nanofluid in a two-phase closed thermosyphon. Int. J. Heat Fluid Flow 2009, 30, 700–705. [Google Scholar] [CrossRef]
- Gamboa, D.; Herrera, B. Influence of Turbulence, Density, Phase Change, and Phase Interfaces Models on the Performance of the Numerical Simulation of a Two-Phase Closed Thermosyphon. TecnoLógicas 2020, 23, 35–52. [Google Scholar] [CrossRef]
- Wang, H.; Walters, D.K.; Walters, K.B. The Effect of Model Parameters on CFD Simulation of a Thermosyphon. In Proceedings of the ASME-JSME-KSME 2019 8th Joint Fluids Engineering Conference, San Francisco, CA, USA, 28 July–1 August 2019. American Society of Mechanical Engineers Digital Collection. [Google Scholar]
- Wang, X.; Zhu, Y.; Wang, Y. Development of pressure-based phase change model for CFD modelling of heat pipes. Int. J. Heat Mass Transf. 2019, 145, 118763. [Google Scholar] [CrossRef]
- Alizadehdakhel, A.; Rahimi, M.; Alsairafi, A.A. CFD modeling of flow and heat transfer in a thermosyphon. Int. Commun. Heat Mass Transf. 2010, 37, 312–318. [Google Scholar] [CrossRef]
- Fadhl, B.; Wrobel, L.C.; Jouhara, H. Numerical modelling of the temperature distribution in a two-phase closed thermosyphon. Appl. Therm. Eng. 2013, 60, 122–131. [Google Scholar] [CrossRef]
- Fadhl, B.; Wrobel, L.C.; Jouhara, H. CFD modelling of a two-phase closed thermosyphon charged with R134a and R404a. Appl. Therm. Eng. 2015, 78, 482–490. [Google Scholar] [CrossRef]
- Kahani, M.; Zamen, M.; Rostami, B. Modeling and empirical study of TiO2/water nanofluid flows in a modified configuration with new layer arrangement of a photovoltaic/thermal system. Sustain. Energy Technol. Assess. 2022, 51, 101932. [Google Scholar] [CrossRef]
- Zamen, M.; Kahani, M.; Rostami, M.; Bargahi, M. Application of Al2O3/water nanofluid as the coolant in a new design of photovoltaic/thermal system: An experimental study. Energy Sci. Eng. 2022, 10, 4273–4285. [Google Scholar] [CrossRef]
- Asmaie, L.; Haghshenasfard, M.; Mehrabani-Zeinabad, A.; Nasr Esfahany, M. Thermal performance analysis of nanofluids in a thermosyphon heat pipe using CFD modeling. Heat Mass Transf. 2013, 49, 667–678. [Google Scholar] [CrossRef]
- Huminic, G.; Huminic, A. Numerical study on heat transfer characteristics of thermosyphon heat pipes using nanofluids. Energy Convers. Manag. 2013, 76, 393–399. [Google Scholar] [CrossRef]
- Temimy, A.A.B.; Abdulrasool, A.A. CFD Modelling for flow and heat transfer in a closed Thermosyphon charged with water—A new observation for the two-phase interaction. In IOP Conference Series: Materials Science and Engineering; IOP Publishing: Bristol, UK, 2019; p. 032053. [Google Scholar]
- Jouhara, H.; Fadhl, B.; Wrobel, L.C. Three-dimensional CFD simulation of geyser boiling in a two-phase closed thermosyphon. Int. J. Hydrog. Energy 2016, 41, 16463–16476. [Google Scholar] [CrossRef]
- Khazaee, I.; Hosseini, R.; Noie, S.H. Experimental investigation of effective parameters and correlation of geyser boiling in a two-phase closed thermosyphon. Appl. Therm. Eng. 2010, 30, 406–412. [Google Scholar] [CrossRef]
- Wang, X.; Wang, Y.; Chen, H.; Zhu, Y. A combined CFD/visualization investigation of heat transfer behaviors during geyser boiling in two-phase closed thermosyphon. Int. J. Heat Mass Transf. 2018, 121, 703–714. [Google Scholar] [CrossRef]
- Alammar, A.A.; Al-Dadah, R.K.; Mahmoud, S.M. Numerical investigation of effect of fill ratio and inclination angle on a thermosyphon heat pipe thermal performance. Appl. Therm. Eng. 2016, 108, 1055–1065. [Google Scholar] [CrossRef]
- Ahmed, I.S.; Al Jubori, A.M. Assessment of heat transfer and flow characteristics of a two-phase closed thermosiphon. Heat Transf. 2021, 50, 1351–1370. [Google Scholar] [CrossRef]
- Zhao, Z.; Zhang, Y.; Zhang, Y.; Zhou, Y.; Hu, H. Numerical Study on the Transient Thermal Performance of a Two-Phase Closed Thermosyphon. Energies 2018, 11, 1433. [Google Scholar] [CrossRef]
- Kafeel, K.; Turan, A. Simulation of the response of a thermosyphon under pulsed heat input conditions. Int. J. Therm. Sci. 2014, 80, 33–40. [Google Scholar] [CrossRef]
- Rizky, R.; Putra, N.; Irwansyah, R. CFD simulation of dry out behavior in two-phase closed thermosyphon. Int. J. Adv. Sci. Technol. 2020, 29, 3394–3401. [Google Scholar]
- Fertahi, S.; Bouhal, T.; Agrouaz, Y.; Kousksou, T.; El Rhafiki, T.; Zeraouli, Y. Performance optimization of a two-phase closed thermosyphon through CFD numerical simulations. Appl. Therm. Eng. 2018, 128, 551–563. [Google Scholar] [CrossRef]
- Qasim, M.S.; Freegah, B.; Ali, G.S. Numerical Analysis of the Thermal Performance in Traditional and Developed Shapes of Thermosyphon. In IOP Conference Series: Materials Science and Engineering; IOP Publishing: Bristol, UK, 2020; Volume 916, p. 012090. [Google Scholar]
- Freegah, B.; Asim, T.; Mishra, R. Computational Fluid Dynamics based Analysis of a Closed Thermo-Siphon Hot Water Solar System. In Proceedings of the 26th Condition Monitoring and Diagnostic Engineering Management International Congress 2013 (COMADEM 2013), Helsinki, Finland, 11–13 June 2013. [Google Scholar]
- Kahani, M. Simulation of nanofluid flow through rectangular microchannel by modified thermal dispersion mode. Heat Transfer Eng. 2019, 4, 377–392. [Google Scholar]
- De Schepper, S.C.; Heynderickx, G.J.; Marin, G.B. Modeling the evaporation of a hydrocarbon feedstock in the convection section of a steam cracker. Comput. Chem. Eng. 2009, 33, 122–132. [Google Scholar] [CrossRef]
- ANSYS FLUENT. Theory Guide (Release 13.0). Multiphase Flows; ANSYS, Inc.: Canonsburg, PA, USA, 2010; Chapter 17; pp. 455–568. [Google Scholar]
- Brackbill, J.U. A continuum method for modeling surface tension. J. Comput. Phys. 1992, 100, 335–354. [Google Scholar] [CrossRef]
Publisher’s Note: MDPI stays neutral with regard to jurisdictional claims in published maps and institutional affiliations. |
© 2022 by the authors. Licensee MDPI, Basel, Switzerland. This article is an open access article distributed under the terms and conditions of the Creative Commons Attribution (CC BY) license (https://creativecommons.org/licenses/by/4.0/).