Article

Electrified Process Heating in Textile Wet-Processing Industry: A Techno-Economic Analysis for China, Japan, and Taiwan

by
Ali Hasanbeigi
1 and
M. Jibran S. Zuberi
2,*
1
Global Efficiency Intelligence (GEI), 7901 4th St. N STE 4611, St. Petersburg, FL 33702, USA
2
Lawrence Berkeley National Laboratory (LBNL), 1 Cyclotron Rd., Berkeley, CA 94720, USA
*
Author to whom correspondence should be addressed.
Energies 2022, 15(23), 8939; https://doi.org/10.3390/en15238939
Submission received: 22 October 2022 / Revised: 16 November 2022 / Accepted: 23 November 2022 / Published: 25 November 2022

Abstract

:
The textile industry accounts for approximately 2% of global greenhouse gas emissions. There is a significant opportunity to decarbonize the textile industry by electrification of process heating where low- or zero-carbon electricity is used. Electrified process heating can be achieved through cross-cutting technologies without modifying the textile process equipment and/or through replacing the existing equipment with technologies that employ electromagnetic or resistance heating techniques for specific end-use applications. This paper aims to investigate the potential for electrification of process heating in the textile wet-processing industry in three of the top textile-producing and exporting regions in the world. To do this, two separate technology pathways, i.e., electrification through (a) industrial heat pumps and (b) textile end-use processes are developed and analyzed. The results show that the total potential final energy and CO2 savings due to electrification in both scenarios could be substantially large due to the lower energy intensity of the electrified heating systems. Moreover, the costs per unit of textile production are found to be lower in the case of industrial heat pumps compared to other systems. It is concluded that wide-scale electrification of process heating in the textile wet-processing industry will require major changes to the electricity system and individual sites, and the coordination efforts among different stakeholders to plan these changes must be intensified.

1. Introduction

The textile industry has undergone significant changes over the years. In the past, most textile production was based in developed countries and focused on providing goods for their domestic markets. However, the rise of global trade and the globalization of production has led to a shift in the textile industry. Today, textile production is increasingly occurring in developing countries, where labor and resource costs are lower [1]. This has allowed textile companies to remain competitive in the global marketplace. In addition, new technologies have also played a role in the evolution of the textile industry [2].
China is by far the world’s top textile exporter followed by the European Union (EU) and India, as shown in Figure 1. Japan and Taiwan, which are the other two economies included in our study, are also among the top 10 textile exporters. The ranking of top exporters is slightly different when only considering clothing export. China is also the top exporter of clothing followed by the EU, Vietnam, Bangladesh, and Turkey [3]. The textile industry has been growing rapidly in recent years, due to increasing demand from both developed and developing countries and world population growth. In particular, the rise of online or e-shopping has created a significant market for textile and apparel products [4]. However, the textile industry faces several challenges. One key challenge is to reduce its environmental and climate impact [5].
The textile industry accounts for around 2% of global anthropogenic greenhouse gas (GHG) emissions [6]. As the effects of climate change become more apparent and as the world’s population continues to grow and consume more textile products, the textile and apparel industry must take serious actions to reduce its impact on the climate and environment [
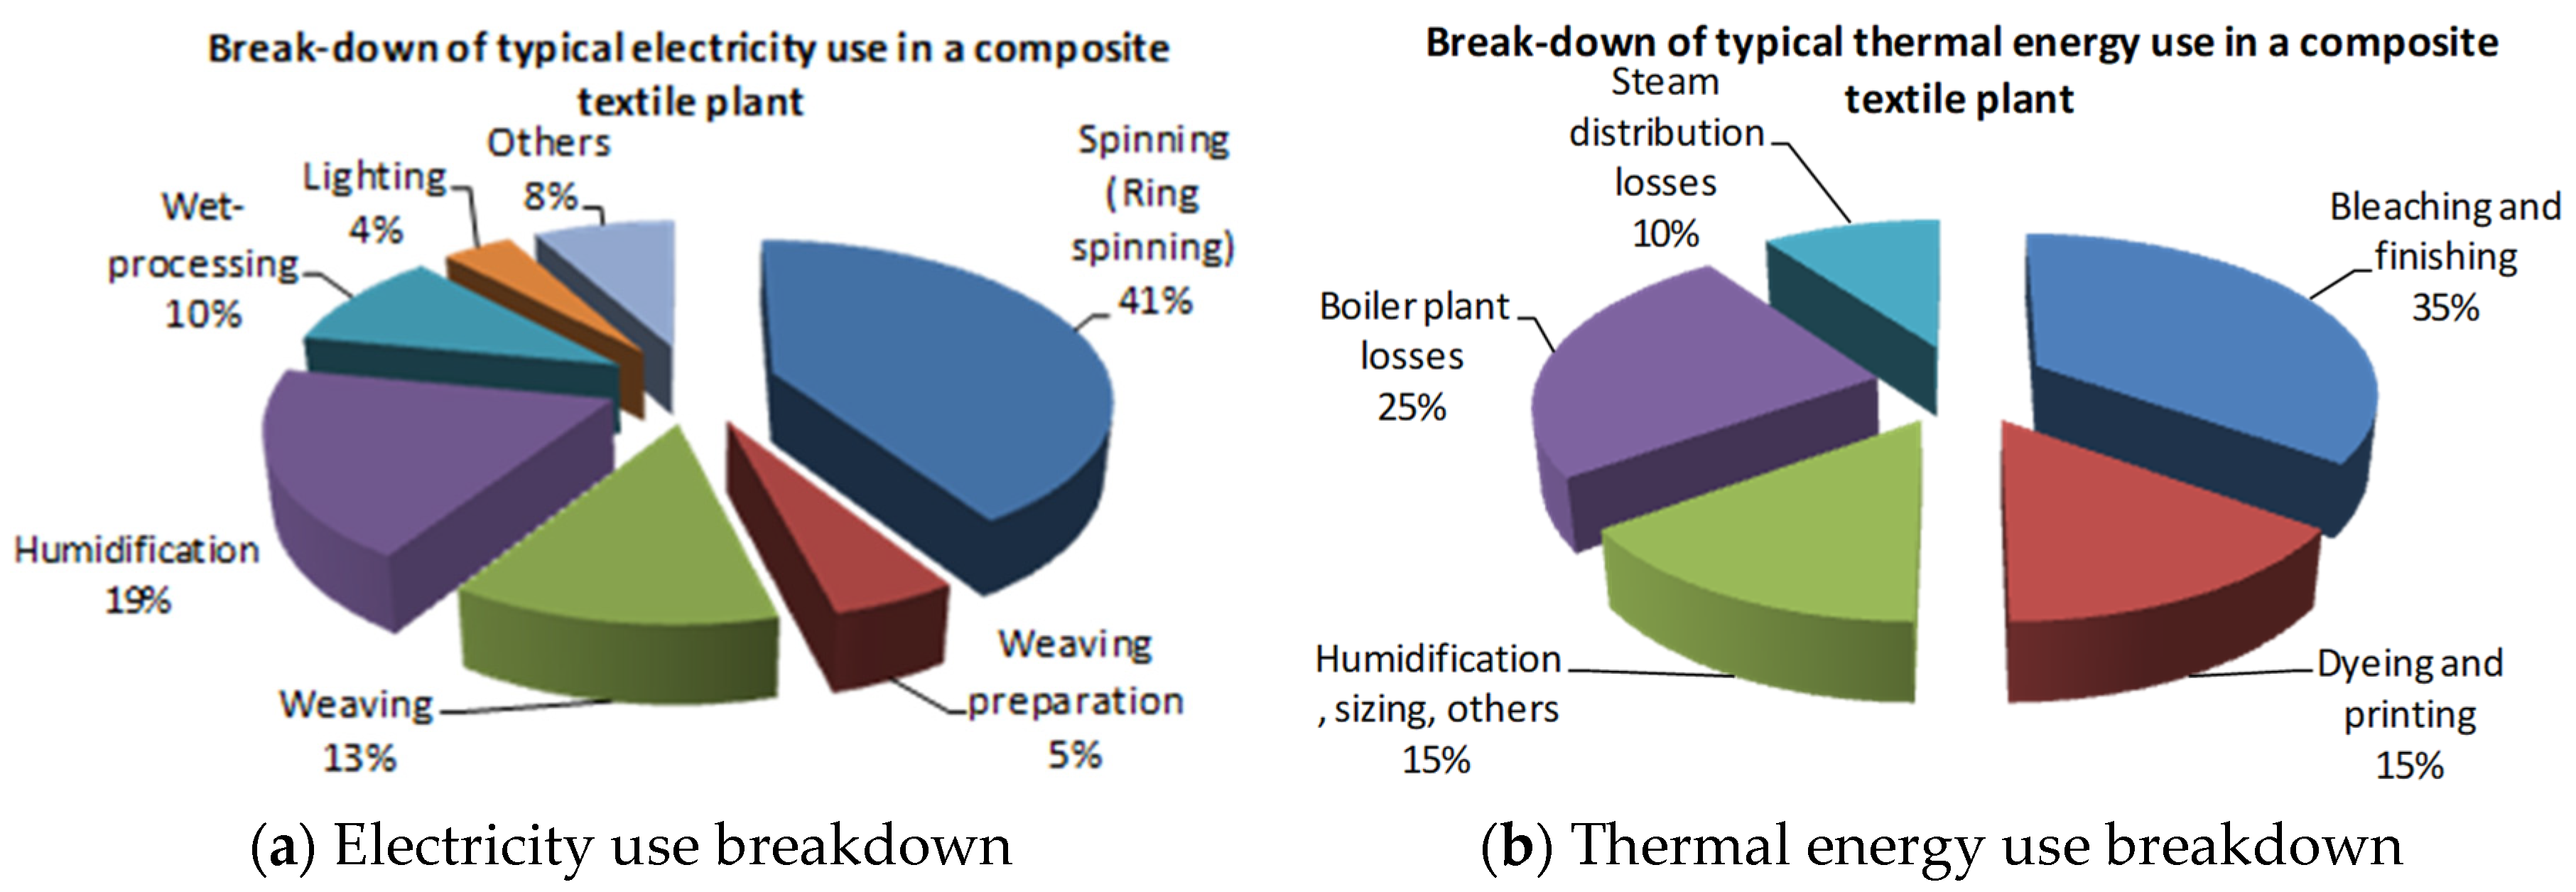
5]. There are several ways to reduce the textile industry’s climate impact, from using more environmentally friendly materials to deploying more efficient- and low-carbon manufacturing processes. Thermal energy needs especially for heating processes are a significant challenge for climate change mitigation efforts in the textile industry [7]. Process heating often represents over half of the total final energy demand in the textile industry (see later for details). Almost all of this heat is currently provided by fossil fuels in most countries including China, Japan, and Taiwan, the three major economies we have focused on in this article.
There is a significant opportunity to decarbonize the textile sector by shifting heat production away from carbon-intensive fossil fuels to clean sources such as electrification where low- or zero-carbon electricity is used. Electrified heat supply through electric boilers has been widely studied in the literature. Besides, industrial electrification through high-temperature heat pumps is an emerging research topic and there is limited literature on it, especially for the textile industry. Electromagnetic technologies including induction, infrared, microwave, etc. for process heating have been scarcely explored in the literature at the level of industrial sectors and processes. The authors of this paper have prior experience working on these topics which are summarized below along with other relevant studies from the literature.
Hasanbeigi et al. [8] studied a dedicated scenario for the electrification of combustion boilers. They concluded that electrification through electric boilers can initially increase the annual CO2 emissions in the base year, however, they are projected to be much lower in 2050 as a result of electricity grid decarbonization. Zuberi et al. [9] applied a bottom-up approach to investigate the techno-economic potentials of deploying electric boilers in different industrial sectors with a dedicated scenario for textiles. They also concluded that a higher grid emission factor than natural gas could initially lead to an increase in annual CO2 emissions in the base year. Given these conclusions and the limited environmental impact, Zuberi et al. [10] further investigated industrial heat pump (IHP) applications for electrified steam and hot water generation. They concluded that despite the current average electricity grid emission factor being higher than the emission factor of natural gas, electrified steam and hot water generation through IHP in the studied manufacturing processes can already decrease the annual CO2 emissions in the base year 2021. This is mainly because the high efficiencies of IHPs as compared to combustion and electric boilers dominate all other limiting factors. Kosmadakis [11] and Seck et al. [12] have also demonstrated that IHP applications possess significant energy and emissions reduction potentials in industry. However, none of the aforementioned studies have analyzed IHP applications in the textile industry. The type of processes and unit operations in different manufacturing sectors are diverse and dedicated analyses must be performed to investigate specific industrial applications.
Besides, many researchers have also been interested in exploring novel technologies to achieve high-quality, time-efficient, low energy consumption, and eco-friendly textile processing [13]. Electromagnetic heating is among the novel technologies that use wavelengths in the electromagnetic spectrum to process a wide range of products including textiles. As stated earlier, common examples are infrared, induction, microwaves, radio waves, and ultraviolet. Although different industries have used these techniques for specific applications for a long time now, their true potential has hardly been exploited especially for process heating [14]. The major benefit of employing electromagnetic technologies is that they generate heat within a target material with high efficiency ultimately cutting energy use by up to half or more. Ratti and Mujumdar [15] have demonstrated that infrared heating can be used in industry for surface drying or dehydration of thin sheets such as textiles. Elshemy and Haggag [13] evaluated the current status of microwave technology including specific heating applications in textile manufacturing and concluded that the technology could significantly reduce cost, energy, and time, and enhance the properties of different fabrics for different end uses. Despite few electromagnetic heating technologies available in the market for textile wet-processing (see later in the results section), not many studies in the literature have analyzed these technologies for studying sector-level final energy savings and CO2 emissions reduction potentials in the textile industry.
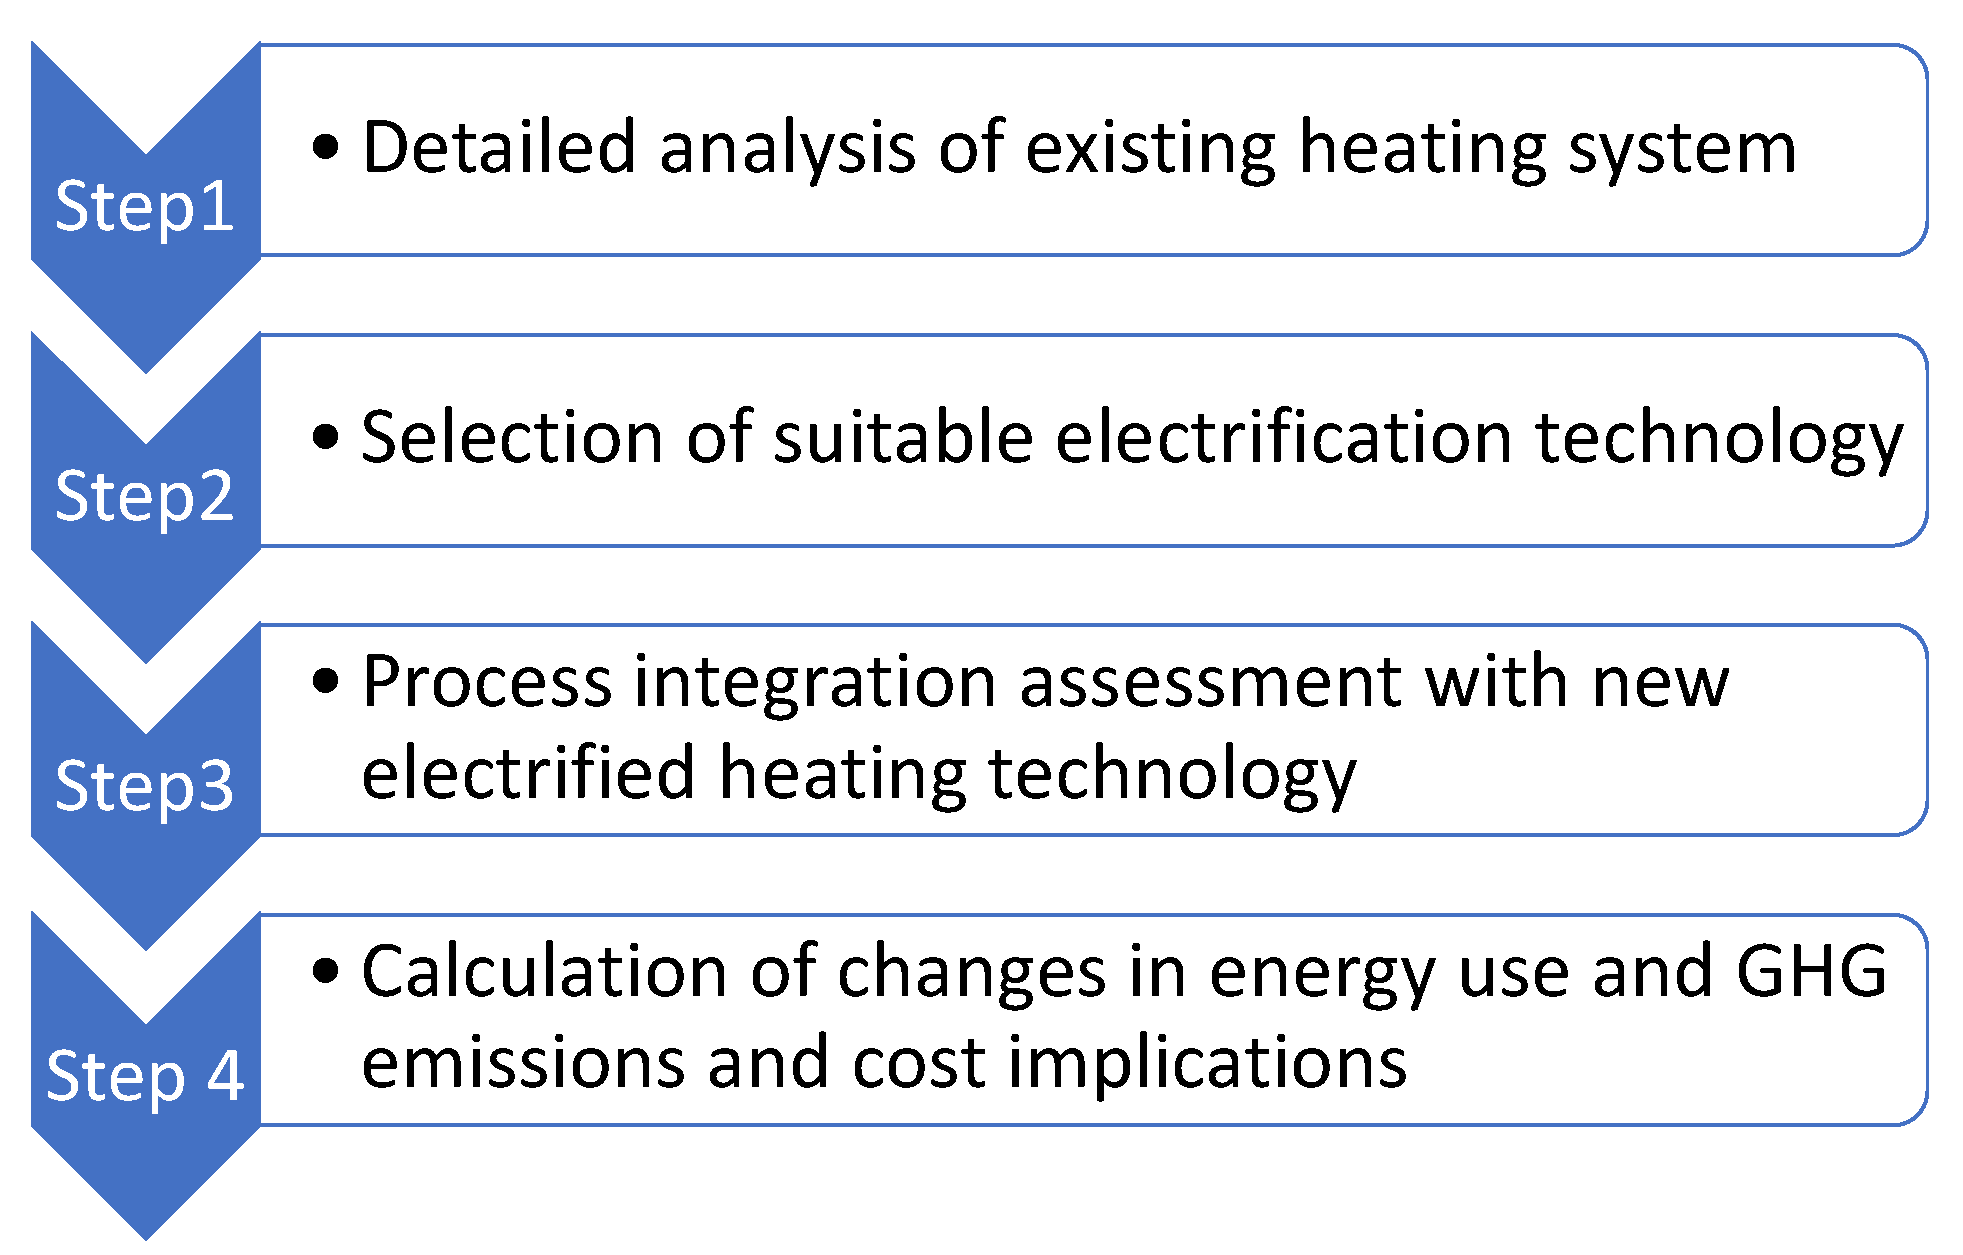
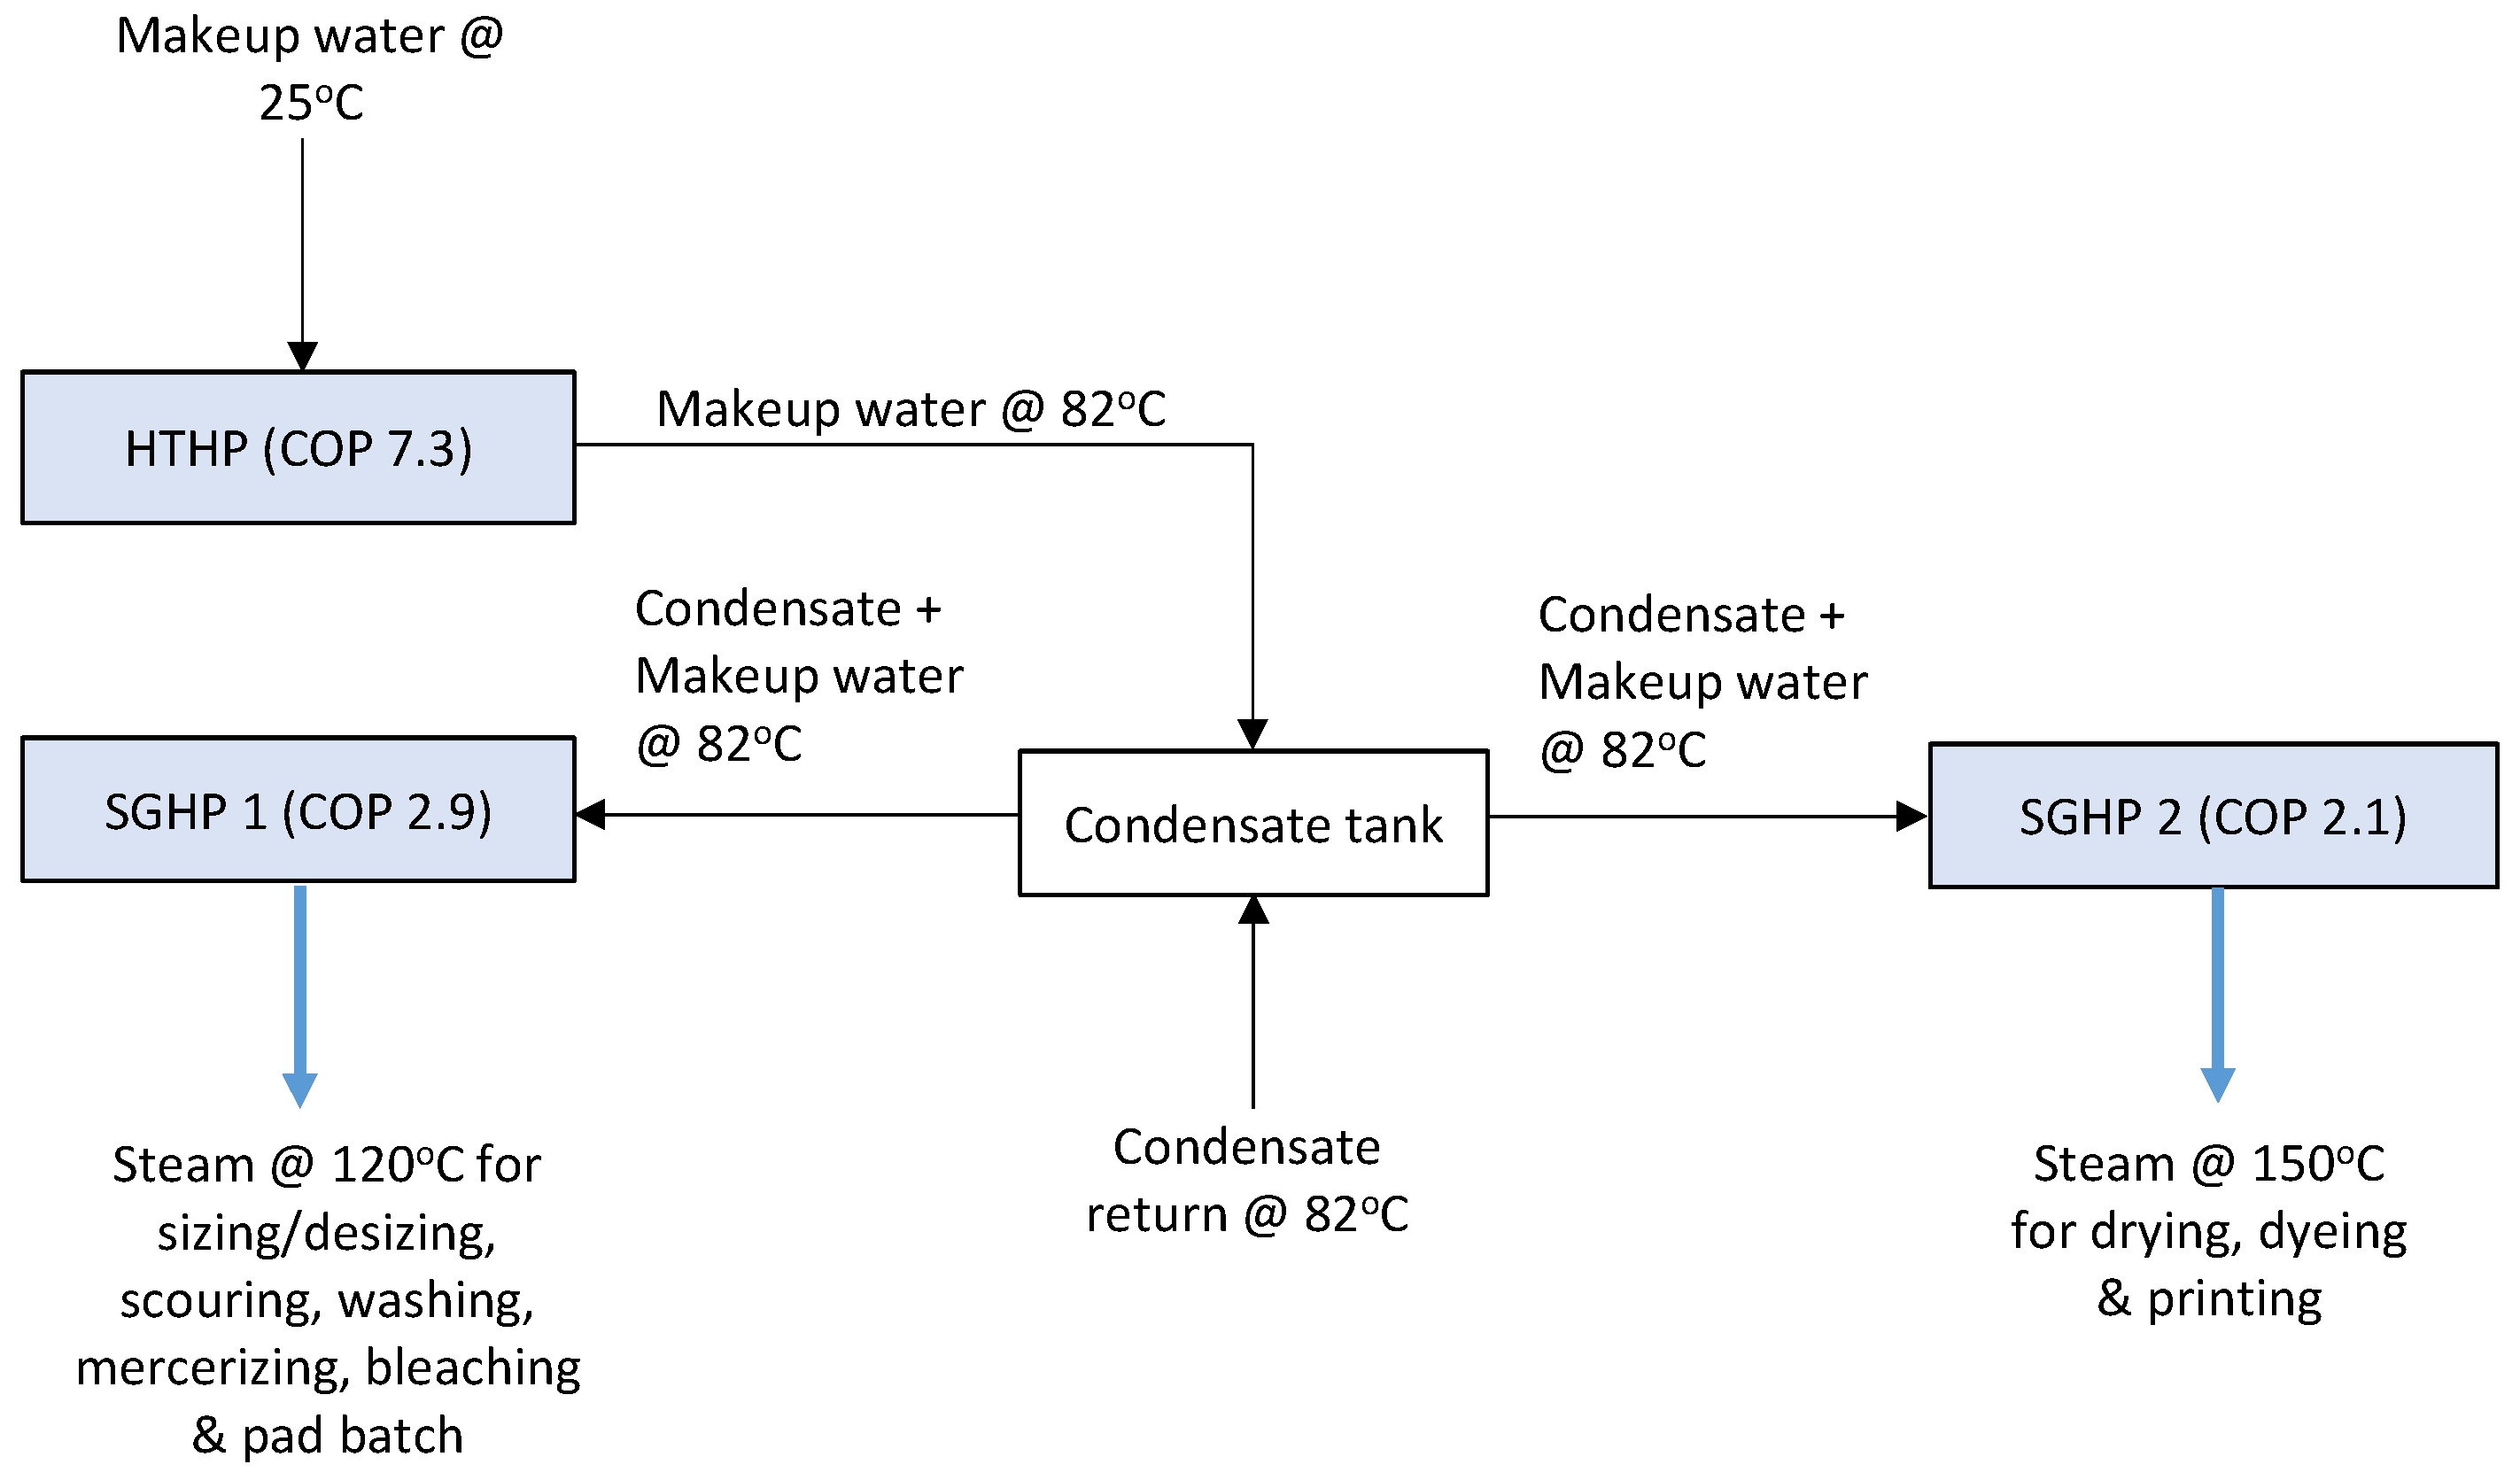
It is evident from the literature review that electrified process heating in the textile industry can be achieved through cross-cutting technologies like industrial heat pumps for steam and hot water generation without modifying the textile process equipment and/or through replacing the existing equipment with technologies that employ electromagnetic or resistance heating techniques for specific end-use applications such as infrared drying. This paper aims to fill the literature gaps by examining profiles of heat consumption in the textile wet-processing industry and the potential for electrification based on different heat demand profiles and electrification technologies available to meet those heating needs. More specifically, this paper is comprised of a bottom-up approach and technology-level techno-economic analysis for the electrification of the textile industry in China, Japan, and Taiwan. The technical assessment provides an analysis of the current state of energy use in the textile industry in these three economies, the technologies available, and the potential for electrification in this sector. Two technological pathways for the electrification of the textile wet-processing industry have been developed and analyzed. The pathways are (1) electrification through industrial heat pumps (cross-cutting technology pathway) and (2) electrification through textile end-use processes (process-specific technology pathway; only for seven major textile wet processes; see later for details). The energy costs per unit of production for each of the studied technologies have also been estimated. Finally, the impact of electrification of the textile industry on the electricity grid has been discussed.

2. Materials and Methods

2.1. Profiles of Energy Use in the Textile Industry

In China, the textile and apparel industry consumed around 1500 petajoules (PJ) of energy in 2019 as shown in Figure 2a [16]. This energy use resulted in total energy-related CO2 emissions in the Chinese textile industry of around 183 Mt CO2 in 2019. Around 51% of the total energy used in the Chinese textile industry is electricity. The rest is different types of fuels that are used in thermal processes to deliver heat mainly in textile wet-processing (see Figure 2a). According to the statistics provided by International Energy Agency (IEA), the share of coal in the total direct fuel used in the Chinese textile industry is smaller than natural gas. There is a large category, referred to as “other fuels”, which is mainly the heat purchased by textile plants from other facilities.
In Japan, the textile industry consumed around 33 PJ of energy in 2019 [16] (see Figure 2b). In the Japanese textile industry, electricity has a smaller share, i.e., 42% in the total energy mix as opposed to 51% in the Chinese textile industry. The reason for this difference could be the large fabric manufacturing in China which does not necessarily undergo wet processing but is instead exported. Among the fossil fuels used, natural gas has the highest share, i.e., 33% of the total energy mix (Figure 2b). The total energy-related CO2 emissions in the Japanese textile industry were around 3.1 Mt CO2 in 2019.
The Taiwanese textile industry consumed around 46 PJ of energy in 2019 [16] (see Figure 2c). Electricity accounted for 47% of the total energy mix of the country’s textile industry. Among the fossil fuels used, coal has the highest share, i.e., 24% of the total energy mix followed by natural gas (refer to Figure 2c). The total energy-related CO2 emissions in the textile industry in Taiwan were around 5.2 Mt CO2 in 2019.

2.2. Breakdown of Energy Demand in a Textile Plant

A composite textile plant has spinning, weaving and/or knitting, and wet processing that includes preparation, dyeing and/or printing, and finishing, all on the same manufacturing site. Figure 3 presents the breakdown of the typical electricity and thermal energy demand in a composite textile plant [17]. As shown in the figure, spinning demands the greatest share of electricity (41%) followed by weaving (weaving preparation and weaving; 18%). Wet-processing preparation (de-sizing, bleaching, etc.), dyeing and printing, and finishing together demand the greatest share of thermal energy (50%). Moreover, a significant volume of thermal energy is lost during steam generation and distribution (35%). Most of the steam produced is used in textile wet processing. Therefore, electrification of heat supply and heating in wet processing has a large potential for reducing fossil fuel use and reducing GHG emissions in the textile industry.

2.3. Methodology and Electrification Technologies Scenarios

2.3.1. Methodology for Industrial Heat Pump Analysis

Heat pumps are designed to transfer thermal energy opposite to the direction of natural heat flow by absorbing heat from a cold reservoir (heat source) and discharging it to a hot one (heat sink) [18]. The external energy (work; Win) required to drive a heat pump depends on how much the temperature of the low-quality heat is to be raised. Heat pumps employ refrigerants as transitional fluids to absorb heat and vaporize in an evaporator. Refrigerants have low boiling points and evaporate even at sub-zero temperatures. Despite the evaporation, the refrigerant is not hot enough to warm the process fluid. Hence, a compressor is used to raise the temperature and pressure of the refrigerant through volume reduction and forces the high-temperature and pressure gas to a condenser. The absorbed heat is released (Qout) where the refrigerant condenses in a condenser. Finally, the temperature and pressure of the refrigerant are further reduced after passing through an expansion valve [10].
Heat pumps are very efficient because they only transfer heat, instead of burning fuels to generate it. The performance of a heat pump is expressed as the coefficient of performance (COP) which is the ratio of thermal energy output to external energy input, refer to Equation (1).
C O P r e a l   = ( Q o u t W i n )
Based on the ideal Carnot cycle, heat pumps operate between two heat reservoirs in the heating mode, having absolute temperatures, i.e., Tsource (heat source) and Tsink (heat sink). The maximum theoretical COP can be calculated by Equation (2). Temperature lift (∆Tlift) is the difference between the heat source and sink temperatures. Due to the losses in thermodynamic processes, the real COP of a heat pump is lower than the maximum theoretical COP [10]. An efficiency term, also called second law efficiency (ɳHP), that relates the real COP (COPreal) to the maximum theoretical COP (COPcarnot) is given by Equation (3). The second law efficiency (ɳHP) typically ranges between 40% and 60% [19]. We are assuming a conservative value of 45% for our analysis. The COP of a heat pump is always greater than one as it transfers more heat than the electricity used.
C O P c a r n o t   = ( T s i n k T s i n k T s o u r c e ) = ( T s i n k Δ T l i f t )
Δ H P   = ( C O P r e a l   C O P c a r n o t )
The higher the temperature lift of a heat pump, the lower its COP and the higher its investment and operational costs [20]. Hence, it is essential to assess the available waste heat sources that can potentially be utilized for optimal heat pump integration into a process. The amount of waste heat resources existing in a textile plant is site-specific and the level of heat pump integration depends on several variables including waste heat volumes, temperature levels, and plant complexity, to name a few. Based on our analysis of the data collected for 40 textile mills in China, Taiwan, and Japan (see next discussion for details), we assumed that enough waste heat would be available at 60 °C to be utilized by heat pumps for textile manufacturing. However, the proposed heat pump designs in this study may not necessarily be optimal for all relevant textile plants given the site-specific characteristics (pinch analysis would be needed for optimal heat pump integration at a plant level). Furthermore, the ranges of industrial heat pump (IHP) capacities and sink temperatures have significantly progressed over the years. Industrial heat pumps with capacities as high as 100 megawatts (MW) and heat sink temperatures of up to 165 °C are now commercially available at scale [21].
We collected information on energy intensities and temperature levels of 40 textile wet-processing plants, disaggregated by direct and indirect fuel and electricity demand in each process step. The data gaps were filled by using the information given by [17] and relevant experts. Based on the country-specific information on wet processes employed in the textile industry, energy intensities and temperature levels are generalized for China, Japan, and Taiwan. The process heat demand at temperatures suitable for industrial heat pump applications was identified in the final step. Table 1 provides the typical process-specific heat intensities and temperatures suitable for IHP applications, partly based on [17].

2.3.2. Methodology for Analyzing Electrification of Different Textile Processes

As mentioned earlier, wet processing accounts for the largest share of fuel used in the textile industry. Wet processing includes several steps that involve adding colors to fiber, yarn, or fabric or imparting patterns to the fabric, along with a variety of finishing steps that deliver certain characteristics to the desired end product. These finishing steps are important mainly in synthetic and cotton textile manufacturing. For most woolen products and some man-made and cotton products, the yarn is dyed before weaving and the pattern is woven on the fabric. As an example, Figure 4 shows a schematic of typical woven fabric wet-processing operations.
The seven textile wet processes that are included in our electrification analysis are as follows and explained in more detail in the following subsections.
  • Singeing;
  • Mercerizing and Washing;
  • Dyeing;
  • Drying;
  • Heat Setting (Stenter);
  • Finishing (pad-dry-cure);
  • Yarn Drying.
The process-specific electrification analysis focuses on electrifying the heating system at the end-use technologies or machines, as opposed to electrifying combustion boilers through industrial heat pumps. In most textile processes, steam is employed as an energy/heat carrier, and steam itself is not required in the process. Therefore, instead of using steam, a plant can consider implementing end-use electrification technologies (such as the ones described in the results section) to provide process heat. The electrification of end-use processes has the benefit of increasing efficiency by removing energy losses during steam generation and distribution.
To perform the bottom-up technology-level electrification analysis for each textile wet-processing, this paper follows four steps as shown in Figure 5. The existing heating systems that are used in the conventional processes are analyzed, including the heat demand and temperature profiles. Next, suitable electrification technologies are identified that can provide the same heat and function for each thermal application. Almost all of the electrification technologies identified and assigned to wet processes in this study are commercially available. Given the energy intensity of technologies for conventional and electrified processes, the energy use, CO2 emissions, and energy cost implications of electrification in each process can then be calculated.
It must also be noted that the studied electrification technologies for each process or system may not be the only electrification options. Other electrified heating technologies might be available on the market and applicable to the processes analyzed. Additionally, other processes within the textile industry might have electrification potential but are not considered in this study. In short, the energy savings and CO2 reduction potentials as shown in this paper are only a portion of the total savings potential that can be achieved by full electrification of the textile industry. Hence, the results of this analysis are not directly comparable with the industrial heat pump analysis.

2.4. Techno-Economic Analysis

Potential final energy savings (ES) due to the electrification of heat demand in the industrial processes can be estimated by Equation (4). Final energy savings are estimated as the difference between heat demand by current processes and potential electricity demand by an electrified technology for the same energy service. Similarly, potential CO2 abatement (CA) due to electrification and simultaneous decarbonization of the electricity grid can be determined by Equation (5).
E S = Q o u t E i n ,
where;
Qout = Current heat demand at a certain temperature by a process step
Ein = Electricity demand by an electrified technology for the same energy service
C A = ( Q o u t   × f w ) ( E i n × f g r i d ) ,
where;
fw = Weighted average fuel emission factor, see Table 2
fgrid = National average electricity grid emission factor, see Table 3
Table 2. Weighted average fuel CO2 emission factors for the textile industry (kg CO2/GJ) (calculated based on [16]).
Country2021203020402050
China69676562
Japan63636363
Taiwan80787572
The energy savings and change in CO2 emissions estimated for each process (see Section 3) are the total technical potentials assuming a 100% adoption rate. However, the actual adoption of electrification technologies in industry will be gradual over time. Furthermore, the potential change in energy use is presented in terms of final energy, which means electricity is not converted to primary energy using average electricity generation efficiency and transmission and distribution losses.
The cost analysis in this study only focuses on energy cost per unit of production (finished fabric) and does not include capital cost and other costs associated with conventional and electrified technologies. The specific energy costs (CE) under the base case scenario (i.e., assuming no carbon price) are calculated using Equation (6). We used 2021 as the starting year and made relevant projections up to 2050 in this analysis. This study also estimates the costs in a scenario where there is a price in place for CO2 emissions (see Table 4).
C E = ( Q o u t × P f ) ( E i n × P e ) P D ,
where;
Pf = Weighted average (Wt. avg.) fuel price for industry, see Table 5
Pe = Electricity price for industry, see Table 5
PD = Annual production of finished fabrics
Table 4. The assumed carbon price in this study (2021 USD/t CO2).
Country2021203020402050
China9304555
Japan43775113
Taiwan0304555
Table 5. Energy prices for industry (2021 US dollars per kilowatt hours—USD/kWh).
ChinaJapanTaiwan
202120302040205020212030204020502021203020402050
Wt. avg. fuel price0.030.020.040.050.090.060.090.100.040.040.050.060
Electricity price0.100.100.100.100.170.170.180.180.090.090.090.09
Note: Energy prices in 2021 are obtained from various sources and supplemented by the data provided by several textile plants in China, Japan, and Taiwan.
It should be noted that the production of finished textiles in China (26 Mt), Japan (0.57 Mt), and Taiwan (0.60 Mt) is projected to be at the same level until 2050 (base year production levels are assumed partly based on [22]). Finally, the results of costs per unit of production are highly sensitive to the unit price of energy (i.e., fossil fuels and electricity). The energy prices projections are uncertain. In addition, renewable electricity prices could decrease more substantially than what this paper has assumed up to 2050, making electrification technologies more competitive. To address such a scenario, this paper has included a sensitivity analysis concerning the unit price of electricity in the form of error bars on the graphs presenting costs. The error bars show the energy cost per unit of production when the price per unit of electricity is reduced by up to 50%.

3. Results

3.1. Electrifying the Textile Industry through Industrial Heat Pumps

The schematic of industrial heat pump (IHP) applications and their corresponding COPs is shown in Figure 6. A high-temperature heat pump (HTHP) can be installed to preheat the makeup feed water to 82 °C before it enters the condensate tank for steam generation. The total required heating capacities of HTHPs for the textile wet-processing industry in China, Taiwan, and Japan are estimated at 152 MW, 4.6 MW, and 3.4 MW, respectively. This is a relatively low heat capacity demand compared to steam-generating heat pumps (SGHP; see later for details) because HTHP is used only to preheat make-up feed water from 25 °C to 82 °C. A larger heat demand is needed for SGHP as shown below.
Moreover, most of the processes in Table 1 require hot water at various temperatures which can be supplied by HTHPs directly. However, textile process equipment often has different water retention rates and times of operation. For example, a washing machine may have multiple sections needing hot water in different timeframes and at different temperatures. This may require several small-scale HTHPs only for the washing machine which is techno-economically not feasible. Hence, the process heat to relevant unit operations is provided as steam which can be generated by the steam-generating heat pumps (SGHPs).
Two separate SGHPs can be installed to produce process steam: (1) at 120 °C for de-sizing, scouring, mercerizing, washing, bleaching, and finishing (pad-dry-cure), and (2) at 150 °C for steam drying, dyeing, and printing. The total required heating capacities of SGHPs in China, Taiwan, and Japan are estimated at 12 gigawatts (GW), 0.32 GW, and 0.31 GW, respectively. It should be noted that the utilization of heat sources possibly available at a temperature higher than 60 °C (as assumed in this study) may result in a COP higher than currently estimated and consequently the lower electricity demand by the studied industrial heat pumps.
The change in annual final energy demand due to IHP applications for textile wet-processing in the three economies in different timeframes is shown in Figure 7, Figure 8 and Figure 9. The figures conclude that IHP applications can substantially decrease the total annual final energy demand. More precisely, it is estimated that nearly 270, 7, and 7.3 PJ of the annual final energy can be saved for textile wet-processing in China, Japan, and Taiwan, respectively. The substantial reduction in annual final energy demand is due to the increase in the efficiency (measured in terms of COPs of the heat pumps) for hot water and steam generation.
The annual final energy demand in the textile wet-processing industry shown in Figure 7, Figure 8 and Figure 9 for each economy remain at the same level because we assumed the finished fabric production will remain the same during 2021–2050, and we did not assume any incremental improvement in the efficiency of boilers or heat pumps in the future compared with the base year. It is less likely that the efficiency of conventional boilers will have any substantial improvement in the future since conventional boilers are matured technologies. However, likely, the efficiency of IHP will substantially improve in the future up to 2050 since they are emerging technologies and have room for improvement. Given the uncertainty and lack of data on the overall rate of improvement of efficiency of IHP in the future, we made a conservative assumption in this analysis and assumed the efficiency will remain at the 2021 level in the future.
The change in annual CO2 emissions from the textile wet-processing industry due to industrial heat pump applications in different years is presented in Figure 10, Figure 11 and Figure 12. The figures show up to 12, 0.4, and 0.5 Mt CO2 per year emissions reduction potential in 2030 for textile wet-processing in China, Japan, and Taiwan, respectively. This is despite the increase in electricity demand from IHPs. The CO2 reduction potential further increases to 25, 0.7, and 0.8 Mt CO2 per year in 2050, in China, Japan, and Taiwan, respectively, due to the projected rate of electricity grid decarbonization between now and 2050 in these economies (it is assumed that the electricity grid will be carbon neutral in 2050 in all three economies).
The transition from conventional boilers to industrial heat pumps in the textile industry will have a cost implication. We estimated the energy costs per unit of production (USD per tonne of finished fabric) for the textile wet-processing industry in each economy (Figure 13, Figure 14 and Figure 15). As can be seen, in all three economies, switching from combustion boilers to IHPs will result in lower energy costs per tonne of finished fabric produced even in the base year, even though the electricity prices in all three economies are substantially higher than fossil fuel prices per unit of energy (kWh). This lower energy cost per unit of production by IHPs is primarily because heat pumps have high efficiency (as explained earlier) and will result in substantial overall energy savings (see Figure 7, Figure 8 and Figure 9).

3.2. Electrifying the Textile Industry through the Electrification of End-Use Wet Processes

3.2.1. Electrification of the Dyeing Process

Dyeing is the application of color to the textile material with some degree of colorfastness. Textiles can be dyed using batch and continuous processes and dyeing may take place at any of several stages in the production process (i.e., before fiber extrusion, while the fiber is in staple form, to yarn, to fabrics, and garments). Various types of dyeing machines are employed for both batch and continuous processes and every machine or dyeing system has different characteristics in terms of versatility, the tension of the fabric, costs, use of carriers, weight limitations, etc. Dyeing systems can be aqueous, non-aqueous (inorganic solvents), or use sublimation. Hydrophilic fibers such as cotton, wool, rayon, and silk, are usually easier to dye as compared to hydrophobic fibers such as polyesters, polyamides, acetates, and polyacrylonitrile. Dyeing is an energy-intensive process since it requires heat which is provided by steam which is usually generated in combustion boilers [17,23].
Electric fabric dyeing machines can be an alternative to conventional dyeing machines. In the electrified dyeing machine, the heat is provided by electric heating systems such as electric resistance heating. There is no heat loss through exhaust gases in the electrified process and temperature control is done better. Additionally, there are no losses in the electrified process related to the steam generation and distribution systems. Therefore, in this study, the energy intensity of the electric dyeing process is assumed to be around 30% lower than that of the conventional process. Table 6 shows the estimated CO2 intensity of the conventional and electrified dyeing process in the textile industry in each economy.
Electrifying the dyeing process can result in large final energy savings. In China, Japan, and Taiwan, annual energy savings of 33,000, 780, and 730 TJ per year can be achieved in 2050 (Figure 16). This is because electrified dyeing is more efficient than the conventional process, resulting in less energy consumption.
Electrification of the dyeing process in China could result in an increase in annual CO2 emissions in the short term if highly carbon-intensive grid electricity is used (Figure 17). The electrification of the dyeing process could lead to a decrease in CO2 emissions in Japan and Taiwan in 2030. Between 2030 and 2050, there will be a substantial reduction in CO2 emissions as a result of the decline in the electricity grid’s CO2 emissions factor and energy efficiency improvements. In 2050, the annual reduction of CO2 emissions after electrification of the dyeing process will be around 4900, 115, and 125 kt CO2 per year in China, Japan, and Taiwan, respectively.
The energy cost per unit of production (in 2021 USD/tonne of fabric processed) varies across the three economies for the conventional and electrified dyeing process (Figure 18, Figure 19 and Figure 20). The energy cost for the electrified dyeing process is substantially higher than that for the conventional process in 2030. However, as the price of fossil fuels increases over time and considering the carbon price, the energy cost for the electrified process can be lower than that of the conventional process in 2050. The error bars on the graph show that the energy cost per unit of production for the electrified process can be lower than the conventional process even earlier when a lower price of electricity is used.
It should be noted that the trends for energy savings, CO2 abatement, and associated costs are found to be similar for all electrified end-use applications in Section 3.2 with a few exceptions (see the following sub-sections for details). Hence, for better readability and conciseness of this paper, similar plots as in Figure 16, Figure 17, Figure 18, Figure 19 and Figure 20 are not developed for the remaining textile wet processes studied in this paper. Instead, the same results for China, Japan, and Taiwan are summarized in Table 7, Table 8 and Table 9.

3.2.2. Electrification of Singeing Process

Fabrics from the weaving and knitting section contain some loose fibers protruding or struck out from the surface. Singeing removes those loose hairy fibers by burning them off. This is typically the first process in the wet-processing unit. The objective is to generate an even or smooth surface without a fuzzy appearance, which will not tend to pill. Singeing of fabric can be achieved in various arrangements. Plate singeing machines use heated plates while roller singeing machines use rotating cylinders. The most commonly used gas singeing machines uses gas burners. This operation also helps to achieve uniform dyeing afterward [24,25,26]. Conventional singeing machines use heat from fuel combustion to remove fluff. However, this heat can also be provided through electrical energy.
Electric cylinder singeing machines use high-temperature industrial electrical heating elements (such as silicon carbide rods) as heating sources. Silicon carbide heating rods are high-temperature non-metal electrical heating elements that have many advantages over other metal elements, such as a high working temperature, oxidation resistance, longer life, and corrosion resistance [27,28]. The electrical singeing machine is equipped with a heat preservation box under the cylinder to keep the temperature of the cylinder body at a set process temperature for a long-time during work. This results in final energy savings. Since in these electric singeing machines there is no wasted heat through exhaust gases and the heat distribution is balanced and controlled, in this study, around 30% saving in total final energy consumption is assumed compared to conventional singeing machines. Some of the advantages of an electrical singeing machine over the conventional ones are lower energy consumption, higher surface temperature, smaller temperature difference, higher singeing grade, no local air pollution, etc. Table 10 shows the estimated CO2 intensity of the conventional and electrified singeing process in the textile industry in each economy.
Table 7 shows that electrifying the singeing process results in substantial annual final energy savings between 2030 and 2050. Electrification could lead to annual energy savings of about 17,000, 300, and 500 terajoules (TJ) per year for China, Japan, and Taiwan, respectively in 2050. This annual energy savings potential results from the higher efficiency (lower energy intensity) of electrified singeing compared with the conventional singeing process.
In 2030, there is still a slight increase in CO2 emissions after the electrification of singeing process in China if the grid electricity is used, but the electrification of singeing process could result in a reduction in CO2 emissions in Japan and Taiwan in 2030 (Table 8). There is a substantial reduction in CO2 emissions in all three economies in 2040 and 2050 which is the result of a decline in the electricity grid’s CO2 emissions factor (grid decarbonization), and energy efficiency improvement between 2021 and 2050. The annual reduction of CO2 emission after the electrification of singeing process in 2050 is around 2600, 47, and 120, kt CO2 per year in China, Japan, and Taiwan, respectively.
Table 9 shows the energy cost per unit of production (in 2021 USD/tonne fabric processed) in China, Japan, and Taiwan for the conventional singeing and electrified singeing processes from 2030 to 2050. The energy cost for the electrified singeing process is substantially higher than that for the conventional process in 2030. However, as the price of fossil fuels increases over time and considering the carbon price (see the methodology section for more details) the energy cost for the electrified process can be lower than that of the conventional process in 2050. In addition, the energy cost per unit of production for the electrified process can be competitive with the conventional process even in 2030 when a lower unit price of electricity is used in the analysis.

3.2.3. Electrification of Mercerizing and Washing Processes

Mercerization is a chemical treatment performed over fabrics or cotton fibers to improve their dyeing properties, tensile strength, absorbency, and luster. The treatment is applied by immersing the fiber or yarn in a sodium hydroxide solution for short periods (typically less than 4–5 min) and then treating it with acidic water to neutralize the sodium hydroxide. If the material is held under tension during this step, it will be less likely to shrink. Higher-quality cotton goods are usually mercerized because mercerized cloths take brighter, longer-lasting colors from less dye [17,25,29]. In the mercerizing and washing processes, steam coils are usually used to supply the required heat. In an electrified process, instead of steam coils, direct heating electric resistance elements can be used.
Washing is needed after the chemical treatment. Technologies such as ultrasonic washing machines are an emerging electrified alternative. They can replace several baths of traditional high-temperature systems. These washing machines use ultrasound to clean the fabric, which reduces water and energy consumption as well as the use of chemicals [30]. Further research and development are still needed to make these machines more commercially available. If electrical processes (resistive elements or ultrasonic systems) are used, the usual losses related to the steam generation and distribution systems will be eliminated. Therefore, in this study, it is assumed that electrical processes consume at least 30% less energy. Table 11 shows the estimated CO2 intensity of the conventional and electrified mercerizing and washing process in the textile industry in each economy.
The electrification of the mercerizing and washing processes could save a large amount of energy each year (Table 7). This is because the electrified process is more efficient than the conventional process. In 2050, China, Japan, and Taiwan could save 15,000, 340, and 330 TJ per year, respectively from the electrification of mercerizing and washing processes.
The electrification of the mercerizing and washing processes in the textile industry can result in a significant reduction in CO2 emissions in the future years as the electricity grid decarbonizes in these three economies (Table 8). In 2030, there is still a slight increase in CO2 emissions after the electrification of these processes in China, but by 2040 and 2050, there is a substantial reduction in emissions due to grid decarbonization and energy efficiency improvements. This could lead to an annual reduction of CO2 emissions of around 2200, 52, and 57 kt CO2 per year in China, Japan, and Taiwan, respectively in 2050.
As presented in Table 9, the energy cost for the electrified mercerizing and washing processes is substantially higher than that for the conventional process in 2030. However, the electrified process in the textile industry can be less expensive than the traditional process in the long term. This is due to the increasing price of fossil fuels and the carbon price, which make the energy cost for the electrified process less expensive.

3.2.4. Electrification of the Drying Process

Fabric drying is done to get rid of moisture and impart a wrinkle-free smooth surface to the fabric. Contact drying using cylinder dryers is mainly used for intermediate drying, instead of final drying (since the fabric width cannot be controlled), and for pre-drying before stentering. Fabric is passed through a series of cylinders that are heated by steam supplied at pressures. Cylinders are employed to dry a wide range of fabrics. However, since the fabric surface is compressed, the drying process is not suitable for fabrics with raised surface effects. Cylinder dryers are heated by steam. Other types of dryers such as hot air dryers are also used for drying fabrics during wet processing. These conventional hot air dryers are also often heated by steam [17].
The most important electrification technology for the drying process in the textile industry is infrared machines. Infrared heating is radiant heating and it differs from conduction and convection because it transfers heat to objects directly, without heating something else in between (air, water, metal, etc.). Infrared is a proven source of heat in textile processing, as infrared sends high heating power in extremely compact times. This helps to lessen energy use, expand production speeds, and lower production costs. Currently, several factories around the world are producing infrared fabric dryers. Based on the collected information, these machines consume at least 25% less energy than the usual old methods [31,32]. Table 12 shows the estimated CO2 intensity of the conventional and electrified drying process in the textile industry in each economy.
The electrification of the drying process could save a large amount of energy each year (Table 7). This is because the electrified process is more efficient than the conventional process. In 2050, China, Japan, and Taiwan could save 40,000, 1050, and 1000 TJ per year, respectively from the electrification of the drying process.
In 2030, there is still a slight increase in CO2 emissions after the electrification of these processes in China, but by 2040 and 2050, there is a substantial reduction in emissions due to grid decarbonization and energy efficiency improvements (Table 8). This could lead to an annual CO2 abatement of around 6500, 180, and 195 kt CO2 per year in China, Japan, and Taiwan, respectively.
As shown in Table 9, the energy cost for the electrified drying process is higher than that for the conventional process in 2030. However, the electrified drying process in the textile industry can be less expensive than the traditional process in the long term.

3.2.5. Electrification of Heat Setting Process (Stenter Machine)

After dyeing and printing, heat-setting of the fabric is done to make sure that the fabric retains its shape afterward. The process is very important especially for the knit fabric to control fabric shrinkage. It also helps to impart wrinkle/crease resistance to the fabric. A stenter machine is often used for heat setting [33,34]. Stenters have a key role in fabric dyeing and finishing. Stenters are mainly employed for heat-setting, drying, thermosol processes, and finishing. During fabric finishing, the fabric is roughly treated 2–3 times on average in a stenter. Fabric can be processed at speeds typically ranging between 10–100 m per minute and temperatures greater than 200 °C. Stenters can be heated in several ways, such as through direct gas firing or the use of thermal oil systems. Gas-fired stenters are highly controllable over a wide range of process temperatures.
Thermal oil heating for stenter machines needs a thermal oil boiler and its associated distribution pipeline. This system is less efficient as compared to direct gas firing and has higher capital and operational costs. Finally, there are several steam-heated stenters. which have low-temperature limits (typically up to 160 °C maximum) and can only be used for drying and are not suitable for fabric heat setting or thermo-fixing [17].
Currently, many stenter manufacturing companies offer several choices for the type of heating system in the machine. Most stenter manufacturers offer machines with electric heating systems [35,36,37,38]. Additionally, using a stenter with electric heating instead of a direct gas-fired or thermal oil stenter reduces the total energy consumption of the process because of a reduction in energy losses in the system [39]. In this study, we assumed a 25% lower energy intensity for the electric stenter compared with the conventional stenter. Table 13 shows the estimated CO2 intensity of the conventional and electrified heat setting process in the textile industry in each economy.
Table 7 shows that electrifying the heat setting process could lead to annual energy savings of about 33,000, 770, and 730 TJ per year for China, Japan, and Taiwan, respectively in 2050. This annual energy saving results from the higher efficiency (lower energy intensity) of the electrified heat setting compared with the conventional process.
In 2030, there is still a slight increase in CO2 emissions after the electrification of the heat-setting process in China and Japan, but the electrification of this process could result in a reduction in CO2 emissions in Taiwan in 2030 (Table 8). There is a substantial reduction in CO2 emissions in all three economies in 2040 and 2050 which is the result of grid decarbonization, and energy efficiency improvement up to 2050. The annual reduction of CO2 emission after electrification of the heat setting process in 2050 is around 6350, 150, and 160 kt CO2 per year in China, Japan, and Taiwan, respectively.
The energy cost for the electrified heat setting process is substantially higher than that for the conventional process in 2030 (Table 9). However, as the price of fossil fuels increases over time and considering the carbon price, the energy cost for the electrified process can be lower than that of the conventional process in 2050. The energy cost per unit of production for the electrified process can be lower than the conventional process when lower electricity prices are used.

3.2.6. Electrification of Finishing Process (Pad-Dry-Cure)

Textile finishing can be defined as all processes (chemical and/or mechanical), employed after textile coloration which imparts additional functionality/superior aesthetics to the textile material. Chemicals that have strong affinities for fiber surfaces can be applied in batch or discontinuous processes by exhaustion. Chemicals that have low or no affinity for fibers are applied by continuous processes that involve padding with chemical solutions, squeezing, drying at moderate temperatures, and curing at elevated temperatures for fixation (pad-dry-cure). The drying is often done in a cylinder dryer or hot air dryer and curing is done in a hot air dryer. These dryers often use a steam coil or thermal oil coil as a heat source.
Same as the stenters and dryers, the electrified process for drying and curing is now available. Electricidal resistance heating elements and/or infrared heating are used as the heating system in the electrified process [40]. Since the electrified heating systems do not have the heat losses related to steam generation and distribution systems and have minimal exhaust losses, they can result in at least a 30% reduction in energy intensity of heating and curing processes in finishing. Table 14 shows the estimated CO2 intensity of the conventional and electrified finishing (pad-dry-cure) process in the textile industry in each economy.
Electrifying the finishing (pad-dry-cure) process can result in large energy savings (Table 7). In China, Japan, and Taiwan, annual energy savings of 5000, 225, and 215 TJ per year can be achieved in 2050, respectively. This is because electrified finishing is more efficient than the conventional process.
The electrification of the finishing process could lead to a decrease in CO2 emissions in Japan and Taiwan and a slight increase in CO2 emissions in China in 2030 (Table 8). In 2050, the annual reduction of CO2 emissions after electrification of the finishing process is estimated to be around 700, 30, and 35 kt CO2 per year in China, Japan, and Taiwan, respectively.
The energy cost per unit of production varies across the three economies for the conventional and electrified finishing process (Table 9). The energy cost for the electrified finishing process is higher than that for the conventional process in 2030. However, the energy cost for the electrified process can be lower than that of the conventional process in 2050.

3.2.7. Electrification of the Yarn-Drying Process

The two main steps in drying textile yarns are the mechanical removal of water and the thermal removal of the remaining moisture. Mechanical processes use centrifugal force to extract water that is mechanically bound to the fiber. The remaining water is removed using a thermal treatment after pre-drying. This can be done through convection, conduction (contact), infrared or radiofrequency drying. The most common technique is convective drying, which involves passing a hot air stream through the wet fabric material. The hot air transfers heat to the material and evaporates the water, which is then carried away [41].
Radiofrequency (RF) dryers are well-known and already commercial electrified yarn dryers. The RF yarn drying machine directly transfers electromagnetic energy to the water molecules contained in the wet fibers. Therefore, the energy is supplied to the textile product only in proportion to its moisture content with negligible losses to the environment, resulting in an efficient operation. In this study, based on the information in the literature and the fact that RF dryers do not have energy losses related to steam generation and distribution, we assumed the energy intensity of RF dryers is around 30% lower than that of a conventional yarn dryer [42,43,44]. Table 15 shows the estimated CO2 intensity of the conventional and electrified yarn drying process in the textile industry in each economy.
Electrification could lead to annual energy savings of about 750, 3, 14 TJ per year for China, Japan, and Taiwan, respectively in 2050 (Table 7). This annual energy saving results from the higher efficiency (lower energy intensity) of electrified yarn drying compared with the conventional process.
In 2030, there is still a slight increase in CO2 emissions after the electrification of the yarn drying process in China because of its relatively high grid CO2 emissions factor, but electrification of this process could result in a reduction in CO2 emissions in Japan and Taiwan in 2030 (Table 8). There is a substantial reduction in CO2 emissions in all three economies in 2040 and 2050. The annual reduction of CO2 emission after electrification of the yarn drying process in 2050 is around 110, 0.4, and 2 kt CO2 per year in China, Japan, and Taiwan, respectively.
Table 9 shows the energy cost per unit of production in China, Japan, and Taiwan for the conventional and electrified yarn drying processes up to 2050. The energy cost for the electrified yarn drying process is substantially higher than that for the conventional process in 2030. However, as the price of fossil fuels increases over time and considering the carbon price, the energy cost for the electrified process can be lower than that of the conventional process. In addition, the energy cost per unit of production for the electrified process can be lower than the conventional process in Japan and Taiwan even in 2030 when the unit price of electricity is reduced.

3.2.8. Total Electrification Potential in Seven Studied Wet Processes

This section presents the total combined annual energy savings and change in annual CO2 emissions after the electrification of all seven studied textile wet processes. Figure 21 shows that electrifying the studied processes results in substantial annual energy savings up to 2050. Electrification could lead to annual energy savings of about 145, 3.5, and 3.8 PJ per year in China, Japan, and Taiwan, respectively in 2050.
If the grid electricity is used, in 2030, there is still a slight increase in CO2 emissions after the electrification of these processes in China (Plant-level emissions reductions can be achieved today through electrification projects, particularly when a renewable electricity supply is available), but by 2040 and 2050, there is a substantial reduction in emissions due to grid decarbonization and energy efficiency improvements (Figure 22). This could lead to an annual reduction of CO2 emissions of around 23, 0.6, and 0.7 Mt CO2 per year in China, Japan, and Taiwan, respectively.
Furthermore, while electrification decreases net final energy demand, electricity demand increases. For example, electrifying seven textile wet-processes results in an increase in annual electricity consumption of 64, 1.5, and 1.6 TWh per year in China, Japan, and Taiwan, respectively in 2050. This translates into an increase in electricity load of 30, 0.7, and 0.8 GW in China, Japan, and Taiwan, respectively in 2050 (To estimate these additional loads, we assumed all the additional load is coming from clean renewable energy sources. We further assumed that two-thirds of this additional load is coming from solar power and one-third from wind power and assumed the capacity factor accordingly). For comparison, in 2021, China had around 2380 GW, Japan had around 313 GW, and Taiwan had around 59 GW of electricity generation capacities [45,46].

4. Discussion and Policy Recommendations

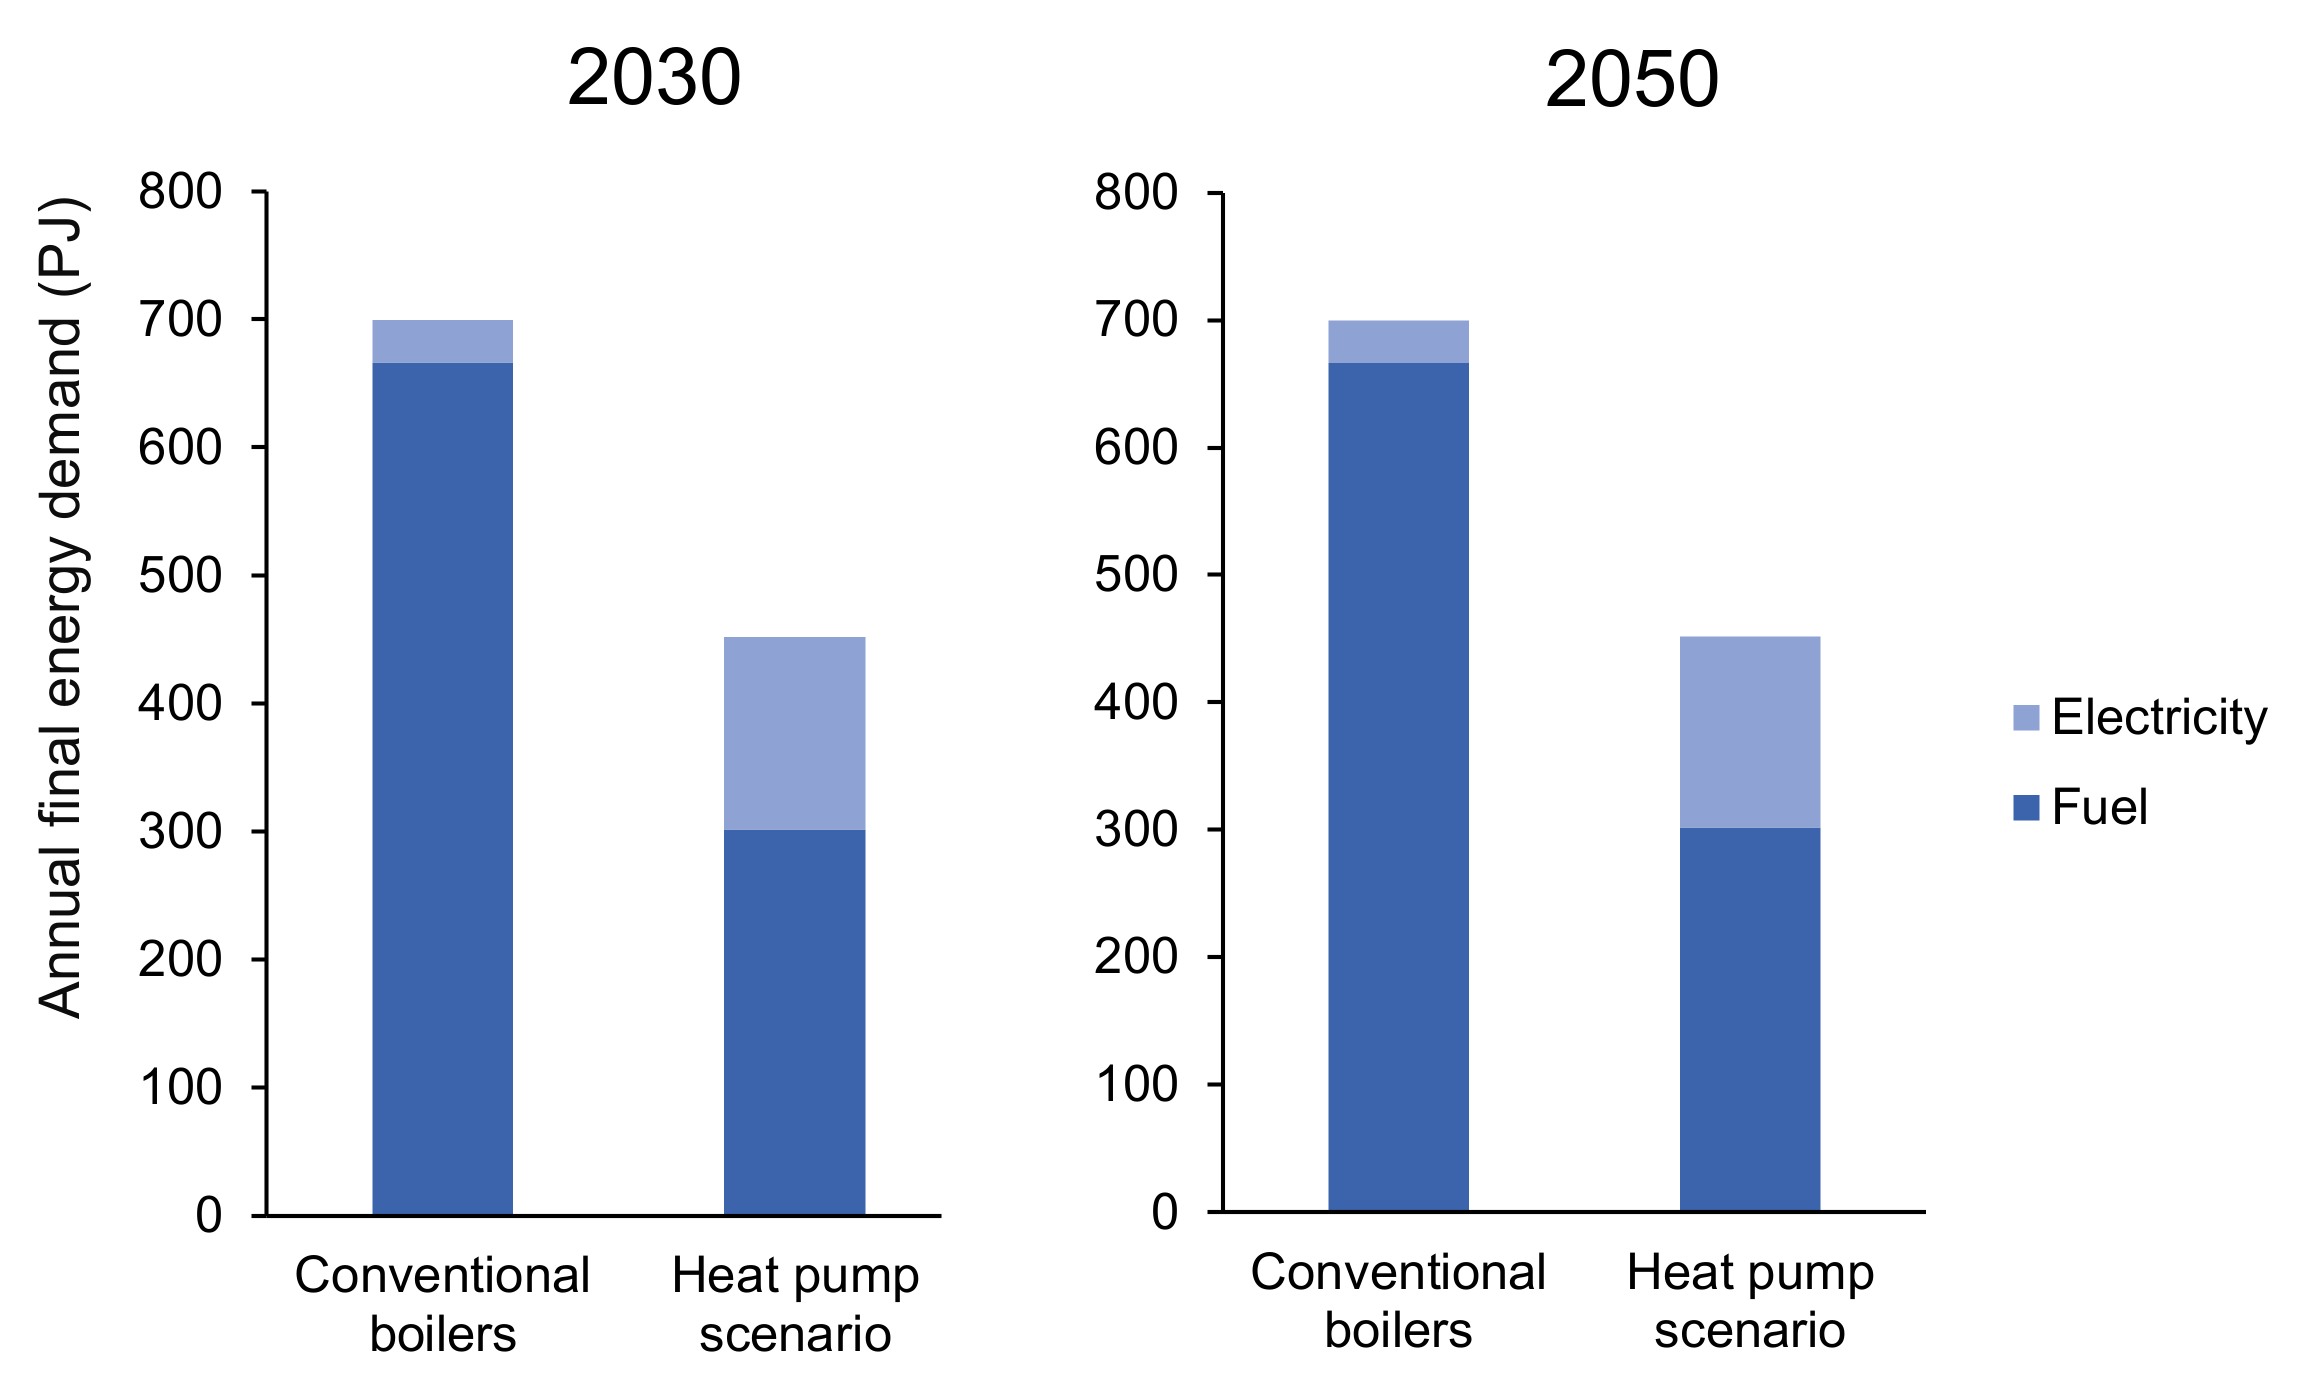
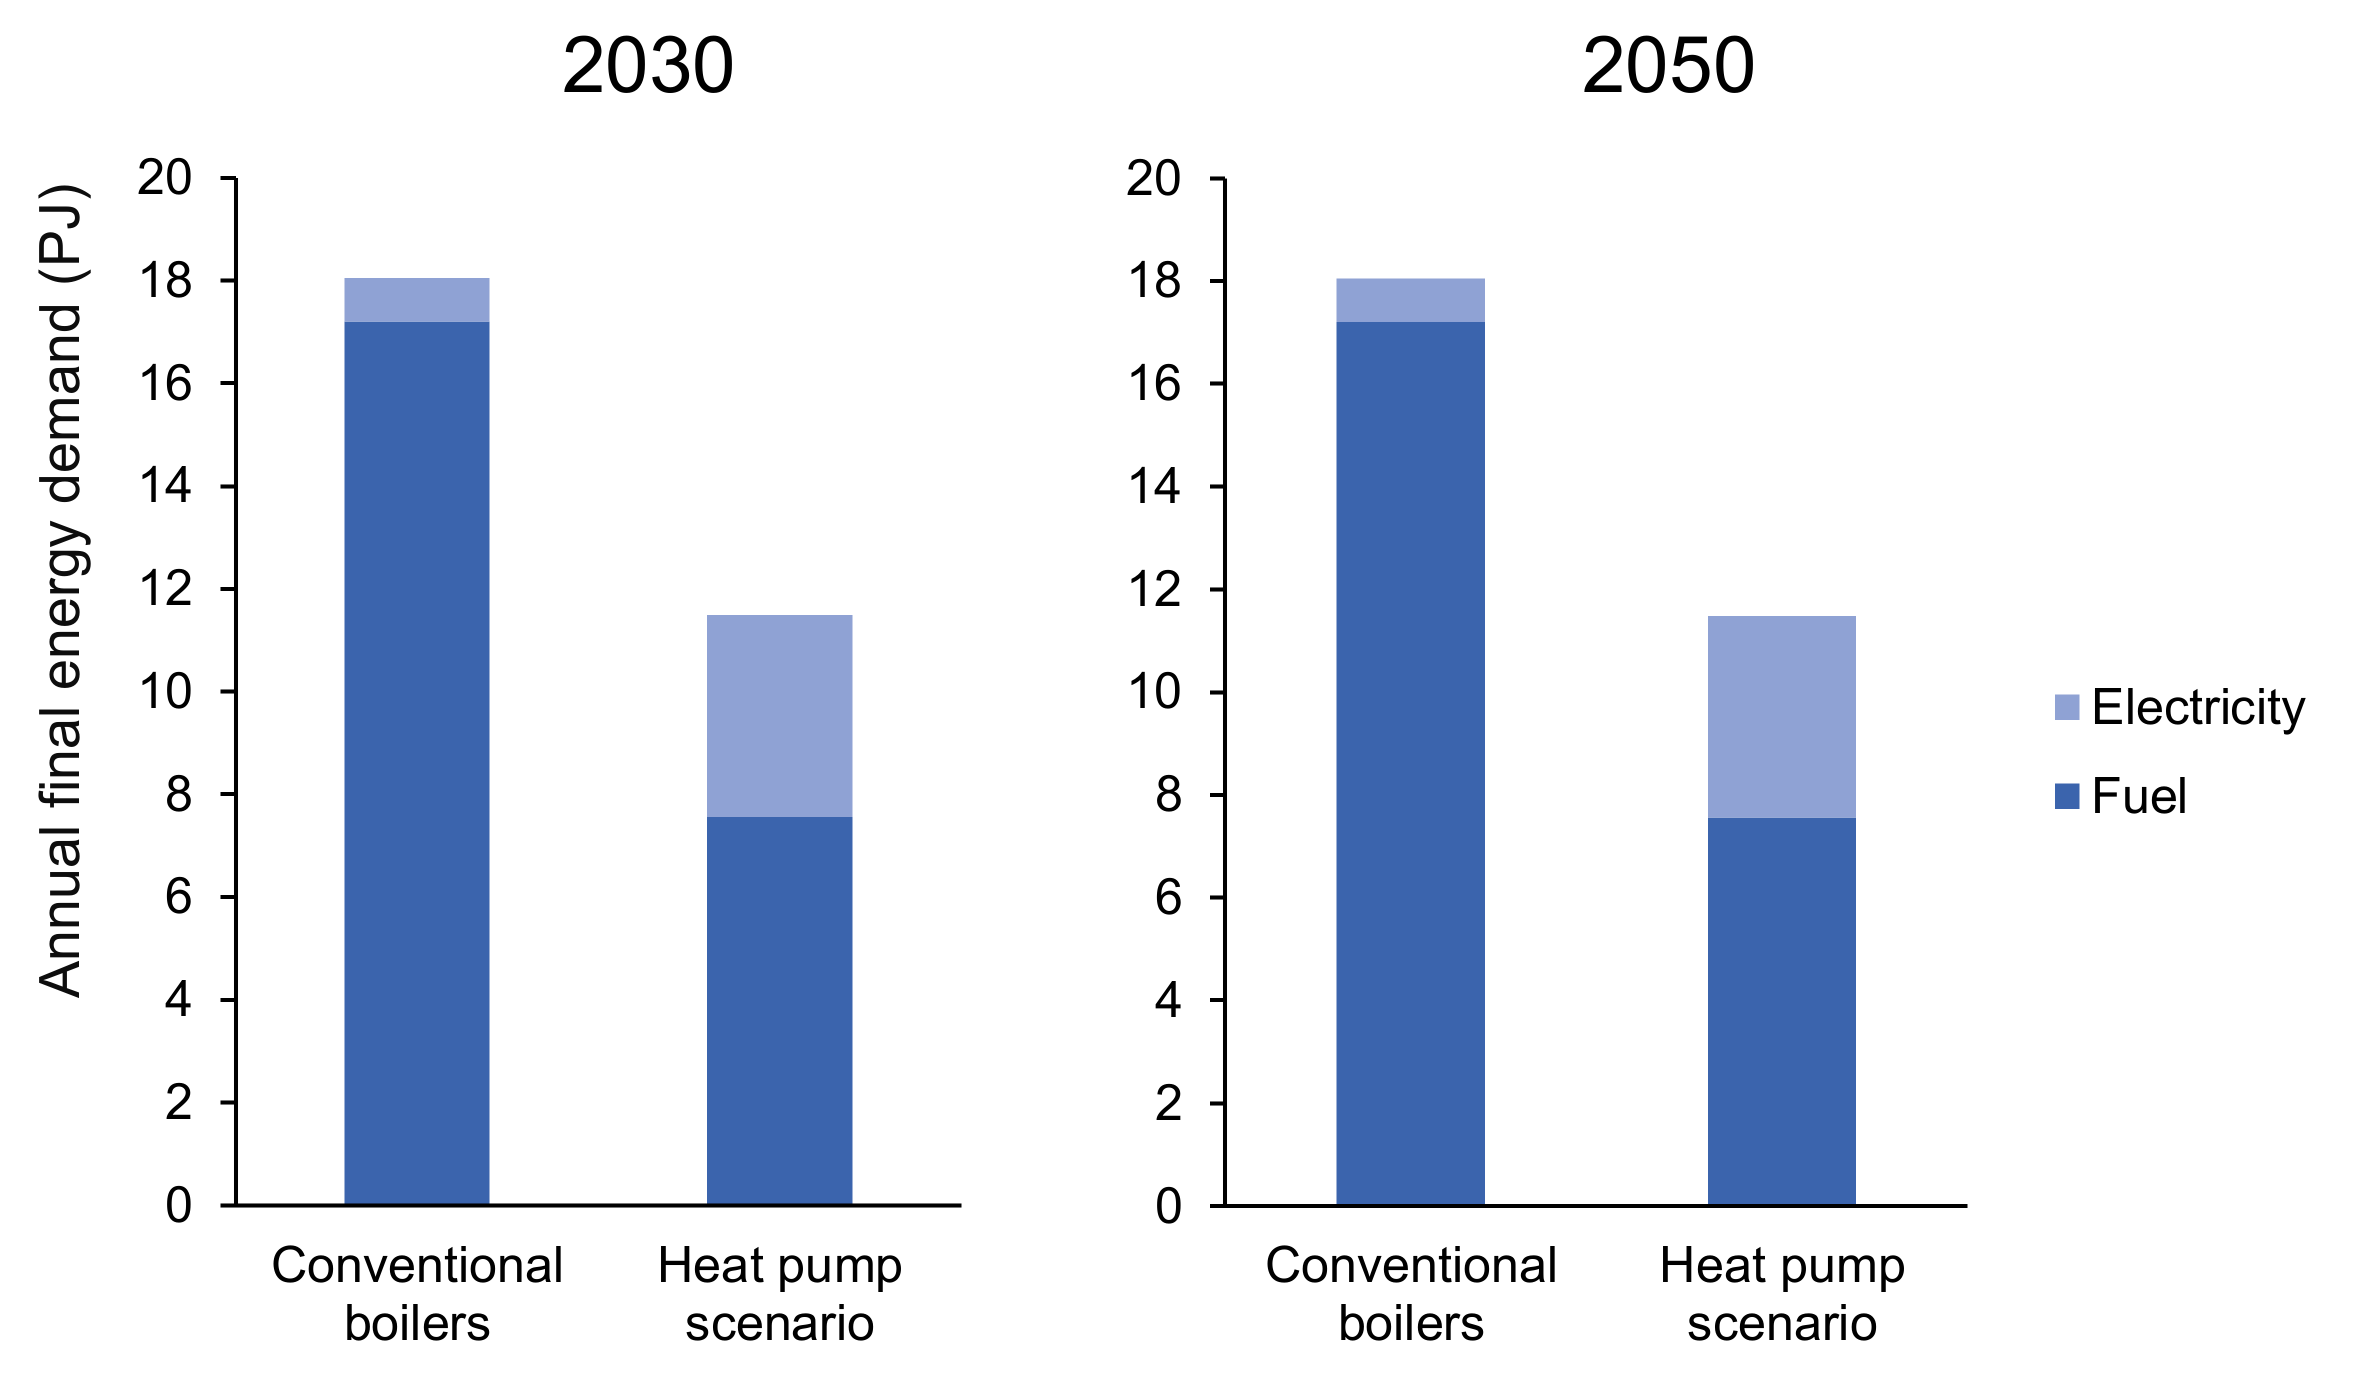
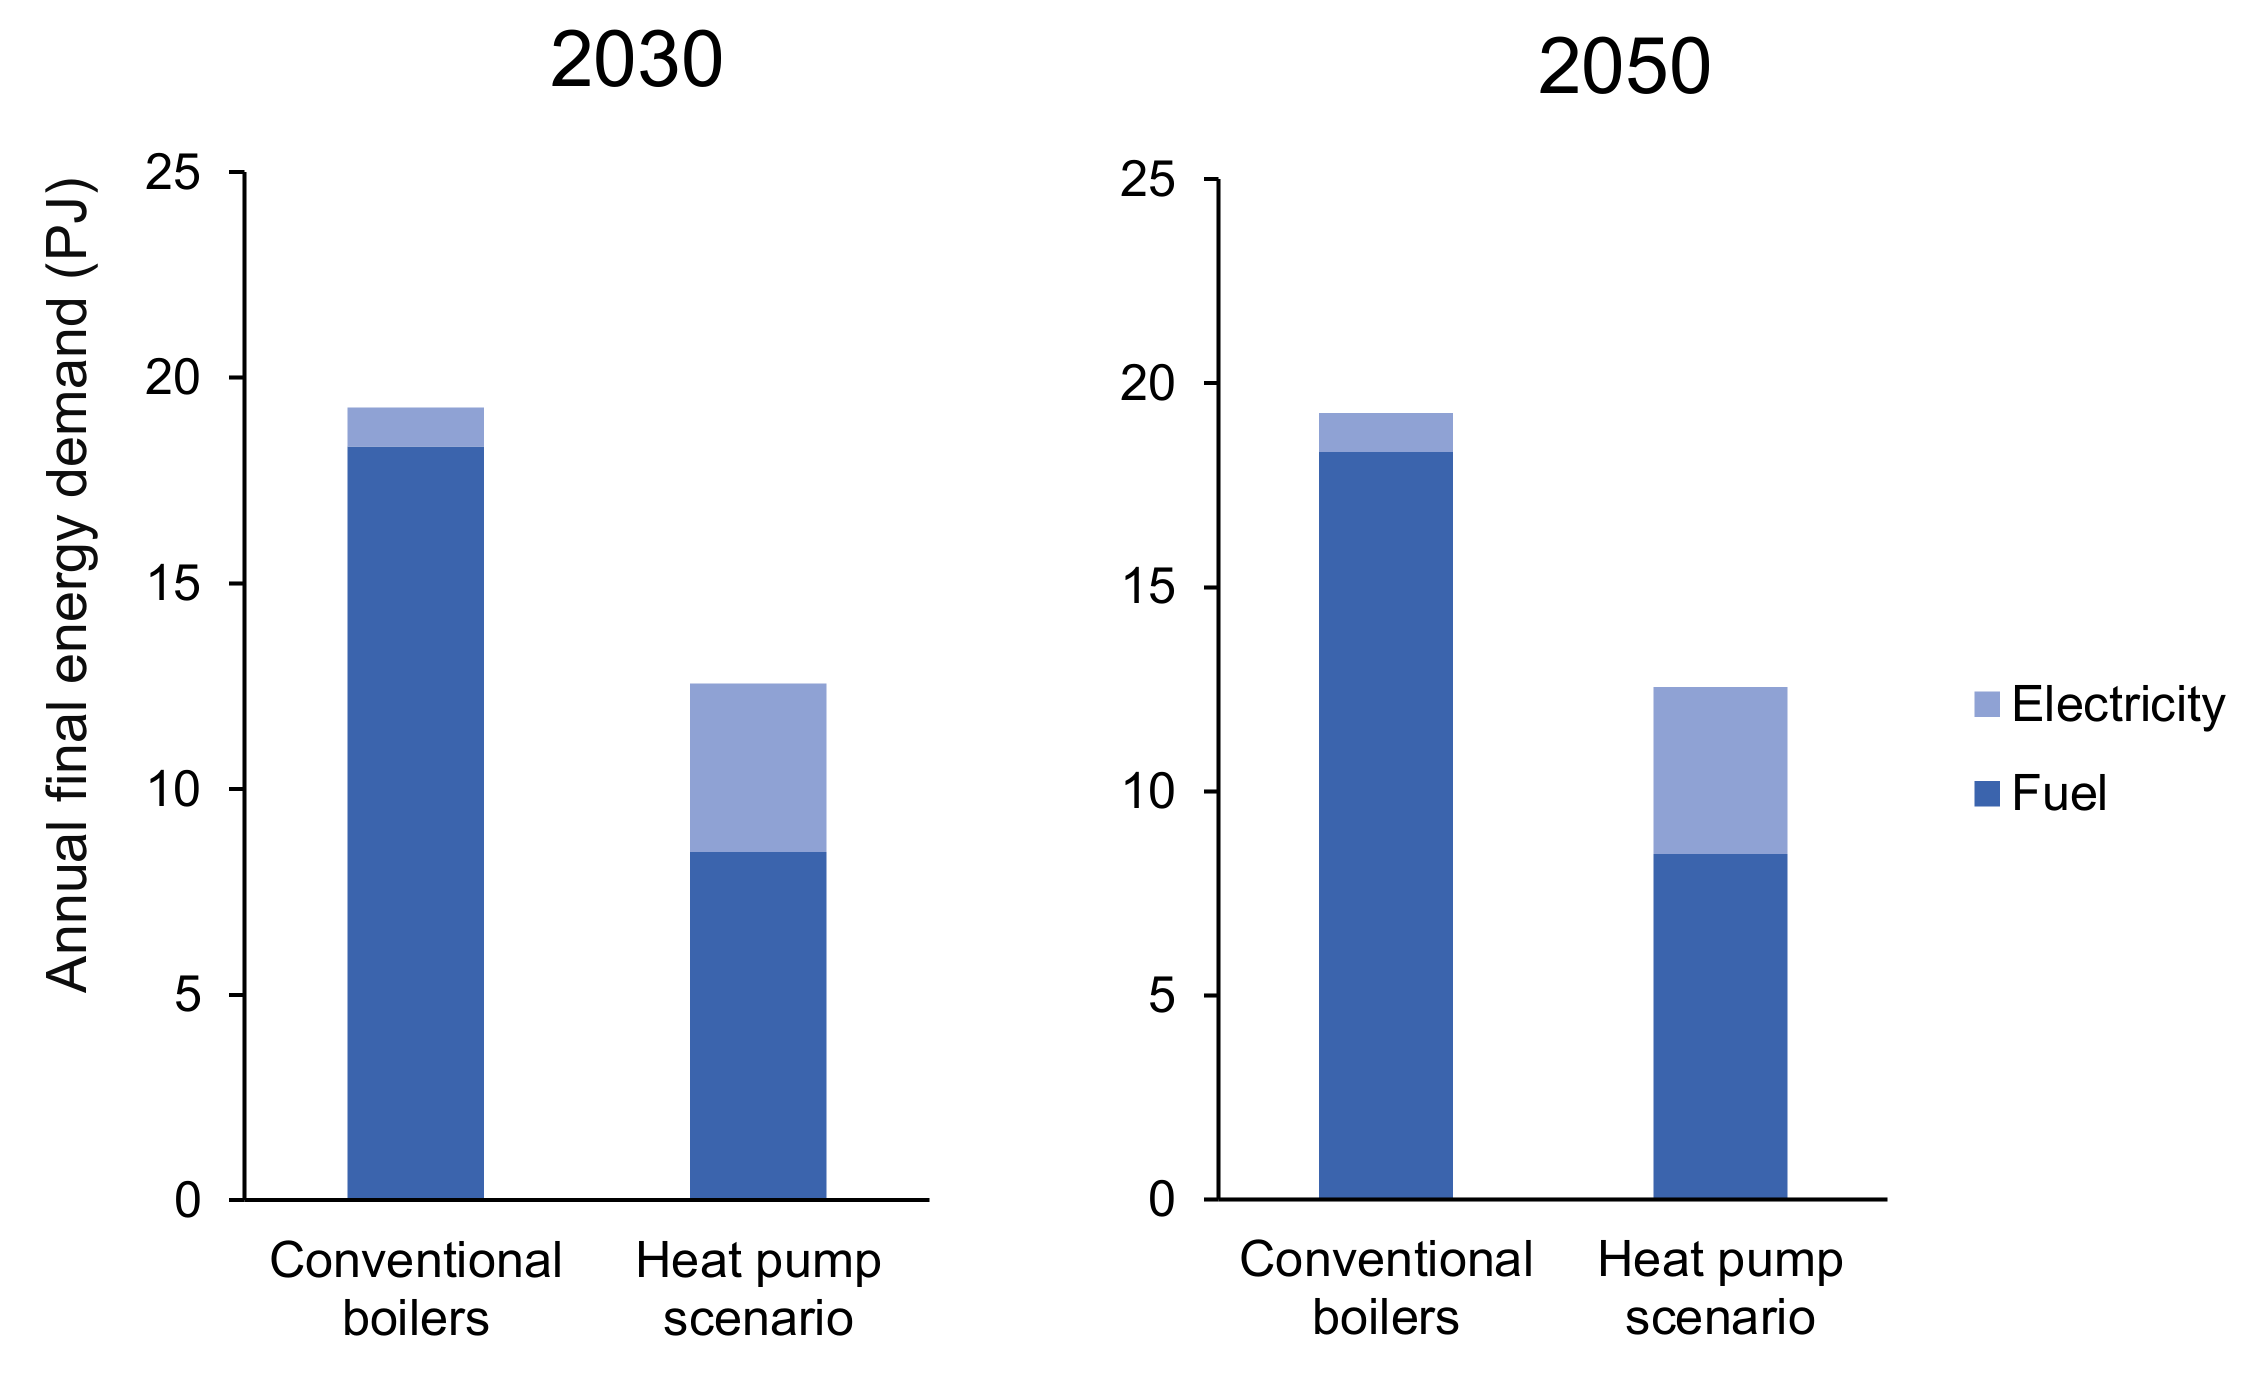
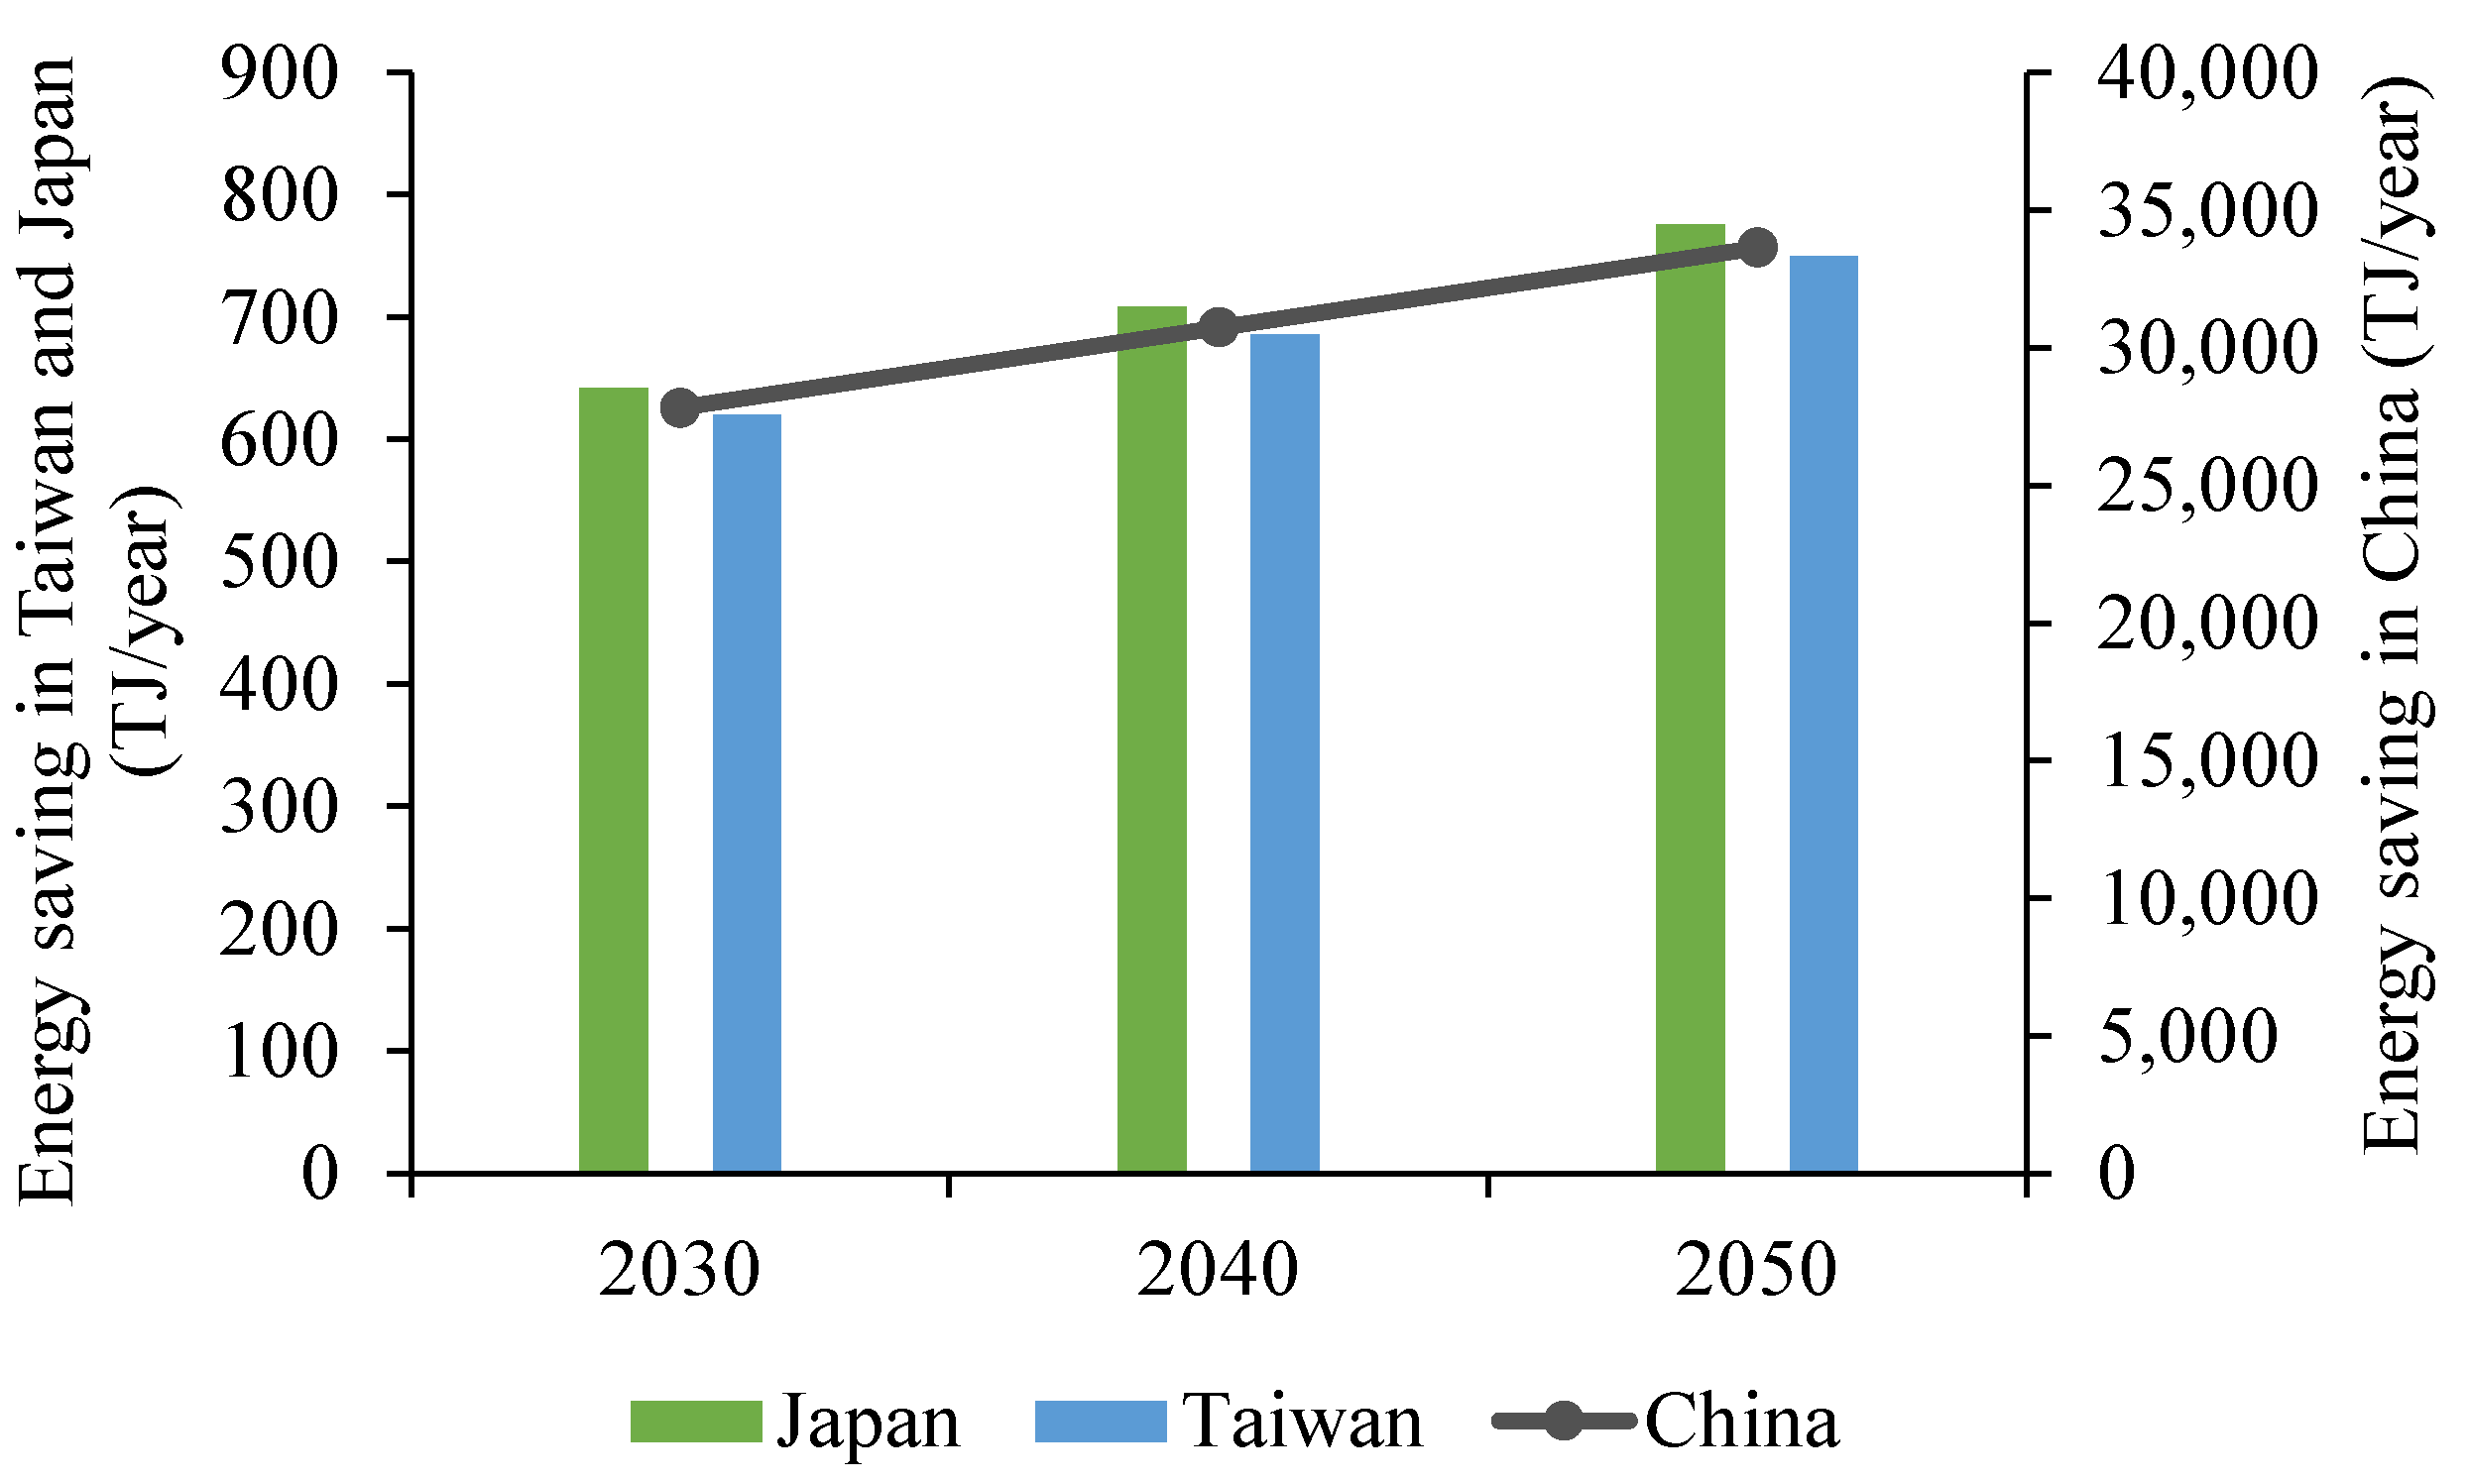
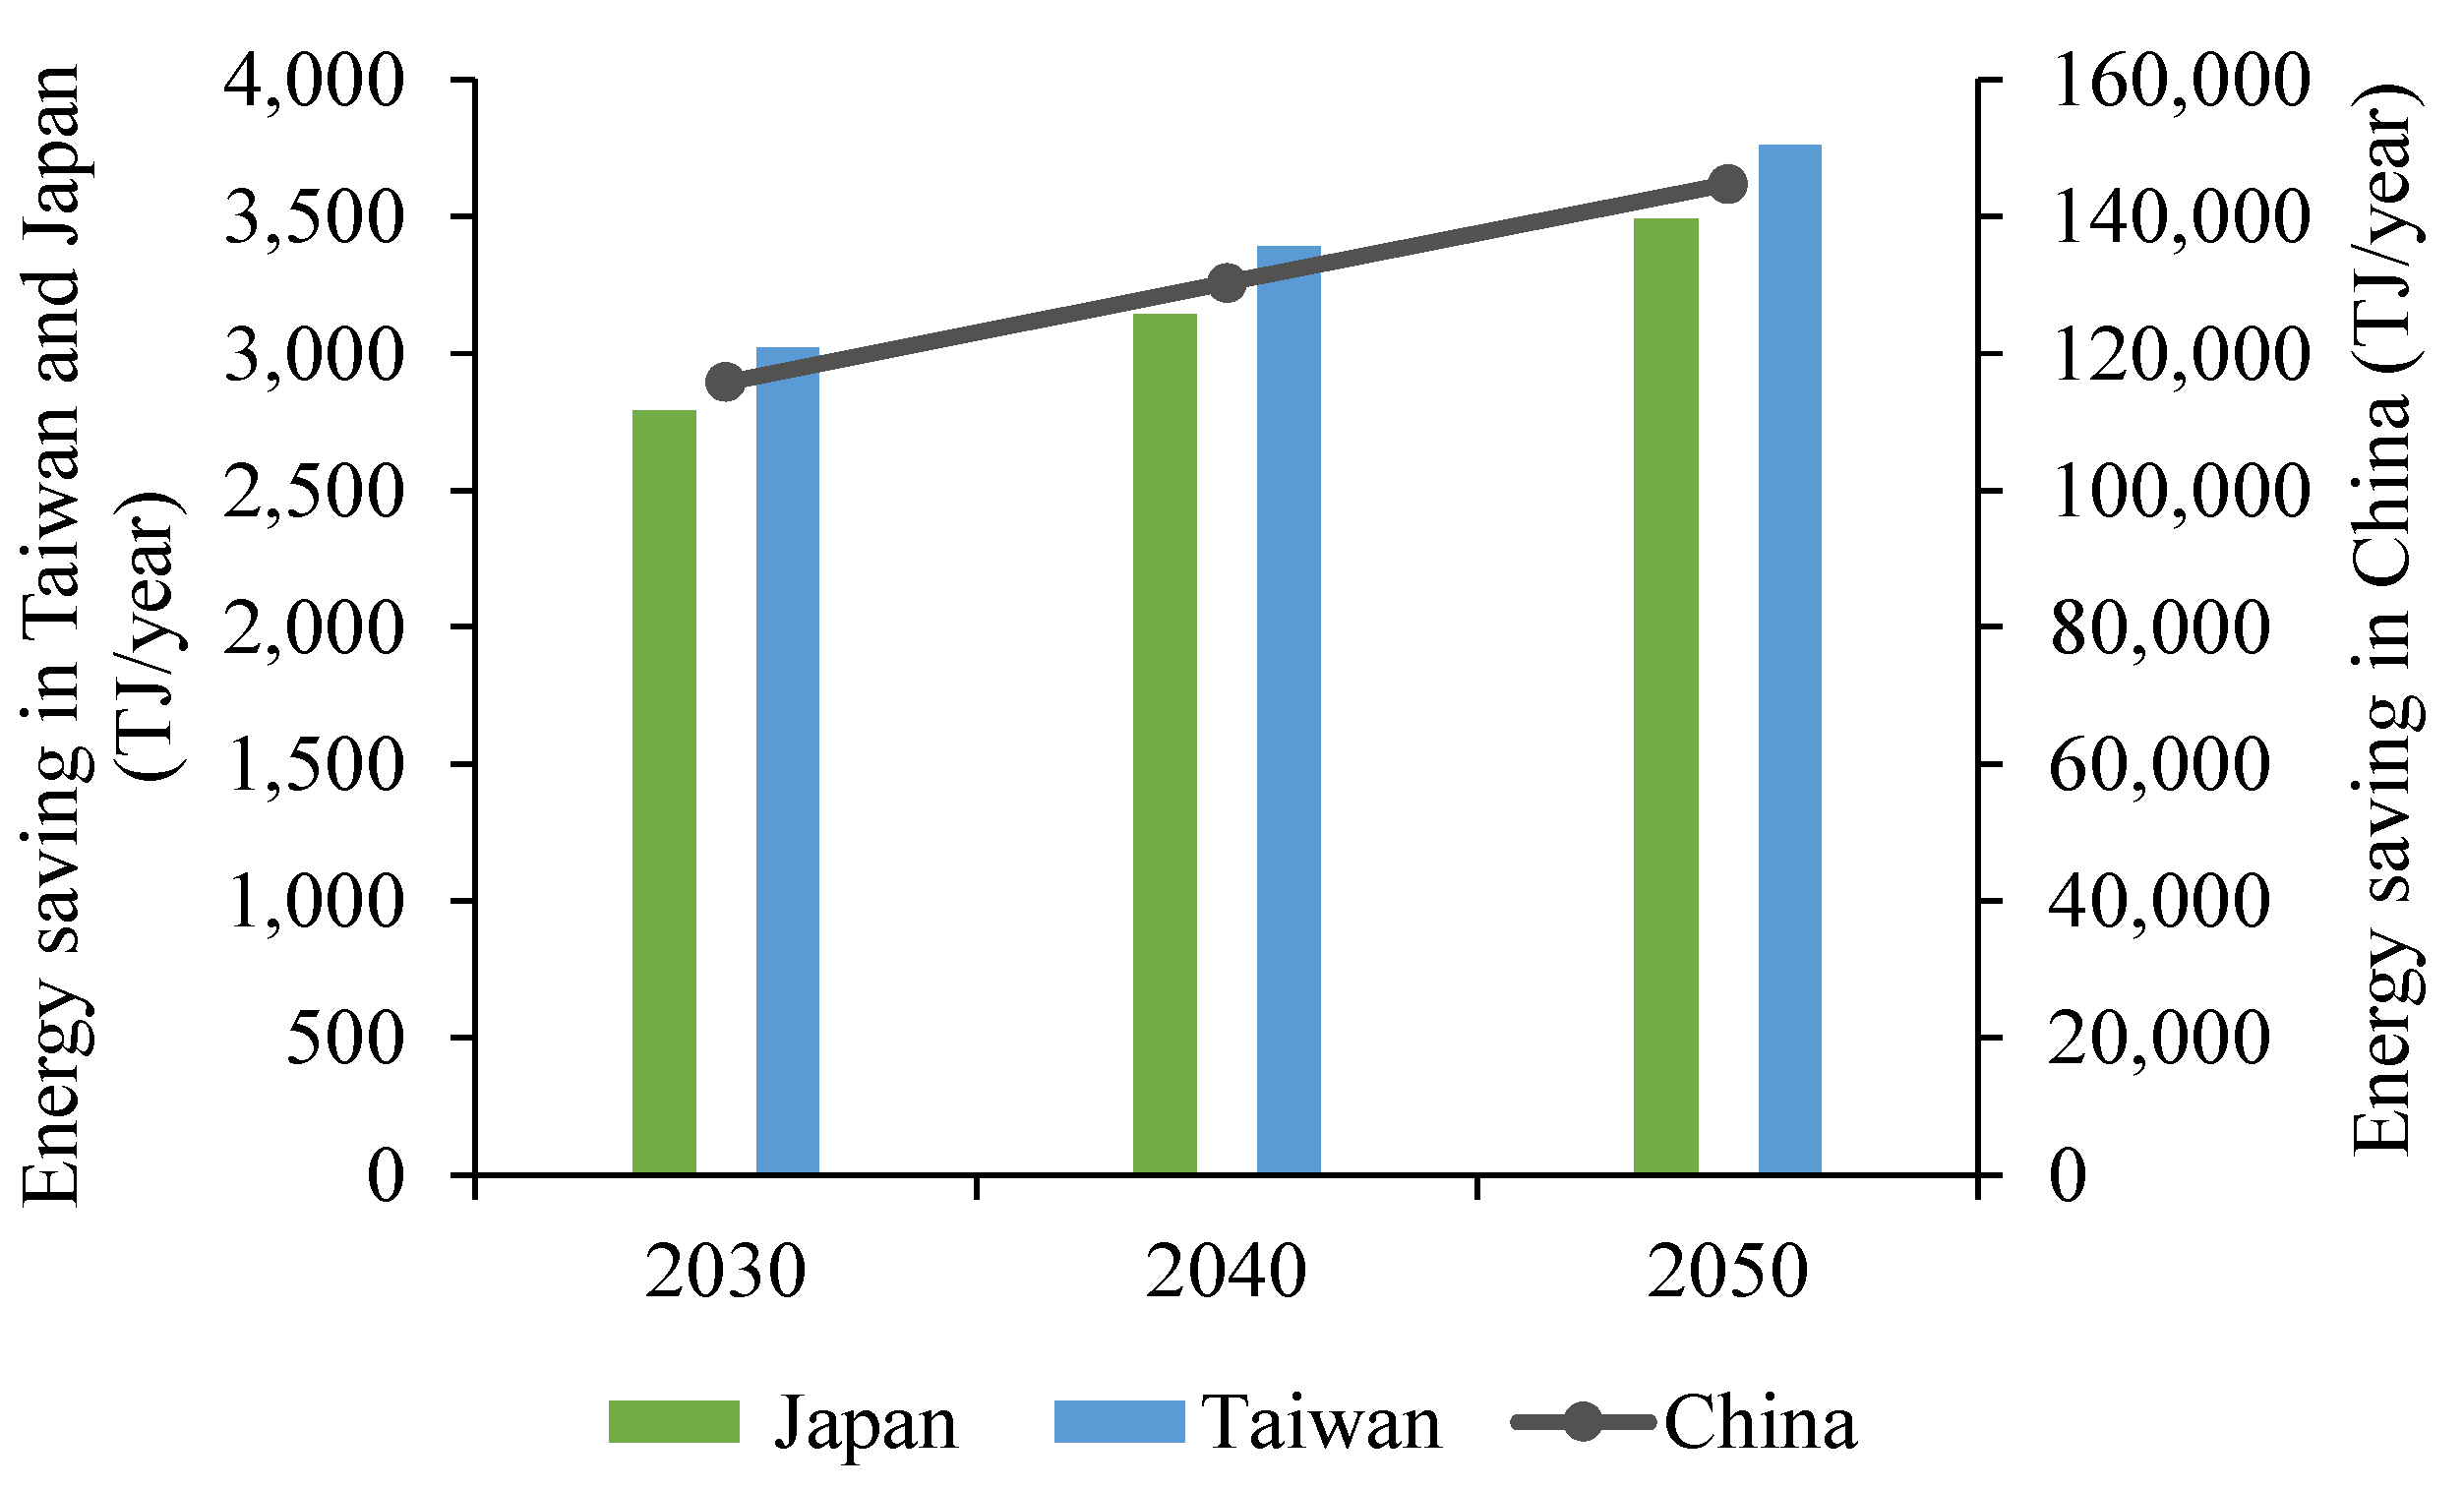
The total potential final energy savings due to industrial heat pump applications are estimated to be around 270, 7.0, and 7.3 PJ per year in China, Japan, and Taiwan, respectively in 2050. On the other hand, electrification through end-use processes could lead to potential final energy savings of about 145, 3.5, and 3.8 PJ per year in China, Japan, and Taiwan, respectively in 2050. It must be noted that the results of the two pathways are not directly comparable because only seven end-use wet processes have been studied in the second pathway analysis mainly due to a lack of technical data for the remaining processes. Furthermore, the substantial reduction in annual final energy demand in both scenarios is due to the increase in the efficiency and lower energy intensity of the electrified heating systems.
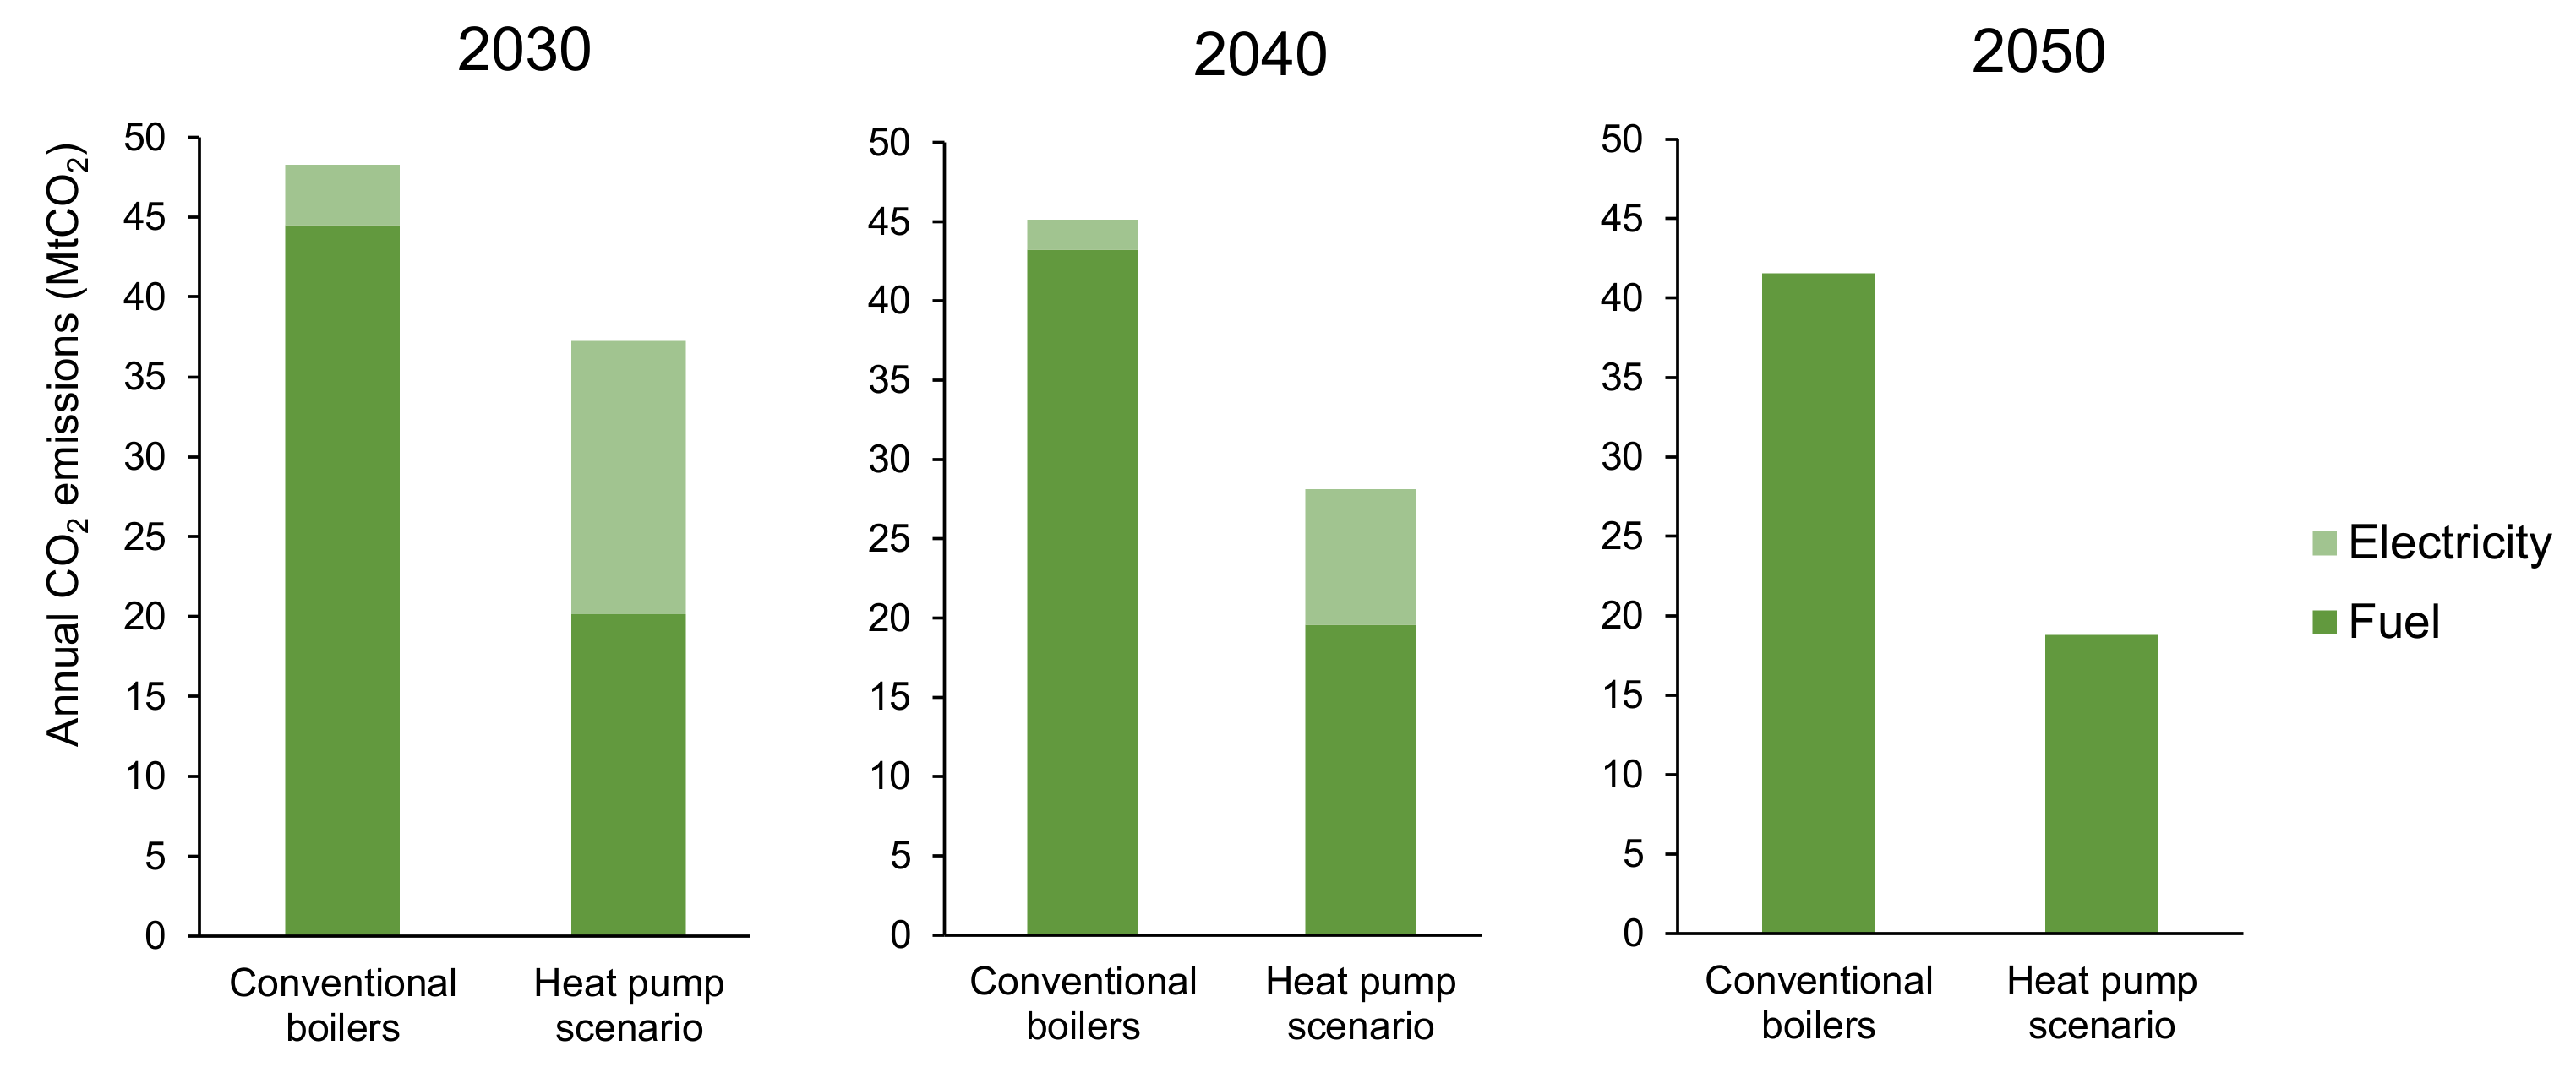
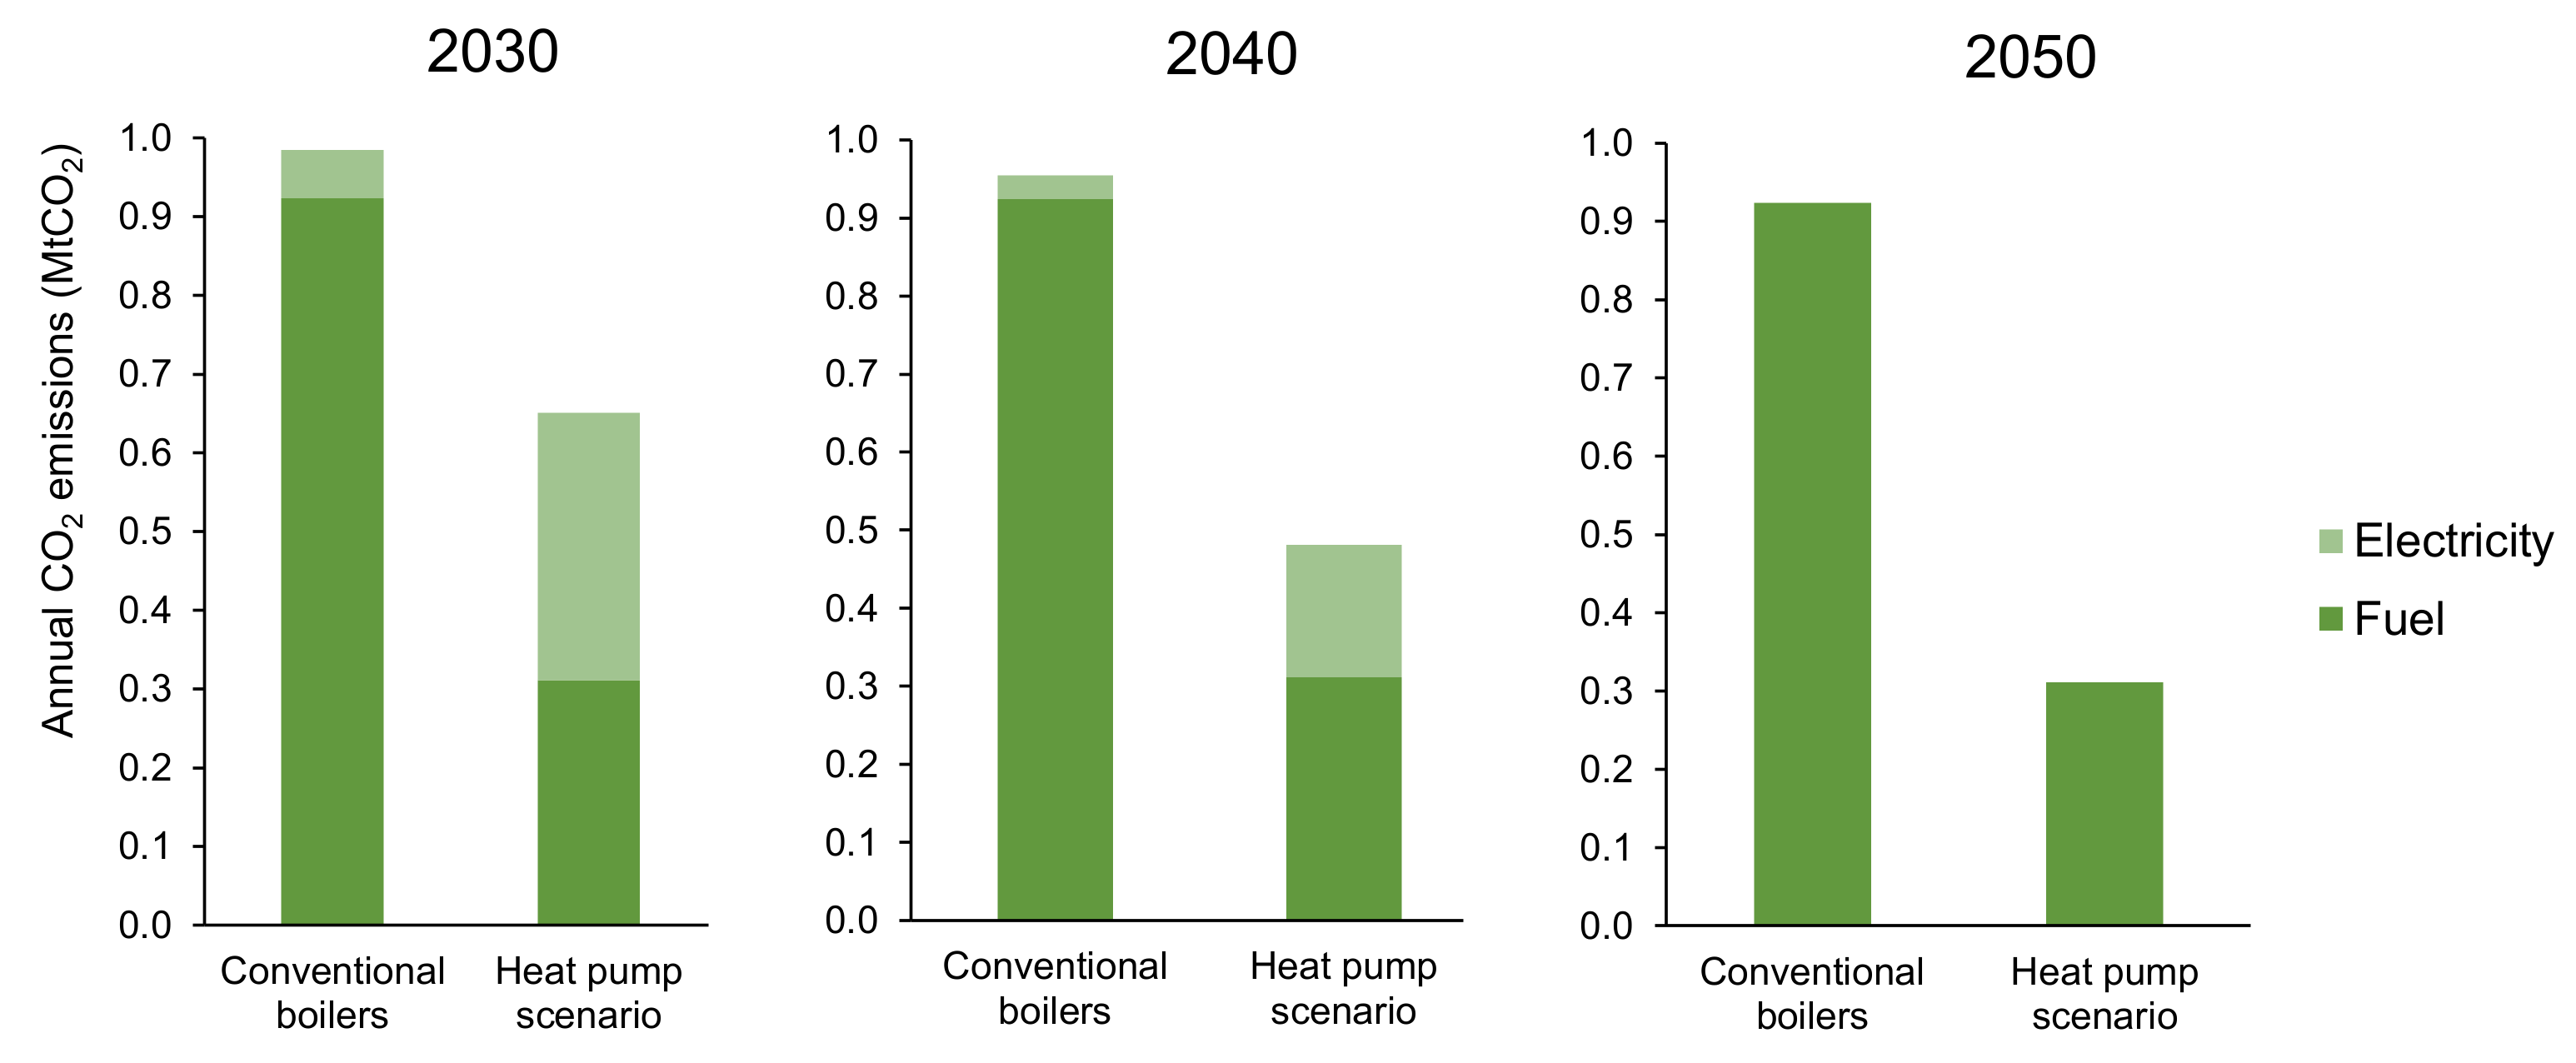
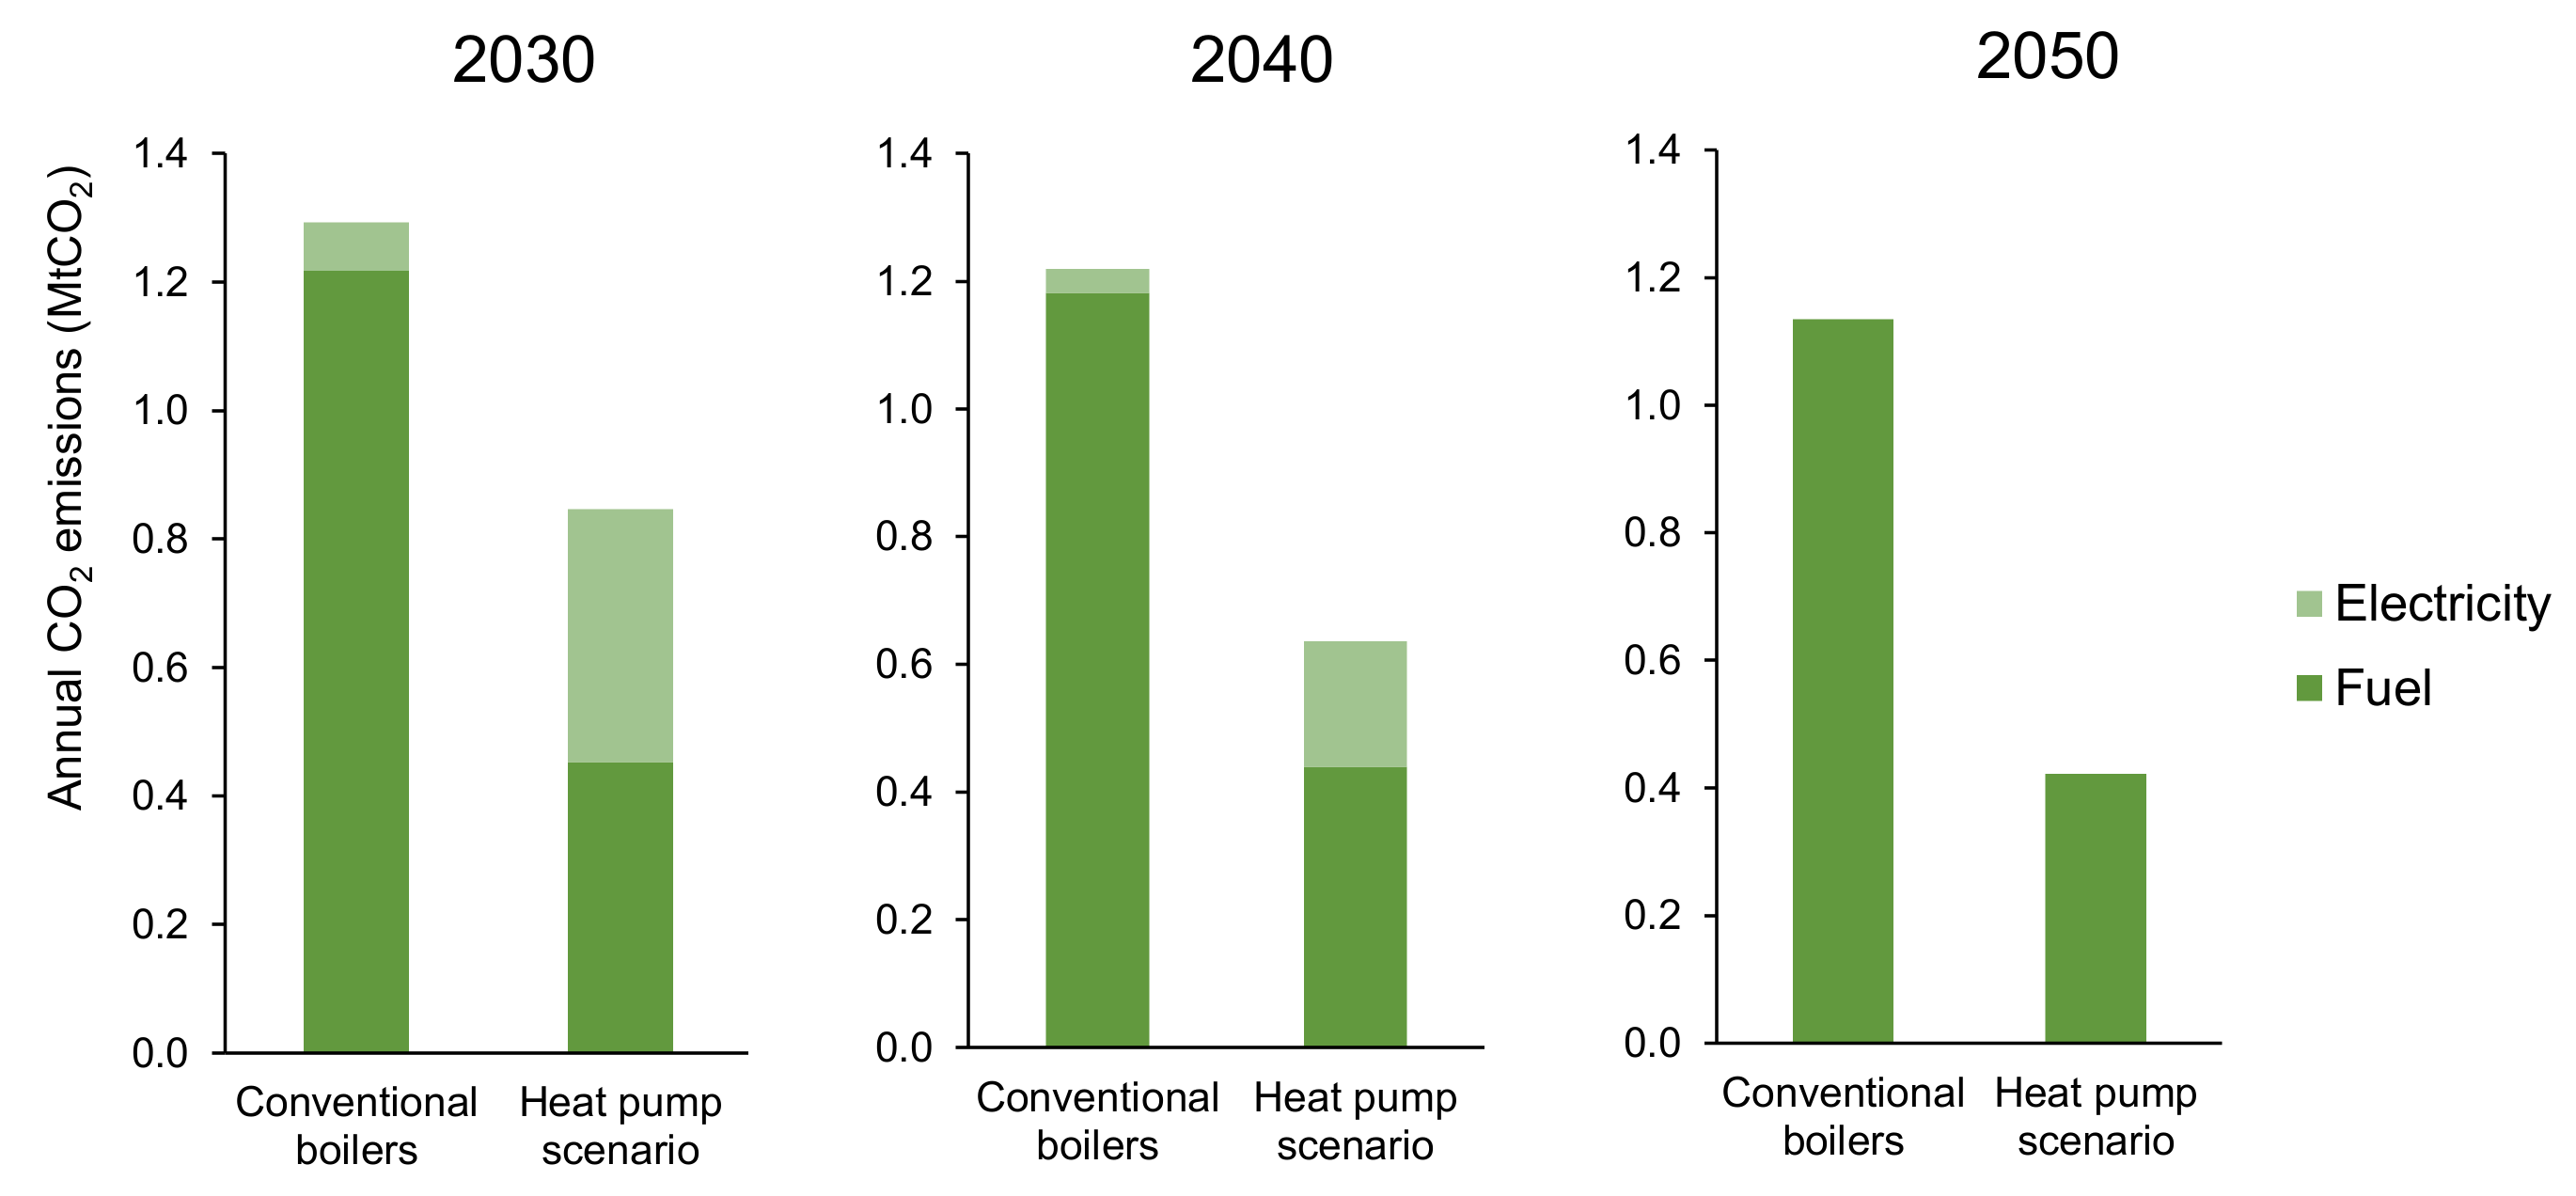
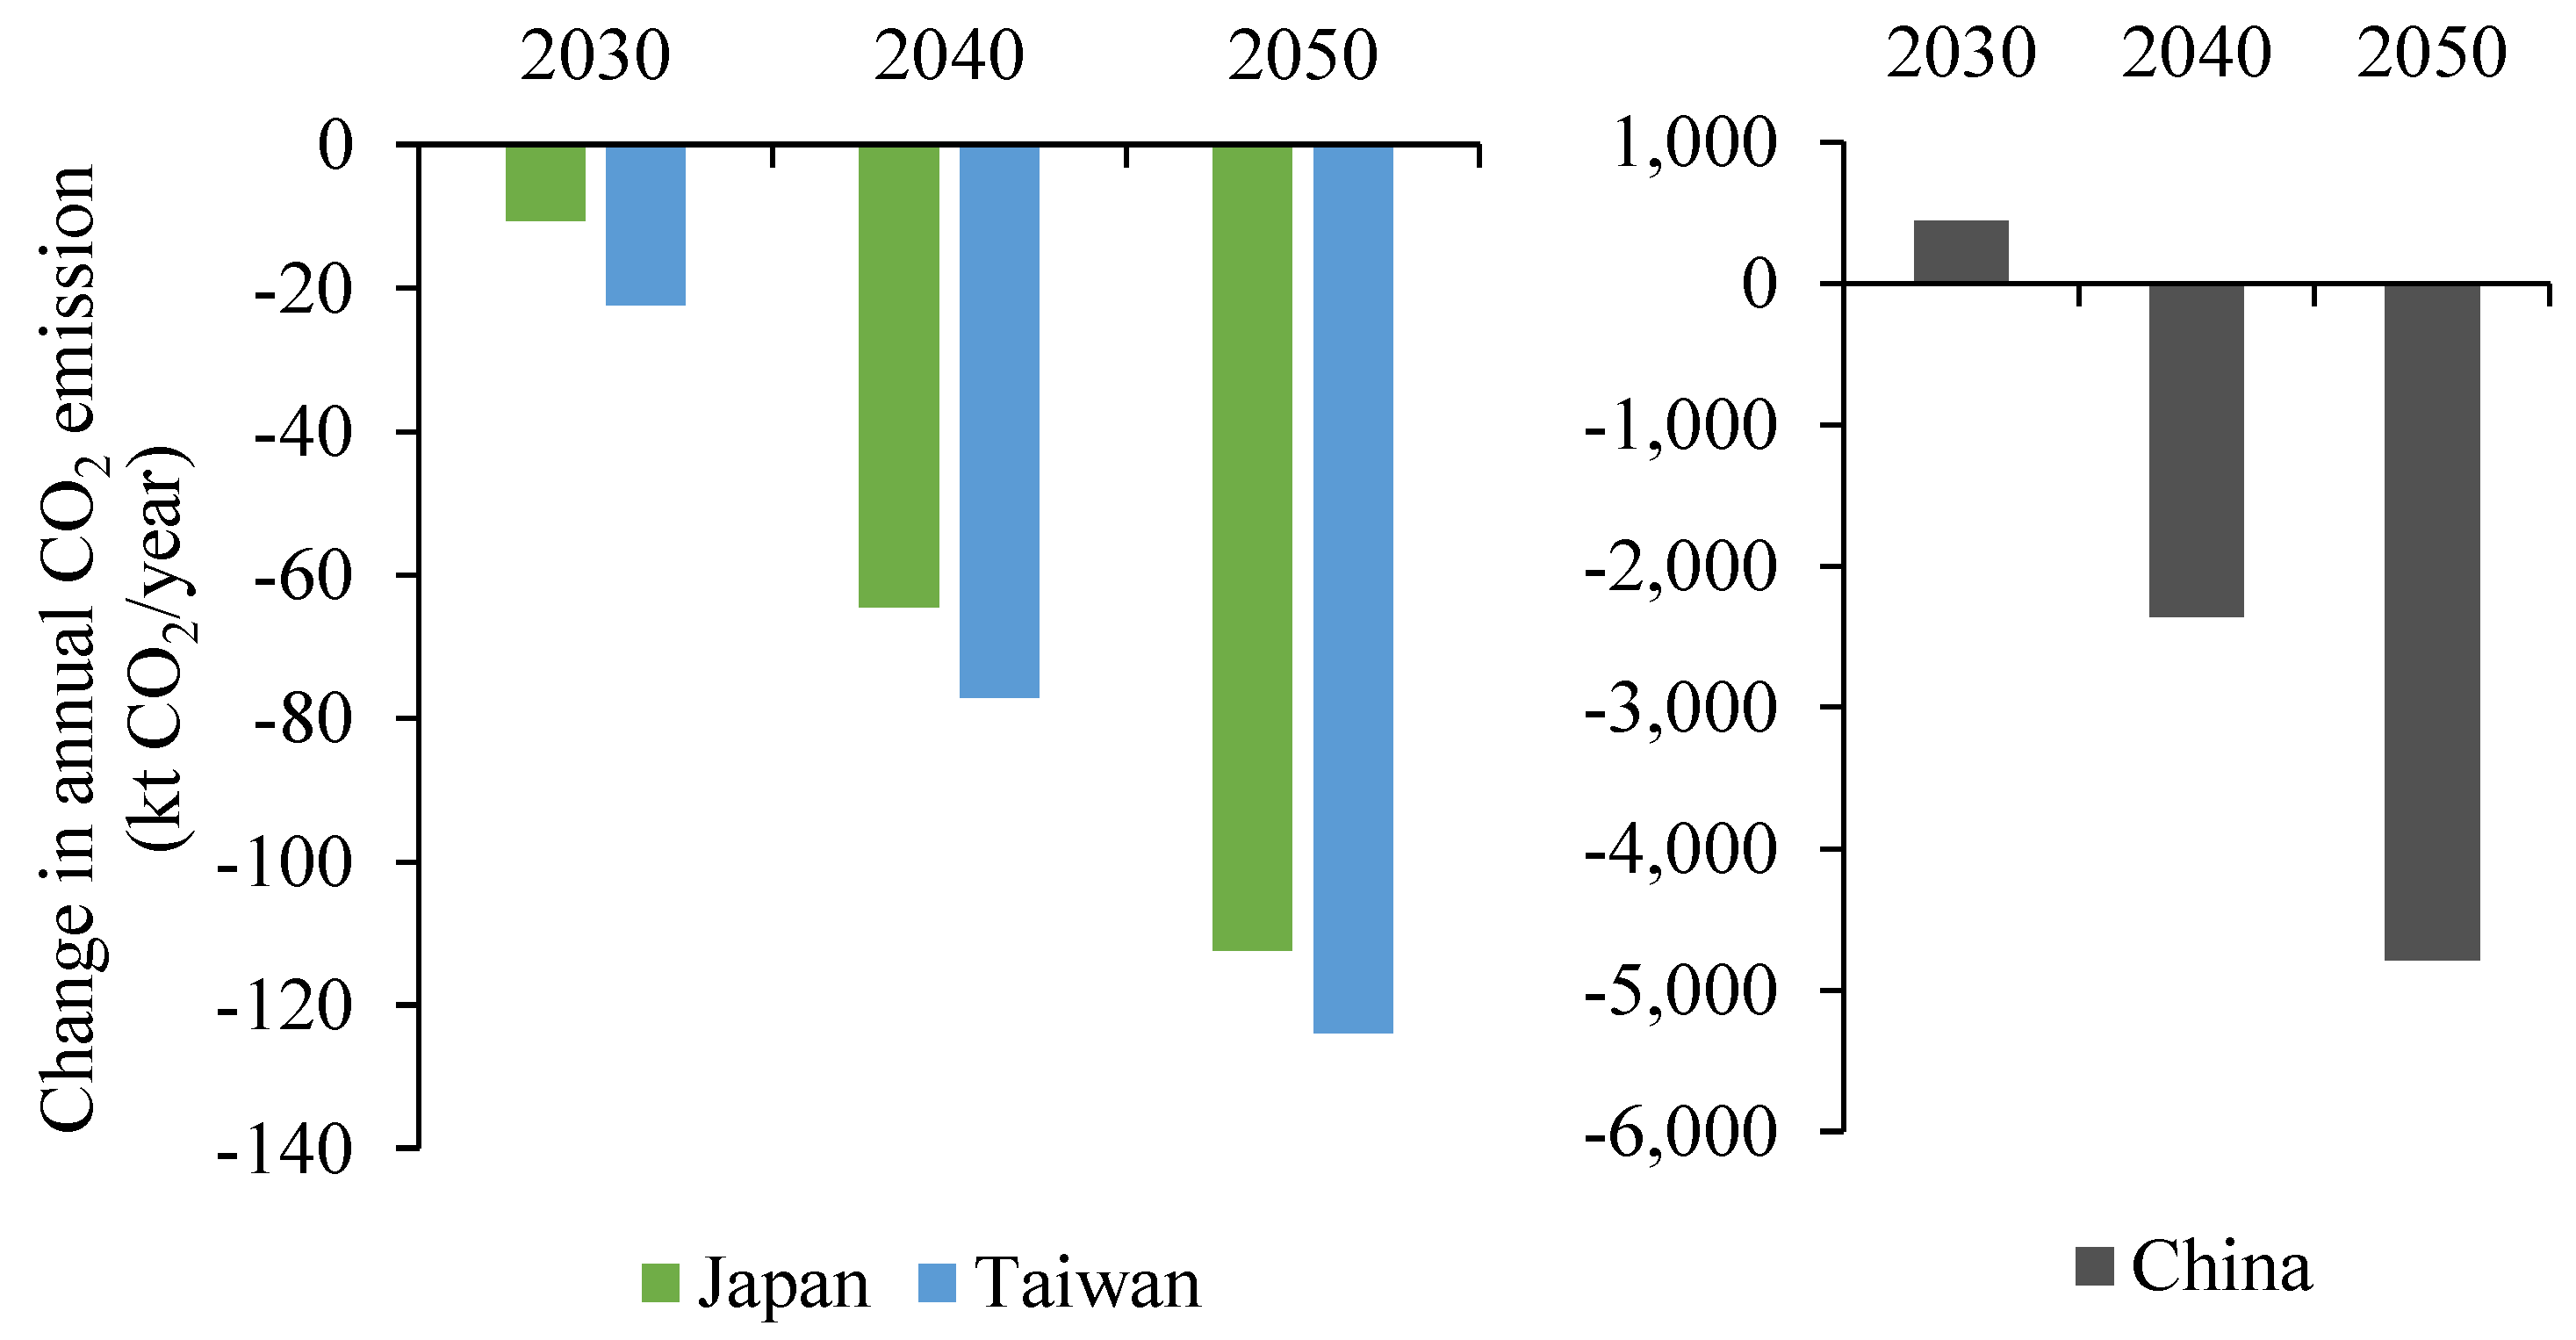
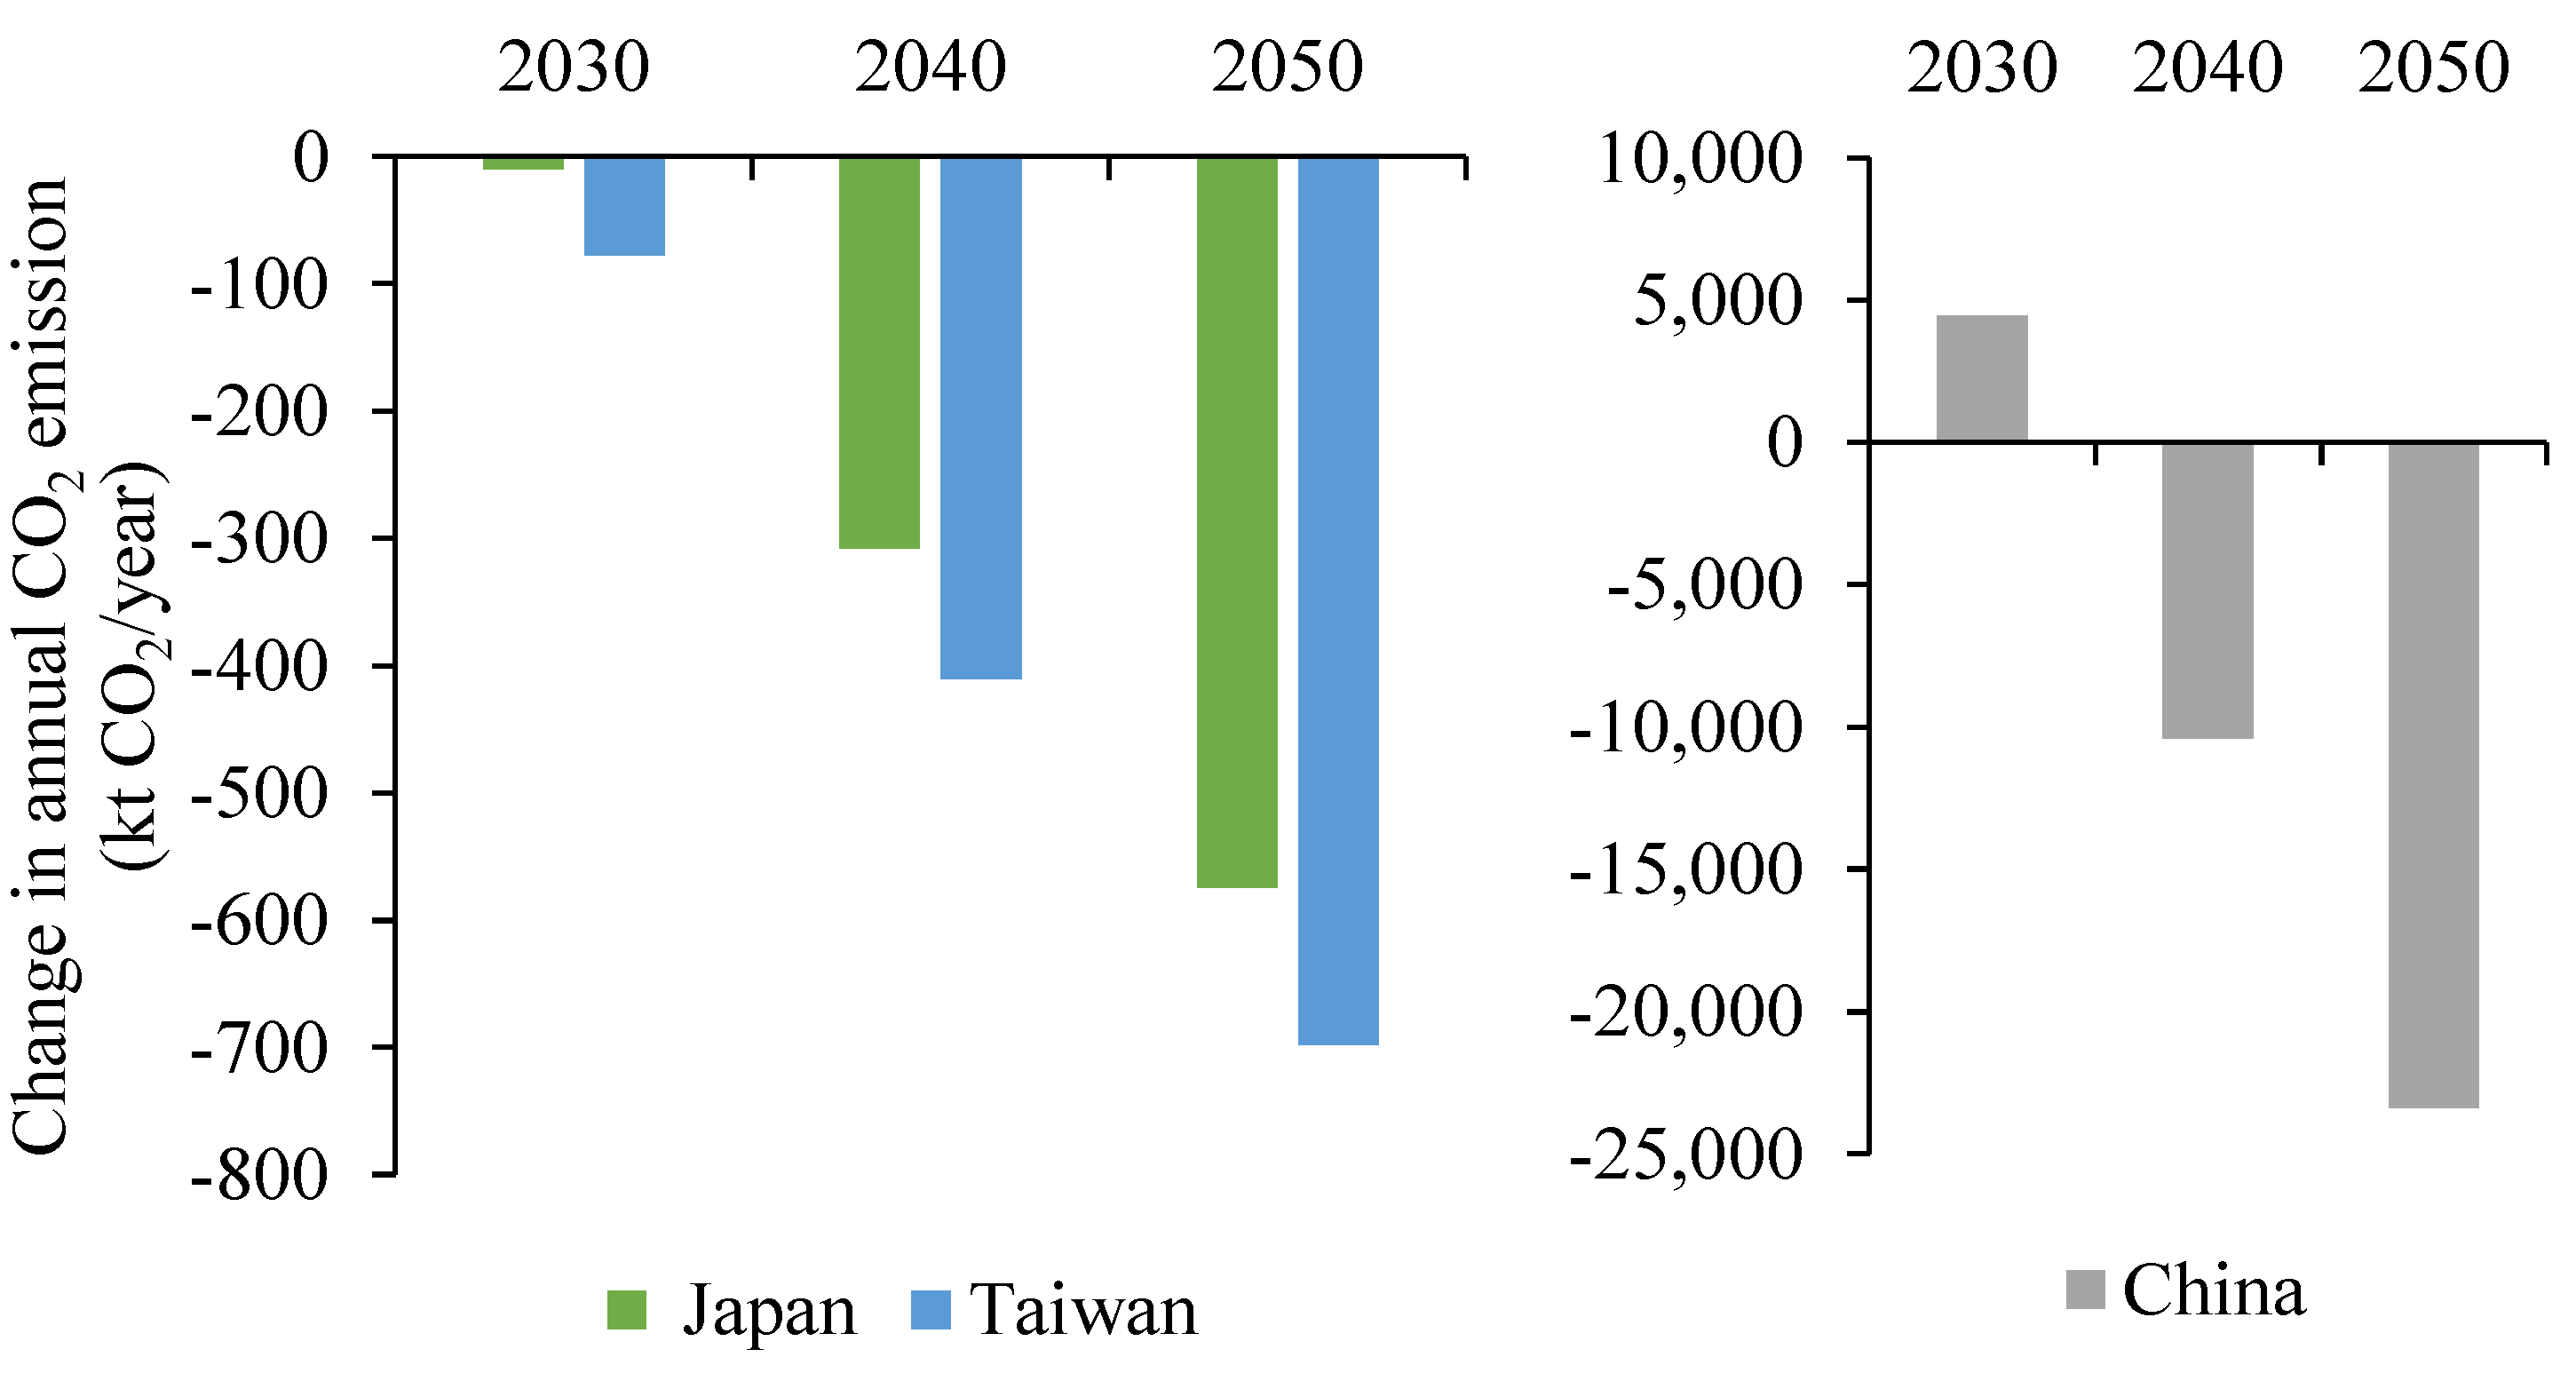
If the average national grid electricity is used, only electrification of the textile industry through industrial heat pumps can result in CO2 emissions reduction in 2030 in all three economies. Electrification of the seven wet processes can result in CO2 emissions reduction in 2030 in Japan and Taiwan, but not in China. This is because the average electricity grid emission intensity for China is high and the grid is not decarbonized enough to result in CO2 emissions reduction from the electrification of end-use processes despite the reduction in final energy use. However, electrification is projected to result in a substantial reduction in annual CO2 emissions in 2040 and 2050 under both electrification technology pathway scenarios. This is because of efficiency improvement and the assumed carbon neutrality in 2050 in China, Japan, and Taiwan. It is evident that electrification of industrial process heat has the potential to reduce CO2 emissions from the textile industry when the electricity grid is decarbonized enough, but the infrastructure and competing demands for renewable electricity resources pose challenges to realizing these reductions in China, Japan, and Taiwan.
In practice, electrification projects will be implemented at the plant level. If a given textile plant in any region electrifies its process heating demand today and purchases renewable electricity through a power purchase agreement, then the CO2 emissions reductions from electrification can be achieved immediately. Therefore, our country-level results should not be interpreted in a way that electrification cannot be beneficial now and we should wait until the electricity grid is decarbonized. However, in general, investing in the electricity grid and increasing the share of renewable energy in the power sector energy mix will help to accelerate industrial electrification and contribute to large quantities of CO2 emissions reduction.
The electricity grid is a complex, interconnected system linking generation resources to customers with varying and variable electricity needs. Electricity generation from renewable resources has increased over time in these three economies, but the electricity grid still has a very high carbon intensity in these countries. Managing the grid’s resources, infrastructure, and energy flows is a considerable undertaking that will continue to be complicated by trends toward more distributed generation resources, renewable resources, and electrification. Additional pressure will be placed on an already strained grid system as multiple sectors, including transportation and buildings in addition to industry, move to electrify to access renewable resources and reduce their emissions. To deliver electrification at scale, investments will be needed to build or upgrade key infrastructure, including renewable electricity production, energy transmission, and distribution networks, and end-user infrastructure [47].
Developing a coherent power sector strategy is essential to accelerate the pace of power sector decarbonization which is a prerequisite to beneficial electrification of industry. Utilities, policymakers, industry, and other stakeholders should pay attention to this potential increase in demand for renewable electricity, and the associated need for more renewable electricity generation, additional energy storage, demand response programs, transmission and distribution system expansion, and grid modernization. Ensuring that sufficient renewable resources are brought online and connected to demand centers will be critical to a smooth energy transition and rapid multisector electrification [47].
Furthermore, while there are numerous benefits to electrifying industrial processes, including reduced energy demand and emissions, barriers such as high electricity prices, lack of capital, inadequate energy supply infrastructure, etc., still inhibit the development and deployment of electrified technologies [8]. Hence, different stakeholders are required to work together to solve significant challenges in renewable electricity generation and transmission, technology development and deployment, and workforce development.
It is hence recommended that the textile industry initiates partnerships with academia, think tanks, and other stakeholders to develop or scale electrification technologies. Government should provide incentives for electrification technology development and demonstration. Government and utilities should provide financial incentives in the form of tax credits or grants for pilot projects and demonstration of emerging electrification technologies in the textile industry. The government in partnership with the industry should create or support an industrial electrification information dissemination platform. This should include the development and dissemination of case studies. Utilities should provide information about their electric rates, market structures, and grid upgrade implications of industrial electrification. The textile industry should provide training for employees and contractors about electrified technologies. Government and utilities should support such training programs. Government and utilities should work together to increase renewable electricity generation capacity and enhance the grid’s transmission and distribution capabilities in these three economies.

5. Conclusions

This paper aims to investigate the potential for electrification of process heating in the textile industry in China, Japan, and Taiwan. The two electrification technology pathways analyzed are (1) electrification through industrial heat pumps and (2) electrification through textile end-use processes. The potential energy savings, CO2 abatement, and costs for the two pathways have been quantified. The results show that the total potential final energy savings due to electrification in both the technology pathway scenarios could be substantially large. However, the results of the two pathways are not directly comparable because only seven end-use wet processes have been studied in the second pathway analysis. In addition, given the assumptions and limitations regarding energy intensities of the end-use electrified technologies in the second technology pathway analysis, the estimated annual potential energy savings can be considered rather conservative.
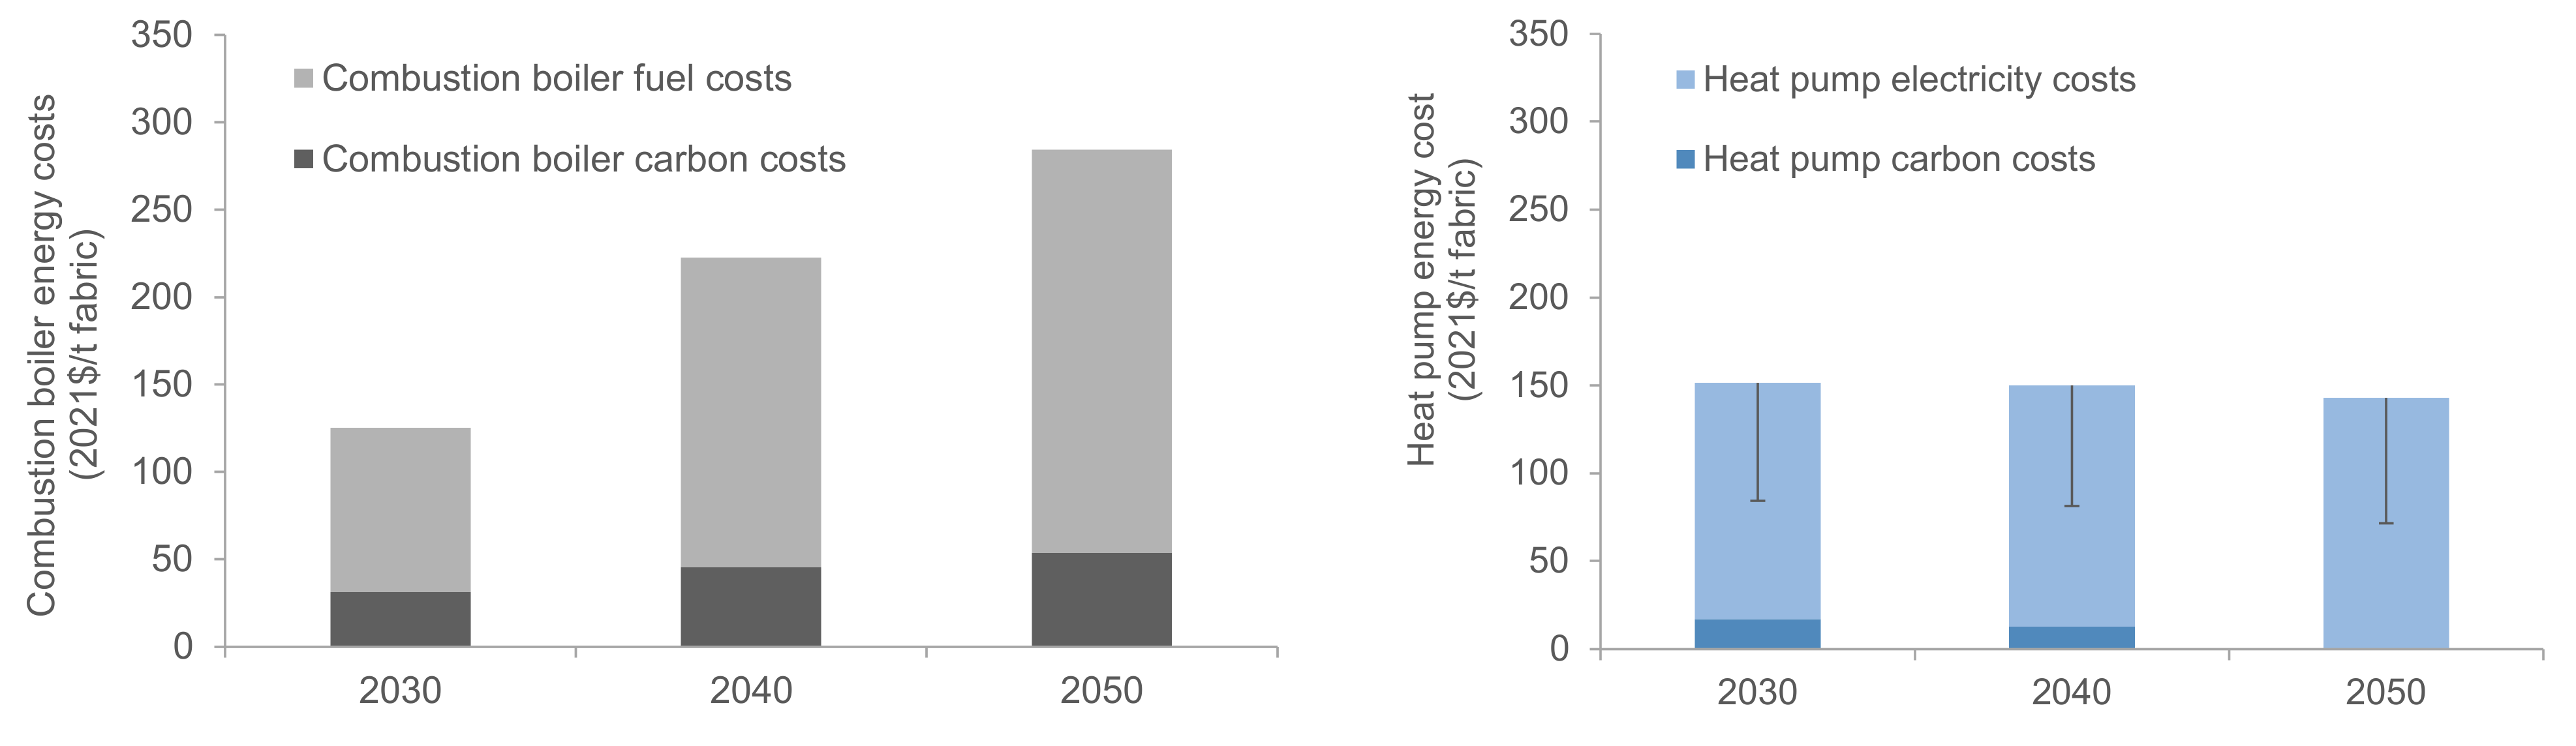
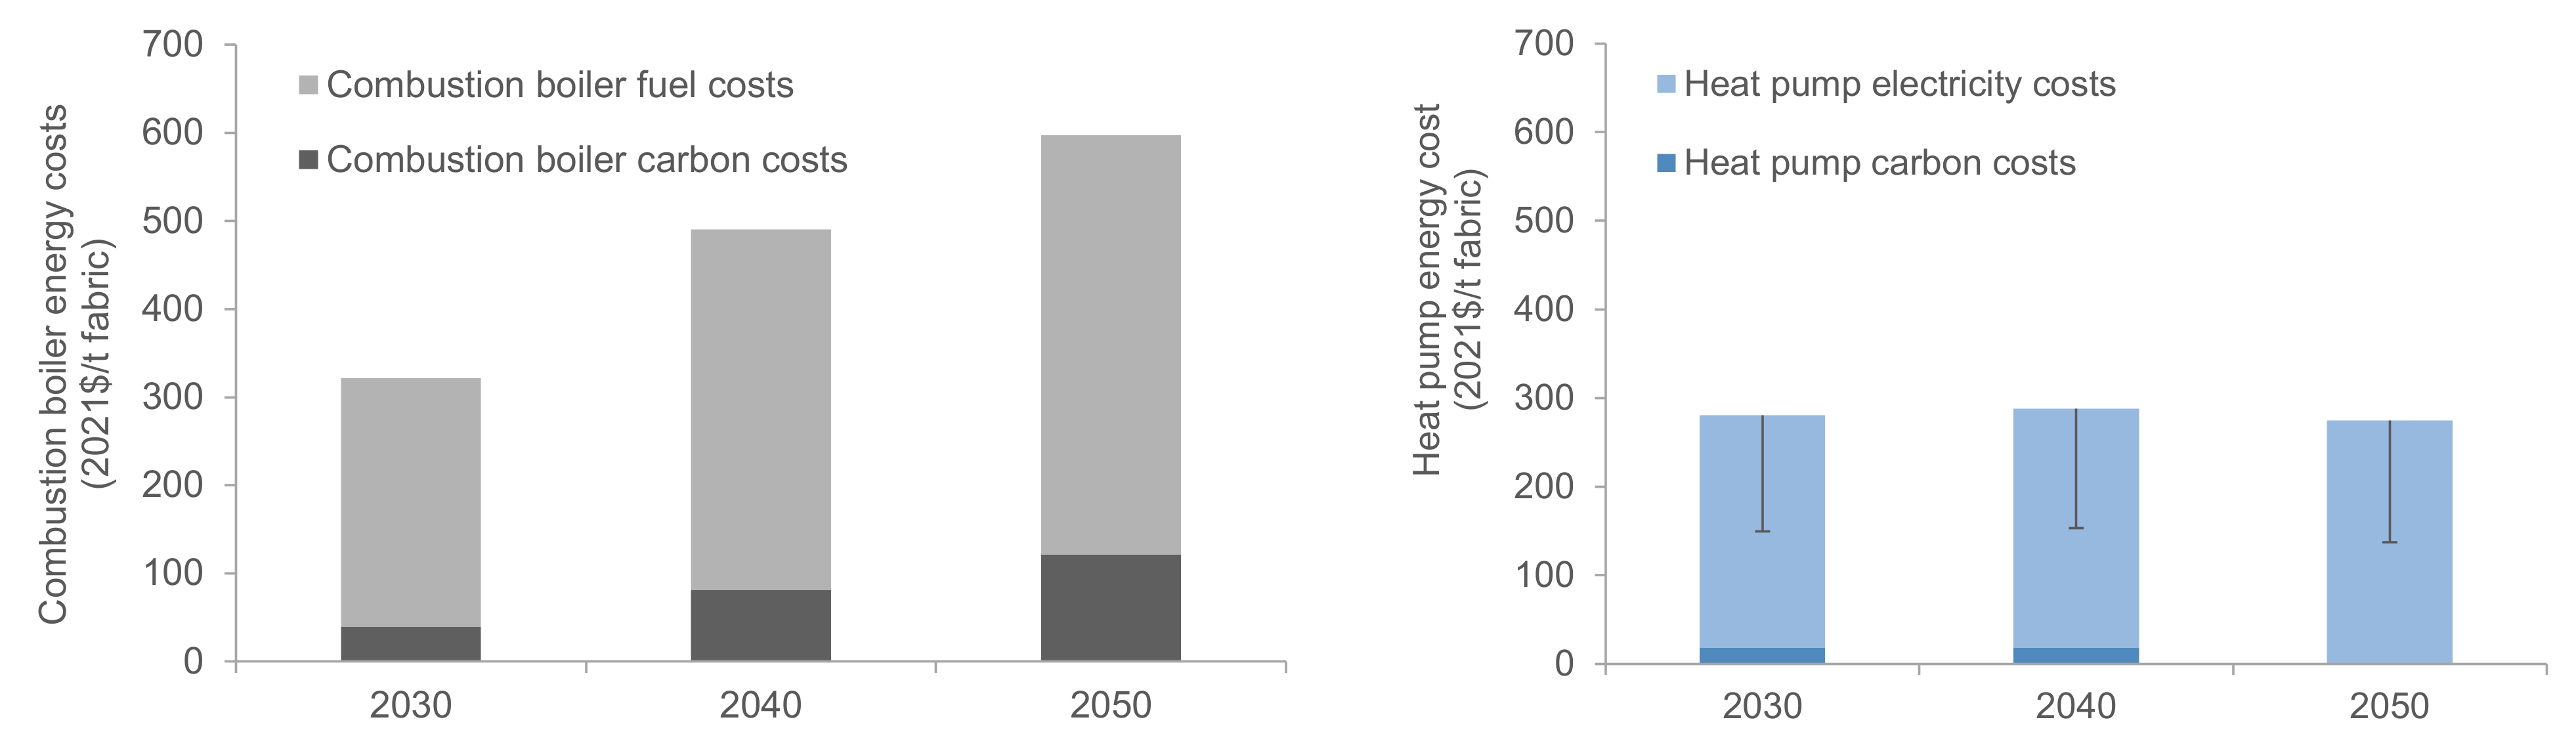
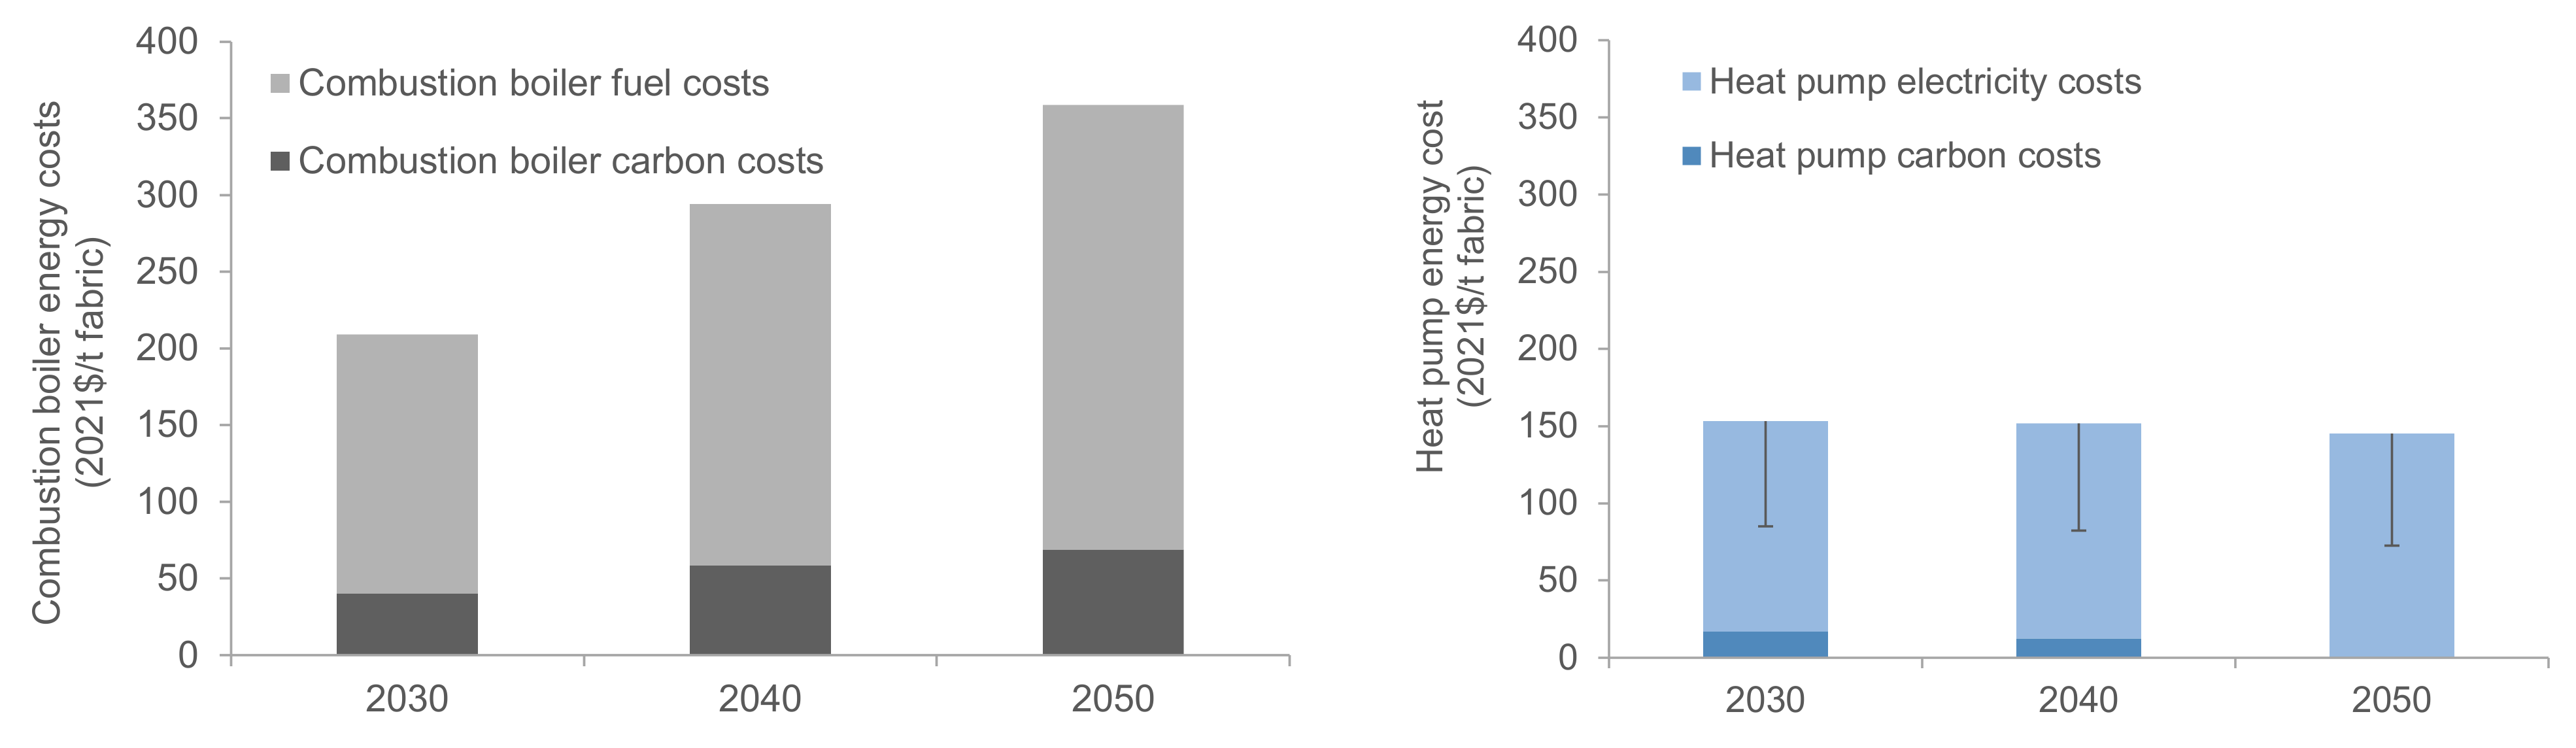
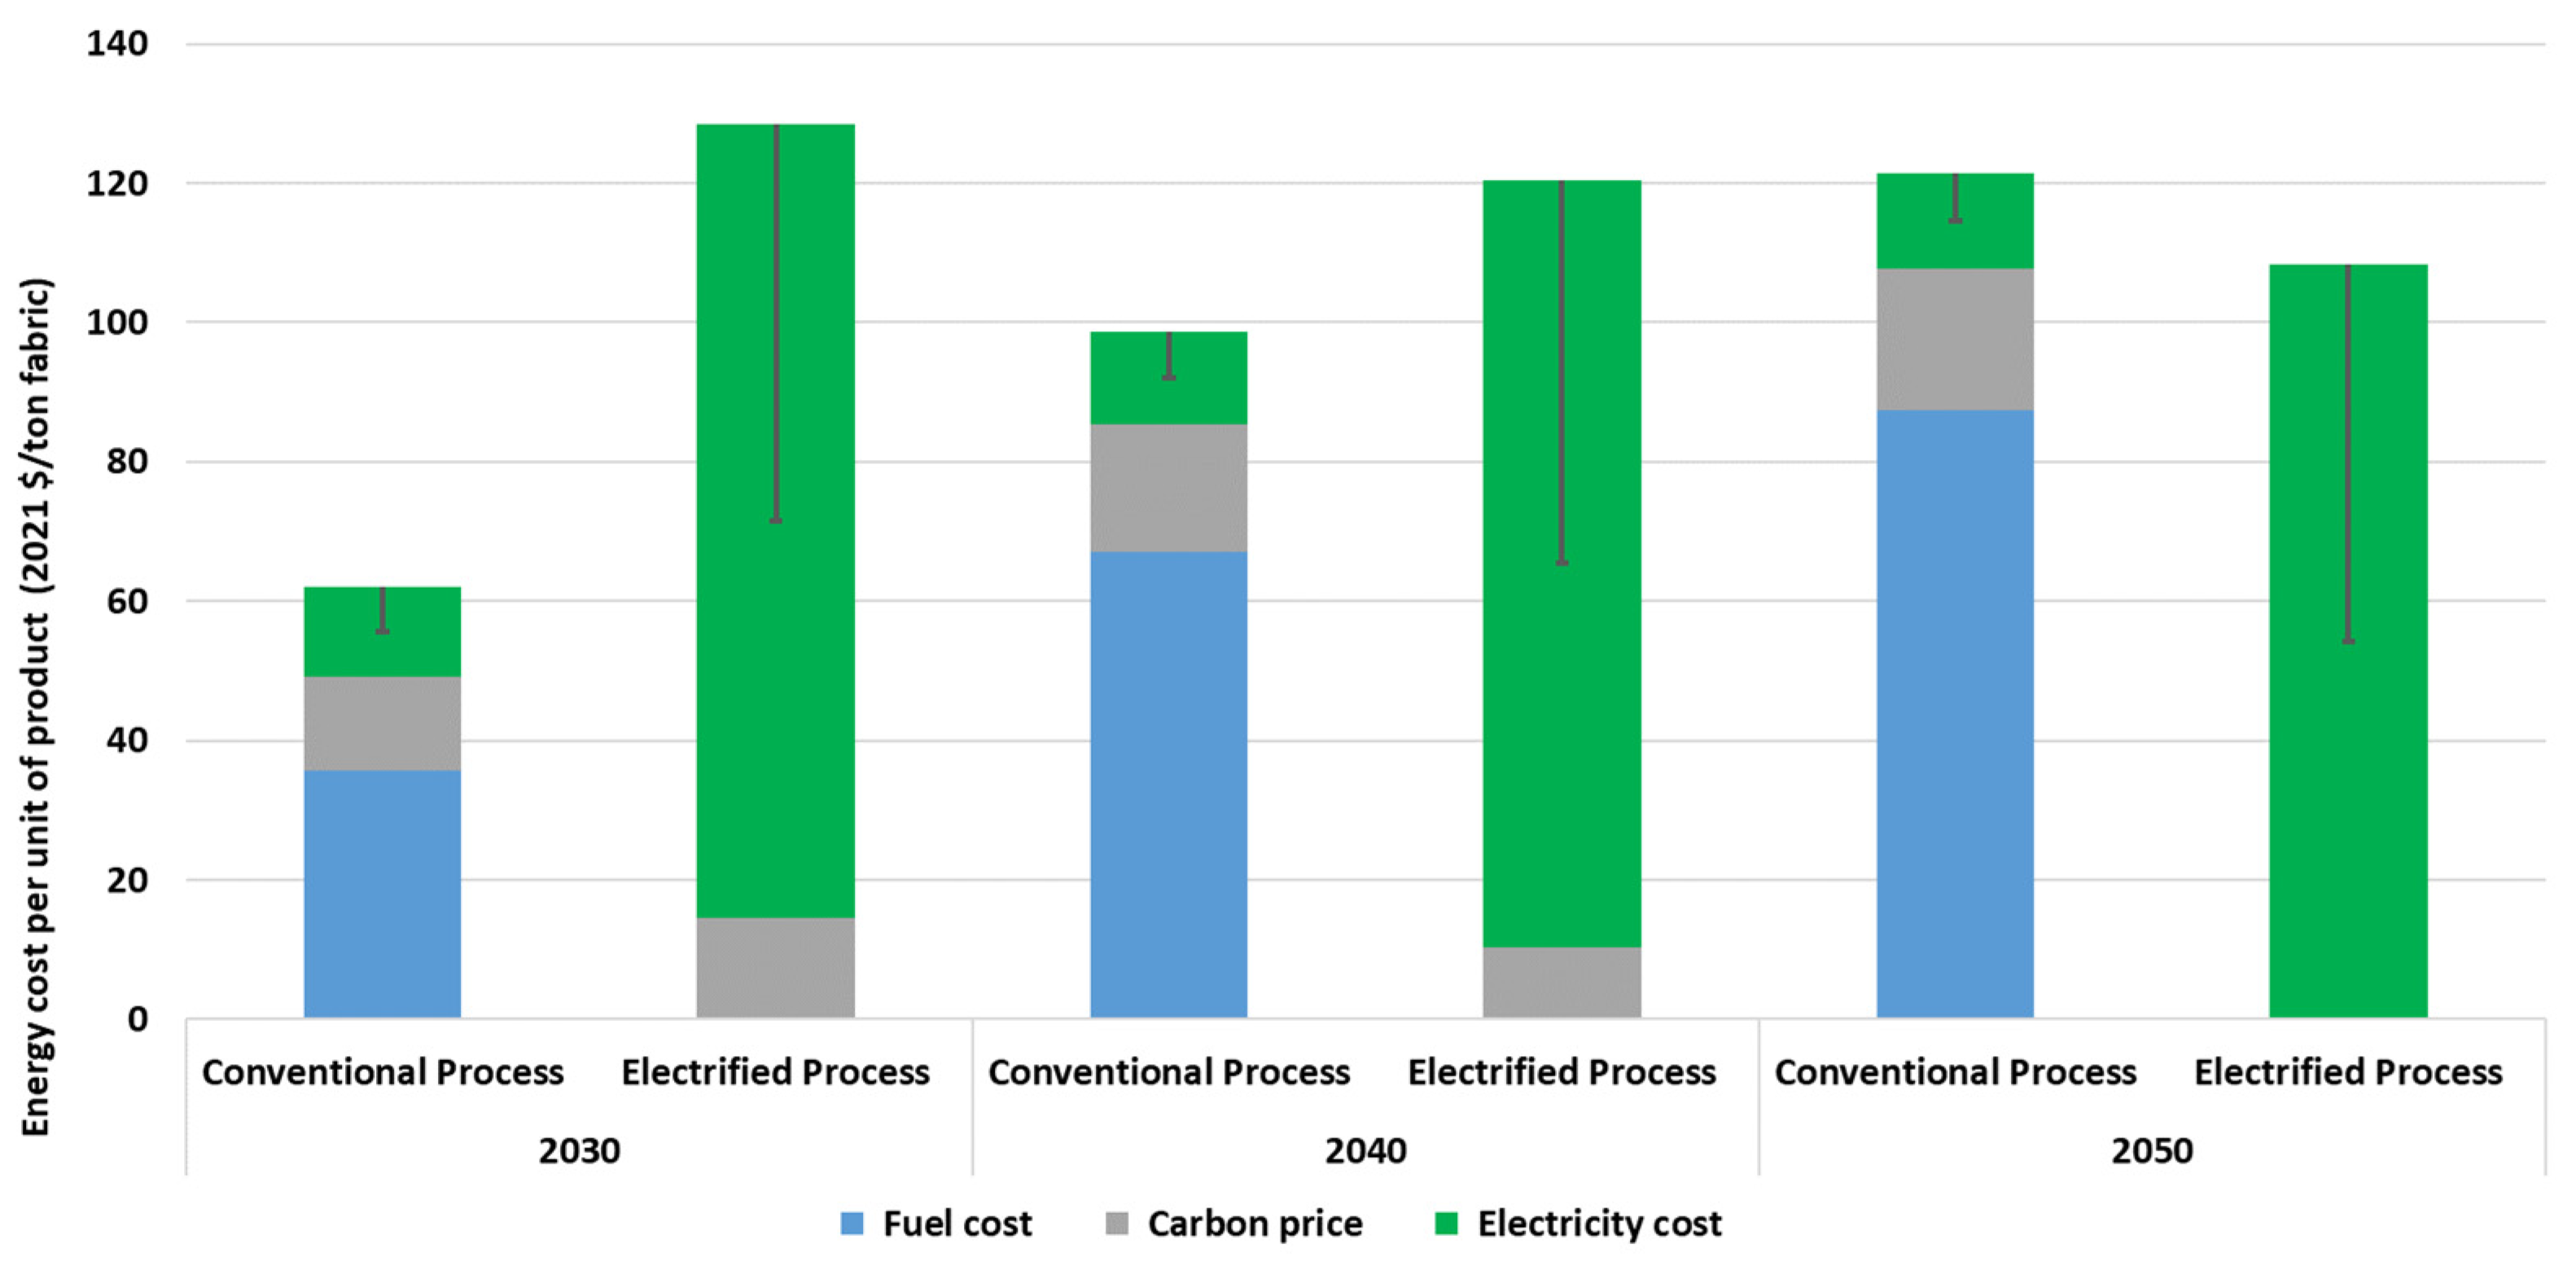
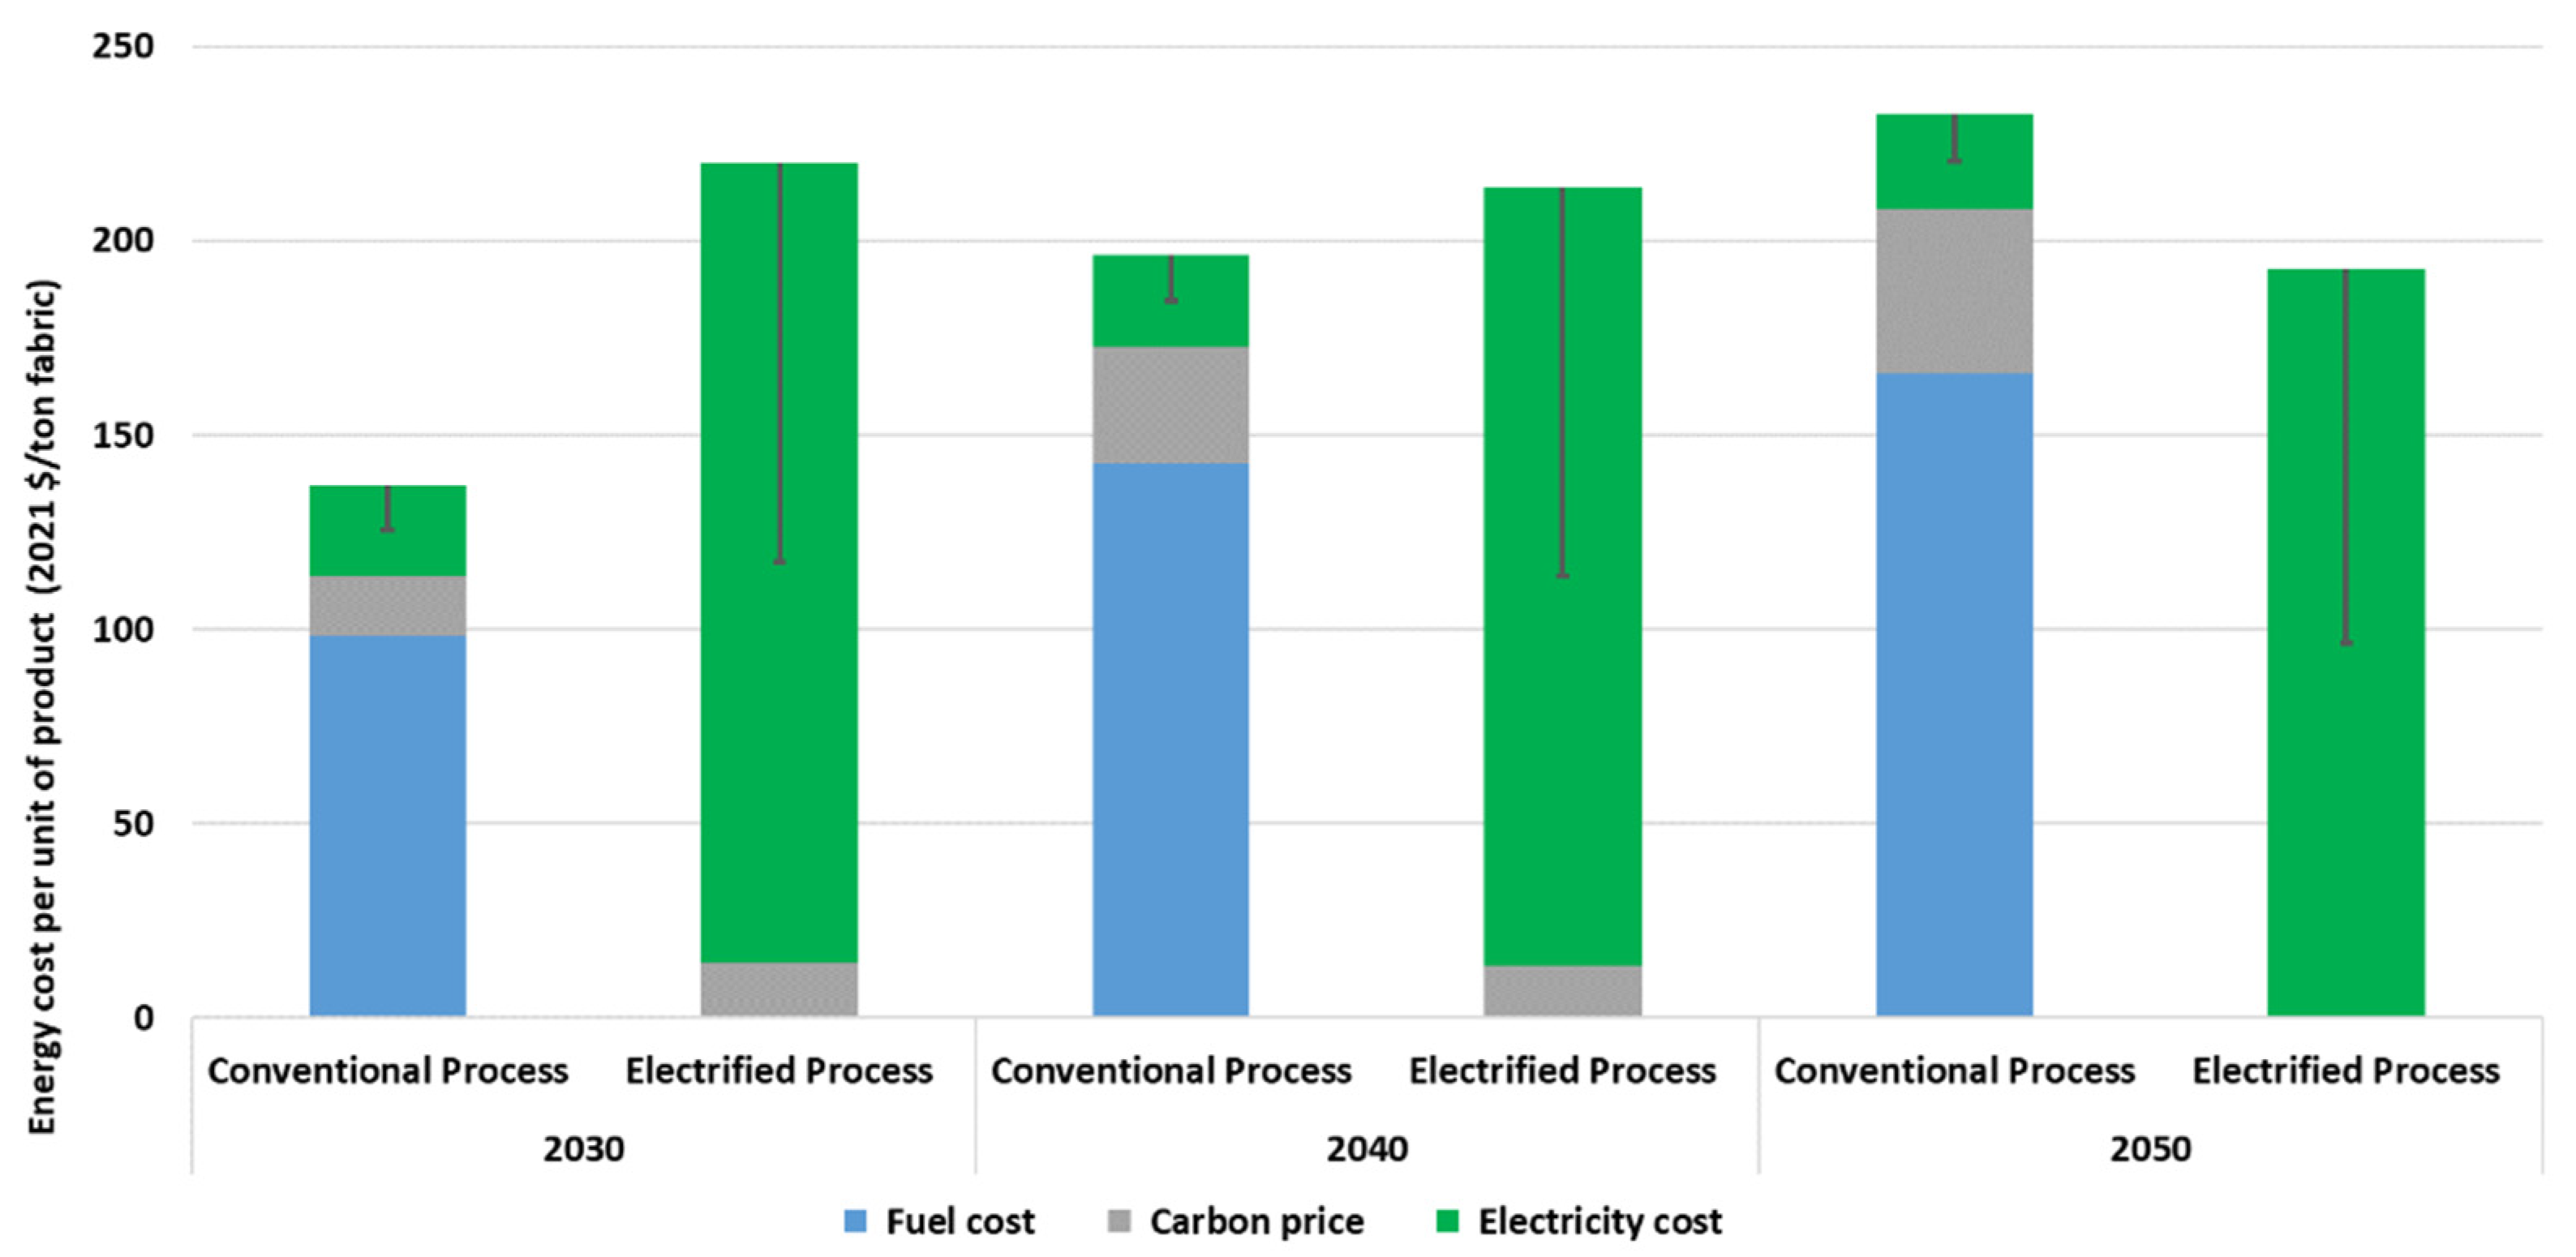
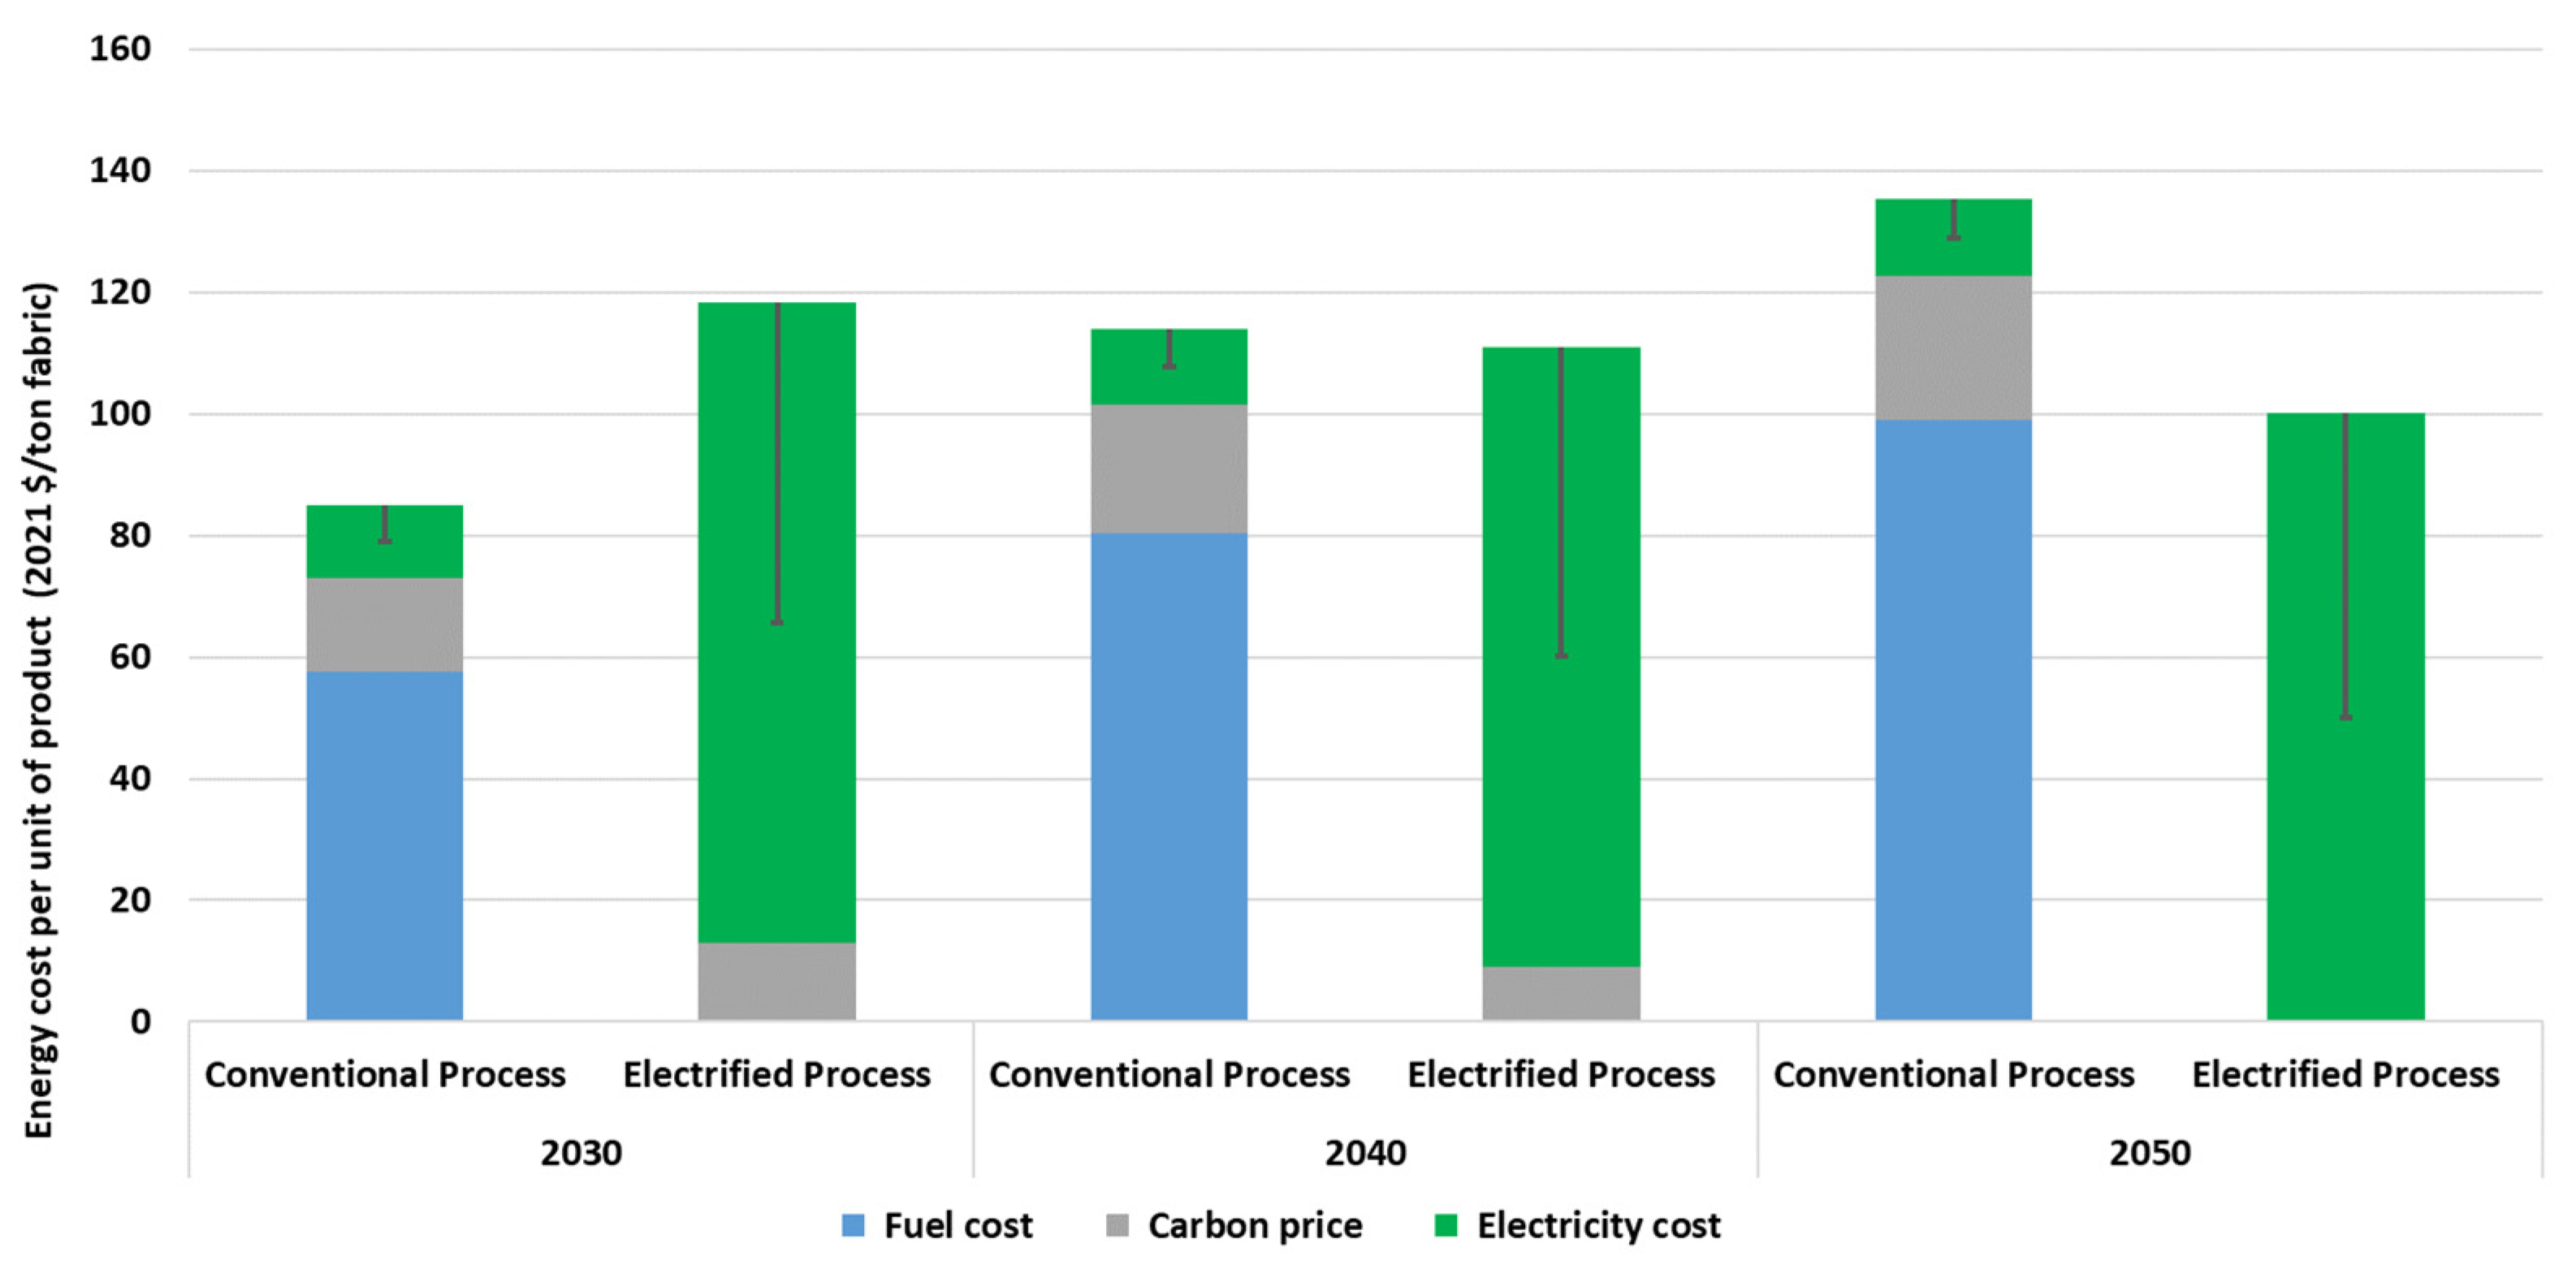
It is also concluded that the impact of the CO2 emissions resulting from the electrification is highly dependent on the carbon intensity of the electricity used with the electrified process. Furthermore, only in the case of industrial heat pumps, the costs per unit of production are found to be lower than the conventional systems. This is because heat pumps have high efficiency and will result in substantial overall final energy savings compared to existing technologies. For the second technology pathway, the electrified processes have higher energy costs per unit of production compared to the conventional process in the near term. However, under both pathways, the electrified processes have a lower energy cost in 2050 compared to conventional systems.
Despite the numerous benefits of electrifying thermal processes in the textile wet-processing industry, including reduced energy demand and emissions, barriers still inhibit the development and deployment of electrified technologies. To overcome the barriers, this paper provides recommendations that will require all stakeholders to work together to solve significant challenges including renewable electricity generation and distribution, technology improvements and deployment, workforce development, economic feasibility, etc. It is further concluded that wide-scale electrification of process heating in the textile wet- processing industry will require major changes to the electricity system and individual sites in China, Japan, and Taiwan, and the coordination efforts among different stakeholders to plan these changes must be intensified as early as possible.

Author Contributions

The CRediT author roles are as follows: A.H.: Conceptualization, Methodology, Data Curation, Project administration, Funding acquisition, Resources, Formal analysis, Visualization, Writing—Original Draft; M.J.S.Z.: Conceptualization, Methodology, Data Curation, Resources, Visualization, Writing—Review and Editing. All authors have read and agreed to the published version of the manuscript.

Funding

This paper is made possible with the support from Patagonia (the main funder; under contract ID: 997AE4F1-D7E2-45FC-B1D9-DDC0C02BC175) and supplemental funding contributions from (in no particular order) the Outdoor Industry Association, REI, New Balance, Burton, and Gore.

Data Availability Statement

Not Applicable.

Acknowledgments

The authors would like to thank Kim Drenner of Patagonia, Sarah Rykal and Amy Horton of the Outdoor Industry Association, Markus Wieser of Gore, Matthew Thurston, Evan Scandling, and Lyn Ip of REI, John Stokes of New Balance, Emily Foster of Burton, Linda Greer, Azizul Hoque of Global Efficiency Intelligence, Bryant LaPres of Apparel Impact Institute, Fu Wei Tsao and Hwong-when Ma from National Taiwan University, and Hongyou Lu and William Morrow from Lawrence Berkeley National Laboratory for their valuable input to this study and/or their insightful comments on the earlier version of this document. The views expressed by the authors do not necessarily reflect the views of any of the organizations and/or individuals.

Conflicts of Interest

The authors declare no conflict of interest.

References

  1. Kim, J.-O.; Traore, M.K.; Warfield, C. The Textile and Apparel Industry in Developing Countries. Text. Prog. 2006, 38, 1–64. [Google Scholar] [CrossRef]
  2. Hasan, K.M.F.; Mia, M.S.; Ashaduzzaman; Rahman, M.M.; Ullah, A.N.M.A.; Ullah, M.S. Role of Textile and Clothing Industries in the Growth and Development of Trade & Business Strategies of Bangladesh in the Global Economy. Int. J. Text. Sci. 2016, 5, 39–48. [Google Scholar]
  3. World Trade Organization. World Trade Statistical Review; World Trade Organization: Geneva, Switzerland, 2021; Available online: https://www.wto.org/english/res_e/statis_e/wts2021_e/wts21_toc_e.htm (accessed on 13 October 2022).
  4. Yin, W.; Xu, B. Effect of Online Shopping Experience on Customer Loyalty in Apparel Business-to-Consumer Ecommerce. Text. Res. J. 2021, 91, 2882–2895. [Google Scholar] [CrossRef]
  5. Patwary, S. Clothing and Textile Sustainability: Current State of Environmental Challenges and the Ways Forward. Text. Leather Rev. 2020, 3, 158–173. [Google Scholar] [CrossRef]
  6. Sadowski, M.; Perkins, L.; McGarvey, E. Roadmap to Net Zero: Delivering Science-Based Targets in the Apparel Sector; World Resources Institute: Washington, DC, USA, 2021. [Google Scholar]
  7. Pulat, E.; Etemoglu, A.B.; Can, M. Waste-Heat Recovery Potential in Turkish Textile Industry: Case Study for City of Bursa. Renew. Sustain. Energy Rev. 2009, 13, 663–672. [Google Scholar] [CrossRef]
  8. Hasanbeigi, A.; Kirshbaum, L.A.; Collison, B.; Gardiner, D. Electrifying U.S. Industry: Technology and Process-Based Approach to Decarbonization; Global Efficiency Intelligence: St. Petersburg, FL, USA, 2021. [Google Scholar]
  9. Zuberi, M.J.S.; Hasanbeigi, A.; Morrow, W.R. Electrification of Boilers in U.S. Manufacturing; Lawrence Berkeley National Laboratory: Berkeley, CA, USA, 2021.
  10. Zuberi, M.J.S.; Hasanbeigi, A.; Morrow, W. Bottom-up Assessment of Industrial Heat Pump Applications in U.S. Food Manufacturing. Energy Convers. Manag. 2022, 272, 116349. [Google Scholar] [CrossRef]
  11. Kosmadakis, G. Estimating the Potential of Industrial (High-Temperature) Heat Pumps for Exploiting Waste Heat in EU Industries. Appl. Therm. Eng. 2019, 156, 287–298. [Google Scholar] [CrossRef]
  12. Seck, G.S.; Guerassimoff, G.; Maïzi, N. Heat Recovery with Heat Pumps in Non-Energy Intensive Industry: A Detailed Bottom-up Model Analysis in the French Food & Drink Industry. Appl. Energy 2013, 111, 489–504. [Google Scholar] [CrossRef]
  13. Elshemy, N.; Haggag, K. New Trend in Textile Coloration Using Microwave Irradiation. J. Text. Color. Polym. Sci. 2019, 16, 33–48. [Google Scholar] [CrossRef]
  14. Beyond Zero Emissions. Zero Carbon Industry Plan: Electrifying Industry; Beyond Zero Emissions: Melbourne, Australia, 2018. [Google Scholar]
  15. Ratti, C.; Mujumdar, A.S. Infrared Drying. In Handbook of Industrial Drying; CRC Press: Boca Raton, FL, USA, 1995; ISBN 978-0-429-28977-4. [Google Scholar]
  16. IEA World Energy Statistics. 2020. Available online: https://www.iea.org/data-and-statistics/data-product/world-energy-statistics (accessed on 13 October 2022).
  17. Hasanbeigi, A. Energy-Efficiency Improvement Opportunities for the Textile Industry; Lawrence Berkeley National Laboratory: Berkeley, CA, USA, 2010.
  18. U.S. DOE. Industrial Heat Pumps for Steam and Fuel Savings; U.S. DOE: Washington, DC, USA, 2003.
  19. Schlosser, F.; Arpagaus, C.; Walmsley, T.G. Heat Pump Integration by Pinch Analysis for Industrial Applications: A Review. Chem. Eng. Trans. 2019, 76, 7–12. [Google Scholar] [CrossRef]
  20. Rightor, E.; Scheihing, P.; Hoffmeister, A.; Papar, R. Industrial Heat Pumps: Electrifying Industry’s Process Heat Supply with Industrial Heat Pumps; ACEEE: Washington, DC, USA, 2022. [Google Scholar]
  21. Marina, A.; Spoelstra, S.; Zondag, H.A.; Wemmers, A.K. An Estimation of the European Industrial Heat Pump Market Potential. Renew. Sustain. Energy Rev. 2021, 139, 110545. [Google Scholar] [CrossRef]
  22. Groz-Beckert. The Fabric Year 2017; Groz-Beckert: Albstadt, Germany, 2017. [Google Scholar]
  23. Benkhaya, S.; M’rabet, S.; El Harfi, A. A Review on Classifications, Recent Synthesis and Applications of Textile Dyes. Inorg. Chem. Commun. 2020, 115, 107891. [Google Scholar] [CrossRef]
  24. Nassif, N.A.A. Effect of Different Wet Processing Stages on Physical Properties of Cotton Woven Fabrics. Fibres Text. 2019, 4, 13–18. [Google Scholar]
  25. Wadje, P.R. Textile—Fibre to Fabric Processing. J. Inst. Eng. Part TX Text. Eng. Div. 2009, 90, 28–36. [Google Scholar]
  26. Tusief, M.Q.; Amin, N.; Mahmood, N.; Iqbal, W. Tensile Properties of Cotton Yarn as Affected by Different Yarn Singeing Machine Variables. Pak. J. Sci. Ind. Res. Ser. A Phys. Sci. 2014, 57, 172–176. [Google Scholar] [CrossRef]
  27. Samaterials. Equal Diameter Silicon Carbide Heating Rods. Available online: https://www.samaterials.com/silicon-carbon-rods/1763-equal-diameter-silicon-carbon-sic-heating-rods.html (accessed on 14 October 2022).
  28. Lei, M.; Lan, Z.W. Electric Heat Multi-Core Type Contact Type Singeing Frame. CN Patent CN1560350A, 2 March 2004. [Google Scholar]
  29. Lin, L.; Jiang, T.; Liang, Y.; Zhu, W.; Inamdar, U.Y.; Pervez, M.N.; Navik, R.; Yang, X.; Cai, Y.; Naddeo, V. Combination of Pre- and Post-Mercerization Processes for Cotton Fabric. Materials 2022, 15, 2092. [Google Scholar] [CrossRef] [PubMed]
  30. Sonotronic. Ultrasonic Washing. Available online: https://sonotronic.de/en/technologies/ultrasonic/ultrasonic-washing/ (accessed on 14 October 2022).
  31. Kerone. Infrared Heating and Drying for Textiles. 2020. Available online: http://kerone.com/blog/infrared-heating-and-drying-for-textiles/ (accessed on 13 November 2022).
  32. Ansal. Textile Dryers. Available online: http://www.textiledryer.com/blog/plufix (accessed on 14 October 2022).
  33. Istook, C.L. Strategies for Heat Setting in Textile Industry. J. Text. Sci. Eng. 2022, 12, 467. [Google Scholar] [CrossRef]
  34. Karmakar, S.R. Chemical Technology in the Pre-Treatment Processes of Textiles; Elsevier: Amsterdam, The Netherlands, 1999; ISBN 978-0-08-053947-8. [Google Scholar]
  35. Brückner. Power Frame Stenter for Textile. Available online: https://www.brueckner-textile.com/en/products/eco-technologies.html (accessed on 14 October 2022).
  36. Yamuna. Stenter: The Fine Art of Finishing. Available online: https://www.yamunamachine.com/stenter.php (accessed on 14 October 2022).
  37. Zhejiang. Hot Air Stenter. Available online: https://www.hotairstenter.com/product/hot-air-stenter.html (accessed on 14 October 2022).
  38. Virock Stenter. Heat Setting. Available online: http://www.virock.com/en/Product/STENTER_HEAT_SETTING_MACHINE/For_woven/201508/45.html (accessed on 14 October 2022).
  39. Elitex Finishing. Electric Heating for the Elitex Stenter. Available online: http://en.elitexfinishing.cz/products/modernization/electric-heating-for-the-elitex-stenter (accessed on 14 October 2022).
  40. Monforts. Excellent in Dyeing and Finishing. Available online: https://www.ategroup.com/wp-content/uploads/brochures/Thermex-V1.PDF (accessed on 14 October 2022).
  41. Galoppi, G.; Ferrari, L.; Ferrara, G.; Antonio Carnevale, E. Experimental Investigation on Industrial Drying Process of Cotton Yarn Bobbins: Energy Consumption and Drying Time. Energy Procedia 2017, 126, 361–368. [Google Scholar] [CrossRef]
  42. Stalam. Radio Frequency Equipment. Available online: https://www.ategroup.com/wp-content/uploads/brochures/Stalam-RF-drier-Leaflet.pdf (accessed on 14 October 2022).
  43. Fabern Radiofrequency Dryer. Yarn Dyeing Package Yarn Radio Frequency. Available online: https://fabern.en.made-in-china.com/product/KZIExBhGOtkm/China-Radio-Frequency-Dryer-Yarn-Dyeing-Package-Yarn-Radio-Frequency-Dryer.html (accessed on 14 October 2022).
  44. RF Systems. Radiofrequency Equipment. Available online: https://www.leclairmeert.be/files/7414/5260/4475/Textile_Catalogues.pdf (accessed on 14 October 2022).
  45. Japan Electric Power Information Center (JEPIC). The Electric Power Industry in Japan. Available online: https://www.jepic.or.jp/pub/pdf/epijJepic2022.pdf (accessed on 14 October 2022).
  46. U.S. EIA. International—China. Available online: https://www.eia.gov/international/analysis/country/CHN (accessed on 14 October 2022).
  47. Hasanbeigi, A.; Kirshbaum, L.A.; Collison, B. Industrial Electrification: An Industrial Subsector- and State-Level Analysis; Global Efficiency Intelligence, LLC & David Gardiner and Associates: St. Petersburg, FL, USA; Arlington, VA, USA, 2022. [Google Scholar]
Figure 1. Top 10 exporters of textiles in 2020 (Data source: [3]).
Energies 15 08939 g001
Figure 2. Fuel and electricity used in the textile industry in China, Japan, and Taiwan in 2019 (absolute values are in PJ) (Data source: [16]).
Energies 15 08939 g002
Figure 3. Breakdown of typical electricity and thermal energy used in a composite textile plant [17].
Energies 15 08939 g003
Figure 4. Schematic of typical woven fabric wet-processing operations [17].
Energies 15 08939 g004
Figure 5. Methodology steps to estimate electrification potential in textile processes.
Energies 15 08939 g005
Figure 6. Industrial heat pump applications for textile wet-processing.
Energies 15 08939 g006
Figure 7. Annual final energy demand in the textile wet-processing industry in China.
Energies 15 08939 g007
Figure 8. Annual final energy demand in the textile wet-processing industry in Japan.
Energies 15 08939 g008
Figure 9. Annual final energy demand in the textile wet-processing industry in Taiwan.
Energies 15 08939 g009
Figure 10. Annual CO2 emissions from the textile wet-processing industry in China.
Energies 15 08939 g010
Figure 11. Annual CO2 emissions from the textile wet-processing industry in Japan.
Energies 15 08939 g011
Figure 12. Annual CO2 emissions from the textile wet-processing industry in Taiwan.
Energies 15 08939 g012
Figure 13. Energy costs per unit of production for the textile wet-processing industry in China.
Energies 15 08939 g013
Figure 14. Energy costs per unit of production for the textile wet-processing industry in Japan.
Energies 15 08939 g014
Figure 15. Energy costs per unit of production for the textile wet-processing industry in Taiwan.
Energies 15 08939 g015
Figure 16. Total annual final energy savings after electrification of the dyeing process.
Energies 15 08939 g016
Figure 17. Total change in annual CO2 emissions after electrification of the dyeing process.
Energies 15 08939 g017
Figure 18. Energy cost per unit of production for conventional and electrified dyeing process in China.
Energies 15 08939 g018
Figure 19. Energy cost per unit of production for conventional and electrified dyeing process in Japan.
Energies 15 08939 g019
Figure 20. Energy cost per unit of production for conventional and electrified dyeing process in Taiwan.
Energies 15 08939 g020
Figure 21. Total combined annual energy saving after electrification of all seven studied textile wet processes.
Energies 15 08939 g021
Figure 22. Total combined change in annual CO2 emission after electrification of all seven studied textile wet processes.
Energies 15 08939 g022
Table 1. Typical process steam temperatures for industrial heat pump applications (Data source [17]).
ProcessSteam Temperature (°C)Heat Intensities
kJ/kg prod.
Desizing1202.0
Scouring1203.6
Mercerizing & Washing1201.7
Bleach & Wash/rinse1203.4
Drying1503.3
Dyeing & Washing1505.9
Printing1504.0
Finishing (Pad-dry-cure)1202.2
Dry & frame1503.4
Table 3. Electricity grid’s CO2 emission factor (kg CO2/MWh).
Country2021203020402050
China6144092050
Japan4873251620
Taiwan5483651830
Note: Values for 2021 are from IEA [16]. For the projections, we assumed the 2050 grid emissions factor as zero and assumed a linear reduction between 2021 and 2050.
Table 6. The CO2 intensity of the conventional and electrified dyeing process.
CountryCO2 Intensity (kg CO2/t Finished Fabric)
ConventionalElectrified
2021203020402050203020402050
China4874494103684832290
Japan4404183963753831810
Taiwan5465084704284312040
Table 7. Annual final energy savings after electrification of the end-use processes.
Process StepAnnual Final Energy Savings (TJ)
ChinaJapanTaiwan
203020502030205020302050
Singeing14,74517,826258312584706
Mercerizing and Washing12,19114,739281340270326
Dyeing27,81333,624642776620750
Drying31,43639,63784610678061016
Heat Setting (Stenter)24,95833,277576768547730
Finishing (pad-dry-cure)40514898187226179217
Yarn Drying626757231214
Table 8. Annual change in CO2 emissions after electrification of the end-use processes.
Process StepAnnual Change in CO2 Emissions (kt CO2)
ChinaJapanTaiwan
203020502030205020302050
Singeing296−2620−4−47−20−121
Mercerizing and Washing277−2209−4−52−9−57
Dyeing442−4786−11−112−22−124
Drying1371−6566−1−180−18−196
Heat Setting (Stenter)1971−638511−150−2−163
Finishing (pad-dry-cure)70−704−3−33−6−36
Yarn Drying9−107−0.04−0.4−0.4−2
Table 9. Energy cost per unit of production (2021 $/t fabric) for conventional and electrified textile wet processes.
ChinaJapanTaiwan
Process StepType of Costs in
2021 $/t fabric
203020502030205020302050
Conventional ElectrifiedConventional ElectrifiedConventional ElectrifiedConventional ElectrifiedConventional Electrified Conventional Electrified
SingeingFuel cost3007308101380480820
Carbon price111217012113501210200
Electricity cost6927871116512155685680
Total cost461039687105177184155669510880
Mercerize & WashFuel cost100250280480170290
Carbon price4460441204470
Electricity cost131130256253129127
Total cost153532303560625322323727
DryingFuel cost 200500560950330570
Carbon price791208824088130
Electricity cost36746461217113362359
Total cost317665647112912611344707459
Dye & WashFuel cost 3608709801660580990
Carbon price 131420016144201513240
Electricity cost 131141410823206241931210513100
Total cost6212812110813722023319385118135100
StenterFuel cost 2405806601110380660
Carbon price810140101028099160
Electricity cost28227831473138275272
Total cost349274787815814213849858372
FinishingFuel cost130320360610210360
Carbon price5570651506590
Electricity cost441439875870438436
Total cost224744394980847031434936
Yarn dryingFuel cost4011012020070120
Carbon price222022502230
Electricity cost214213325323213212
Total cost81615131727282310141712
Table 10. The CO2 intensity of the conventional and electrified singeing process.
CountryCO2 Intensity (kg CO2/t Finished Fabric)
ConventionalElectrified
2021203020402050203020402050
China3763533313053881840
Japan3423323213113081460
Taiwan4274043813553461640
Table 11. The CO2 intensity of the conventional and electrified mercerizing and washing processes.
CountryCO2 Intensity (Kilograms per Tonnes—kg CO2/t Finished Fabric)
ConventionalElectrified
2021203020402050203020402050
China125119113106132630
Japan114112110108105500
Taiwan143137131123118560
Table 12. The CO2 intensity of the conventional and electrified drying process.
CountryCO2 Intensity (kg CO2/t Finished Fabric)
ConventionalElectrified
2021203020402050203020402050
China2542402262102841340
Japan2322262202142251070
Taiwan2902752612442531200
Table 13. The CO2 intensity of the conventional and electrified heat setting process (Stenter machine).
CountryCO2 Intensity (kg CO2/t Finished Fabric)
ConventionalElectrified
2021203020402050203020402050
China2812702592463461640
Japan2582552532502741300
Taiwan3243123002853081460
Table 14. The CO2 intensity of the conventional and electrified finishing (pad-dry-cure) process.
CountryCO2 Intensity (kg CO2/t Finished Fabric)
ConventionalElectrified
2021203020402050203020402050
China175162150135176830
Japan159152145138139660
Taiwan197184172157157740
Table 15. The CO2 intensity of the conventional and electrified yarn drying process.
CountryCO2 Intensity (kg CO2/t Finished Fabric)
ConventionalElectrified
2021203020402050203020402050
China6055504459280
Japan5451484547220
Taiwan6762575253250
Publisher’s Note: MDPI stays neutral with regard to jurisdictional claims in published maps and institutional affiliations.

