1. Introduction
Fires caused by spontaneous coal combustion have long been one of China’s worst mine disasters [
1,
2]. Before the mining of a lower horizontal coal seam, water exploration and drainage should be carried out on the goaf of the overlying coal seam [
3]. During the drainage period, the water release promotes a pressure difference between the inside and outside of the goaf, and then causes the external air to enter the goaf along the air leakage channel, resulting in water–gas displacement [
4]. After long-term soaking and air drying, the residual coal in the goaf will produce new pores and cracks, the number of pores and cracks will increase, and the physical structure will change [
5]. On the other hand, after the residual coal is immersed in water for a period of time, the swelling effect makes the coal body expand, and the soluble substances in the coal gradually dissolve under the action of water, leading to a change of chemical composition, which changes the oxidation rate and combustion rate of the coal body in the heating process of spontaneous combustion [
6]. After long-term immersion, when the residual coal is exposed to the air, the volume fraction of accessible oxygen keeps rising, and with the temperature of the goaf gradually rising, the residual coal is prone to spontaneous combustion, thus causing more serious coal mine fire hazard [
7].
Coal spontaneous combustion is a process of intense oxidation reaction between coal and oxygen after crushing [
8]. The active parts inside the crushed coal first cause physical and chemical adsorption processes in the external environment, resulting in the release of heat. The generation and accumulation of heat lead to an increase in the temperature of the coal, which accelerates the oxidation process and releases more heat. Finally, reaching the ignition point, the coal spontaneously combusts [
9]. It is generally believed that the higher the spontaneous combustion tendency of coal, the higher the risk of coal spontaneous combustion. However, in recent years, production practice has found that although coal has a low tendency to spontaneously combust in many mining areas, coal immersed in water for a long time is prone to spontaneous combustion after natural air drying [
10]. There is an increasing number of studies on this phenomenon, and many investigations have been carried out by relevant scholars. Reich et al. [
11] studied the changes of fractal structure on the surfaces of wet coal and dry coal, and found that external water enlarged coal pores and hence expanded the contact area of coal with oxygen, thereby accelerating coal SC. Norinaga et al. [
12] studied the pore structure changes of flooded coal and found that the specific surface area of water-leaching coal increased by 1.6–2.7 times compared with raw coal. Robyn Fry et al. [
13] found that the swelling phenomenon was positively correlated with water absorption through the observation of coal swelling in water. Hodges et al. [
14] studied the influence of moisture content on the heating rate of coal spontaneous combustion, and the results showed that the heating rate of coal increased with the increase of air humidity and moisture content in coal. Kucuk et al. [
15] investigated the effect of moisture content on the tendency of coal to spontaneously combust and believed that the tendency to spontaneously combust improved with the increase of air moisture content. The results showed that the pores of the coal body with long-term water immersion were more developed, the contact area between coal and oxygen was increased, and the oxidation rate of coal in the heat accumulation stage of low temperature spontaneous combustion was improved.
In terms of the changes in SC characteristics of water-soaked and air-dried coal, Sun et al. [
16] studied the types of gases produced by coal samples with different metamorphic degrees during low-temperature oxidation. Their research results suggested that compared with raw coal, the samples that had been soaked for a long time consumed more oxygen at a higher rate and generated more gas products. Wen et al. [
17] studied the SC hazard of secondary oxidation of water-soaked coal and found that compared with raw coal, it consumed oxygen and generated characteristic gases faster and had a higher ultimate heat release intensity during SC. Tang et al. [
18] explored the variations of the microstructure and SC characteristics of different bituminous coals after long-term soaking, and reached the conclusion that soaked coal corresponded to a lower activation energy and a higher heat release amount during low-temperature oxidation, that is, water soaking enhanced the SC hazard. Wang et al. [
19] investigated the SC law of residual coal during water drainage in the goaf and disclosed that water–gas replacement was likely to occur in this process, hence raising the SC hazard of residual coal. Scholars have injected a proper amount of nitrogen into goafs by “water–gas replacement” [
20] to ensure a positive pressure difference, so as to cut off the air leakage channels for oxygen supply in goafs and prevent SC [
21].
In summary, at present, scholars have explored the SC characteristics of water-soaked and air-dried coal in goafs [
22]. However, for the study on the law of spontaneous combustion of residual coal after drainage of a water-soaked goaf, most scholars analyze the influence of water-soaked coal on spontaneous combustion characteristics by soaking coal for different durations in the laboratory. There is a lack of research on on-site water-soaked coal. Furthermore, most studies focused on laboratory research failed to carry out actual observation in the field or to combine experimental research with field tests. Therefore, we carried out an in-depth study on mine water soaked coal samples. Through similar simulation and field measurement, we studied whether the spontaneous combustion risk of residual coal increased in the process of water drainage in goaf [
23].
In this study, the SC characteristics of the raw coal samples from Qinan (QN) 72 coal, Xutuan (XT) 32 coal, Guobei (GB) 8 coal and the corresponding coal samples soaked with distilled water and mine water for different times were investigated respectively through thermal analysis experiments and temperature-programmed experiments. In addition, the variations of SC hazardous area during drainage were explored by establishing a simulation test system for goaf drainage in the laboratory. Furthermore, a monitoring system for the oxidation process of residual coal during goaf drainage was established at the coal mine site. With reference to the simulation results, the fire prevention and extinguishing measure in goafs was optimized. The research results provide insights for grasping the variations of internal SC hazardous area during goaf drainage and optimizing the fire prevention and extinguishing measures.
3. Simulation Tests for SC Characteristics during Goaf Drainage
3.1. Establishment of a Test System for Goaf Drainage
The strike and dip of the 7
225 goaf in QN Coal Mine are about 1300 m × 180 m in size, the average mining height is 3 m, and the overburden collapse zone is 12 m high. The ponding areas are 33,419 m
3 in total. According to the volume similarity scale by the similarity criterion, it is concluded that the volume of water to be injected into the test model is 36 L.
where
l is the corresponding length dimension (m),
is the length ratio,
is the area ratio,
is the volume ratio.
According to the calculation of this proportion, the goaf model volume is 3.6 m3. Considering the limitations of the test site and the simulation accuracy, the goaf model volume is finally 0.15 m3 after being reduced by 1:25 on the basis of this size. The volume of the goaf model is 0.15 m3 and the overall size is determined as length × width × height = 1 m × 0.5 m × 0.3 m.
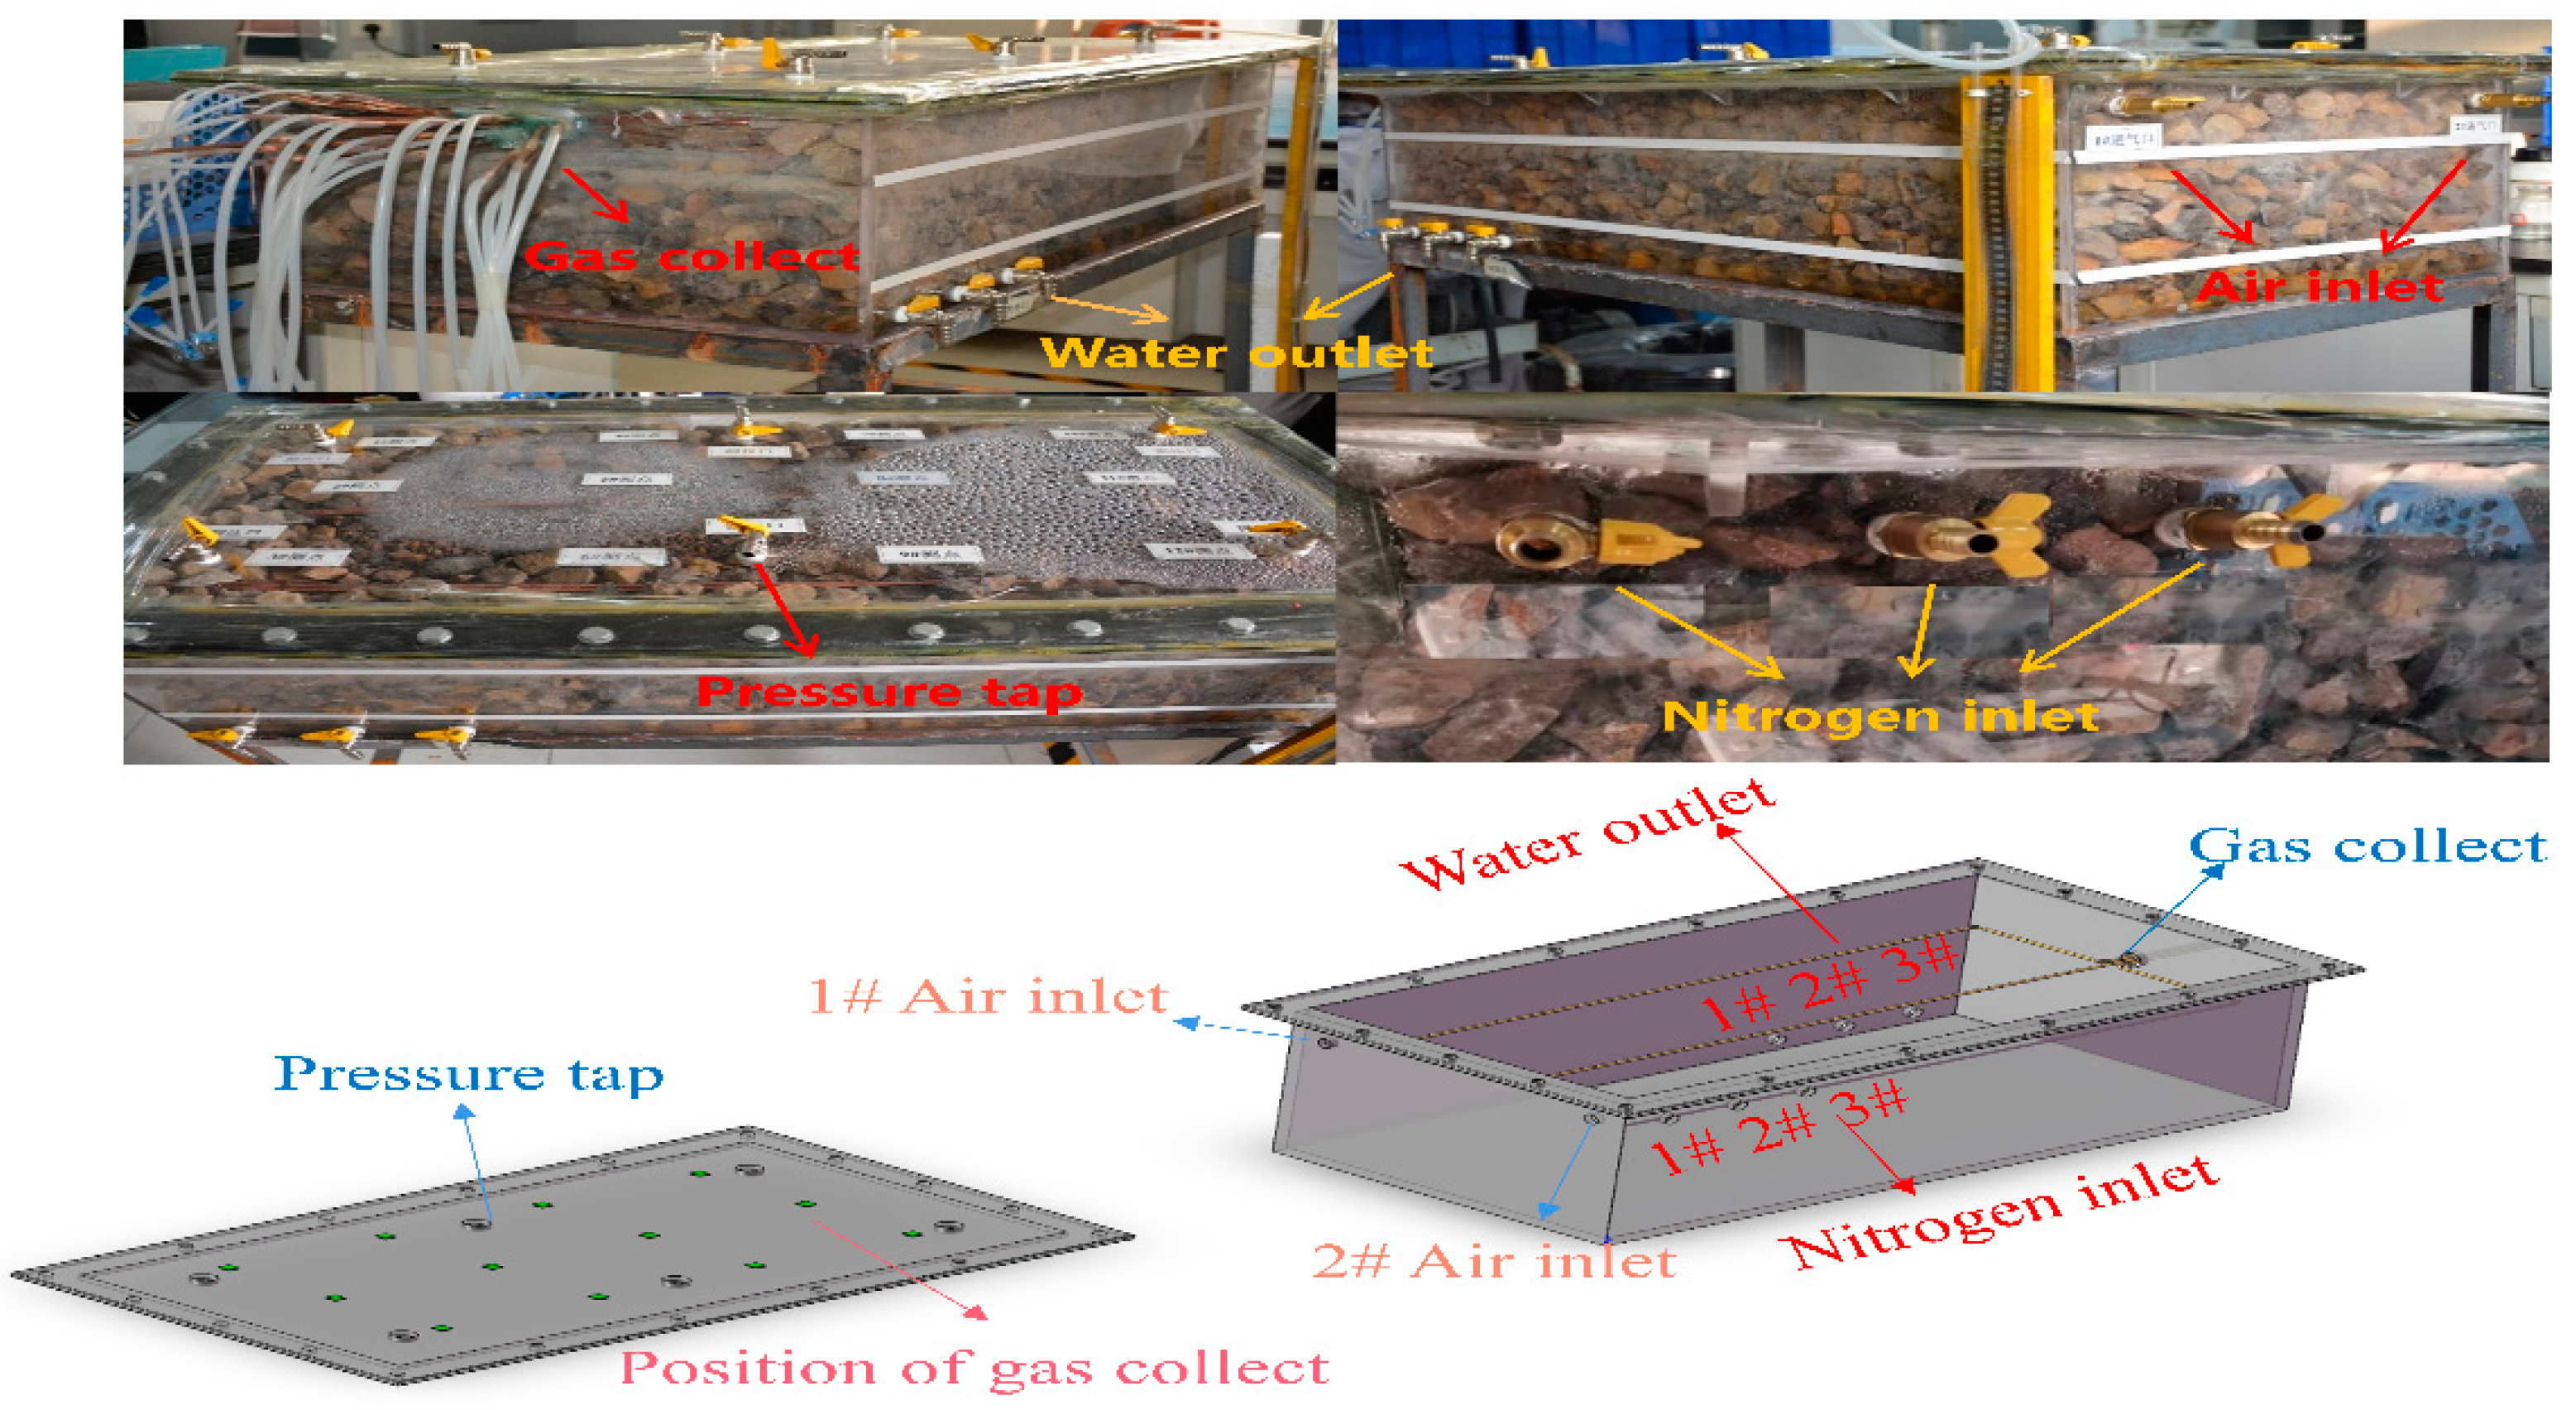
The goaf drainage test system consists of two parts, i.e., a main body and a cover plate (
Figure 3). The main body is equipped with drainage holes, air inlets, gas collect hole and nitrogen injection holes, and the cover plate contains pressure taps. All the holes are equipped with a control valve, and the two parts are firmly connected by bolts. Three drainage holes (spacing 0.1 m) are arranged at the lower part of the main body to control the drainage flow. One gas collect hole and twelve gas intake points (spacing 0.2 m × 0.15 m) are set on the side of the main body to collect internal gas during the drainage of the test system. Air inlets (spacing of 0.4 m) are distributed on the other side of the main body, set on the left and right respectively, to leak air into the system during drainage. Three nitrogen injection holes (spacing 0.1 m) are arranged in the upper section of the opposite side of the drainage holes to inject nitrogen into the system during drainage. Six pressure taps (spacing 0.4 m × 0.3 m) are arranged in the cover plate to monitor the pressure variation inside the test system during drainage.
At a height of 5 cm from the bottom, 5 cm thick coal blocks with different particle sizes were filled as residual coal. The actual piling state of coal and rock in goafs on the coal mine site was simulated by stacking coal blocks and rocks with different sizes. The void ratio of the caving coal and rock mass in the goaf gradually decreases from the surrounding to the center, satisfying the “O” ring theory of goaf [
29]. In addition, twelve gas intake points were arranged at a height of 0.2 m from the model bottom, with a spacing of 0.2 m × 0.15 m. These gas intake points were fixed with copper pipes which extend from the gas intake holes. The gas intake holes were sealed with highly waterproof latex to avoid air leakage.
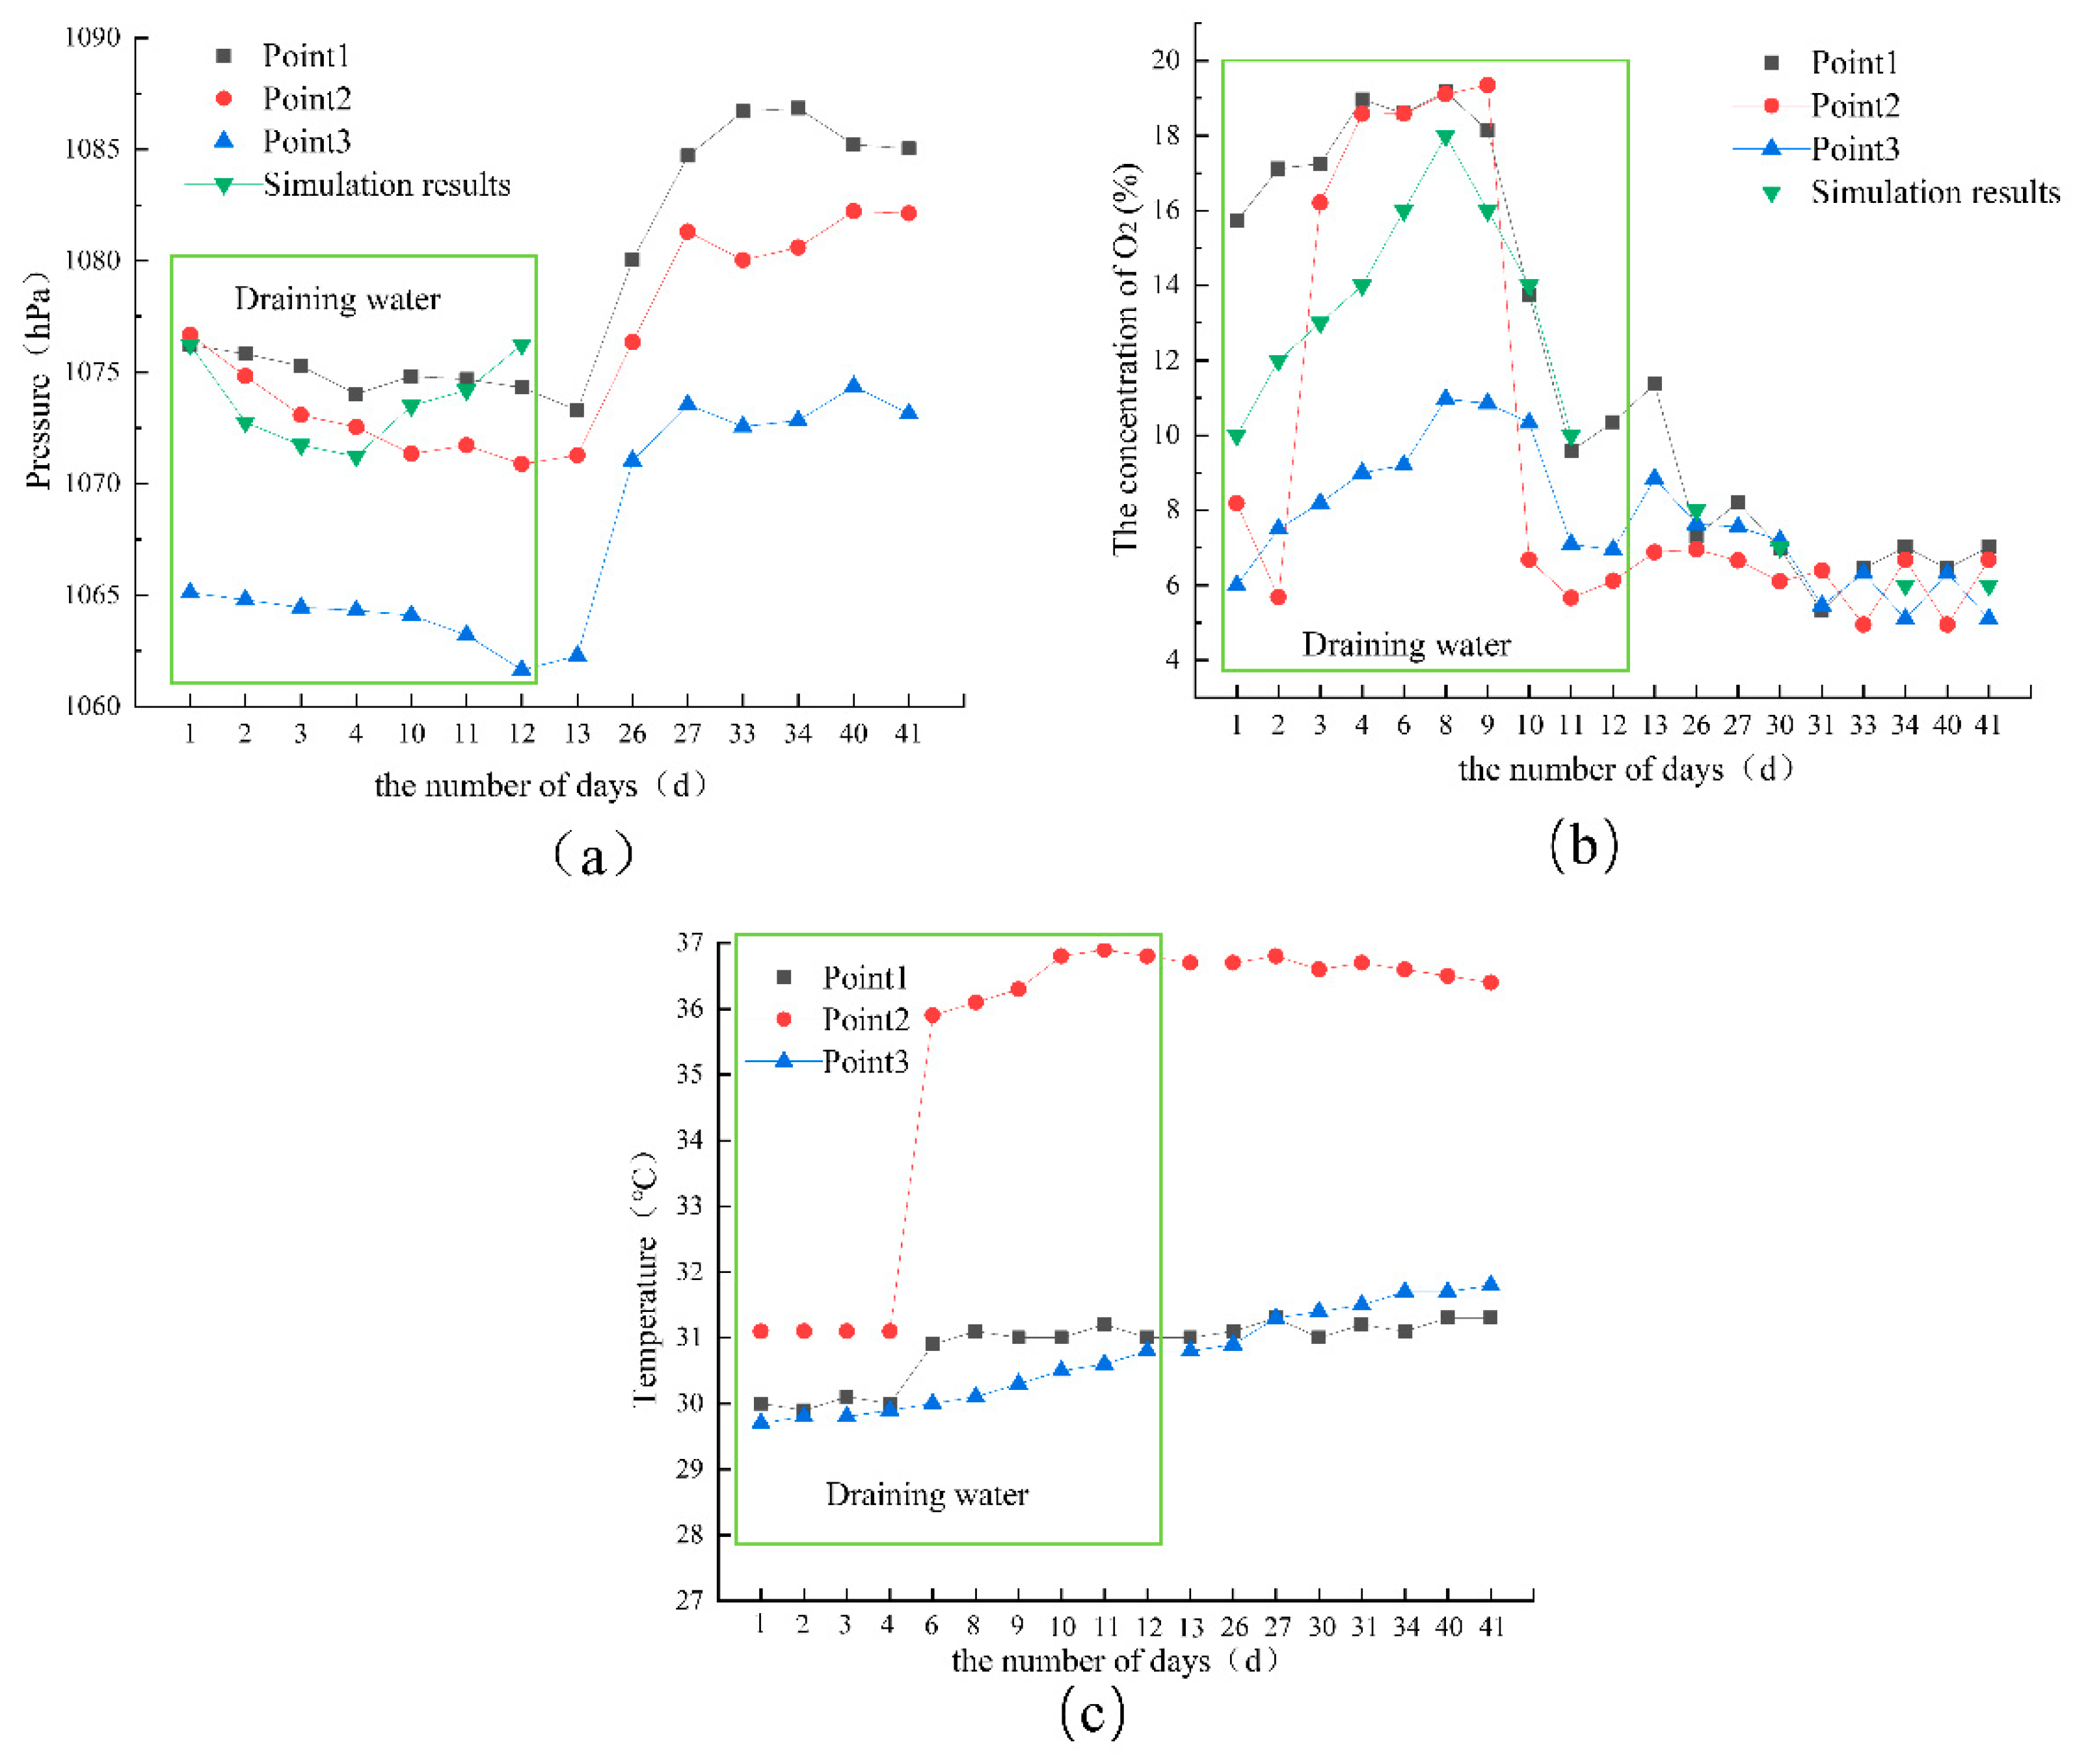
3.2. Test on Basic Parameters of the Drainage Test
U-shaped differential pressure gauges were connected to the pressure taps, and the air leakage at the air inlet was fixed as 0.1 m
3/h. During drainage, the pressure difference was recorded every 30 s. Finally, the variation of the pressure difference in the test system with the passage of drainage time was obtained through five repeated tests (
Figure 4a). Nitrogen was injected at the flow rates of 4 L/min, 5 L/min and 6 L/min, respectively, to investigate the variation of pressure difference in the goaf under different nitrogen injection flow rates. The variation of pressure difference inside and outside the test system was recorded every 30 s (
Figure 4b–d).
According to
Figure 4a, in the early stage of drainage, the pressure difference between the inside and outside of the test system jumped and reached the maximum value of 498 Pa. In the middle stage, it first decreased linearly with the decrease of water level. In the late stage, after the water level became lower than the drainage hole, it dropped to zero at a certain rate. When nitrogen was injected at a flow rate below 6 L/min, the pressure difference reached an equilibrium in the middle stage, and air leakage was effectively alleviated. When nitrogen was injected at 6 L/min, the maximum value of the pressure difference was 343 Pa. As water drainage continued for 4 min, the pressure difference reached an equilibrium. After that, the internal pressure of the system was higher than the external pressure, forming a positive pressure until the end of water drainage. According to the air inlet flowmeter, the air leakage was zero, indicating that no gas flowed into the air inlet. Instead, gas flowed out of the air inlet. Therefore, a good fire prevention and extinguishing effect could be achieved at a nitrogen injection flow of 6 L/min.
3.3. Simulation of Migration Characteristics of SC Hazardous Area during Goaf Drainage
The SC hazardous area of the recovery face is classified according to the theory of SC “three zones” [
30,
31] which is mainly based on the oxygen concentration, with the temperature as an auxiliary reference. For sealed goafs where the recovery has been completed, gas in them changes due to water–gas replacement during drainage, failing to form a rule for classifying SC hazardous area. Considering the above problem, this study established a rule for classifying SC hazardous area in goafs.
In goafs of the recovery face, the hazardous area is classified based on 10%–18% oxygen concentration. In sealed goafs, fire prevention measures are taken and a limited amount of gas enters the air leakage channels. Therefore, with reference to the classification basis of SC “three zones” in the recovery face and the actual situation of the drainage process of water-soaked goafs, 6–18% oxygen concentration serves as the classification basis for SC hazardous area in water-soaked goafs. Areas with an oxygen concentration below 6% are determined to be in an inert environment, equivalent to the suffocating zone in the recovery face, belonging to the safe zone. An oxygen concentration over 18% indicates intensified air leakage in the goaf during drainage, which raises oxygen concentration and satisfies the conditions for the SC of residual coal, equivalent to the SC zone in the recovery face. Hence, areas with an oxygen concentration over 18% belong to the influence zone. For areas with an oxygen concentration of 6–18%, the oxygen concentration gradually rises during drainage, and the hazard of oxidation and SC exists. Similar to the oxidation zone of the recovery face, these areas belong to the transition zone.
Before each test, nitrogen was continuously injected into the system at a certain flow rate for 15 min, after which the valve was closed for 5 min to ensure a complete inerting effect in the test system. At the beginning of the test, nitrogen was injected from the 1#, 2# and 3# nitrogen injection holes at 4 L/min, 5 L/min and 6 L/min, respectively. Meanwhile, the 1# and 2# air inlets were opened respectively or together. At the 1st min, 3rd min and 5th min of the water drainage process, gas was sampled and marked at different positions by a gas sampler through the gas sampling pipeline, and then the concentration of the collected gas was analyzed by a gas chromatographer.
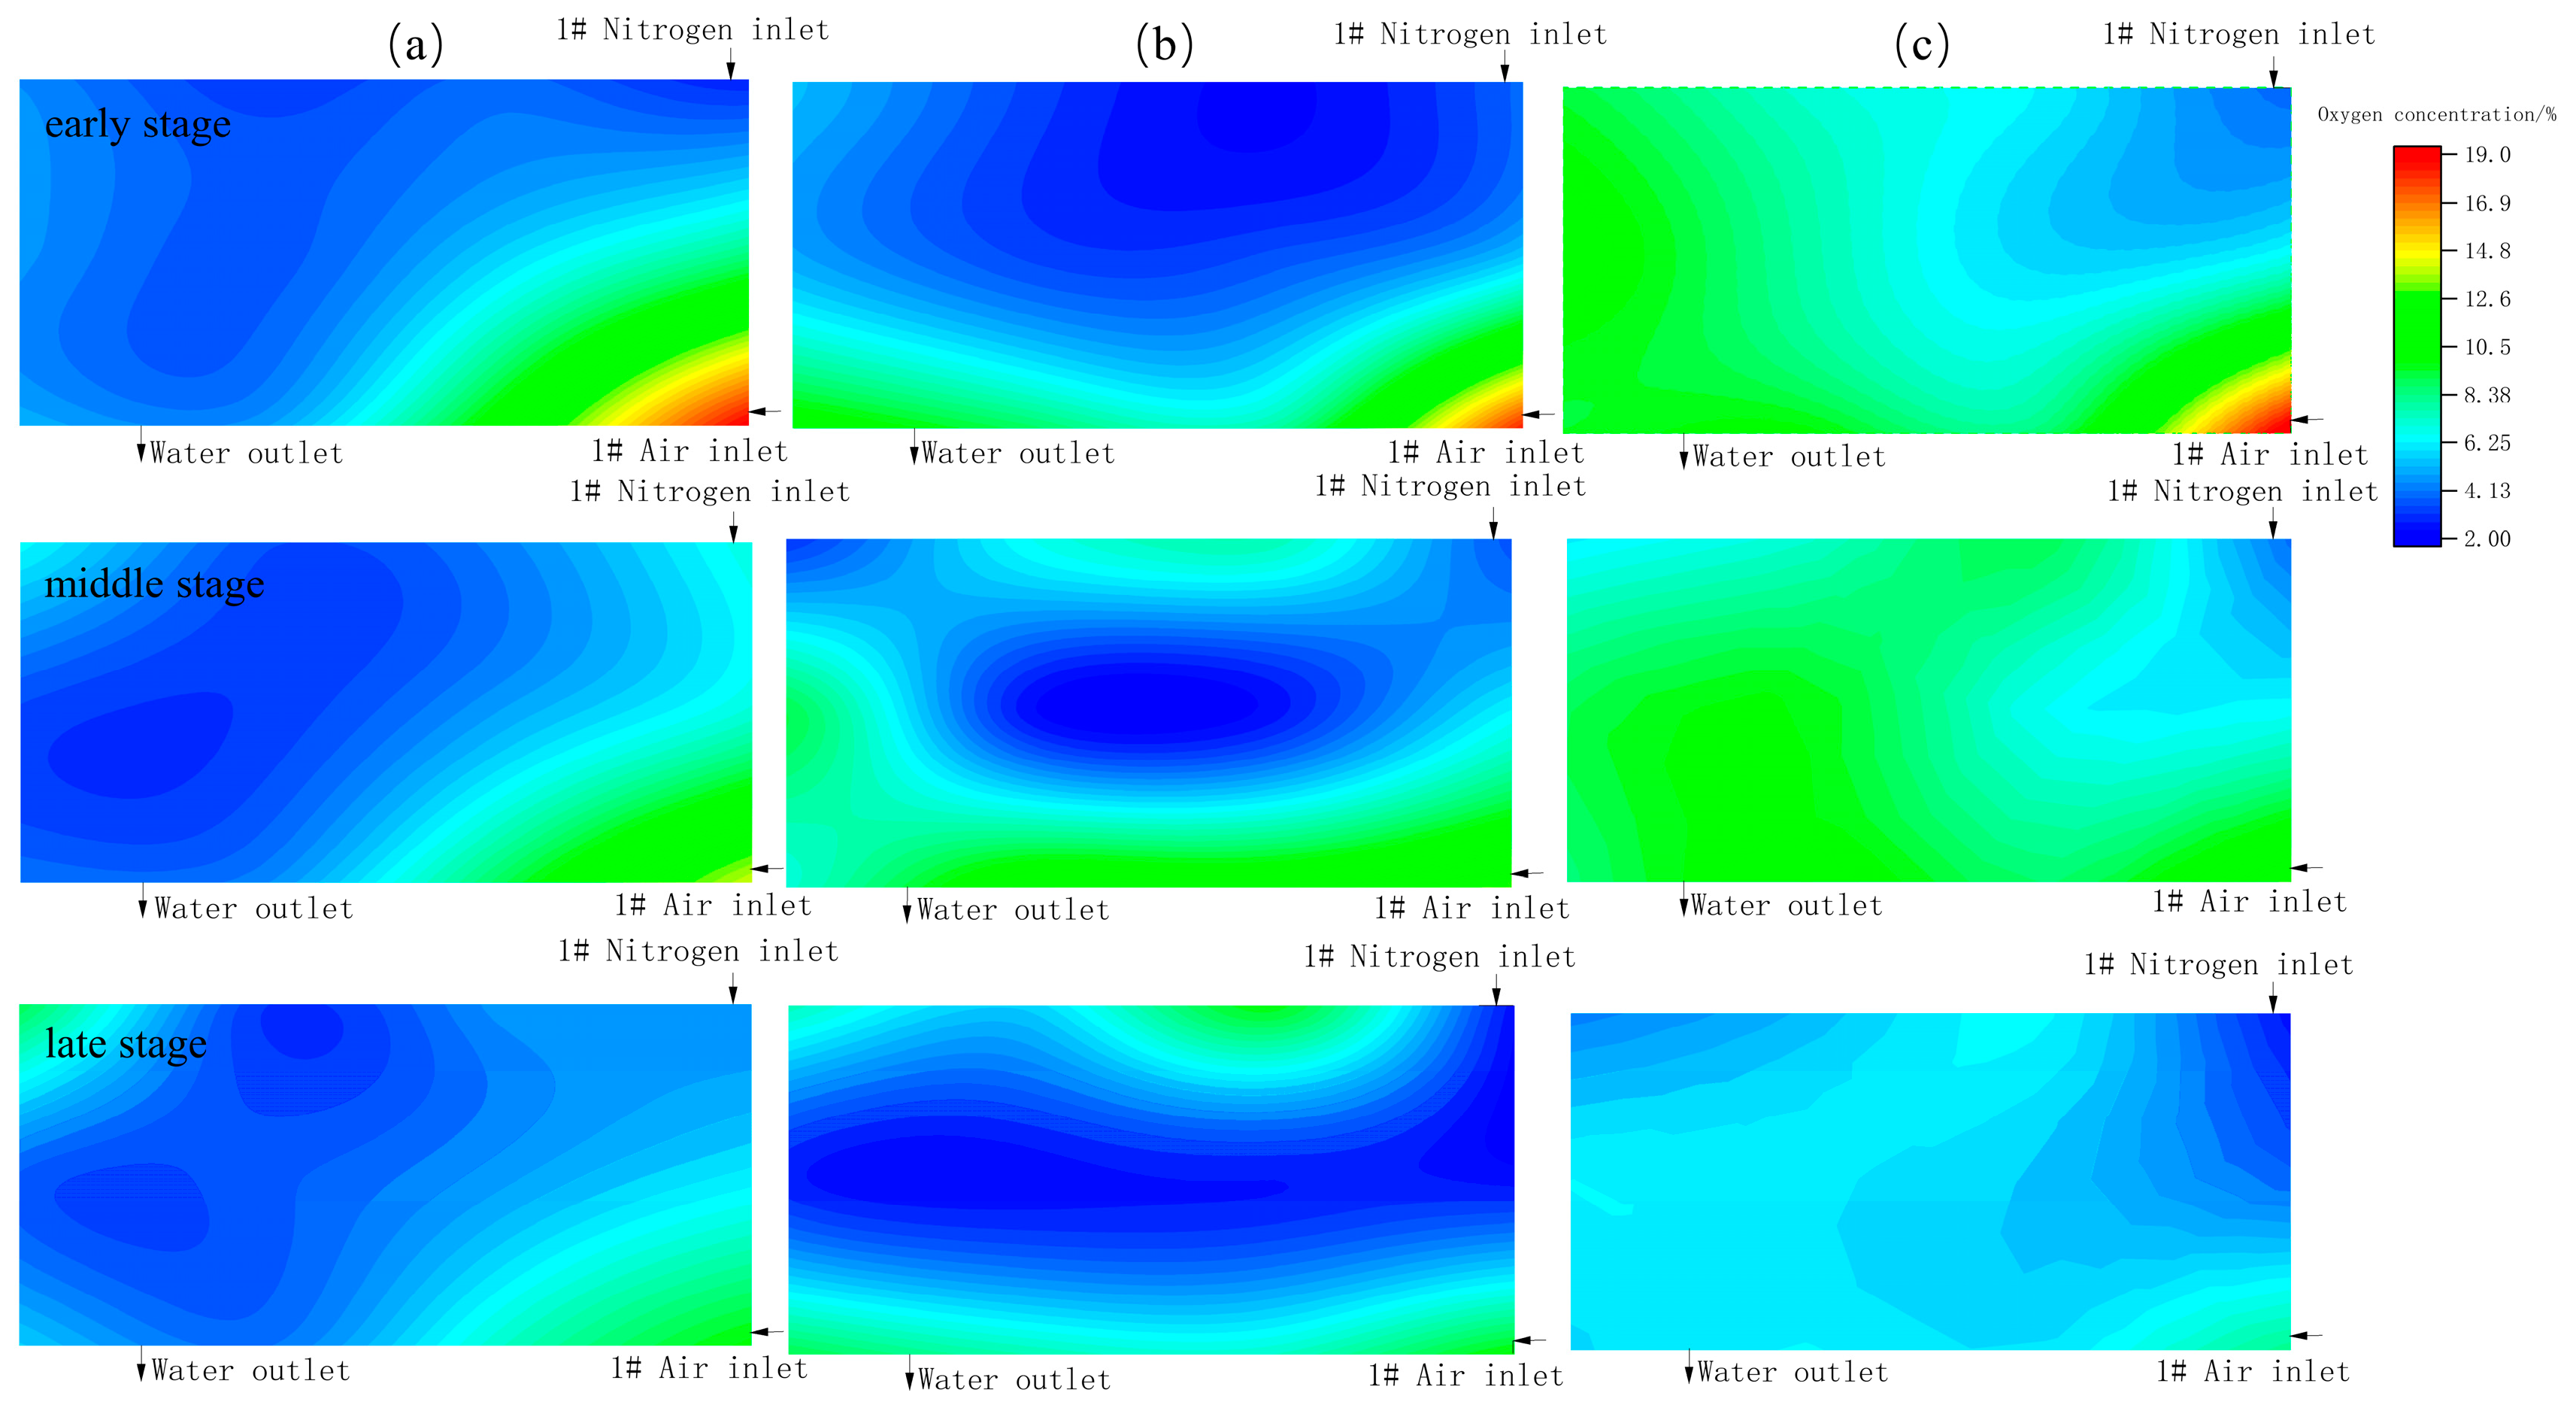
3.3.1. Migration of SC Hazardous Area in the Goaf under Different Air Leakage Channels
According to the on-site measurement of the 7
225 working face in QN Coal Mine, air leakage channels mainly exist in sealing walls. Therefore, simulation tests have explored the law of internal gas distribution under different air leakage channels (including air inlet roadway, air return roadway and the sealing walls of air inlet and air return roadways) in the goaf drainage process. The 1# and 2# air inlets correspond to the sealing walls of air inlet and return roadways in the 7
225 goaf, respectively. The results are shown in
Figure 5.
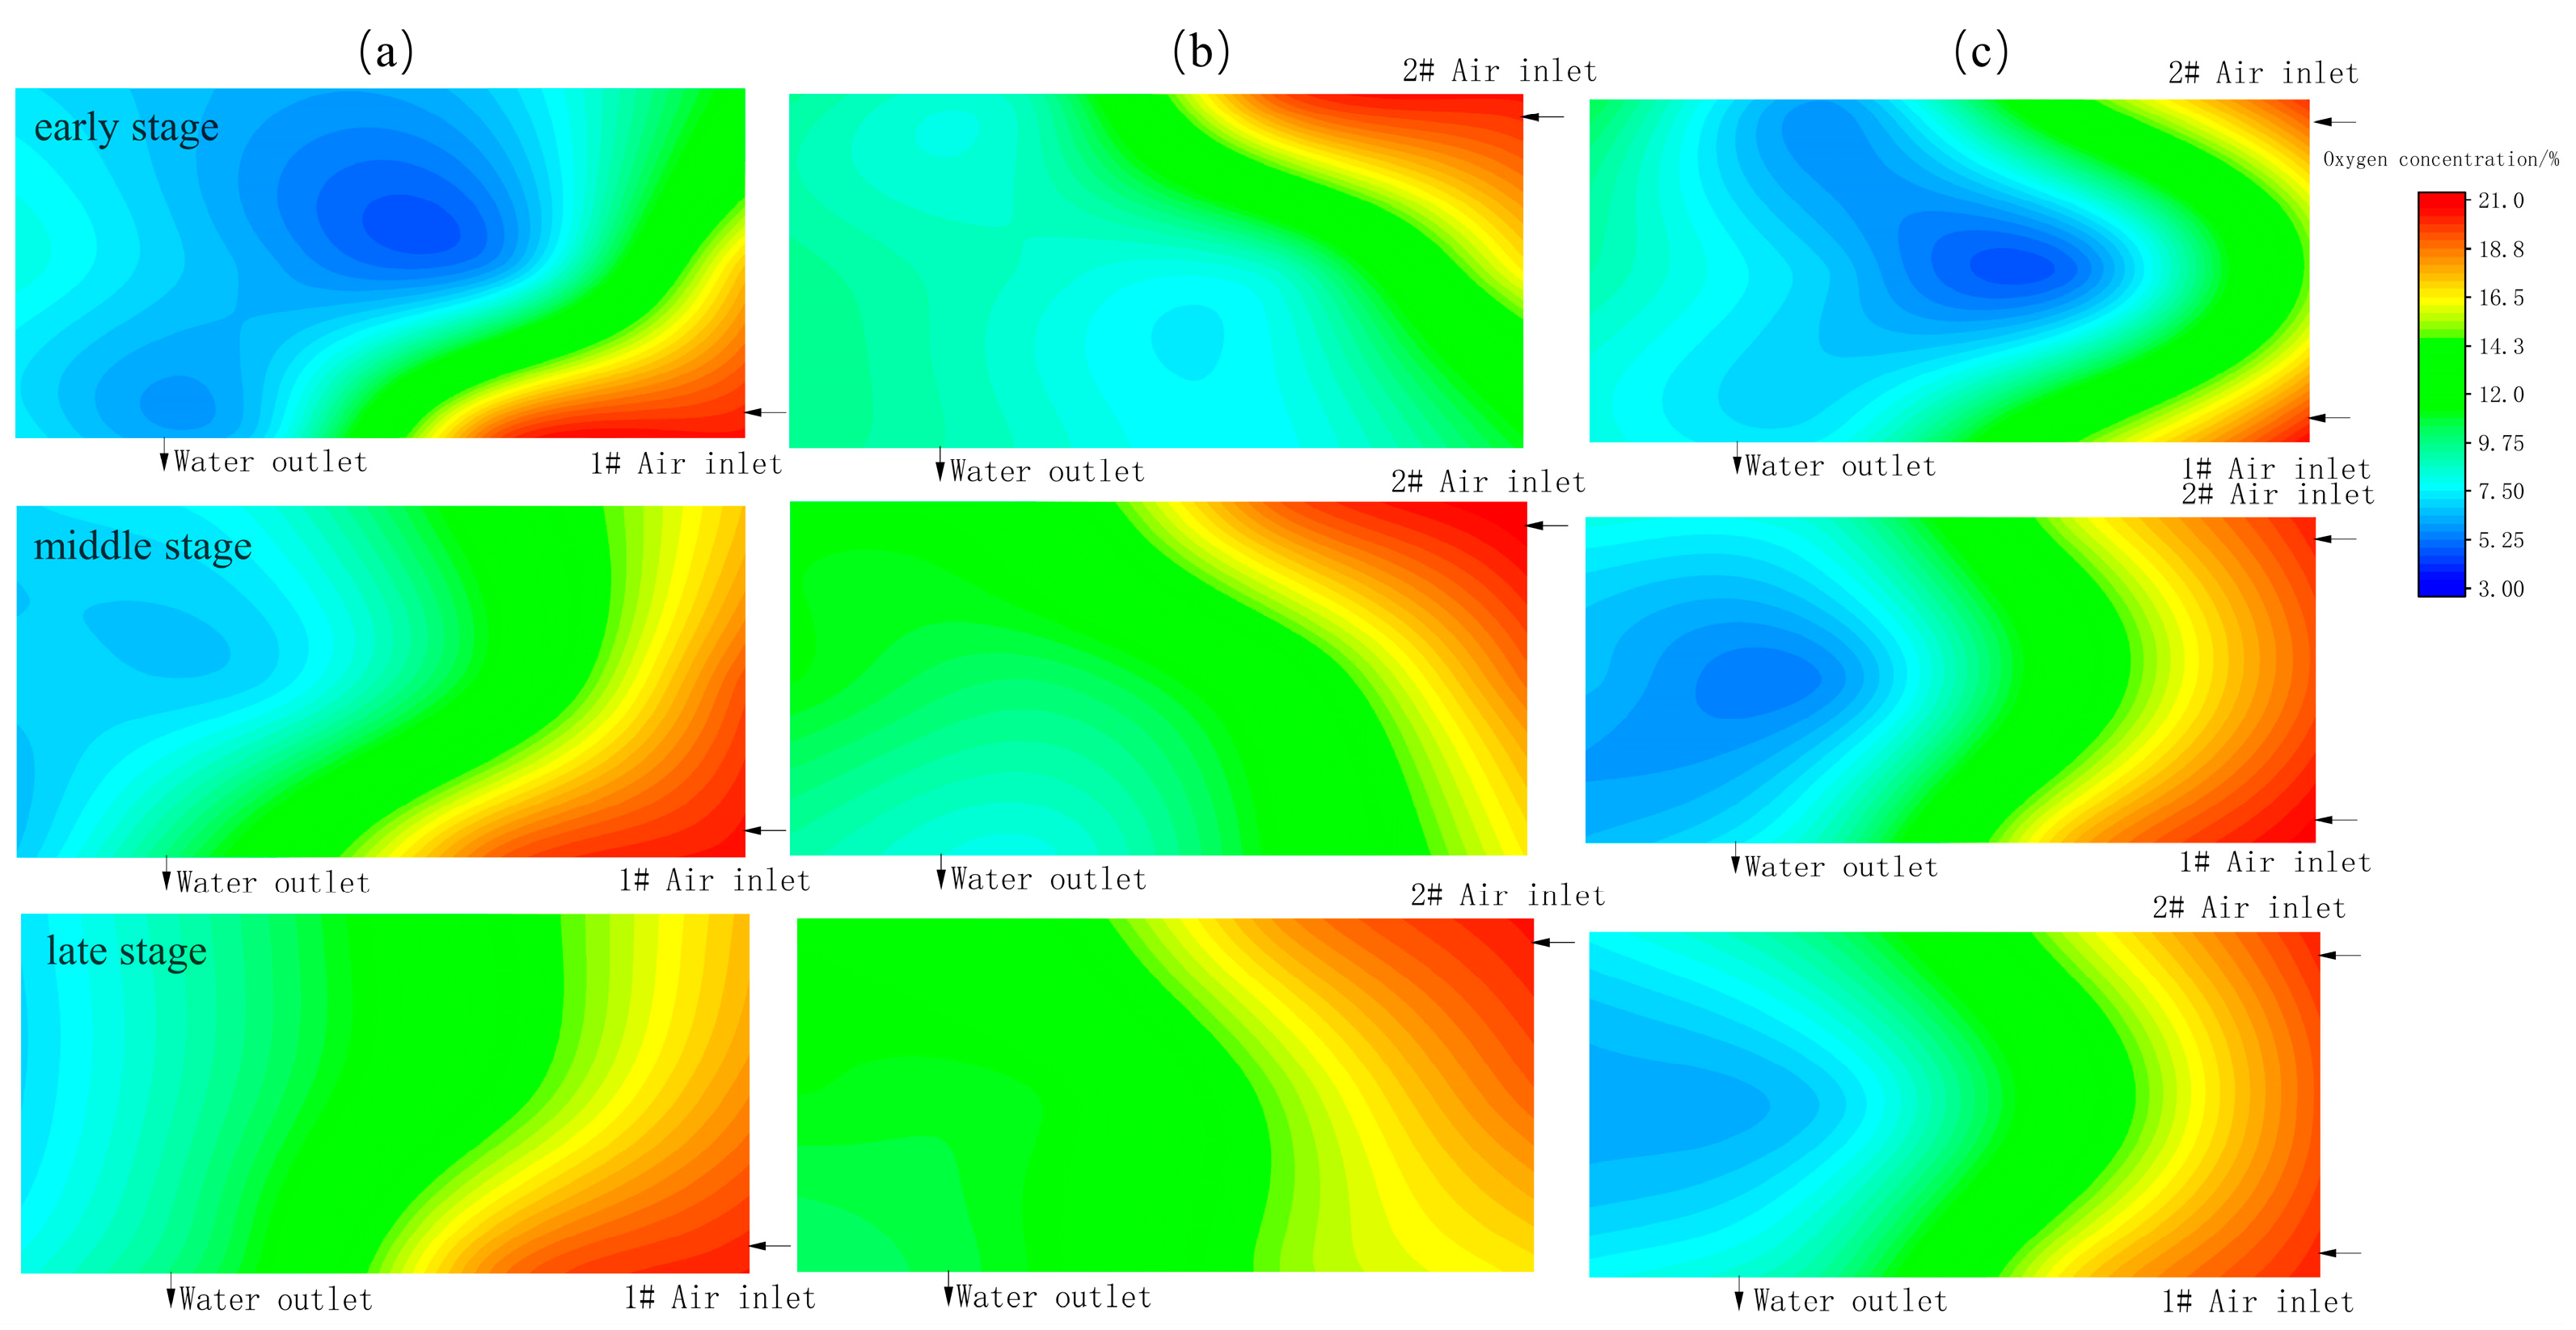
According to
Figure 5a, when the 1# air inlet serves as the air leakage channel on the same side with the water outlets, in the initial stage of drainage, gas enters the goaf and migrates along the channels formed between the air leakage outlet and the water outlets. In the original goaf inert area, the air flow moves and dilutes nitrogen. Gas migrates and diffuses slowly due to the small void ratio in the goaf center, forming a relatively obvious safe zone at the water outlets and the middle upper part of the goaf. In the middle stage, this area gradually shrinks and moves to the deep part of the goaf. In the late stage, the low-oxygen-concentration area disappears and the oxygen concentration gradually increases, resulting in a gradual expansion of the transition zone and the influence zone.
According to
Figure 5b, when the 2# air inlet serves as the air leakage channel on a different side from the water outlets, oxygen diffuses relatively uniformly, and the oxygen diffusion area gradually expands, yet forming a small safe zone. The gas migration from the air inlet to the water outlets should pass through the whole goaf. Therefore, the oxygen concentration displays a fan-shaped distribution, and the whole goaf is located in the transition zone and the influence zone.
According to
Figure 5c, when double-channel air leakage is formed by the 1# and 2# air inlets, in the initial stage of drainage, an obvious safe zone is formed in the goaf center. Air flow gradually diffuses to the goaf from the upper and lower sides. In the middle stage, the safe zone gradually moves to the deep part of the goaf with a shrinking area, while the oxygen diffusion area gradually expands. The transition zone and influence zone experience obvious migration and diffusion.
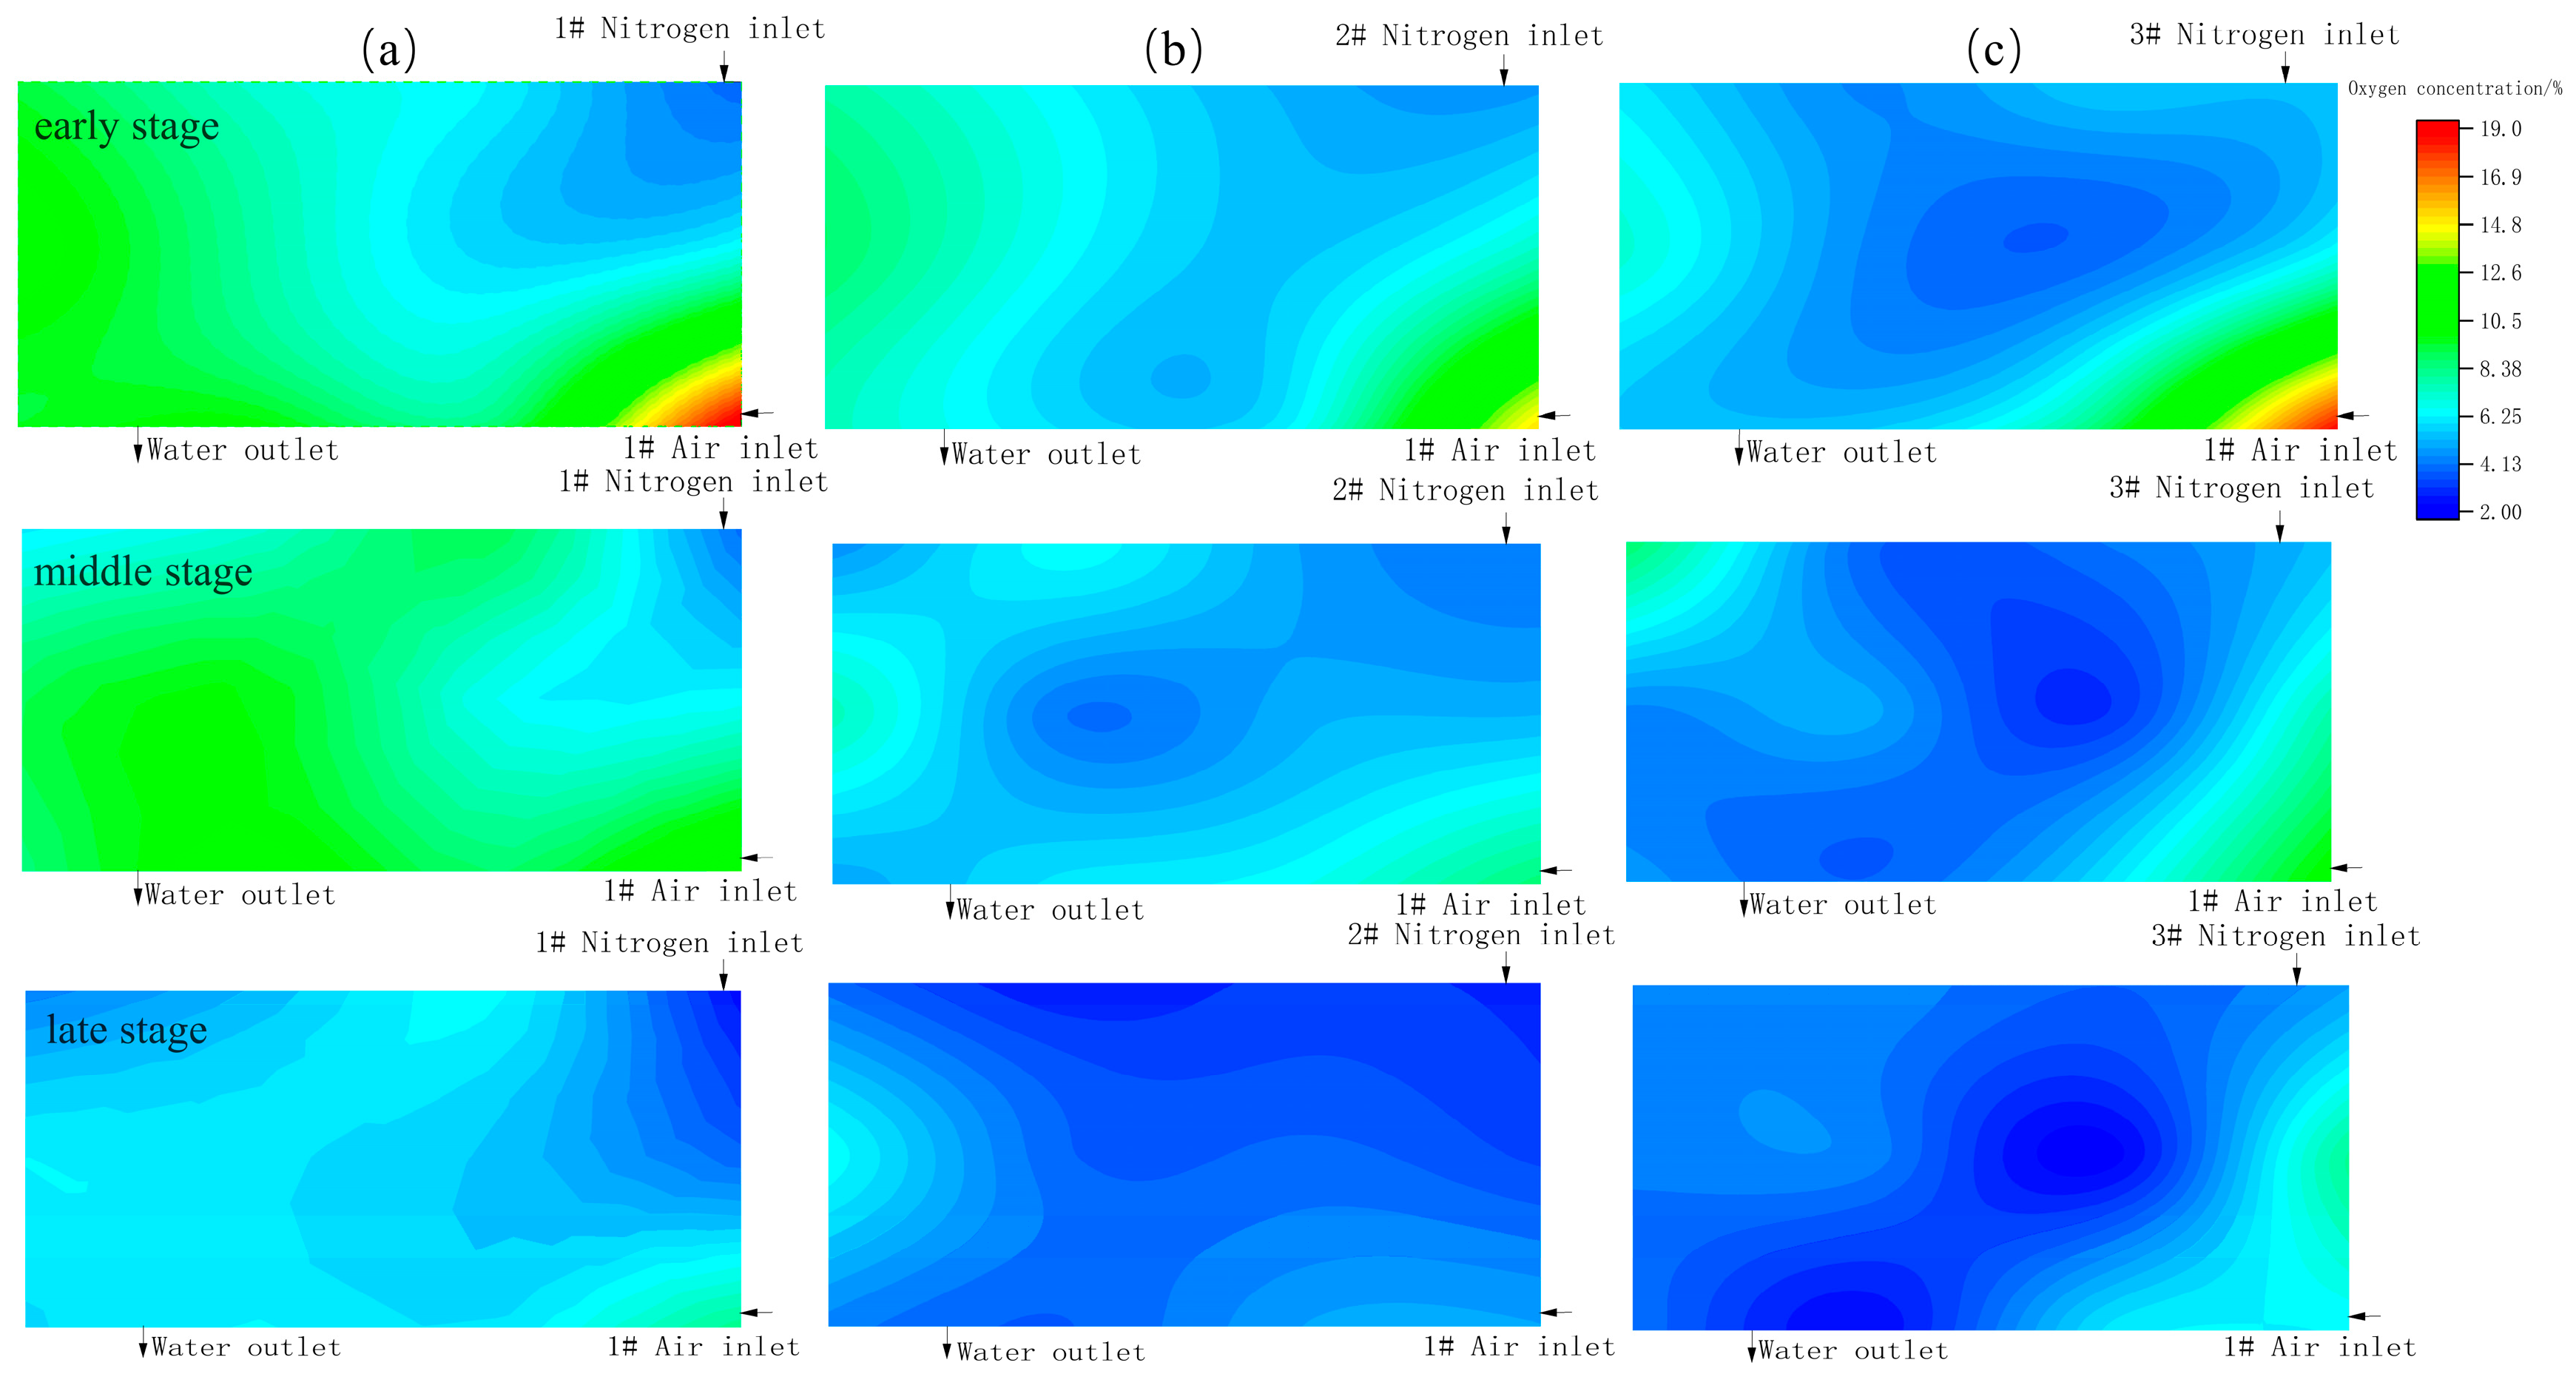
3.3.2. Migration of SC Hazardous Area in the Goaf under Different Nitrogen Injection Flow Rates
Nitrogen was injected at 4 L/min, 5 L/min and 6 L/min, respectively. A certain amount of water was injected into the test system. Meanwhile, the 1# air inlet was opened, and the flow at the 1# nitrogen injection hole was set to 4 L/min, 5 L/min and 6 L/min, respectively. A group of gas samples at the 12 measuring points in the system were collected every 2 min to obtain the distribution of oxygen concentration (
Figure 6).
It can be seen from
Figure 6a that when nitrogen is injected at 4 L/min, in the initial stage of drainage, an influence zone is formed at the air inlet, and the oxygen concentration falls gradually toward the interior of the goaf. In the middle stage, the volume of gas entering the air inlet gradually decreases, and the nitrogen diffusion area gradually expands, diluting the oxygen concentration at the air inlet. In the later stage, the water drainage volume decreases, and the inert effect by nitrogen diffusion becomes more obvious. The oxygen concentration at the air inlet decreases from 18.9% to 9.9%.
As presented in
Figure 6b, when nitrogen is injected at 5 L/min, in the initial stage of drainage, the oxygen concentration in the middle of the test system is relatively low, with a minimum value of 3.4%. In the middle stage, the transition zone and influence zone gradually narrow while the safe zone gradually expands. The goaf boundary has a larger void ratio than the central area due to its low compaction degree. Hence, gas is more likely to diffuse along this area, resulting in an O-shaped ring distribution of the oxygen concentration. In the later stage, the nitrogen volume gradually grows, and the whole internal environment gradually become inert. This phenomenon disappears.
As illustrated in
Figure 6c, when nitrogen is injected at 6 L/min, the oxygen concentration at the 1# inlet decreases from 14.4% to 5.7%. In addition, oxygen diffuses in a small range in the whole drainage process, and the whole test system is in a safe zone.
Figure 6c also displays a relatively notable nitrogen diffusion effect. In the late stage, the oxygen concentration in the whole area is below 6%, realizing the purpose of inerting the goaf gas.
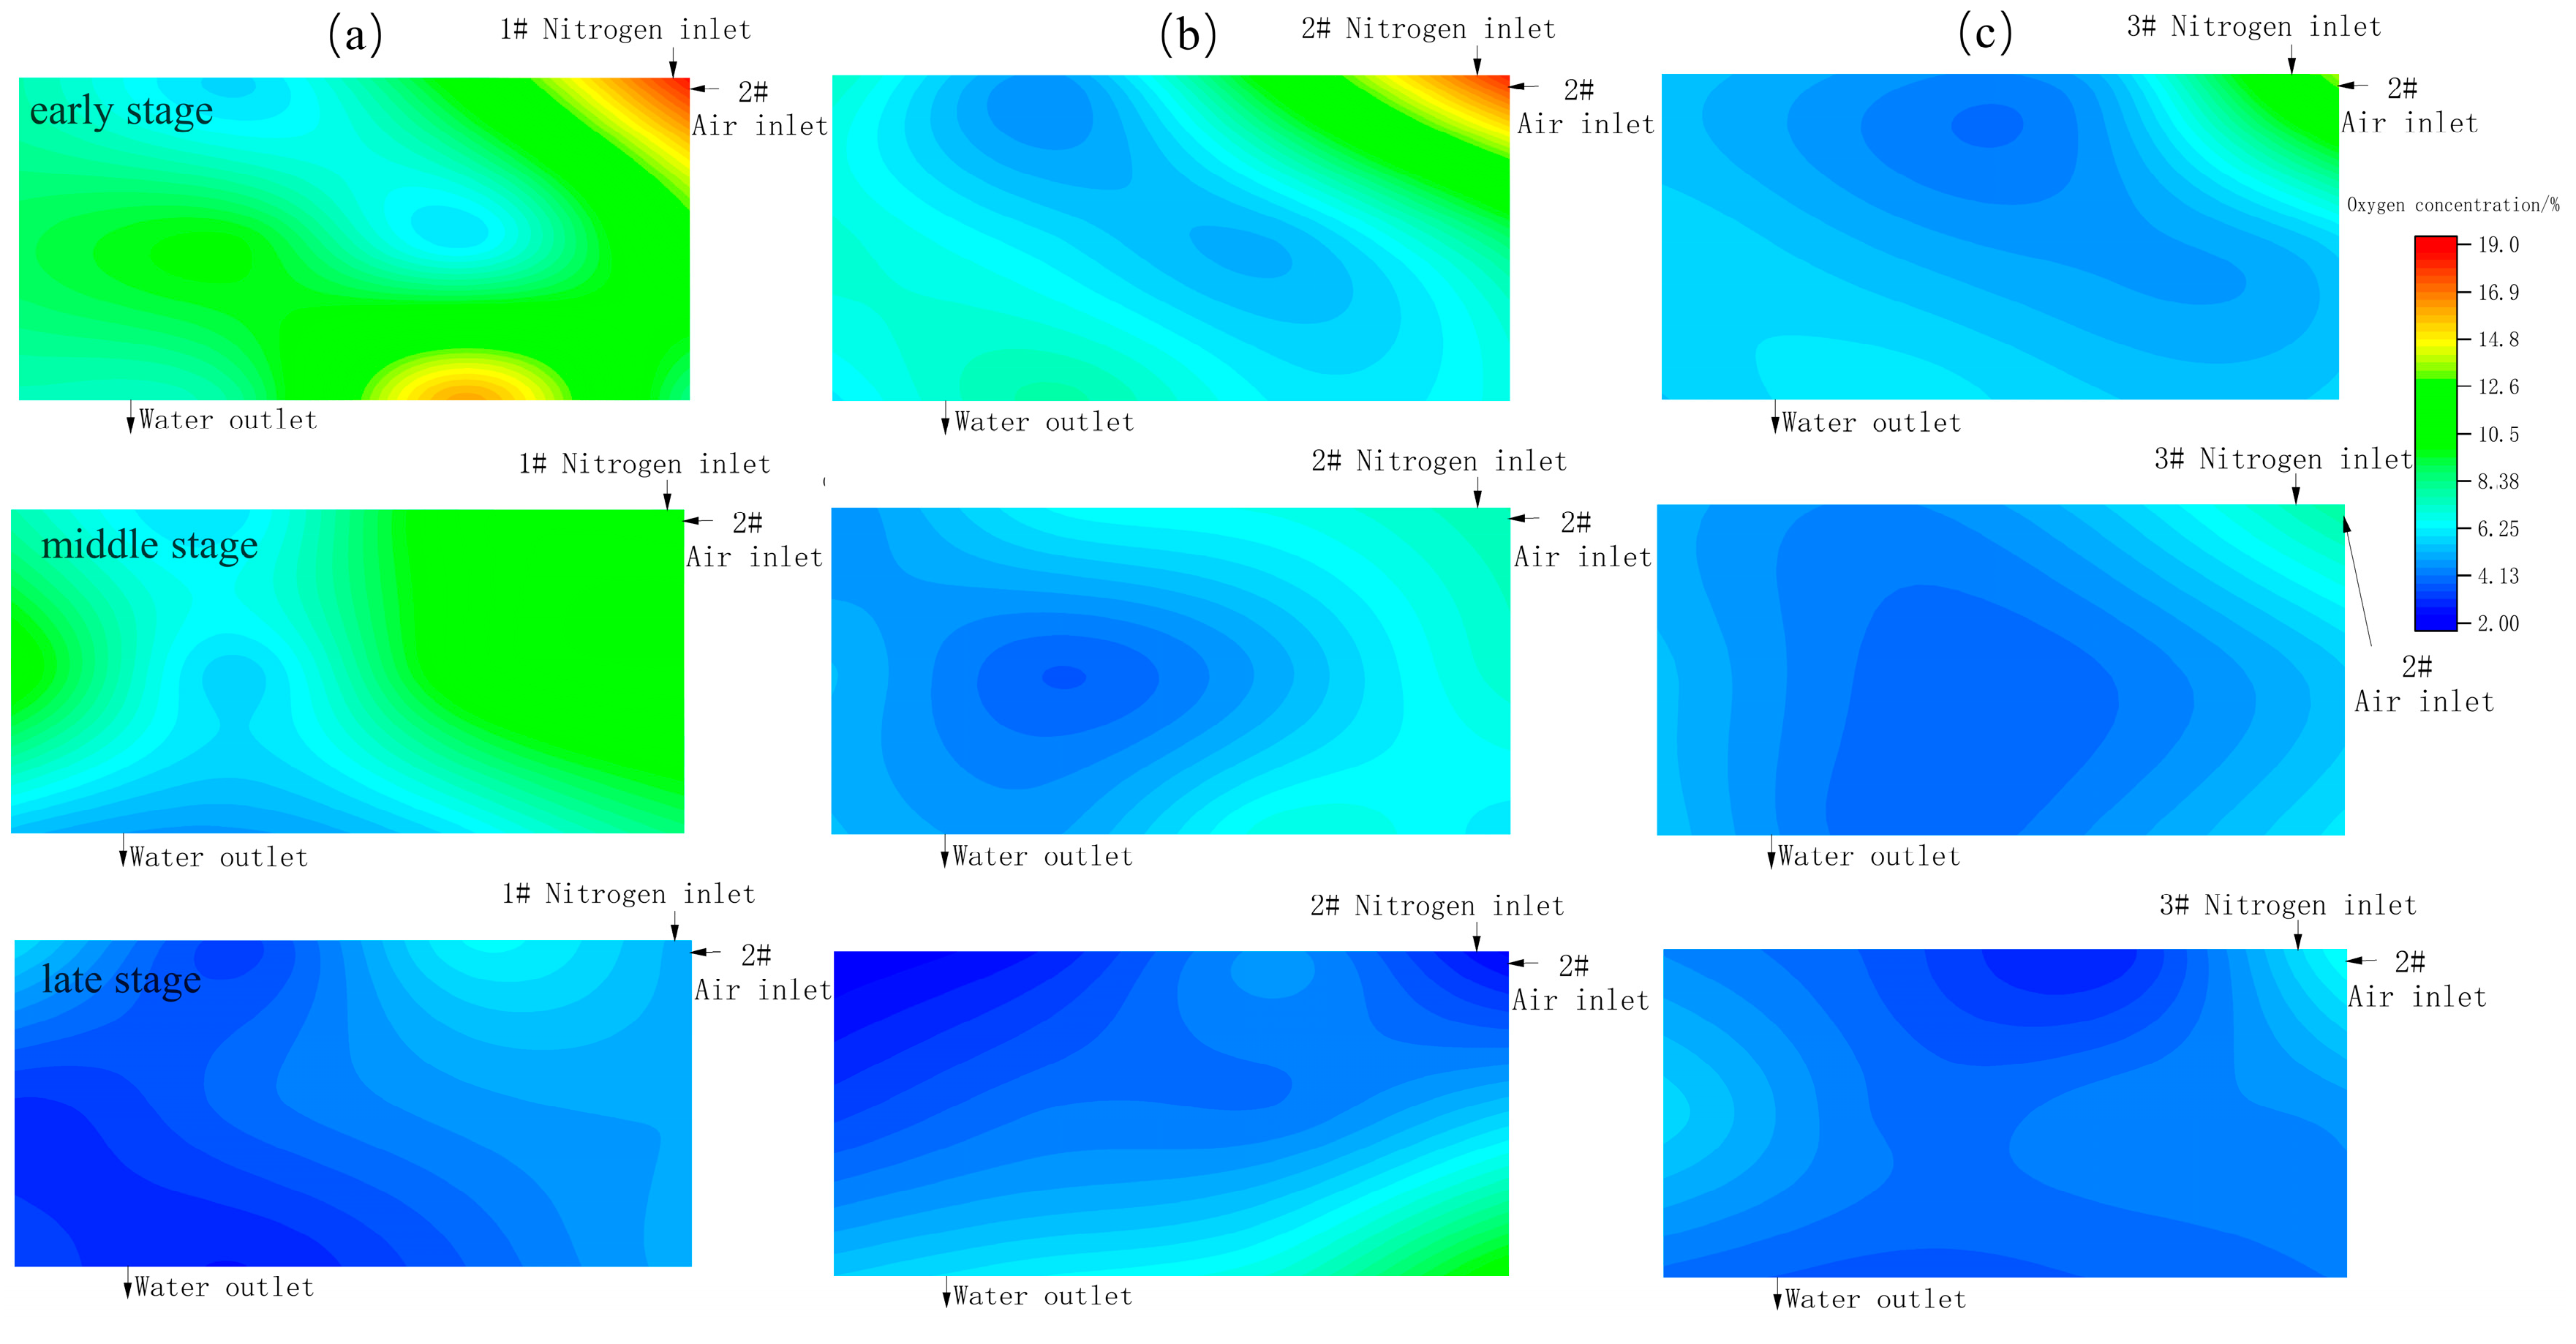
3.3.3. Migration of SC Hazardous Area in the Goaf under Different Nitrogen Injection Positions
Three nitrogen injection holes were arranged at a spacing of 0.1 m. The 1# nitrogen injection hole was 0.1 m away from the sealing wall. The 1# and 2# air inlets served as fixed air inlet channels, respectively, and the nitrogen injection flow rate was 6 L/min. Nitrogen injection positions were changed to investigate their impact on the distribution of oxygen concentration in the goaf. By doing so, the optimal nitrogen injection position could be determined. The test procedure was identical to that in the previous section, and the oxygen distribution law is shown in
Figure 7 and
Figure 8.
It can be seen from
Figure 7 that in the initial stage of drainage, gas gradually diffuses to the deep part of the goaf in a fan-shaped manner. When nitrogen is injected from the 2# hole, the oxygen concentration at the air inlet falls from 19.0% to 5.6%, and this area changes from an influence zone to a safe zone. With the continuous injection of nitrogen, the oxygen concentration in the whole area is lower than 5.6% in the later stage, illustrating an excellent inerting effect. When nitrogen is injected from the 3# hole, the oxygen concentration at the 1# inlet declines from 13.7% to 5.0%. However, in the later stage, a transition zone with an oxygen concentration over 6% is formed between the 1# air inlet and the 3# nitrogen injection hole, because a vortex is formed when air flow and nitrogen intersect in the O-shaped ring. In summary, when air leaks from the 1# inlet and nitrogen is injected at 6 L/min, the 2# nitrogen injection hole boasts the most significant nitrogen injection effect.
As shown in
Figure 8, the air leakage channel (the 1# and 2# air inlets) has a great impact on the distribution of oxygen concentration in the goaf. When the nitrogen injection hole and the air inlet are on the same side, the interaction of air flow migration routes leads to faster gas diffusion, and the oxygen concentration at the air inlet plunges. When nitrogen is injected from the 1# hole, the oxygen concentration in the goaf is below 4.7% in the later stage, and the whole area is in a safe zone, achieving a good nitrogen injection effect. When nitrogen is injected from the 2# hole, the oxygen concentration at the air inlet drops from 11.5% to 2.1%. However, in the later stage, a dead angle of gas diffusion is formed between the water outlets and the air flow channel, resulting in a transition zone with a high oxygen concentration at the 1# air inlet. When nitrogen is injected from the 3# hole, the oxygen concentration at the air inlet decreases from 12.9% to 5.1%. In the later stage, the whole goaf is in a safe zone, demonstrating a notable nitrogen injection effect. In conclusion, the 3# nitrogen injection hole boasts the best nitrogen injection effect when the nitrogen injection hole and the air inlet are on the same side.
5. Discussion
5.1. Evolution Law of SC Hazard of Residual Coal during Goaf Drainage
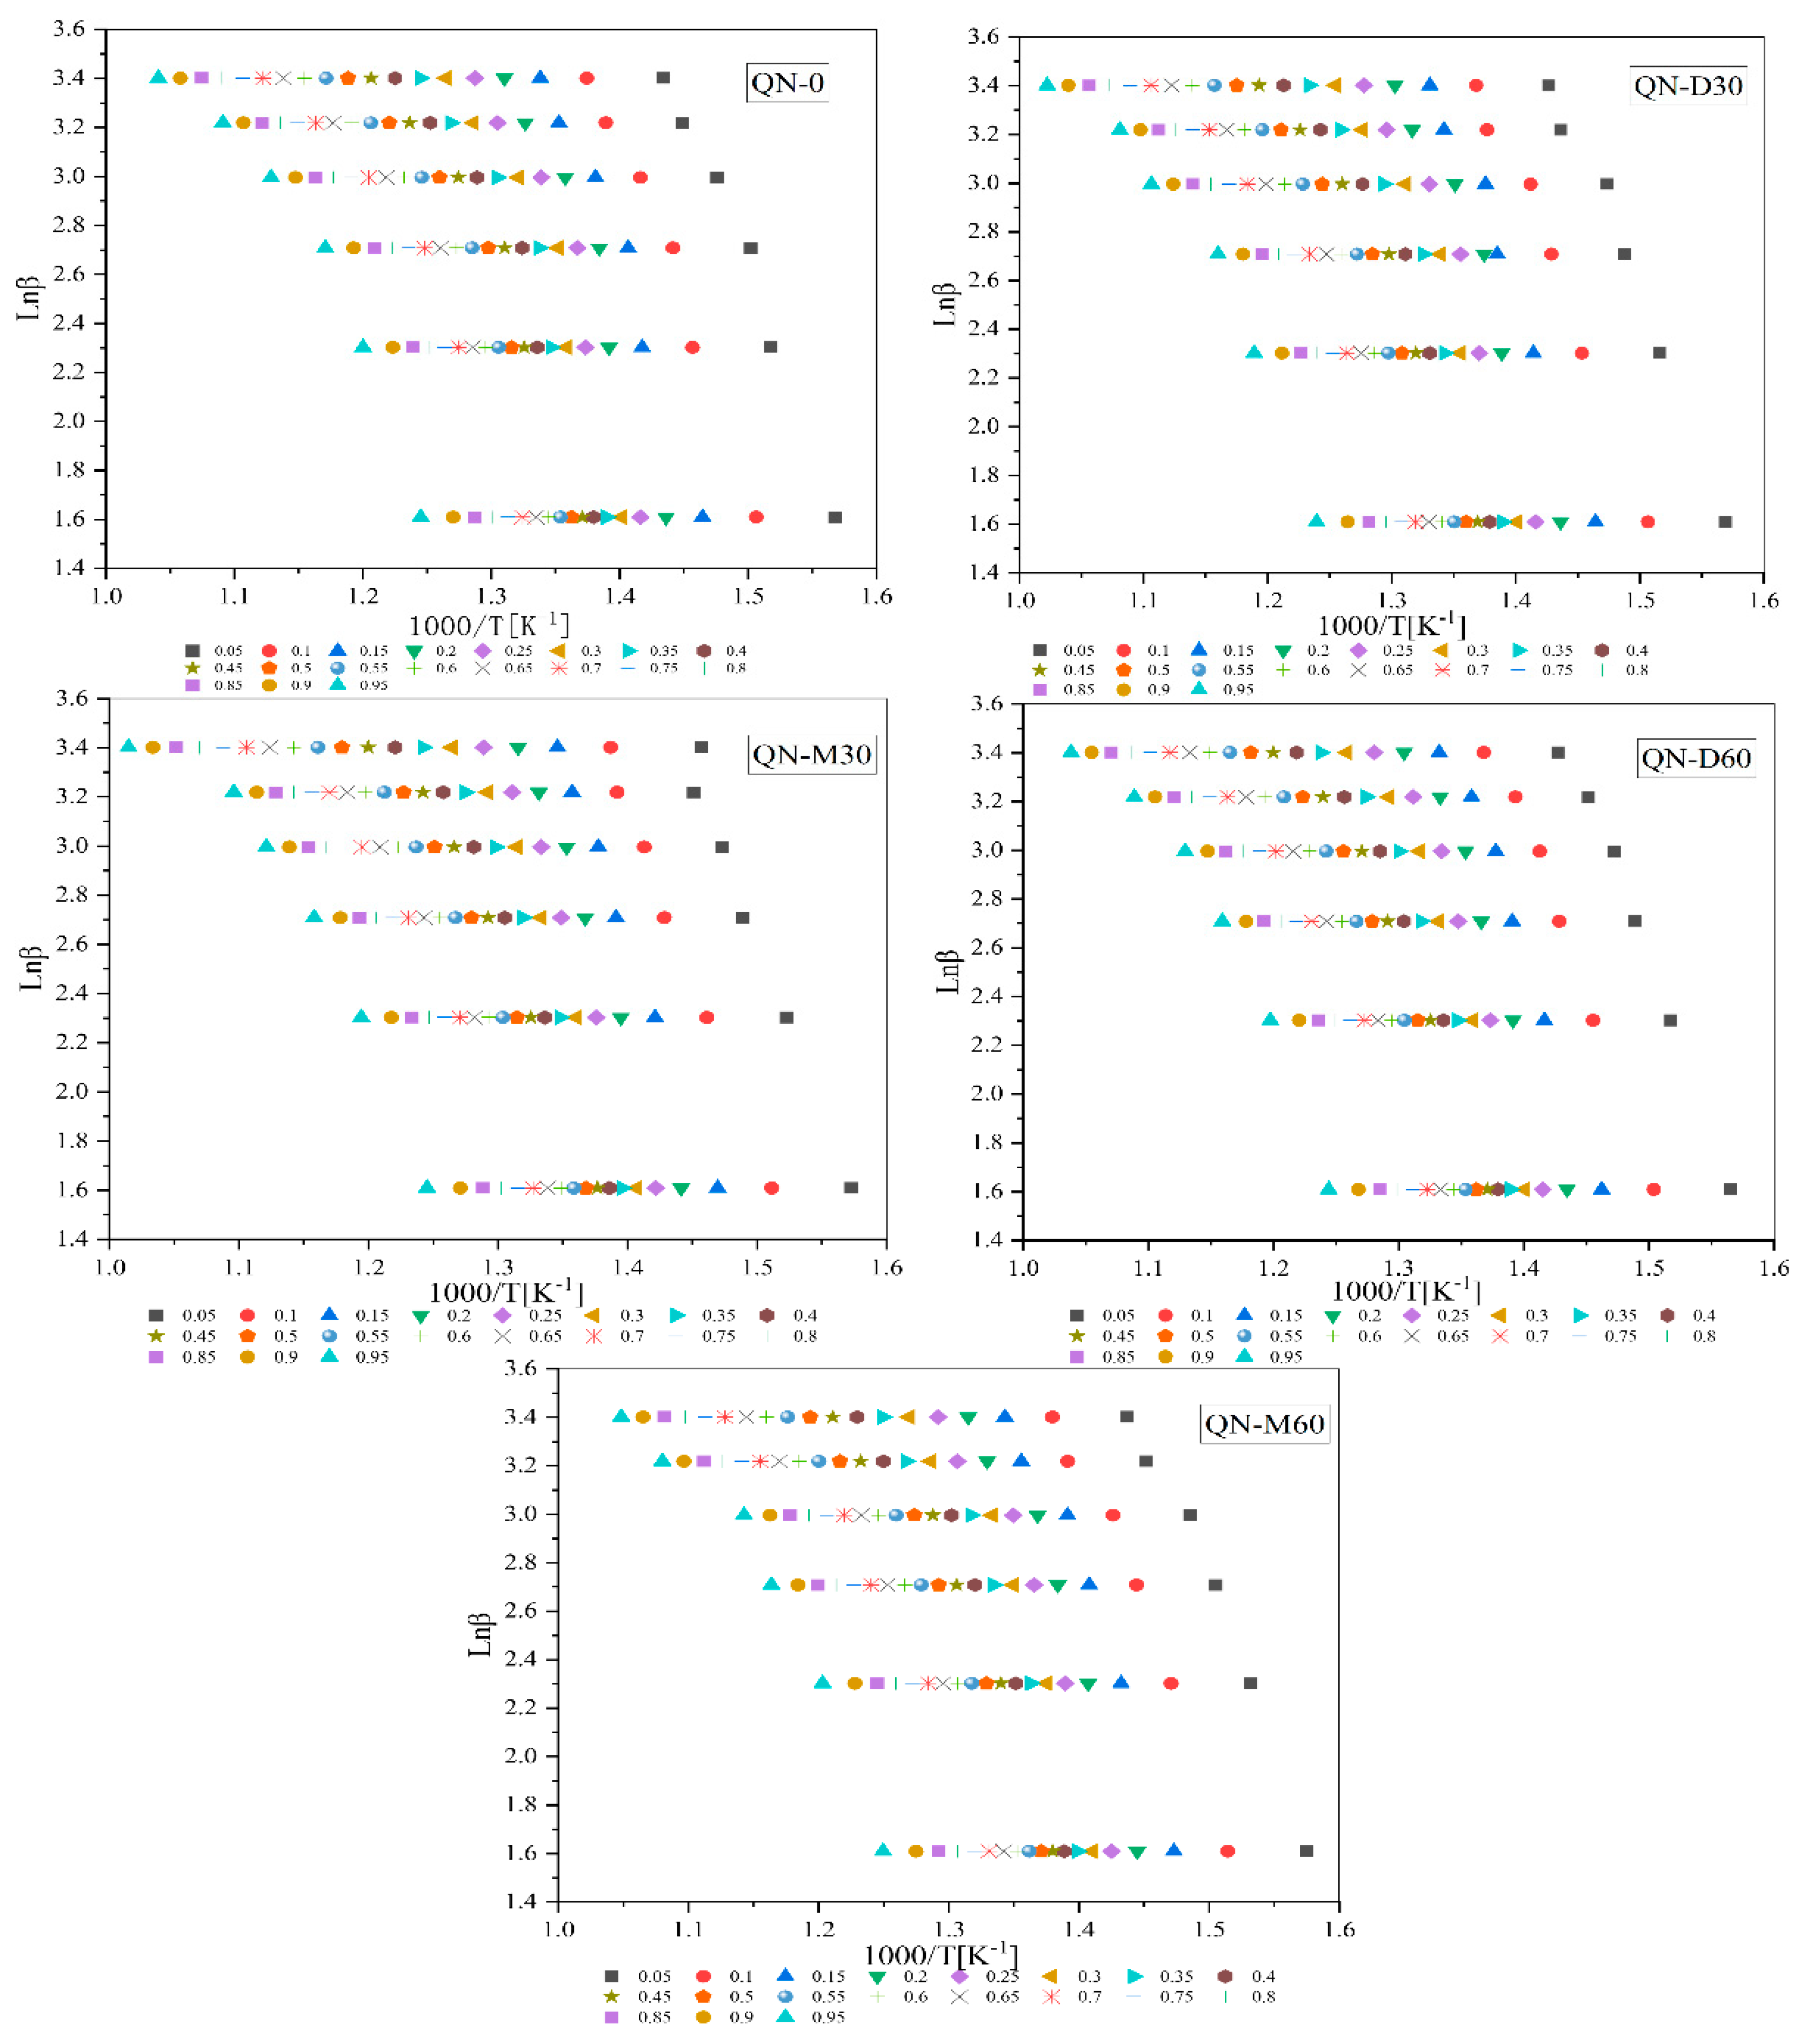
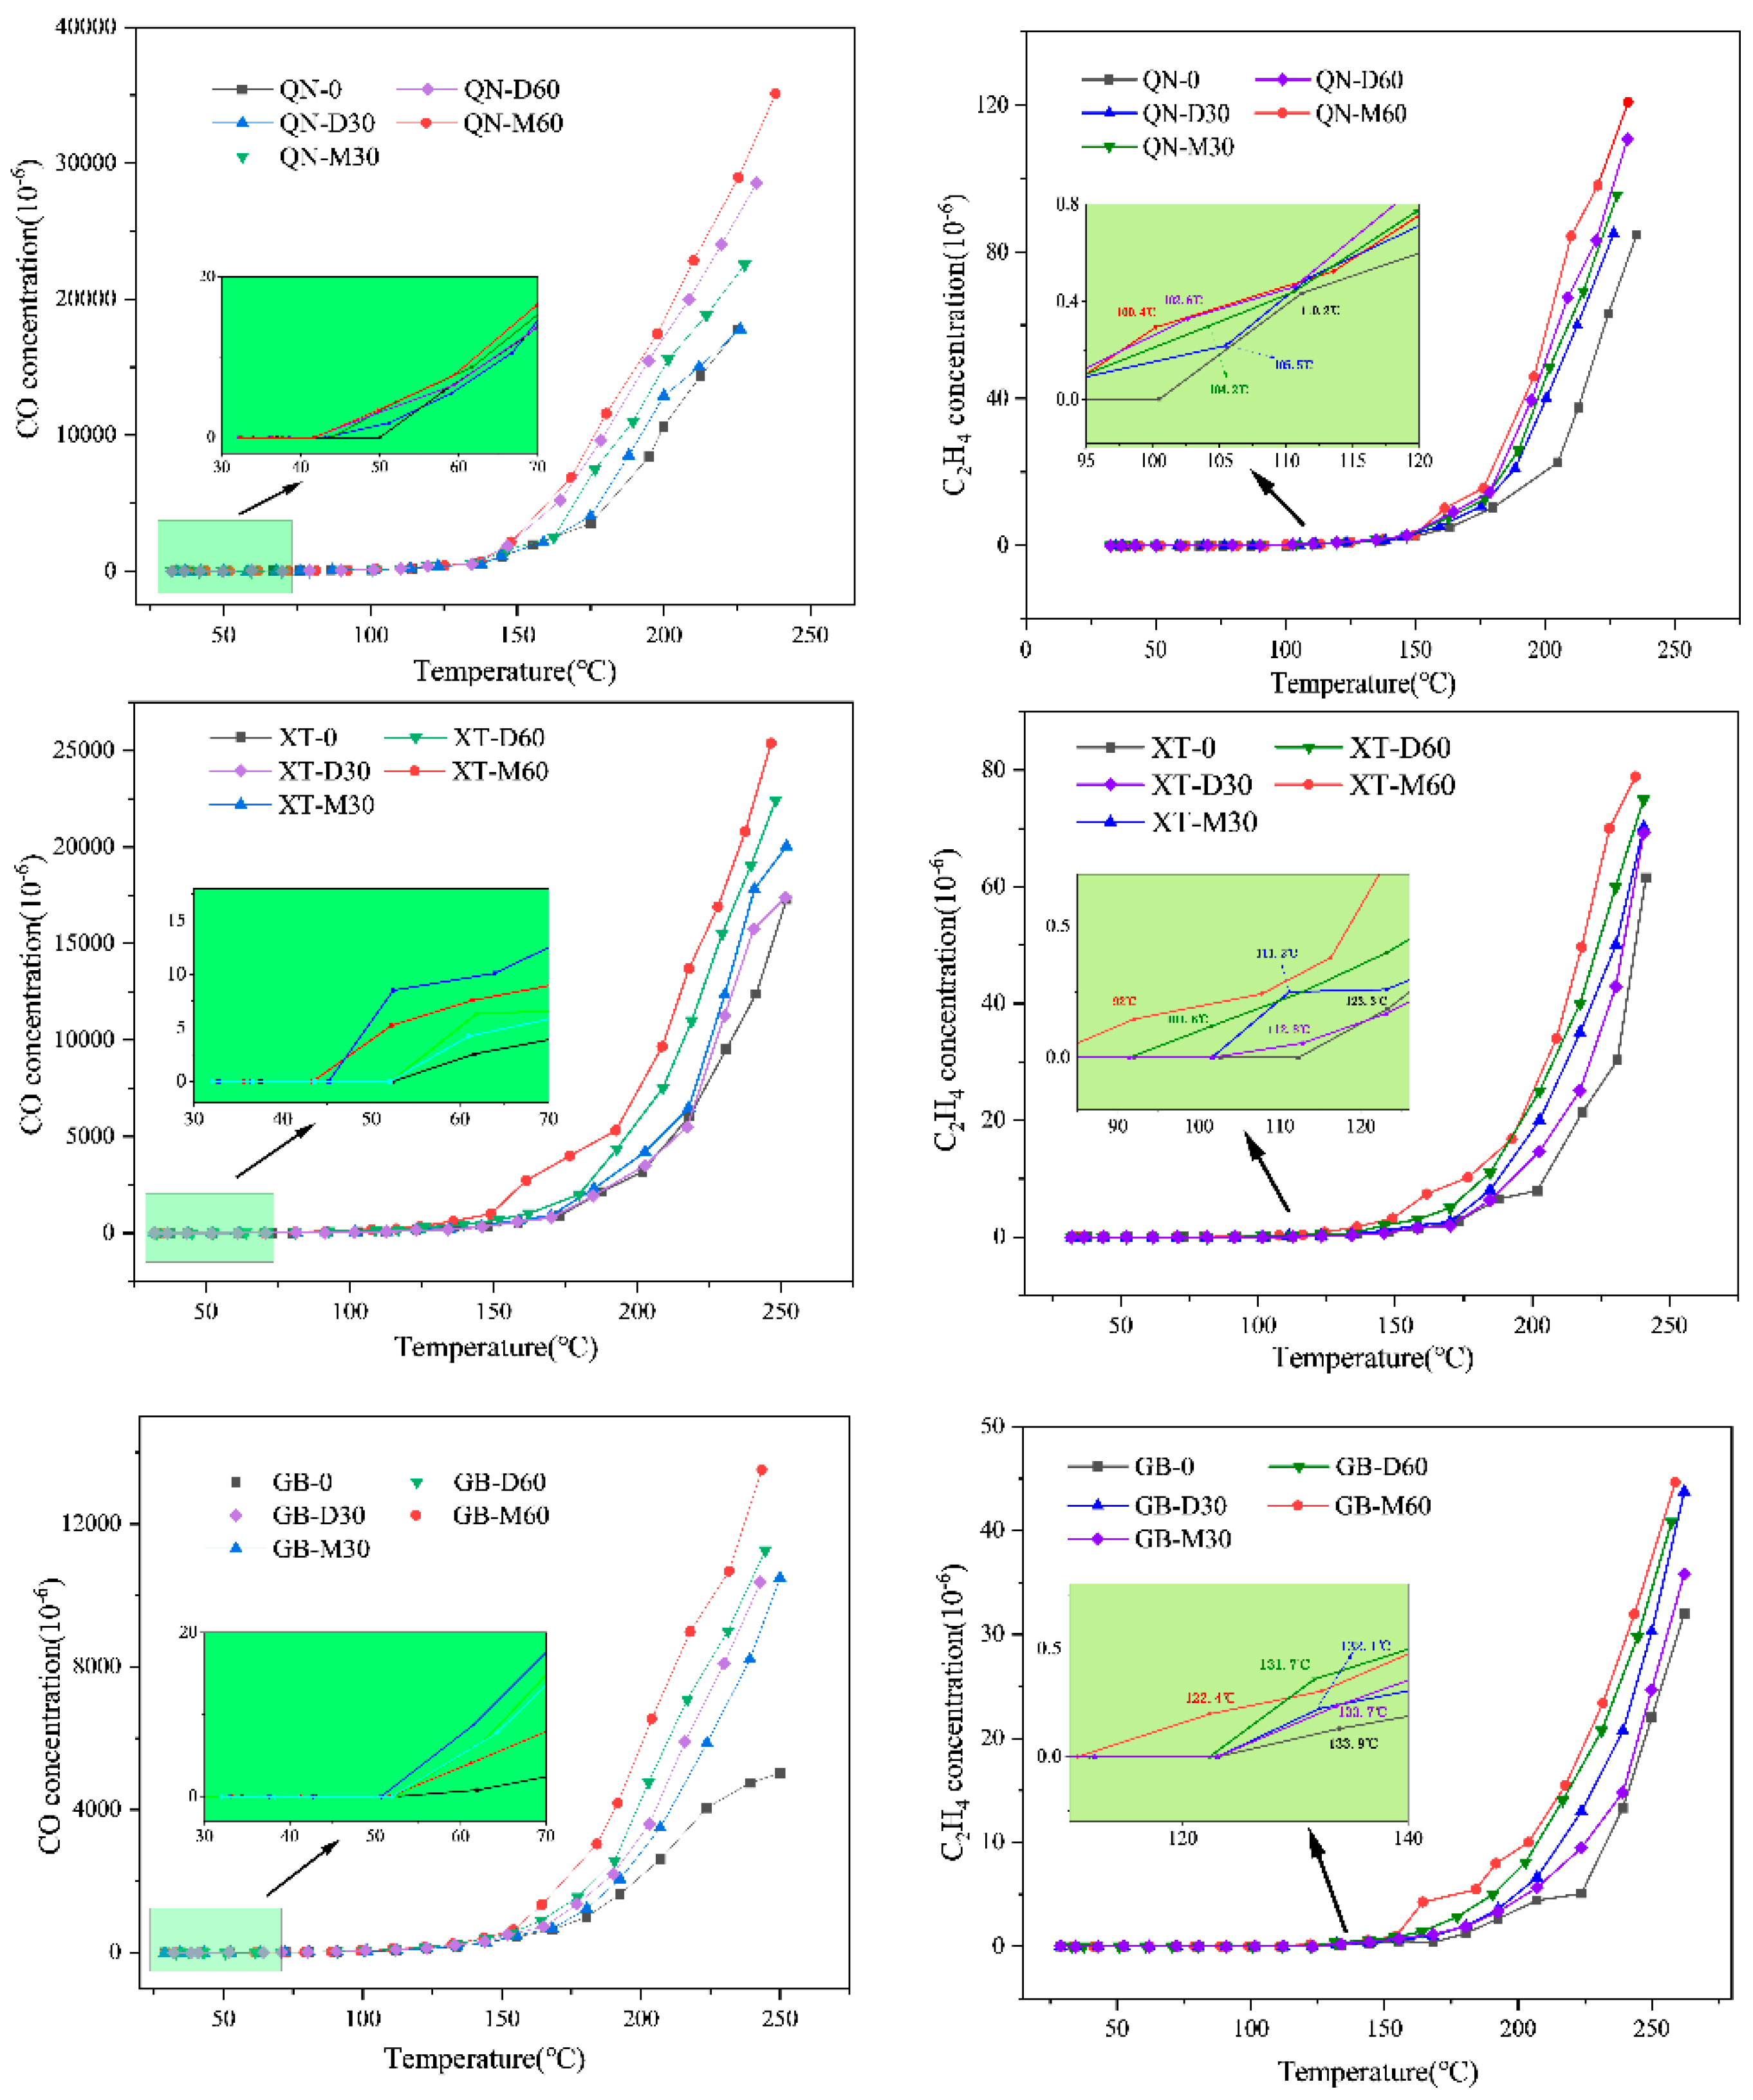
According to the SC characteristics of water-soaked coal, the water-soaked and air-dried coal corresponds to a lower apparent activation energy than raw coal. As the soaking time goes by, the hazard of coal SC rises. Moreover, the soaked and dried coal consumes more oxygen and generates more gas during low-temperature oxidation, and its CPT decreases. Water soaking and air drying enhances the oxidation ability of coal. Water–gas replacement caused by the goaf drainage contributes to the SC of residual coal.
By establishing a model to simulate drainage tests, we determined that the position of air leakage channels greatly influences the oxygen distribution during goaf drainage. When the air leakage channel is on the same side of the drainage hole in the goaf, gas mainly migrates directly to the drainage hole along the sealing wall, and the air leakage channel rarely influences the central position in the goaf. When the air leakage channel and the drainage hole are in opposite position, gas gradually migrates through the central position of the goaf, resulting in a wide influence range, and a wider SC hazardous area. This conclusion fills the gap in the research on the SC law of residual coal during goaf drainage.
An on-site monitoring of the variations of internal pressure, gas composition and temperature during the drainage of the water-soaked the 7225 goaf in QN Coal Mine verified the simulation results. That is, before drainage, a certain air leakage occurs in the sealing wall due to the pressure difference between the inside and outside of the sealing wall. During water drainage, an increase in the pressure difference intensifies the air leakage of the sealing wall and expands the range of air leakage. The goaf, which is originally in an inert environment, experiences secondary oxidation after the sudden entry of oxygen, leading to a considerable temperature rise. After the drainage, the continuous nitrogen injection raises the internal pressure of the goaf and makes the goaf inert, hence effectively preventing the oxidation of the deep residual coal in the goaf.
5.2. Dynamic Optimization Technology for Nitrogen Injection
Since the air leakage channel, ponding area distribution, ponding volume and nitrogen injection parameters in mine ponded goafs differ, the simulation and the results of nitrogen injection parameters of drainage in a single goaf are not applicable to other goafs. The nitrogen injection for inerting and air leakage alleviation during goaf drainage should be formulated according to factors such as the ponding characteristics of the goaf. Therefore, before goaf drainage, the distribution of ponding area and ponding volume in the goaf should be accurately explored, so as to determine the drainage borehole arrangement and drainage time and calculate the drainage flow. According to the similar simulation experiment described in this paper, it can be concluded that the ratio of nitrogen injection and water discharge is about 1:1. For safety consideration, the ratio of nitrogen injection and water discharge is increased to 1.5:1. In addition, the gas migration law in the goaf and the change law of coal SC hazardous area can be analyzed with the aid of a similar simulation method. On this basis, a preliminary nitrogen injection scheme during drainage is formed according to the simulation results. The model parameters can be optimized with reference to the formed scheme and the on-site measurement results. Subsequently, the optimal nitrogen injection parameters for the goaf can be determined before the implementation of water drainage. In addition, during and after drainage, effect-inspecting holes can be arranged to monitor and analyze the variations of internal pressure and oxygen concentration in the goaf in real time, and the prevention measures can be flexibly adjusted according to the variations of internal gas composition and concentration.
6. Conclusions
(1) Compared with raw coal, water-soaked coal requires notably less energy for spontaneous combustion (SC). The average apparent activation energy
Ea of coal soaked in distilled water for 60 days is 80.29 kJ/mol, 5.19 kJ/mol lower than that of raw coal, indicating that water soaking promotes the oxidation ability of coal and enhances its SC propensity. Water-soaked coal consumes more oxygen in the oxidation process, and its CPT occurs earlier. With the passage of soaking time, the SC propensity of coal increases significantly. In addition, coal soaked in mine water poses a greater hazard of SC than that soaked in distilled water [
32].
(2) The simulation results show that after water is drained, air leakage in the goaf significantly intensifies, and the maximum pressure difference inside and outside the goaf is up to 498 Pa. The water–gas replacement leads to a higher SC hazard of residual coal, and air leakage in both air inlet and return roadways at the same time have the greatest impact on the SC hazardous area in the goaf. When air leaks from a single air inlet, the air leakage at the air inlet opposite to the water outlet has a greater impact on the goaf. The oxygen concentration of the test system rises to 18% within the influence range of air leakage in the air inlet roadway during water drainage. Under the condition of 6 L/min nitrogen injection, the 1# air inlet and the 2# nitrogen injection hole, nitrogen is distributed the most uniformly in the model, forming a good inert environment.
(3) The variations of internal parameters during the drainage of the water-soaked 7225 goaf in QN Coal Mine were measured on site. The field measurement results show that the risk of spontaneous combustion of residual coal increases during the water discharge, and the temperature inside the goaf increases during the water discharge, which is conducive to the spontaneous combustion of coal. For safety consideration, the ratio of nitrogen injection and water discharge was increased to 1.5:1. The spontaneous combustion risk of coal left in the goaf was eliminated by nitrogen injection.


