Abstract
The transcritical CO2 (T-CO2) power cycle using low temperature waste heat is a promising technique for energy saving and environmental protection. However, according to the literature, there is no commercialized unit in service yet. This study provides developers a reference to shorten the design phase of the T-CO2 cycle commercialization process. A sensitivity analysis of the system performance, i.e., thermal efficiency and net power output, regarding the isentropic efficiencies of pump () and expander () and the heat source temperature () has been carried out using MATLAB and NIST REFPROP database. Simple and recuperative configurations are investigated based on their own optimal working pressures. The results show that the enhancement of has a greater influence on improving the system performance, but the improvement will diminish as , , and increase. Although better system performance can be achieved with higher , , and , the cost of the system equipment will also increase due to the higher optimal working pressure. In addition, increasing and will negatively affect the effectiveness of the recuperator. Therefore, the turbomachinery efficiencies and the heat source temperature should be considered simultaneously for the most cost-effective system design.
1. Introduction
The global energy demand has grown considerably in recent years due to the population explosion and increasing industrial activities. Fossil fuels, the primary energy source nowadays, are no longer sustainable because of their limited amount. Burning fossil fuels also leads to undesirable effects, such as air pollution and global warming, etc. [1,2]. Therefore, seeking alternatives for power generation to mitigate the dependence on fossil fuels and relieve the environmental impacts is an urgent task around the globe. As such, much attention has been given to renewable energies. However, renewable energies are usually limited by their availability and cannot be used for providing base load power [3,4]. Using a heat-to-power system to recover the industrial waste heats, especially at low temperature levels, is another feasible way to reduce the fossil fuel consumption.
It is reported that approximately 50% of energy in industrial processes is released to the environment in the form of low grade heat without further usage, causing thermal pollution [5]. In Europe, approximately 100 TWh of potentially recoverable thermal energy, with the temperature range between 100 and 200 °C, has been wasted annually through industrial processes [6]. Generally, the waste heat rejected by conventional fossil fuel power plants also lies within this temperature range [7]. If these industrial waste heats can be properly re-utilized, it not only fulfills the goal of sustainable energy supply and the reduction of fossil fuel consumption, but also possesses environmentally friendly merits at the same time [8,9,10,11].
Steam-based power plants cannot efficiently utilize such low temperature heat sources due to the high evaporation temperature of water [8,12]. Organic Rankine cycles (ORC) have been widely adopted in geothermal fields and industrial waste heat recovery systems with low-to-medium temperature heat sources [11,12,13,14,15,16,17]. However, the inherent high global warming potential (GWP) of the organic fluids that are commonly used in existing ORCs (i.e., R134a, R245fa) have imposed uncertainties on their future development [2,18]. Some of the organic fluids are flammable, toxic, or chemically unstable at a certain temperature level [15], which are not favorable features for the working fluid in power units. In addition, most of the ORCs are operated as subcritical cycles [15], the performances of which are limited by the constant temperature evaporation process. The unmatched temperature profile between the working fluid and the heat source in subcritical ORCs results in a so-called pinching problem and the irreversibility in the evaporator is consequently increased [19,20,21,22].
Transcritical CO2 (T-CO2) power cycles have been drawing attention in low temperature heat recovery in the past decade (the term “transcritical” means the high-pressure side of the cycle is above the critical point while the low-pressure side is below it). In a transcritical cycle, the working fluid temperature during the heating process is continuously rising, thus providing a well-matched temperature profile with the sensible heat sources [19,20,21,22,23]. Therefore, the T-CO2 cycles can make better use of the thermal energy from the heat sources [1,2]. Compared to the fully supercritical CO2 cycles, less power consumption for pressurizing is needed in T-CO2 cycles attributed to the high density of the condensed CO2 [4,15,24,25]. Studies show that the T-CO2 cycles have the potential to outperform ORCs and supercritical CO2 cycles in recovering low temperature heat sources [23,25].
As for the working fluid, CO2 possesses low environmental impact and potentially high energy performance [4,22,26]. CO2 has zero ozone depletion potential (ODP) and the GWP of CO2 is 1 over 100 years [18]. The low critical temperature of CO2 (31.0 °C) make it easily surpass the critical point by low temperature heat sources, and it has been verified to work stably in the transcritical region [24]. Velez et al. [21] showed that the T-CO2 cycle can convert heat into power with the expander inlet temperature as low as 60 °C. CO2 being a natural fluid is abundant in the nature, easily accessible and less expensive than organic fluids [7,9,10,23]. In addition, CO2 is non-toxic, non-flammable, non-explosive, less corrosive than steam, and compatible with most of the materials [10,23,27,28]. Furthermore, the thermodynamic properties of CO2 in the working range of interest are well known, even in supercritical state [27]. These characteristics make CO2 an attractive working fluid for low temperature heat-to-power units.
Chen et al. [1] indicated that the T-CO2 cycle performs slightly better than the R123-ORC based on the same heat rejection condition. In another study that aimed to recover the 200–350 °C exhaust from vehicles [29], the authors found that the recuperative T-CO2 cycle with low working pressure has higher thermal efficiency compared to the CO2 Brayton cycles. Li et al. [2] compared a T-CO2 cycle and a R245fa-ORC in recovering 120–260 °C low grade heat. Although R245fa-ORC presents higher energy and exergy efficiencies, T-CO2 cycle is more promising in the future because of its negligible environmental impacts. They also pointed out that the installation of a recuperator is recommended for both cycles in most cases. Amini et al. [7] conducted a practical study of using T-CO2 cycle to recover the 150 °C residual heat from a power plant in Iran. Taking the economic considerations into account, the T-CO2 cycle can generate 0.9% of the power plant capacity (4.04 MW) and the overall efficiency can be increased by 0.4%. Lecompte et al. [10] reviewed the experimental results of supercritical and transcritical heat recovery systems. CO2 is a promising working fluid theoretically for close-loop transcritical cycles. However, poor test results were obtained owing to the non-optimized turbomachinery. Cayer et al. [27,30] performed two consecutive studies on T-CO2 cycle with an industrial waste heat also at 100 °C. By varying the working pressure while the maximal and minimal temperatures in the cycle are fixed, optimal working pressures can be found with respect to each objective [27]. T-CO2 cycle has advantages in heat transfer characteristics but falls short in energy efficiency and power output compared to R125 and ethane ORCs, respectively. However, it is also suggested that no fluid can outperform the others in all aspects [30]. Baik et al. [20] compared two transcritical cycles using CO2 and R125, respectively, in terms of power output with heat source temperature at 100 °C. Results showed that higher expander inlet temperature can be obtained with CO2 due to its better heat transfer characteristic. Even though the relatively high working pressure of the T-CO2 cycle results in larger pumping power consumption and its net power output is 14% lower than that of the R125 cycle consequently, R125 is no longer acceptable owing to its high GWP [23]. Yoon et al. [31] compared a T-CO2 cycle and a toluene-ORC as the bottoming cycle of a Capstone C30 micro gas turbine with exhaust gas at 276 °C. The T-CO2 cycle performs better than the toluene-ORC in certain situations since it has no phase change and no pinching problem during the heating process. H. Yamaguchi et al. [24] established and tested a prototype of solar-powered T-CO2 cycle, where 11% of thermal efficiency was acclaimed with the expander inlet temperature at 165 °C and pressure ratio of about 1.4. However, the expansion process was via an expansion valve instead of a real expander.
Despite the aforementioned advantages of T-CO2 cycle in recovering low temperature heat sources, there is no commercialized unit in service yet according to literature. Among the main components in T-CO2 cycles, the performances of pump and expander can greatly influence the overall system performance [7,29]. Both of them are still in developing phase and neither has been commercially manufactured yet [26,32,33]. However, most of the previous studies on T-CO2 cycles were based on constantly fixed isentropic efficiencies of pump () and expander () (the commonly assumed values of and in literatures are collected in Table 1). Those results are only applicable for specific and , but they may not have the expected values in real cases. Therefore, a more comprehensive analysis of the T-CO2 cycle performance regarding and was conducted in this study.

Table 1.
Commonly assumed values of and in literatures.
This study aims at providing a clear view of how T-CO2 cycles will perform under various scenarios of and with low temperature heat sources. Developers can take it as a reference in designing the T-CO2 cycles to shorten the design phase of the commercialization process. To this end, a sensitivity analysis of T-CO2 cycles regarding and (65–95%) has been carried out at low temperature levels (120–180 °C). A similar study has been conducted by D. Novales et al. [32] on supercritical CO2 cycles with a high heat source temperature of 700 °C, but very few studies can be found focusing on the current study. The configurations investigated in this study are simple and recuperative cycles, since they are more preferable for low temperature heat sources according to the literature [26].
2. Cycle Configurations
The working principle of the T-CO2 cycles is illustrated by the temperature-entropy (T-s) and pressure-volume (P-v) diagrams shown in Figure 1 and Figure 2, respectively. The cycle mainly consists of turbomachinery (Pump, Expander) and heat exchangers (Heater, Condenser, Recuperator). The subcritical working fluid is pressurized over critical pressure through the Pump (1-2) and isobarically heated by heat source in the Heater (2-3) to reach supercritical state. The supercritical working fluid is then expanded through the Expander (3-4) and the high pressure and high temperature energy could be converted into electricity via a coupled generator (the generator will not be discussed in this study). Finally, the exhaust from the expander is isobarically cooled down by heat sink in the Condenser (4-1). To this point, the cycle is completed and then recommences. The red and blue segments in the figures display the hot side and the cold side of the system, respectively. The yellow marks in Figure 1 indicate the locations of minimal temperature difference in heat exchangers (the pinch points).
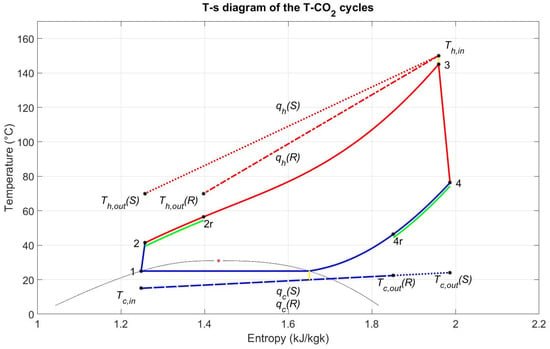
Figure 1.
Temperature-entropy (T-s) diagram of the T-CO2 cycles. (S) = Simple cycle; (R) = Recuperative cycle.
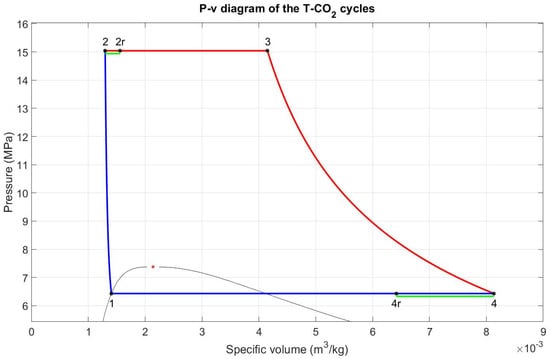
Figure 2.
Pressure-volume (P-v) diagram of the T-CO2 cycles.
A recuperator can be added to preheat the working fluid before entering the heater by recovering the residual heat from the expander exhaust. The recuperating process is presented by the green segments in the figures and the subscripts for the inlet of heater and the inlet of condenser in recuperative cycle are re-denoted as 2r and 4r, respectively. It should be mentioned here that, in Figure 1, the temperature profiles of the heat source and the heat sink are intentionally aligned with that of the working fluid in heater and condenser, respectively, so the entropy values on the x-axis refer to CO2 only.
3. Methods
For simplicity, this study was carried out based on the following assumptions: (i) Saturated liquid state CO2 was assumed at the pump inlet. (ii) The energy losses (heat loss, pressure loss, etc.) within piping and heat exchangers were neglected. (iii) All the fluids were steady-state flow throughout the process.
3.1. Energy Analysis
The correlations of energy analysis and the simulation process were established in MATLAB (R2019b) environment based on the first law of thermodynamics. The fluid properties were read from the NIST REFPROP database (v.9.1) [36] with ready-to-use formulas in MATLAB (Mathworks, Natick, MA, USA).
For pump and expander:
where and denote the isentropic efficiencies as mentioned. h is the enthalpy at each state point, where the subscript s suggests the isentropic process.
For heater and condenser:
where q is the heat transfer rate in each heat exchanger, where the subscripts h and c represent the heater and the condenser, respectively. is the mass flow rate of the fluid. In the recuperative cycle, and are replaced by and , respectively.
For recuperator:
where is the effectiveness of the recuperator. is defined as the theoretical minimal enthalpy of CO2 at the recuperator hot side outlet when equals to [2,25,34].
For the overall system:
where is the specific net power output and represents the thermal efficiency of the cycle.
3.2. Simulation Process
The schematic of the simulation process is shown in Figure 3. Three cases of heat source temperatures (), 120 °C, 150 °C, and 180 °C, were adopted to cover possible applications. Firstly, the fixed parameters shown in Table 2 were imported into the mathematical model established in MATLAB. The pump inlet temperature () was fixed at 25 °C and the corresponding saturated pressure () was 6.43 MPa. The ambient pressure () and temperature () were assumed at 0.1 MPa and 15 °C, respectively. The pump outlet pressure (), which is also known as the working pressure in this study, was varied from 8 MPa to 30 MPa with a step increase of 0.02 MPa. The pinch point temperature differences () in heat exchangers were all assumed at 5K [30,37]. The location of the pinch point in the heater was kept at its outlet or equivalently, the expander inlet, to obtain the theoretically highest expander inlet temperature () under the restriction [11,17,21,31]. and were initially set at 65% and will be gradually increased to 95% afterwards. Secondly, as the CO2 conditions at state point 1 and 3 are known, the pump outlet temperature () and the expander outlet temperature () can be derived using Equations (1) and (2). For the recuperative cycle, the pinch point in recuperator will occur at its hot side outlet due to the smaller specific heat capacity of CO2 in low pressure region [25,34]. Therefore, the hot side outlet temperature of the recuperator () was constantly 5K above and then, its cold side outlet temperature () can be calculated using Equation (5). To this point, the conditions of CO2 at each state point in both cycles under specific , , and were all acquired. Then, the optimal for both cycles can be found, respectively [2,27,37]. Finally, and were varied from 65% to 95% with a 5% step increase of one component at a time and the whole process above was repeated with different . A system performance map related to , , and was established for the sensitivity analyses.
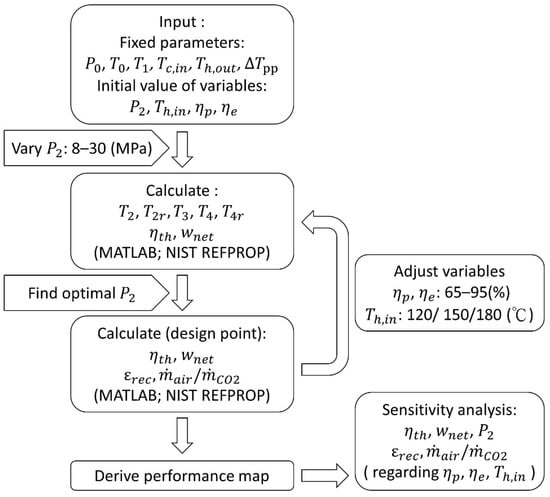
Figure 3.
Schematic of the simulation process.

Table 2.
Fixed parameters.
For the surroundings, hot air was selected as the heat source in this study and a lower limit of 70 °C was imposed on its outlet temperature () to prevent acid formation or fouling in the component and piping [7]. For convenience, was fixed at 70 °C since the heat recovery efficiency is not the focus in this study. Then, the mass flowrate of hot air () can be derived by energy balance in the heater. In order to provide readers a sense of the amount of heat source needed per unit mass of CO2 (or vice versa), / will be presented. The heat sink was cold water at the ambient temperature of 15 °C [9,15], and its mass flowrate () and outlet temperature () were calculated to meet the restriction within 0.1 °C difference. However, as the water-cooling mechanism is relatively mature, only a brief description will be given to the condenser side.
3.3. Verification
The mathematical models of the simple cycle and the recuperative cycle in this study have been verified with references [20,34], respectively. It can be seen in Table 3 that the main parameters derived from the mathematical models well agree with the literature, considering that not all the information required was revealed. Therefore, the accuracy of the simulation in this study is considered acceptable.

Table 3.
Verification with references.
4. Results and Discussions
In this section, the sensitivity analyses of simple and recuperative T-CO2 cycle performances regarding and at low temperature levels will be presented. The main performance indicators are and at the design point. The effectiveness of recuperator will be investigated as well. In addition, two mass flow rate ratios, i.e., the heat source to CO2 and the heat sink to CO2, under various operating conditions are provided for estimating the size of the heat exchangers.
4.1. Simple Cycle
4.1.1. Design Point Setting for the Simple Cycle
The system performance of the simple cycle regarding is demonstrated using a standard case with 80% of both and and 150 °C of , since the other sets would show similar trend of results. It is clearly seen from Figure 4 that both and will first increase and then decrease as varies from 8 MPa to 30 MPa (the corresponding pressure ratio is about 1.2 to 4.7). This can be explained by the enthalpy variations at each sate point as shown in Figure 5. It is observed that the increment of enthalpy difference in the expander () becomes gradually smaller, while that in the pump () grows steadily as increases. Therefore, there exist peak values for and over the investigated range of . In addition, since the enthalpy difference in the heater () is gradually decreased with the increase of , the maximal thermal efficiency () is found to occur at higher pressure region with regard to the maximal net power output () in the simple cycle [23].
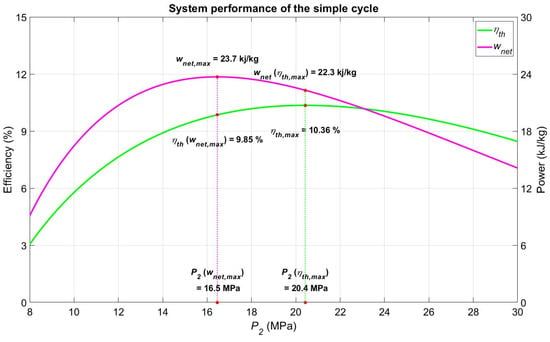
Figure 4.
System performance of the simple cycle regarding (; ).
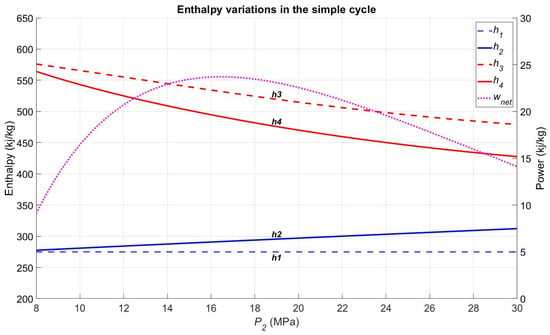
Figure 5.
Enthalpy variations at each state point in the simple cycle regarding (; ).
Considering the and values and the corresponding , the design criterion is selected for the simple cycle in the following analysis. In this way, more can be extracted from the heat source with lower and just a small penalty of loss compared to the design criterion. Studies also suggested that in such heat recovery systems with nearly-free heat sources, the focus should be on maximizing the power output [22,27,30,35].
4.1.2. Sensitivity Analysis of the Simple Cycle Performance Regarding and
Figure 6 shows the and of the simple cycle at the design point under different circumstances of , , and . It can be clearly noticed that both and will increase with and as expected. Furthermore, they are more sensitive to rather than as can be inferred from Figure 6. Taking the standard case for example, if is enhanced from 80% to 85 % and the other parameters are fixed, then and can be increased by 12% and 10.7%, respectively. On the other hand, if the variable becomes instead, then the increments will decrease to 5% for and 4.2% for , respectively. It can also be found that is less sensitive to and compared to . Thus, by setting the design point based on , the system performance will be more stable as the and fluctuate during operation. The developers can also gain more flexibility in designing the components. A more detailed sensitivity of the system performance per 5% variation of is shown in Figure 7, since is more influential than .
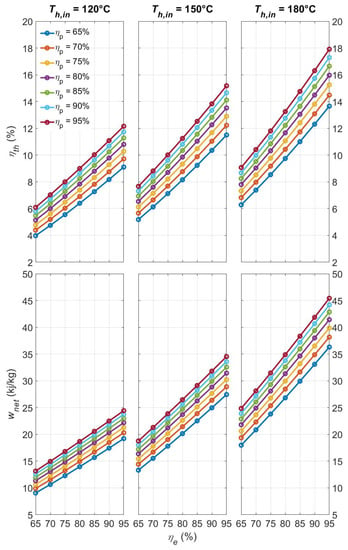
Figure 6.
and of the simple cycle at the design point under different circumstances of , , and .
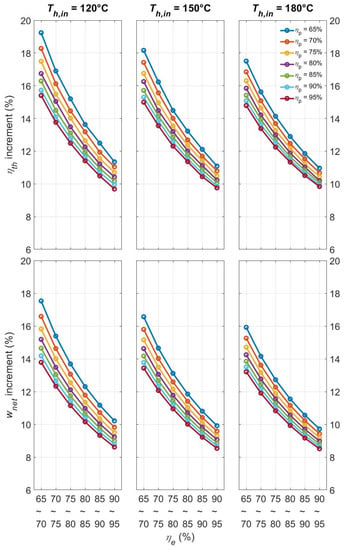
Figure 7.
and increments of the simple cycle at the design point resulting from enhancing .
It is clearly seen from Figure 7 that the contribution of enhancing to the system performance is gradually reduced as increases. In addition, the benefits gained from enhancing are slightly decreased with higher and as well. Thus, compromises should be made between the investment for more refined turbomachinery and the profits gained from the system performance improvement. Based on the assumptions made in this study, the largest increments of and derived from a 5% enhancement of are 19.2% and 17.5% over the investigated range, respectively, both of which occur at the point when is increased from 65% to 70% with 65% of and 120 °C of .
It is noteworthy that will increase with and and the increase becomes more pronounced with higher , as shown in Figure 8. Since is strongly related to the total cost [7,30], the extra cost for the high-pressure equipment should be concerned when attempting to increase the system performance by utilizing higher temperature heat sources or pursuing higher turbomachinery efficiencies. It is also suggested that enhancing the in simple cycle is most profitable in recovering lower temperature heat sources, due to the larger increments of the system performance and the lower penalty of the additional cost resulting from the pressure increase.
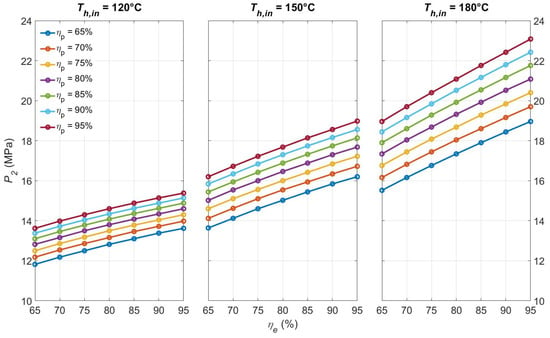
Figure 8.
of the simple cycle at the design point under different circumstances of , , and .
4.2. Recuperative Cycle
4.2.1. Design Point Setting for the Recuperative Cycle
In contrast to the simple cycle, is achieved at a lower with respect to in the recuperative cycle as shown in Figure 9. This is because the enthalpy difference in the recuperator ( and , or equivalently, ) is gradually reduced as increases, which is displayed in Figure 10. The lower performance of the recuperator at high pressure leads to a larger amount of heat energy required from the heat source. Consequently, occurs at lower pressure region (the vertical lines in Figure 9 and Figure 10 represent the point where is reduced to zero).
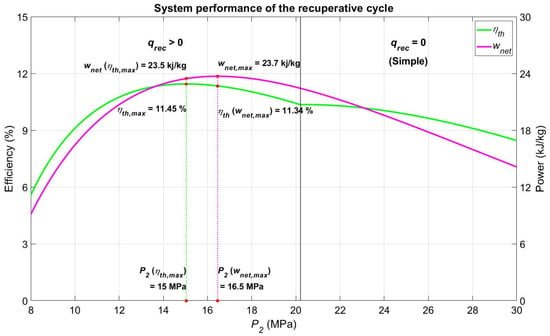
Figure 9.
System performance of the recuperative cycle regarding (; ).
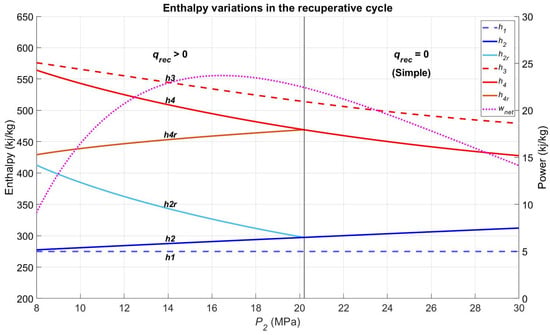
Figure 10.
Enthalpy variations at each state point in the recuperative cycle regarding (; ).
It should be noted that the recuperating process mainly affects the heat transfer rate in the heat exchangers. The behavior of regarding in the recuperative cycle is basically the same as that in the simple cycle, while is generally higher since the heat energy required from the heat source is reduced. Thus, the design criterion is selected for the following analysis of the recuperative cycle, considering that higher is achievable with a lower and a negligible expense of .
4.2.2. Sensitivity Analysis of the Recuperative Cycle Performance Regarding and
Similar to Section 4.1.2, Figure 11 shows and of the recuperative cycle at the design point under different circumstances of , , and . It is clear that the and of the recuperative are also more sensitive to rather than . Based on the standard case, and can be increased by 8.9% and 10.7%, respectively, when varies from 80% to 85 %. While the increments are only 3.5% and 4.2% for and , respectively, if the variable becomes instead. As such, the focus in the following paragraph will be on as well. It can also be found that, unlike in the simple cycle, responds less sensitively to the and variations than does. For the same reason as in Section 4.1.2, adopting the design criterion will be more beneficial for the recuperative cycle.
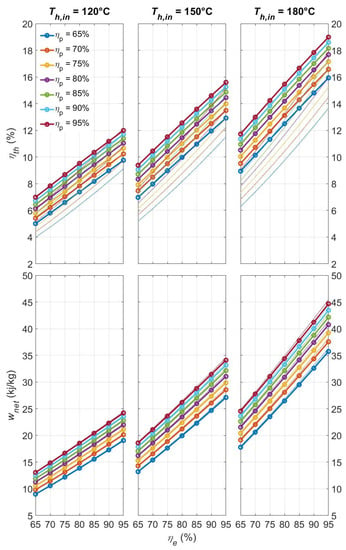
Figure 11.
and of the recuperative cycle at the design point under different circumstances of , , and (the dotted lines represent the values of the simple cycle in Figure 6).
From Figure 12, the behaviors of and in recuperative cycle regarding show the same trend as that in the simple cycle. The variation of has no significant difference from the simple cycle despite the fact a different design criterion is adopted. Although the increment of contributed by enhancing is smaller compared to the counterparts in simple cycle, especially with higher , the recuperative cycle generally performs better with higher . In addition, it can be seen from Figure 13 that the advantage of lower of the recuperative cycle is more pronounced as increases.
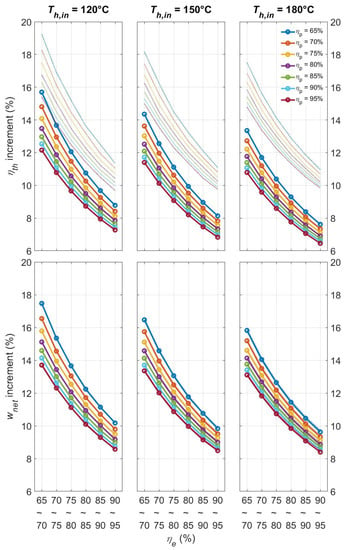
Figure 12.
and increments of the recuperative cycle at the design point resulting from enhancing (the dotted lines represent the values of the simple cycle in Figure 7).
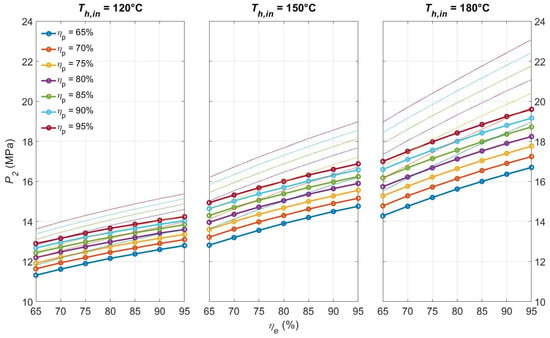
Figure 13.
of the recuperative cycle at the design point under different circumstances of , , and (the dotted lines represent the value of simple cycle in Figure 8).
In fact, it is not worthwhile to increase the and in the recuperative cycle if is too low. For example, at 120 °C of and 95% of both and , the of recuperative cycle is 11.99%, which is even slightly lower than the 12.16% obtained in the simple cycle under the same conditions. This is because the low and high and will result in the low performance of the recuperator. In this situation, the recuperator does not help improving the system performance, so the system performance is inevitably inferior to the simple cycle if the design point is still set at a lower .
4.2.3. Effectiveness of the Recuperator Regarding and
From Figure 14, it can be seen that the sensitivity of regarding and will be significantly affected by and the influence of on is larger than that of . In lower temperature environments, varies more drastically with and . As and increase, will decrease due to the higher and lower resulting from higher and , respectively. In other words, pursuing the high turbomachinery efficiencies will adversely affect the recuperator performance, especially with lower . Therefore, the influences of , , and should be considered simultaneously when evaluating the cost-effectiveness of the recuperative cycle.
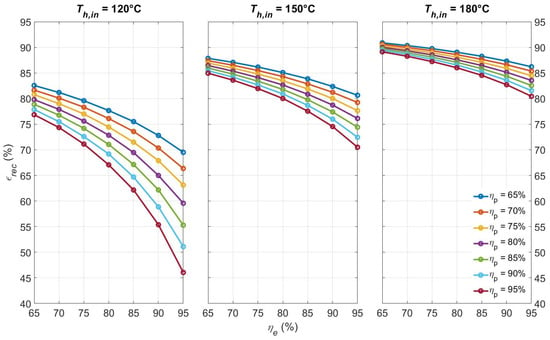
Figure 14.
at the design point under different circumstance of , , and .
4.3. Surrounding Conditions
4.3.1. Mass Flow Rate Ratio of Heat Source to CO2
For the heat source, the average values of / regarding are plotted in Figure 15 with the range covering all the conditions of . The influences of and on / are insignificant, while plays a decisive role on that in both cycles. In general, the pump has less effect, especially in the recuperative cycle.
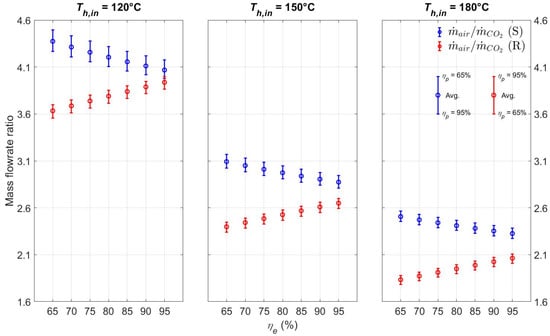
Figure 15.
/ at the design point under different circumstances of , , and (S) = Simple cycle; (R) = Recuperative cycle.
In the simple cycle, / is slightly decreased as increases. At all temperature levels investigated, / decreases around 7% as increases from 65% to 95%. On the other hand, / will increase significantly as decreases. As decreases from 180 °C to 150 °C, / will increase around 23%, and an additional 41% will occur as further decreases to 120 °C.
In the recuperative cycle, it can be seen from Figure 15 that the / is generally lower compared to the simple cycle, which means the size and the cost of the heater can be potentially reduced. It can also be noticed that, in contrary to the simple cycle, the / in recuperative cycle will increase with . As increases from 65% to 95%, / increases around 8–12% due to the lower . The temperature influence on / is more significant in the recuperative cycle. When decreases from 180 °C to 150 °C, / increases around 30%, and another 50% increment occurs when further reduces to 120 °C. Therefore, the advantage of smaller heater size of recuperative cycle will be more pronounced with lower and higher .
Since in general the mass flow rate can be directly related to the size of the heat exchangers, the heater size will almost double as decreases from 180 °C to 120 °C in both cycles. Although T-CO2 cycle is promising in recovering the low temperature heat sources, the larger physical footprint and more material used will bring higher costs and should be considered when exploiting the low temperature heat sources by T-CO2 cycles.
4.3.2. Mass Flow Rate Ratio of the Heat Sink to CO2
For the heat sink, / is almost not affected by , , and . In the simple cycle, the required is about six times and is at around 23.7 °C for most cases. In the recuperative cycle, the cooling demand is slightly lower. The required is roughly 5.8 times and is at around 22.5 °C for most cases in the recuperative cycle.
5. Conclusions
The T-CO2 cycle using low temperature heat sources is a promising alternative for power generation to mitigate fossil fuel consumption. However, the turbomachinery components for CO2 in the working conditions of interest are still in developing phase. Therefore, a sensitivity analysis of T-CO2 cycles regarding the turbomachinery efficiencies has been carried out.
Considering the optimal working pressure, the design point of the simple cycle is set to the value at which the maximal net power output occurs, while the maximal thermal efficiency is chosen as the design point for the recuperative cycle. In this way, the system performances will also be less sensitive to the turbomachinery efficiencies and the developers can gain more flexibility in designing the components.
In both cycles, the expander has greater influence on the system performances. As , , and increase, the benefits of enhancing will diminish. Besides, the cost may be higher because of the higher optimal working pressure. Therefore, compromises should be made between the investment for more refined turbomachinery and the resulted profits gained from the system performance improvement. In general, the simple cycle is more suitable for lower , while the recuperative cycle performs better with higher .
In the simple cycle, enhancing is more profitable with lower , since its contribution to the system performance will be more pronounced and the cost resulting from the pressure increment is potentially lower.
In the recuperative cycle, the working pressure at the design point is lower than the simple cycle, especially with higher . In addition, is generally higher and less sensitive to the variations of and with higher as well. However, will gradually decrease as and increase, so the influences of , , and should be considered simultaneously when evaluating the cost-effectiveness of the recuperative cycle.
For the surroundings, / is slightly reduced as increases in the simple cycle, while it increases with in the recuperative cycle. The advantage of smaller heater size in recuperative cycle, due to the smaller /, is more pronounced with lower . As decreases, / will increase dramatically in both cycles. Therefore, although the T-CO2 cycles are promising in recovering low temperature heat sources, one should be aware that the heater size will increase significantly if the target is low. On the other hand, / is almost not affected by , , and .
The importance of this study lies in providing future developers the interactions between system performance, turbomachinery efficiencies, and heat source temperatures in the T-CO2 cycles. The developers can take it as a reference in designing the T-CO2 cycles, and for shortening the design phase during its commercialization process.
Author Contributions
Conceptualization, K.-H.L. and H.-W.D.C.; data curation, K.-H.L.; formal analysis, K.-H.L.; methodology, K.-H.L. and H.-W.D.C.; software, K.-H.L.; supervision, H.-W.D.C. and P.-J.W.; validation, K.-H.L.; writing–original draft, K.-H.L.; writing—review & editing, H.-W.D.C. and P.-J.W. All authors have read and agreed to the published version of the manuscript.
Funding
This research received no external funding.
Data Availability Statement
Not applicable.
Conflicts of Interest
The authors declare no conflict of interest.
Nomenclatures
| T | Temperature |
| P | Pressure |
| h | Enthalpy |
| Mass flow rate | |
| q | Specific heat transfer rate |
| w | Specific net power output |
| Abbreviations | |
| T-CO2 | Transcritical carbon dioxide |
| ORC | Organic Rankine cycle |
| GWP | Global warming potential |
| ODP | Ozone depletion potential |
| MATLAB | Matrix Laboratory |
| NIST | National Institute of Standards and Technology |
| REFPROP | Reference Fluid Thermodynamic and Transport Properties |
| Greek Symbols | |
| η | Efficiency |
| ε | Effectiveness |
| Subscripts | |
| 0 | Ambient condition |
| 1 | Pump inlet |
| 2 | Pump outlet |
| 3 | Expander inlet |
| 4 | Expander outlet |
| 2r | Recuperator cold side outlet |
| 4r | Recuperator hot side outlet |
| i | State point |
| pp | Pinch point |
| p | Pump |
| h | Heater |
| e | Expander |
| c | Condenser |
| rec | Recuperator |
| s | Isentropic process |
| in | inlet |
| out | outlet |
References
- Chen, Y.; Lundqvist, P.; Johansson, A.; Platell, P. A comparative study of the carbon dioxide transcritical power cycle compared with an organic Rankine cycle with R123 as working fluid in waste heat recovery. Appl. Therm. Eng. 2006, 26, 2142–2147. [Google Scholar] [CrossRef]
- Li, L.; Ge, Y.; Luo, X.; Tassou, S. Thermodynamic analysis and comparison between CO2 transcritical power cycles and R245fa organic Rankine cycles for low grade heat to power energy conversion. Appl. Therm. Eng. 2016, 106, 1290–1299. [Google Scholar] [CrossRef]
- Evans, A.; Strezov, V.; Evans, T.J. Assessment of sustainability indicators for renewable energy technologies. Renew. Sustain. Energy Rev. 2009, 13, 1082–1088. [Google Scholar] [CrossRef]
- Bellos, E.; Tzivanidis, C.J.A.S.I. Investigation of a Novel CO2 Transcritical Organic Rankine Cycle Driven by Parabolic Trough Solar Collectors. Appl. Syst. Innov. 2021, 4, 53. [Google Scholar] [CrossRef]
- Safarian, S.; Aramoun, F.J. Energy and exergy assessments of modified Organic Rankine Cycles (ORCs). Energy Rep. 2015, 1, 1–7. [Google Scholar] [CrossRef]
- Papapetrou, M.; Kosmadakis, G.; Cipollina, A.; La Commare, U.; Micale, G. Industrial waste heat: Estimation of the technically available resource in the EU per industrial sector, temperature level and country. Appl. Therm. Eng. 2018, 138, 207–216. [Google Scholar] [CrossRef]
- Amini, A.; Mirkhani, N.; Pourfard, P.P.; Ashjaee, M.; Khodkar, M.A. Thermo-economic optimization of low-grade waste heat recovery in Yazd combined-cycle power plant (Iran) by a CO2 transcritical Rankine cycle. Energy 2015, 86, 74–84. [Google Scholar] [CrossRef]
- Dai, Y.; Wang, J.; Gao, L. Parametric optimization and comparative study of organic Rankine cycle (ORC) for low grade waste heat recovery. Energy Convers. Manag. 2009, 50, 576–582. [Google Scholar] [CrossRef]
- Wang, J.; Sun, Z.; Dai, Y.; Ma, S.J. Parametric optimization design for supercritical CO2 power cycle using genetic algorithm and artificial neural network. Appl. Energy 2010, 87, 1317–1324. [Google Scholar] [CrossRef]
- Lecompte, S.; Ntavou, E.; Tchanche, B.; Kosmadakis, G.; Pillai, A.; Manolakos, D.; de Paepe, M. Review of experimental research on supercritical and transcritical thermodynamic cycles designed for heat recovery application. Appl. Sci. 2019, 9, 2571. [Google Scholar] [CrossRef]
- Yamaguchi, T.; Sasaki, S.; Momoki, S. Experimental study for the small capacity organic Rankine cycle to recover the geothermal energy in Obama hot spring resort area. Energy Procedia 2019, 160, 389–395. [Google Scholar] [CrossRef]
- Liu, B.-T.; Chien, K.-H.; Wang, C.-C. Effect of working fluids on organic Rankine cycle for waste heat recovery. Energy 2004, 29, 1207–1217. [Google Scholar] [CrossRef]
- Peris, B.; Navarro-Esbrí, J.; Molés, F.; Mota-Babiloni, A. Experimental study of an ORC (organic Rankine cycle) for low grade waste heat recovery in a ceramic industry. Energy 2015, 85, 534–542. [Google Scholar] [CrossRef]
- Tartière, T.; Astolfi, M. A world overview of the organic Rankine cycle market. Energy Procedia 2017, 129, 2–9. [Google Scholar] [CrossRef]
- Astolfi, M.; Lasala, S.; Macchi, E. Selection Maps For ORC And CO2 Systems For Low-Medium Temperature Heat Sources. Energy Procedia 2017, 129, 971–978. [Google Scholar] [CrossRef]
- Zhang, X.; Cao, M.; Yang, X.; Guo, H.; Wang, J. Economic analysis of organic Rankine cycle using R123 and R245fa as working fluids and a demonstration project report. Appl. Sci. 2019, 9, 288. [Google Scholar] [CrossRef]
- Morrone, P.; Algieri, A. Integrated Geothermal Energy Systems for Small-Scale Combined Heat and Power Production: Energy and Economic Investigation. Appl. Sci. 2020, 10, 6639. [Google Scholar] [CrossRef]
- Calm, J.M.; Hourahan, G.C. Physical, safety, and environmental data for current and alternative refrigerants. In Proceedings of the 23rd International Congress of Refrigeration (ICR2011), Prague, Czech Republic, 21–26 August 2011; pp. 21–26. [Google Scholar]
- Chen, H.; Goswami, D.Y.; Rahman, M.M.; Stefanakos, E.K. A supercritical Rankine cycle using zeotropic mixture working fluids for the conversion of low-grade heat into power. Energy 2011, 36, 549–555. [Google Scholar] [CrossRef]
- Baik, Y.-J.; Kim, M.; Chang, K.C.; Kim, S.J. Power-based performance comparison between carbon dioxide and R125 transcritical cycles for a low-grade heat source. Appl. Energy 2011, 88, 892–898. [Google Scholar] [CrossRef]
- Vélez, F.; Chejne, F.; Antolin, G.; Quijano, A. Theoretical analysis of a transcritical power cycle for power generation from waste energy at low temperature heat source. Energy Convers. Manag. 2012, 60, 188–195. [Google Scholar] [CrossRef]
- Tuo, H. Thermal-economic analysis of a transcritical Rankine power cycle with reheat enhancement for a low-grade heat source. Int. J. Energy Res. 2013, 37, 857–867. [Google Scholar] [CrossRef]
- Sarkar, J. Review and future trends of supercritical CO2 Rankine cycle for low-grade heat conversion. Renew. Sustain. Energy Rev. 2015, 48, 434–451. [Google Scholar] [CrossRef]
- Yamaguchi, H.; Zhang, X.; Fujima, K.; Enomoto, M.; Sawada, N. Solar energy powered Rankine cycle using supercritical CO2. Appl. Therm. Eng. 2006, 26, 2345–2354. [Google Scholar] [CrossRef]
- Kim, Y.; Kim, C.; Favrat, D. Transcritical or supercritical CO2 cycles using both low-and high-temperature heat sources. Energy 2012, 43, 402–415. [Google Scholar] [CrossRef]
- Liu, L.; Yang, Q.; Cui, G. Supercritical carbon dioxide (s-CO2) power cycle for waste heat recovery: A review from thermodynamic perspective. Processes 2020, 8, 1461. [Google Scholar] [CrossRef]
- Cayer, E.; Galanis, N.; Desilets, M.; Nesreddine, H.; Roy, P. Analysis of a carbon dioxide transcritical power cycle using a low temperature source. Appl. Energy 2009, 86, 1055–1063. [Google Scholar] [CrossRef]
- Montes, M.J.; Linares, J.I.; Barbero, R.; Rovira, A. Proposal of a new design of source heat exchanger for the technical feasibility of solar thermal plants coupled to supercritical power cycles. Sol. Energy 2020, 211, 1027–1041. [Google Scholar] [CrossRef]
- Chen, Y.; Lundqvist, P.; Platell, P. Theoretical research of carbon dioxide power cycle application in automobile industry to reduce vehicle’s fuel consumption. Appl. Therm. Eng. 2005, 25, 2041–2053. [Google Scholar] [CrossRef]
- Cayer, E.; Galanis, N.; Nesreddine, H. Parametric study and optimization of a transcritical power cycle using a low temperature source. Appl. Energy 2010, 87, 1349–1357. [Google Scholar] [CrossRef]
- Yoon, S.Y.; Kim, M.J.; Kim, I.S.; Kim, T.S. Comparison of micro gas turbine heat recovery systems using ORC and trans-critical CO2 cycle focusing on off-design performance. Energy Procedia 2017, 129, 987–994. [Google Scholar] [CrossRef]
- Novales, D.; Erkoreka, A.; De la Peña, V.; Herrazti, B. Sensitivity analysis of supercritical CO2 power cycle energy and exergy efficiencies regarding cycle component efficiencies for concentrating solar power. Energy Convers. Manag. 2019, 182, 430–450. [Google Scholar] [CrossRef]
- Salah, S.I.; Khader, M.A.; White, M.T.; Sayma, A.I. Mean-line design of a supercritical CO2 micro axial turbine. Appl. Sci. 2020, 10, 5069. [Google Scholar] [CrossRef]
- Kim, Y.M.; Sohn, J.L.; Yoon, E.S. Supercritical CO2 Rankine cycles for waste heat recovery from gas turbine. Energy 2017, 118, 893–905. [Google Scholar] [CrossRef]
- Kim, Y.-M.; Lee, Y.-D.; Ahn, K.-Y. Parametric Study of a Supercritical CO2 Power Cycle for Waste Heat Recovery with Variation in Cold Temperature and Heat Source Temperature. Energies 2021, 14, 6648. [Google Scholar] [CrossRef]
- Lemmon, E.W.; Huber, M.L.; McLinden, M.O. NIST Standard Reference Database 23: Reference Fluid Thermodynamic and Transport Properties-REFPROP, Version 9.1; National Institute of Standards and Technology: Gaithersburg, MD, USA, 2013.
- Autier, E.; Kouadri, A. Optimum for CO2 transcritical power Rankine cycle using exhaust gas from fishing boat diesel engines. IFAC Proc. Vol. 2009, 42, 132–139. [Google Scholar] [CrossRef]
Publisher’s Note: MDPI stays neutral with regard to jurisdictional claims in published maps and institutional affiliations. |
© 2022 by the authors. Licensee MDPI, Basel, Switzerland. This article is an open access article distributed under the terms and conditions of the Creative Commons Attribution (CC BY) license (https://creativecommons.org/licenses/by/4.0/).