Article

Key Parameters for Economic Valuation of V2G Applied to Ancillary Service: Data-Driven Approach

Gwangju Institute of Science and Technology, School of Integrated Technology, Gwangju 61005, Republic of Korea
*
Author to whom correspondence should be addressed.
Energies 2022, 15(23), 8815; https://doi.org/10.3390/en15238815
Submission received: 29 September 2022 / Revised: 15 November 2022 / Accepted: 20 November 2022 / Published: 22 November 2022

Abstract

:
Global automakers are speeding up both the suspension of production of internal combustion engine vehicles and the transition to electric vehicles (EVs) in order to respond to global goals to become carbon-free and energy-efficient. Recently, vehicle-to-grid (V2G) technology has reached the commercialization stage in Korea. Many studies have mostly discussed profits that an EV owner can make by participating in a regulation program. However, all the stakeholders who are involved with V2G service have not been sufficiently considered. Thus, we propose a novel framework for the economic valuation of V2G in ancillary service. Furthermore, to estimate the available capacity of V2G and find an optimal strategy in order for the V2G service to run, a data-driven approach is proposed in this research. Comprehensive simulation results show the optimal situation requiring the minimum financial support for the EV owner when the V2G-service operator aggregates AC chargers. In addition, promotions from government and public utilities can accelerate the V2G service into the ancillary service. As a final remark, given the flexibility of the proposed framework, it could be adapted to validate its performance in other countries, as part of future works.

1. Introduction

In order to reduce carbon emissions under the global trend of de-carbonization, global automakers are speeding up both the suspension of production of internal combustion engine vehicles and the transition to electric vehicles (EVs). According to the International Energy Agency, 230 million EVs are expected to be distributed around the world by 2030 when ecofriendly policies are implemented in many countries [1]. With the rapid increase in EVs, various methods for using EVs and business models are emerging. The integration of EVs with the power grid seems to provide diverse cost-wise and environment-wise benefits. Vehicle-to-grid (V2G) is a concept that enables power to be pushed back to the power grid from the battery of an EV while assisting the power grid by connecting into the idle power of parked EVs during peak hours. Additionally, V2G technology can provide power to help balance loads by load peak shaving and valley filling in the distribution systems, as well as enabling utilities to have ways to provide regulation services and spinning services [2]. The large-scale integration of EVs into the grid could affect the grid voltage [3]. Since the charging voltage level of EVs is the lowest in distribution systems and EV charging loads will account for a large part of electric loads in the near future, V2G technology can participate in under-voltage load shedding to avoid voltage collapse [4]. In addition, it was proposed that the V2G energy-trading mechanism which uses the charging/discharging powers of EVs should regulate the voltage deviations of an active distribution system [5].
Diverse technical investigations have been conducted to evaluate the ability and interests of V2G participating in the ancillary service. The model was proposed which can evaluate the economic value of V2G by analyzing the ability of EVs to supply power with minimal compromise as a means of transportation, which indicates that V2G is profitable [6]. Through modeling single- and multi-vehicle-based primary and secondary frequency controls, the potential for significant economic returns of V2G for peak load reduction and frequency control was shown [7].
Many studies have mostly discussed profits that an EV owner can make by participating in a regulation program such as ancillary service [8]. Then, the main purpose of V2G research would shift to maximize the benefits for an EV owner. Through technological improvement, distributed cooperative control strategies to maintain the supply–demand balance and to minimize total power loss in microgrids were considered [9]. In order to solve the problem of converging to a microgrid system, the unique personal energy generation and demand characteristics of the prosumers were considered to determine the optimal personalized contracts between the microgrid operator and sellers and the microgrid operator and buyers, respectively [10]. Since V2G can negatively affect the battery health of an EV, a financial incentive on battery ageing was considered and the cost associated with an increased rate of capacity fade through V2G could be mitigated if the smart-charging and V2G reimbursements generate enough revenue to outweigh the cost of battery degradation and charging costs [11]. Furthermore, it is necessary to set up an attractive structure with the participants related to the V2G service, such as a V2G-service operator, the EV owners, a utility, and a country [12].
Furthermore, parameter setting based on data analysis is required for the analysis framework. Survey data on the commuting patterns of US drivers was used to simulate V2G discharge/charge capacity [13]. Due to uncertainty in the driving habits of EV owners, many studies have adopted truncated Gaussian distributions as input. The time when an electric vehicle is connected to the EV charger and when it disconnects the charger is random [14]. In order to gain more utility, the optimal charge and discharge scheduling problem was studied [15]. However, the method of calculating V2G discharge/charge capacity has not been advanced by analyzing the charger usage data. Classifying the AC charger and DC charger could act as an important factor to enhance the available capacity of V2G.
Therefore, in this study, the analysis framework that V2G could be operated in the Korean ancillary service is suggested based on the actual charger data including 6411 AC/DC chargers. Within the suggested analysis framework, we provide optimal scenarios in which all stakeholders including the V2G-service operators and EV owners are guaranteed a certain level of profits. Subsequently, the country achieves the international goal of de-carbonization; the utility can provide the stable power system.
The structure of this paper is as follows: In Section 2, the probability of not only AC charger but also DC charger was estimated and used to estimate the available V2G capacity. Then, we suggested a business model and a framework for V2G investment evaluation in ancillary service application from each stakeholder’s viewpoint in Section 3. Based on the proposed framework, the simulation and analysis were performed to discover the economic feasibility of V2G service in the various scenarios in Section 4. Finally, Section 5 draws the conclusions.

2. Methodology to Estimate V2G Capacity

In this section, we analyzed the charger usage data provided by Korea Electric Power Corporation (KEPCO, Naju-si, Republic of Korea). Then, the actual charger usage data was classified into AC chargers and DC chargers due to the different characteristics. Finally, the available capacity of V2G was estimated.

Available V2G Capacity of AC and DC Chargers

The main difference between AC and DC charging is where the conversion from AC to DC happens. In the case of AC charging, the converter which is called the onboard charger is built inside the car. The power flowing to the EV with AC charging represents a flat line due to the relatively small onboard charger that can only receive a limited power spread over longer periods. On the other hand, DC charging forms a degrading charging curve because the EV battery can accept the quicker flow of power but gradually asks for less as it reaches full state of charge (SOC). The difference in the AC and DC charging curves is shown in Figure 1. However, in this study, the EV’s SOC information from the EV chargers’ data cannot be included due to the personal data protection laws in Korea.
In order to estimate the probability of the EV charger, the main concern is to see the time the EV remains parked after charging (idle time) due to the fact the connected EVs with chargers can be usable for V2G. The mean probability of charger availability for each time period is estimated by Algorithm 1.
  Algorithm 1: EV charger segmentation model
  Input: Coupling state data for each charger ( i ): C i ,   d ,   t ;
  Output: Coupling probability of group ( m ) for each time ( t ): P m , t ;
  1:     for  i = 1 to N i do
  2:     for t = 1 to N t do
  3:        P i ,   t = d N d C i , d , t N d
  4:      end for
  5:      end for
  6:     Calculate EV charger segmentation using coupling probability ( P i ,   t ) of charger ( i ) for each time by k-means clustering
  7:     for  m = 1 to N S m do
  8:       P m ,   t = i S m P i ,   t N S m
  9:      end for
Where N i is the number of chargers, N t is the number of timers, N d is the number of days, N m is the number of clusters, S m is the data set of chargers belonging to cluster m , and d   is day.
Based on the charging characteristics of EV users, the representative charging profiles for clusters were created separately through customer segmentation. In this study, we used k-means clustering that has proven its performance in various research fields [16]. It operates in a way that minimizes the variance of the distance between each cluster. The results of the segmentation into three groups according to the daily pattern were classified. In Figure 2 and Table 1, AC cluster 1 and AC cluster 3 show the pattern where EVs are connected to chargers while EV owners stay at home. On the other hand, in Figure 3 and Table 1, DC cluster 1 and DC cluster 3 show the pattern where EVs are connected to chargers during working hours.
The main assumptions for the available V2G capacity are as follows:
  i.
EVs are considered as usable sources of charging and discharging if the EVs are connected to a charger.
 ii.
The participation rate for the V2G program is 25%.
iii.
The efficiency of charging and discharging is 95%.
The probability of charger availability is calculated as follows:
p t = m N S m N S m m N S m N S m × P m , t
The total available V2G capacity for each year is calculated as follows:
C a p = p t × C c h × N c h × 95 % × 25 %
where C c h is the capacities of the supplied AC and DC charger, which are 7 kW and 50 kW, respectively, and N c h is the total number of AC chargers or DC chargers.
The probability of the AC charger availability is shown in Figure 4 and the probability of the DC charger availability is shown in Figure 5. The results show the different usage probabilities.
The number of EVs and chargers in 2025 was calculated based on the pollution-free vehicle charging infrastructure in Korea [17]. As of the end of 2020, the number of EVs was 137,000, the number of AC chargers was 54,383, and the number of DC chargers was 6500. Based on the cumulative supply plan by 2025, the number of EVs, AC chargers and DC chargers from 2020 to 2025 was estimated. Table 2 represents the number of EVs, AC chargers and DC chargers from 2020 to 2025, and the estimated capacities of the AC chargers and DC chargers as well.

3. Component Modeling

The stakeholders of the V2G service are classified into V2G-service operator (aggregator), EV owner, utility, and country. A V2G-service operator is an aggregator that allows EV owners to return part of the electricity stored in their batteries to the grid by participating in the ancillary service, and in return, pays compensation to the EV owners. Furthermore, the V2G-service operator acts as an intermediary between the EV owners and the utility to participate in the ancillary service. The utility, as a system operator, pays a settlement to V2G-service operators that participate in the ancillary service. Finally, the country participates in the V2G service by paying subsidies to the V2G-service operators and EV owners. The structure of the V2G-service stakeholders is shown in Figure 6. And the benefits and costs for each stakeholder are represented on Table 3.

3.1. V2G-Service Operator

The main benefits of the V2G-service operator are the settlements paid from participation in the ancillary service and the profit from the price difference of discharging and recharging to the initial SOC. The ancillary service in Korea has three types known as the primary reserve, secondary reserve, and tertiary reserve [18]. However, only in the primary reserve and the tertiary reserve is compensation paid in proportion to the participant’s V2G capacity. Currently, the Korean government is implementing a policy to support a portion of the EV charging fee [19]. So, the EV discharging fee is assumed without the policy mentioned previously, which means the discharging fee is higher than the recharging fee.
The operating scenario for calculating the benefits and costs is assumed as follows:
The V2G-service operator uses all of the aggregated V2G capacity to participate in the ancillary service if EVs are connected to a charger.
The V2G-service operator recharges to the initial SOC of the EVs after discharging.
The participation rate of the ancillary service to the primary reserve and the tertiary reserve was estimated by the public data to be about 70 and 3.3%. However, in Korea, the settlement is changeable depend on global fuel costs, and it depends on the type of generator. So, the settlements for the primary reserve and the tertiary reserve were assumed to be at an appropriate level based on the public data [20].
The settlement for the primary reserve was formulated by the following the equation. A speed adjustment weighting rate is 1.075. A dead band weighting rate is 1. F p is the settlement fee for the primary reserve.
SB 1 = C a p × 1.075 × 1 × F p
Currently, Korea Power Exchange (KPX), which involves the whole transaction on the power system in Korea does not settle for the settlement for the secondary reserve. So, SB2 is considered as 0.
Next, the settlement for the tertiary reserve is formulated as follows. F t is the settlement fee for the primary reserve.
SB 3 = C a p × F t
In addition, the price difference between the EV discharging and recharging prices is the benefit of V2G-service operator (SB4) depending on the electricity price provided by the utility. The last benefit is the government subsidies (SB5) that the country pays during the period when initial investment costs are incurred.
The main costs to V2G-service operator are the operation and management costs such as the annual indirect cost (SC3) and annual direct cost (SC4) for the V2G service. SC3 and SC4 account for about 15 and 70% of the total benefits except for the government subsidies. Another cost is to upgrade the facilities for the V2G service. In the first year (2020) of V2G service, investment was required for all chargers participating in the V2G service, and in the following year (2021), investment was made only for the increased quantity from 2020. From 2022, investment will not be required. The investment cost is estimated to be KRW 100,000 per charger, estimated by KEPCO. Finally, the cost of the payment for EV owners who participate in the V2G service. A total of 20% of SB1, SB2, SB3, SB4 is paid to the EV owners as revenue sharing.

3.2. Utility

The first benefit (UB1) is the reduction of power purchase by as much as the capacity participating in the ancillary service. The equation for calculating this benefit is below.
UB 1 = C a p × s m p × 8760 h
The second benefit (UB2) is the investment deferral in the transmission and distribution of grid reinforcement. By securing V2G available capacity, the need for reinforcing transmission and distribution facilities is reduced. The benefit (UB2) was calculated by multiplying V2G available capacity with the transmission and distribution facility costs which were assumed to be 98,384 (KRW/kW), as estimated by Korea Electric Technology Research Institute (KERI) [21].
On the other hand, the utility pays a settlement to the V2G-service operators that participate in the ancillary service. The corresponding costs are SB1, SB2 and SB3 from V2G-service operator’s benefits. The cost (UC4) incurred by the difference in price between EV discharging and recharging prices is paid to the V2G-service operator. UC5 is the assumption that the initial investment cost of the energy management system is KRW 900 million, as estimated by KEPCO.

3.3. EV Owner

The benefit to the EV owner is the compensation paid from the V2G-service operator for providing the electricity stored in their batteries to the grid. After that, the V2G-service operator should guarantee a lower recharging price than the discharging price corresponding to the discharged capacity of the EV. Therefore, the price difference between EV discharging and recharging prices is the benefit to EV owner, depending on the charging plan the V2G-service operator provides. It is assumed that participants in the ancillary service pay about 20% of their profits to customers. So, 20% of SB1, SB2, SB3 and SB4 are assigned to the EV owner’s benefit (EB1).
Meanwhile, the costs to the EV owner include the cost of devices installed in the EV and the cost of battery degradation due to charge–discharge cycles. The devices for V2G are a bidirectional onboard charger and vehicle control modules. According to the automaker, these devices will be installed in EVs from 2023. Therefore, the EVs that have already been produced need to pay KRW 75,000 for an onboard charger and KRW 50,000 for vehicle control modules, as provided by the automaker. The battery deterioration cost was assumed to be KRW 30/kWh, as estimated by the KEPCO project [22].

3.4. Country

The main benefit for the country is the investment deferral in power generation. Through the V2G program, the need for the investment is reduced as much as the securing of reserve capacity. In this analysis, the construction cost of the LNG combined-cycle generator that is usable for the ancillary service was used to calculate the benefit. The average of the construction costs of 20 LNG plants for 3 years was calculated [23]. Then, the cost was calculated as 1,187,000 (KRW/kW). Another benefit is the CO 2 emission reduction by replacing fossil fuels. The CO 2 emission price is assumed to be 15.72 (KRW/kWh), as estimated [24].
The country’s cost is a subsidy paid to the V2G-service operator and the EV owner. In order to attract them to V2G program, the country grants subsidies until their benefit–cost ratio becomes 1 during the period when initial investment costs are incurred.

3.5. Benefit–Cost Ratio Calculation

The benefit–cost ratio (BCR) can be defined as the ratio of the equivalent value of benefits to the equivalent value of costs. In general, if BCR is greater than or equal to 1.0, it is considered economically advantageous. BCR is formulated as
BCR = t = 0 n B t 1 + i t t = 0 n C t 1 + i t
Here, B indicates the equivalent value of the benefits associated with a large-scale project and C indicates the net cost of the project; i is a discount rate; and n is the number of periods; t is the period that the cash flow occurs. In this analysis, the discount rate is 5.5% and the analysis period is 6 years from 2020 to 2025.

4. Results and Analysis

This section describes the scenarios for different factors and provides the analysis results.

4.1. Scenarios

The purpose of scenario analysis is to see whether all stakeholders can make a profit or not and to create a business model for them to make a profit. Scenario analysis is conducted considering the impact of the different characteristics of AC and DC chargers on the V2G service. At the same time, the economic feasibility is checked for each stakeholder according to the presence or absence of government subsidies. Additionally, the settlement of the ancillary service was gradually adjusted from 1 to 100 times in the year in which the initial investment is incurred in order to see whether the V2G service can work by itself without government subsidies.

4.2. Analysis

Figure 7 indicates the BCR of all stakeholders. Although the V2G-service operator experiences losses during the period in which the initial investment happens, the V2G-service operator can maintain the V2G-service business when aggregating AC chargers without the government subsidies based on Table 4. Similarly, in the case of aggregating DC chargers without the government subsidies, the V2G-service operator can maintain the V2G-service business. However, there is no motivation for the EV owner to participate in the V2G service if the government subsidies are not provided. Therefore, the stakeholders except for the EV owner may want to find a way to make policies or incentives to encourage the EV owner, because the V2G service cannot be launched without the sources.
In Figure 8 and Figure 9, the ancillary service settlement was gradually increased to see how many times the settlement needed to multiply to reach BCR values of 1.0 or higher. In the case of aggregating AC chargers, a 21-times higher settlement makes the BCRs of the V2G-service operator and EV owner become 1. On the other hand, for the aggregation of DC chargers, it is hard to compensate the initial investment of the EV owner without government subsidies.

5. Conclusions

This work presented an assessment of the economic profit for stakeholders in the ancillary service. In order to properly use EVs for V2G service, it is crucial to figure out the available V2G capacity. The plug-in pattern of the vehicles is certainly relevant to the actual data from EV chargers, and thus sampling the plug-in EV charger provides a data repository to estimate the available V2G capacity.
In this research, it is shown that the V2G service cannot be operated without government subsidies to the V2G-service operator and the EV owner. In order to give all stakeholders profits, both the country and the utility should financially support the V2G-service operator and the EV owner to compensate for the losses from the initial investment in the V2G service. Furthermore, we estimated the optimal situation that required the minimum financial support to the EV owner by aggregating AC chargers with government subsidies. From our analysis results, the V2G service might be economically feasible if a government subsidy is provided or the settlement of the ancillary service is increased by policies.
As a final remark, given the flexibility of the proposed framework, it could be adapted, as part of future works, in order to validate its performance in other countries. Furthermore, it is necessary to implement the considered parameters of not only the assumed environment of the V2G service but also new environments for the proposed framework. With the real data collected from the V2G service in the future, the quantitative impact of the V2G service could be analyzed more efficiently.

Author Contributions

Conceptualization, J.K. (Junhyung Kim) and J.K. (Jinho Kim); methodology development and simulation, J.K. (Junhyung Kim) and J.K. (Jinho Kim); writing—original draft preparation, J.K. (Junhyung Kim); writing—review and editing, J.K. (Junhyung Kim), J.K. (Jinho Kim), and H.J.; project management and supervision, H.J. All authors have read and agreed to the published version of the manuscript.

Funding

This work was supported by the Korea Institute of Energy Technology Evaluation and Planning (KETEP) and the Ministry of Trade, Industry & Energy (MOTIE) of the Republic of Korea (No. 20204010600340 and No. 20202010600010).

Data Availability Statement

Not applicable.

Conflicts of Interest

The authors declare no conflict of interest.

References

  1. Vaziri, S.; Rezaee, B.; Monirian, M. Utilizing renewable energy sources efficiently in hospitals using demand dispatch. Renew. Energy 2020, 151, 551–562. [Google Scholar] [CrossRef]
  2. Ravi, S.; Aziz, M. Utilization of electric vehicles for vehicle-to-grid services: Progress and perspectives. Energies 2021, 15, 589. [Google Scholar] [CrossRef]
  3. Zhu, X.; Xia, M.; Chiang, H.D. Coordinated sectional droop charging control for EV aggregator enhancing frequency stability of microgrid with high penetration of renewable energy sources. Appl. Energy 2018, 210, 936–943. [Google Scholar] [CrossRef]
  4. Li, C.; Cao, Y.; Kuang, Y.; Zhou, B. Influences of Electric Vehicles on Power System and Key Technologies of Vehicle-to-Grid; Springer: Berlin/Heidelberg, Germany, 2016. [Google Scholar]
  5. Kempton, W.; Tomic, J. Vehicle-to-grid power fundamentals: Calculating capacity and net revenue. J. Power Sources 2005, 144, 268–279. [Google Scholar] [CrossRef]
  6. Zhong, W.; Xie, K.; Liu, Y.; Yang, C.; Xie, S. Topology-aware vehicle-to-grid energy trading for active distribution systems. IEEE Trans. Smart Grid 2019, 10, 2137–2147. [Google Scholar] [CrossRef]
  7. Yoo, Y.; Al-Shawesh, Y.; Tchagang, A. Coordinated control strategy and validation of vehicle-to-grid for frequency control. Energies 2021, 14, 2530. [Google Scholar] [CrossRef]
  8. Arias, N.; Hashemi, S.; Andersen, P.; Traeholt, C.; Romero, R. Assessment of economic benefits for EV owners participating in the primary frequency regulation markets. Int. J. Electr. Power Energy Syst. 2020, 120, 105985. [Google Scholar] [CrossRef]
  9. Xu, Y.; Zhang, W.; Hug, G.; Kar, S.; Li, Z. Cooperative control of distributed energy storage systems in a microgrid. IEEE Trans. Smart Grid 2015, 6, 238–248. [Google Scholar] [CrossRef]
  10. Patrizi, N.; LaTouf, S.; Tsiropoulou, E.; Papavassiliou, S. Prosumer-centric self-sustained smart grid systems. IEEE Syst. J. 2022, 1–12. [Google Scholar] [CrossRef]
  11. Steffen, T.; Fly, A.; Mitchell, W. Optimal electric vehicle charging considering the effects of a financial incentive on battery ageing. Energies 2020, 13, 4742. [Google Scholar] [CrossRef]
  12. Moon, Y.; Ahn, J.; Hur, W.; Kim, W.; Shin, K. Economic valuation of vehicle-grid integration (VGI) in a demand response application from each stakeholder’s perspective. Energies 2021, 14, 761. [Google Scholar] [CrossRef]
  13. Guille, C.; Gross, G. A conceptual framework for the vehicle-to-grid (V2G) implementation. Energy Policy 2009, 37, 4379–4390. [Google Scholar] [CrossRef]
  14. Shafie-khah, M.; Heydarian-Forushani, E.; Osório, G.J.; Gil, F.A.; Aghaei, J.; Barani, M.; Catalão, J.P. Optimal behavior of electric vehicle parking lots as demand response aggregation agents. IEEE Trans. Smart Grid 2016, 7, 2654–2665. [Google Scholar] [CrossRef]
  15. Lin, J.; Leung, K.; Li, V. Optimal scheduling with vehicle-to-grid regulation service. IEEE Internet Things J. 2014, 1, 556–569. [Google Scholar] [CrossRef] [Green Version]
  16. Aggarwal, C.C.; Reddy, C.K. Data Clustering: Algorithms and Applications; CRC Press: Boca Raton, FL, USA, 2016; pp. 87–110. [Google Scholar]
  17. Ministry of Economy and Finance. Inspection and Expansion of Pollution-Free Vehicle Charging Infrastructure. Available online: https://www.moef.go.kr/synapView/previewTop.jsp?CastExtn=HWP&orignlFileNm=(21-13)%2002%20%EB%B9%853%20%EC%82%B0%EC%97%85%20%EC%A4%91%EC%A0%90%EC%B6%94%EC%A7%84%EA%B3%BC%EC%A0%9C%205%20(%EA%B3%B5%EA%B0%9C).hwp&atchFileId=ATCH_000000000018214&fileSn=3 (accessed on 1 February 2022).
  18. Korea Power Exchange. Rules for Korean Electricity Market. Available online: https://www.kpx.or.kr/www/selectBbsNttView.do?key=29&bbsNo=114&nttNo=21790&searchCtgry=&searchCnd=all&searchKrwd=&pageIndex=1&integrDeptCode= (accessed on 1 February 2021).
  19. Ministry of Environment. Information of Electric Vehicle Charging Fee. Available online: https://www.ev.or.kr/portal/chargerfee (accessed on 1 March 2022).
  20. Korea Power Exchange. Settlement for Ancillary Service for Operating Power System. Available online: https://new.kpx.or.kr/menu.es?mid=a10107020000 (accessed on 30 April 2021).
  21. Korea Electro Technology Research Institute. Demand Management Project Evaluation Report; Korea Electro Technology Research Institute: Changwon-si, Korea, 2012. [Google Scholar]
  22. Korea Electric Power Corporation. EV-Grid Integration(VGI) and Control Technology Development and Wide Area V2G field Demonstration for EV as a Fast-DR Resource. Unpublished work.
  23. Electric Power Statistics Information System. Power Generation Facility Status. Available online: http://epsis.kpx.or.kr/epsisnew/selectEkifBoardList.do?menuId=080402&boardId=040200 (accessed on 1 September 2021).
  24. Energy Transition Policy and Social Costs of Power Generation. Environmental and Resource Economics Review. Available online: https://journal.resourceeconomics.or.kr/articles/article/Y5dy/#Information (accessed on 1 February 2021).
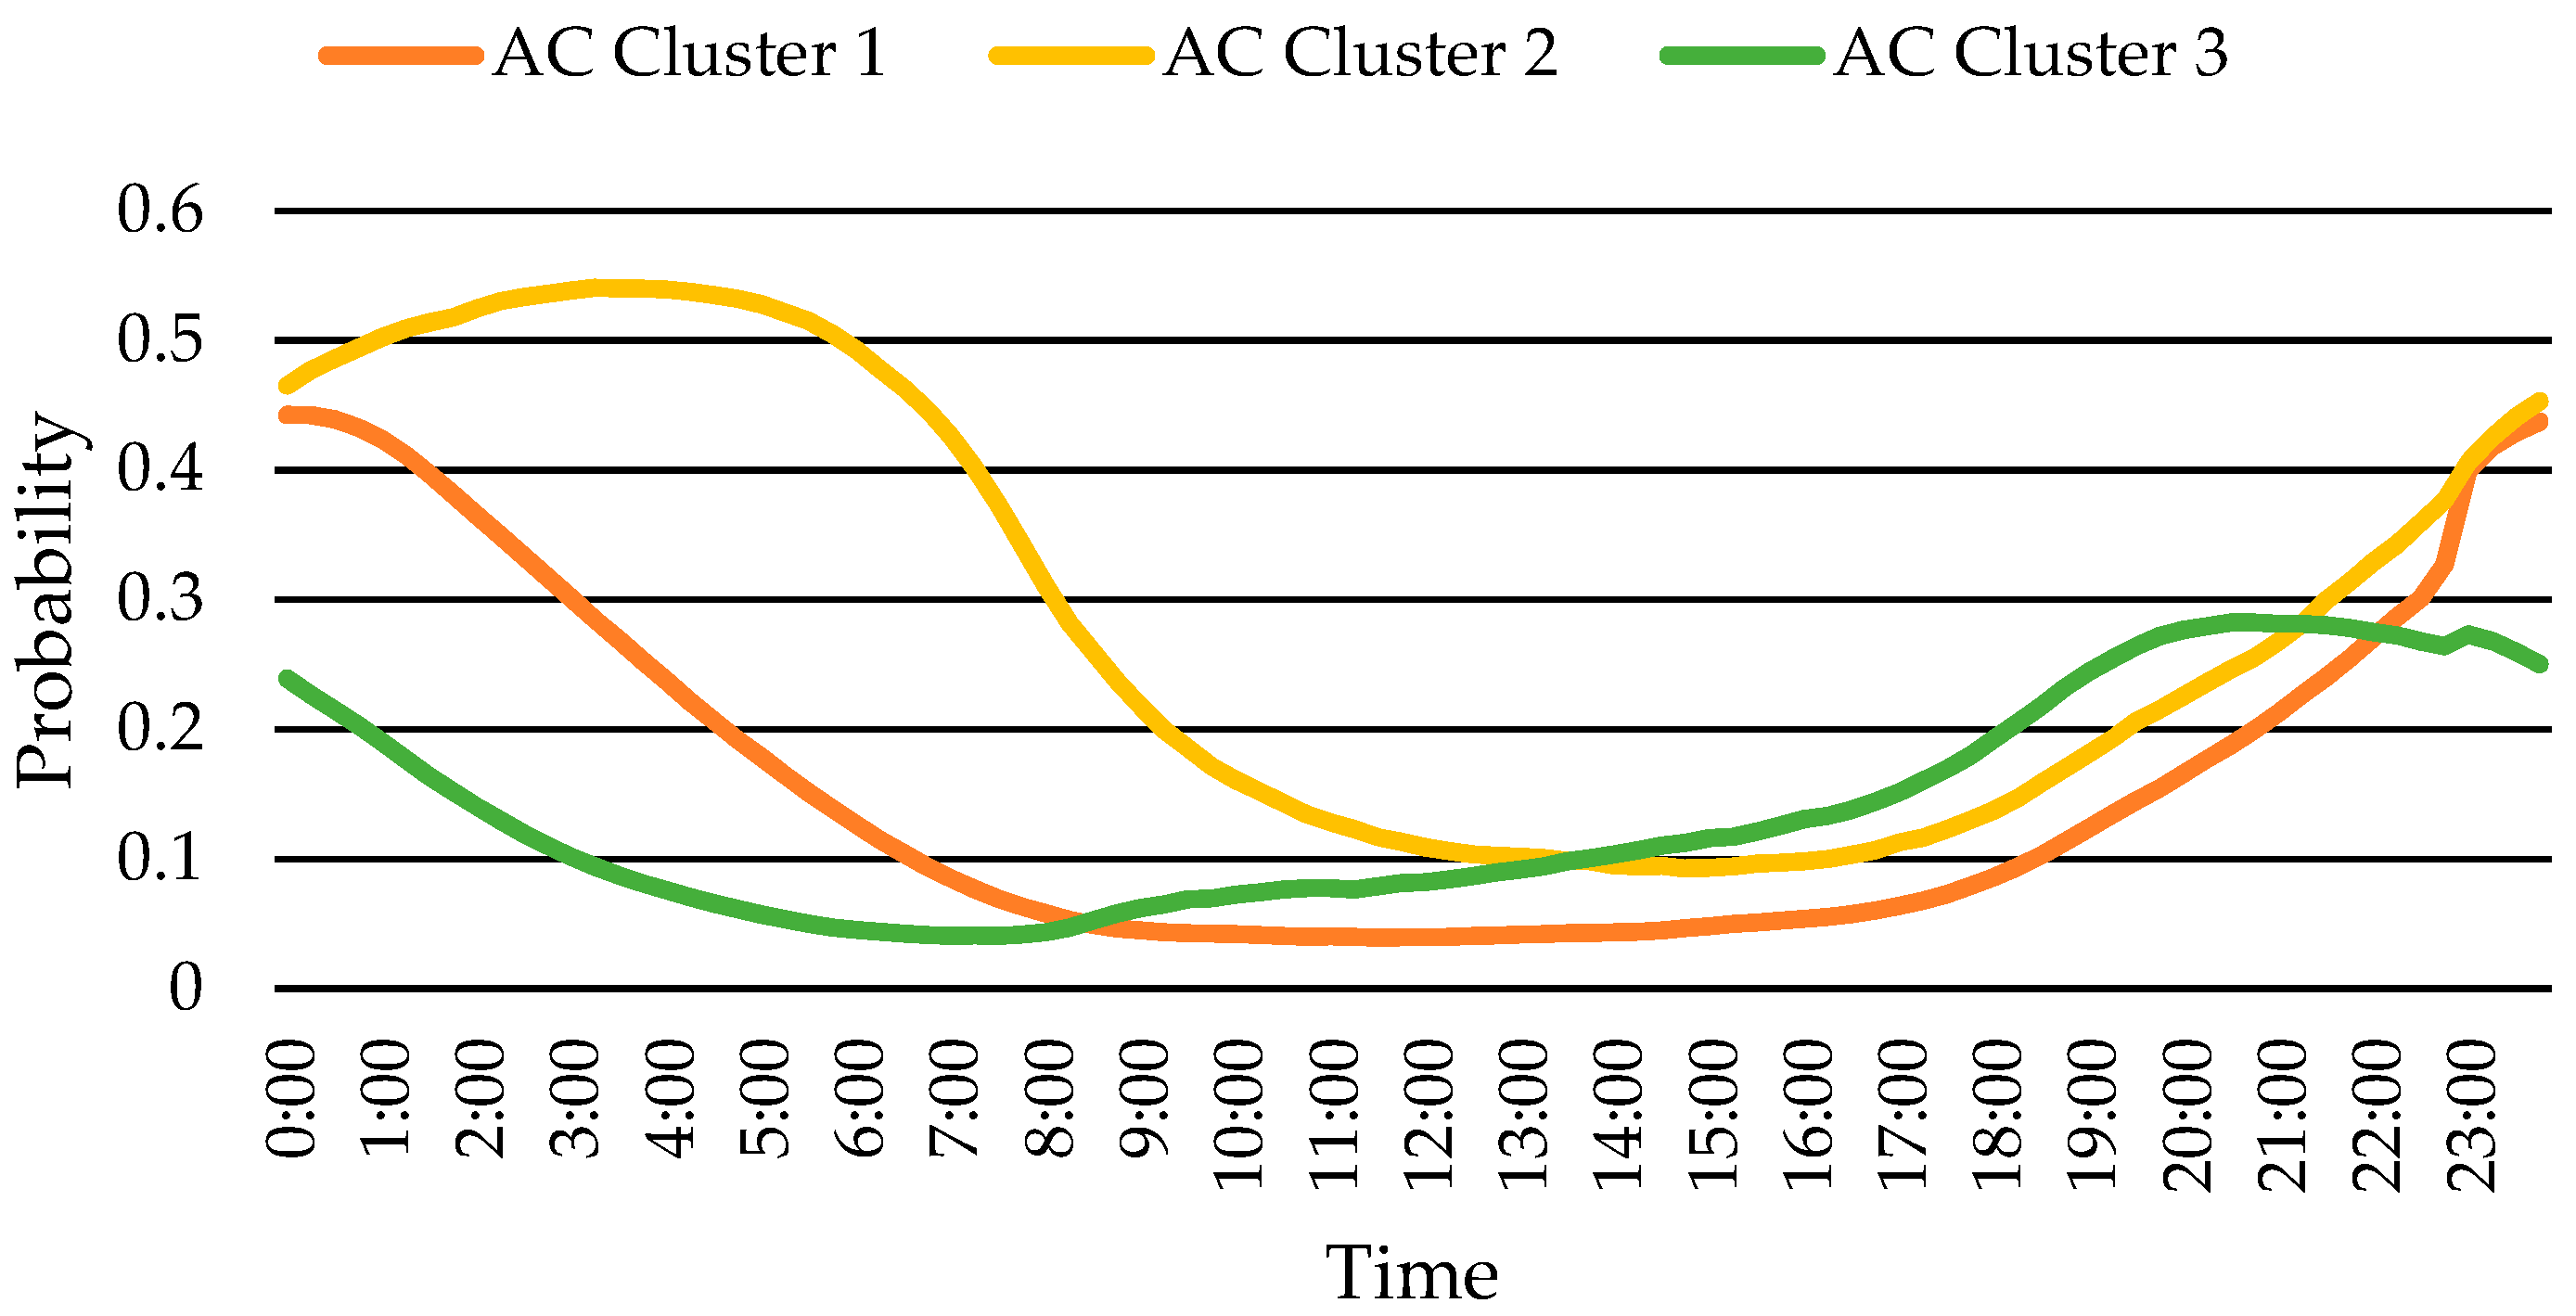
Figure 1. (a) AC charging curves; (b) DC charging curves.
Energies 15 08815 g001
Figure 2. EV-user segmented groups of AC chargers.
Energies 15 08815 g002
Figure 3. EV-user segmented groups of DC chargers.
Energies 15 08815 g003
Figure 4. The estimated probability of the AC charger availability.
Energies 15 08815 g004
Figure 5. The estimated probability of the DC charger availability.
Energies 15 08815 g005
Figure 6. Stakeholders and business model.
Energies 15 08815 g006
Figure 7. Stakeholders’ BCRs.
Energies 15 08815 g007
Figure 8. V2G-service operator and EV owner BCRs with AC chargers.
Energies 15 08815 g008
Figure 9. V2G-service operator and EV owner BCRs with DC chargers.
Energies 15 08815 g009
Table 1. EV-user segmentation results.
TypeCluster NumberProportion
AC ChargerAC cluster 147.8%
AC cluster 29.8%
AC cluster 342.4%
DC ChargerDC cluster 161.8%
DC cluster 25.2%
DC cluster 333.0%
Table 2. The estimated EV and EV charger parameters.
Year2020202120222023 2024 2025
EVs (thousands)1372394626859071130
AC chargers (thousands)54.3143232321410500
AC capacity (MW)14.538.36282.8109.5133.3
DC chargers (thousands)6.51013.51720.524
DC Capacity (MW)4.957.6210.2912.9615.6218.29
Table 3. The benefits and costs for each stakeholder.
StakeholdersBenefit/CostSignFactorsDescription
V2G-service operatorBenefitSB 1Settlement for primary reserveReward for participating in the primary reserve
SB 2Settlement for secondary reserve=0 due to no settlement
SB 3Settlement for tertiary reserveReward for participating in the tertiary reserve
SB 4Price differencePrice difference between the discharging and recharging fee
SB 5Government subsidySubsidy for the initial investment for V2G
CostSC 1Payment for EV owner80% of (SB1 + SB2 + SB3 + SB4)
SC 2Facilities upgrade costsIn proportion to customers participating in V2G service
SC 3Annual indirect cost for V2G service15% of (SB1 + SB2 + SB3 + SB4 − SC1)
SC 4Annual direct cost for V2G service70% of (SB1 + SB2 + SB3 + SB4 − SC1)
UtilityBenefitUB 1Reduction of power purchaseAs much as the capacity participating in ancillary service
UB 2Investment deferral in T&D grid reinforcementCost for T&D investment for V2G
CostUC 1Payment for primary reserve(=SB1)
UC 2Payment for secondary reserve(=SB2)
UC 3Payment for tertiary reserve(=SB3)
UC 4Payment for price difference(=SB4)
UC 5Energy management system for V2G serviceInvestment for V2G service
EV ownerBenefitEB 1Reward for V2G participation(=SC1)
EB 2Government subsidySubsidy for the initial investment for V2G
CostEC 1Battery degradation30 KRW/kWh
EC 2Vehicle control modulesCost for the initial investment for V2G
EC 3Bidirectional onboard chargerCost for the initial investment for V2G
CountryBenefitCB 1Investment deferral in power generationInvestment deferral in generation
CB 2 CO 2 emission reductionDue to the usage reduction of fossil fuels
CB 3Value-added creationEconomic value-added creation
CB 4Production inducementProduction inducement in adjacent industries
CostCC 1SubsidyTo V2G-service operator and EV owner
Table 4. Stakeholders’ BCRs.
AC without SubsidyAC with SubsidyDC without SubsidyDC with Subsidy
V2G-service operator1.01.11.11.1
EV owner0.81.70.31.2
Utility10.410.44.64.6
Countryundefined12.3undefined7.5
Publisher’s Note: MDPI stays neutral with regard to jurisdictional claims in published maps and institutional affiliations.

