Abstract
In constructing a nanogrid for the effective use of renewable energy, such as solar power, the use of storage batteries is considered as a stabilizer for capturing renewable energy and outputting it in an energy-saving manner. Storage batteries that are included in a battery management system that includes their reuse in a vehicle are expected to be discharged into the market in large quantities over their long lifetime. Storage battery modules obtained from an unspecified number of electric vehicles (EVs), hybrid vehicles (HVs) and plug-in hybrid vehicles (PHVs) will vary in their charge/discharge capacity from module to module and it is crucial to determine the stability in terms of the state of charge and the state of health of the modules before their reuse. However, in an automotive storage battery module, multiple battery cells are connected in series or in parallel, and there is no established method of managing the variation in the output of each battery cell. Therefore, in this study, we propose an accurate charge–discharge state estimation technique for each cell using impedance characteristic evaluation based on an electrochemical method as a simple and quick method of grasping the charge–discharge performance of storage batteries equipped in a vehicle.
1. Introduction
In the automotive industry, there are several types of vehicles, such as hybrid vehicles (HVs) and electric vehicles (EVs), which are designed to reduce carbon dioxide emissions. Since the first Japanese hybrid vehicle was introduced in the 1990s, storage batteries have become an essential component of the drive system for all vehicle makes and models. Generally, the service life of automotive storage batteries is 10–15 years. Many used automotive storage batteries have appeared on the market and methods of utilizing these batteries are being considered. Fundamentally, when reusing automotive storage batteries, it is necessary to determine the life performance of the batteries. Typically, storage batteries are evaluated for their lifetime characteristics, primarily in terms of the state of charge (SOC) and the state of health (SOH), based on their charge/discharge characteristics. However, because of the long lead time required to evaluate the lifetime by directly measuring charge/discharge characteristics, the determination of lifetime characteristics is likely to hinder the distribution of used storage batteries in the market.
Storage battery modules consist of a group of cells connected in series, and although the SOC at the module depends on the internal resistance and open circuit voltage of each battery, an analogous method to evaluating the SOC of the entire module is commonly used, that is, evaluating the SOC of individual cells. However, it is common to determine the SOC of the entire module by evaluating the SOC of individual cells. The SOH depends on the degree of degradation of the battery and decrease in capacity and increase in resistance are the main factors affecting this. Since SOH can be estimated by analyzing SOC, a wide range of simple methods for SOC and SOH analyses have been extensively investigated.
Simulations using equivalent circuit models (ECMs) have been used in many battery applications because of their fast run time, simplicity and relatively high accuracy [1,2,3,4]. Recently, in addition to electrochemical models and ECM, there has been a trend toward combining the two models to achieve more advanced battery management. Among the existing battery models currently used in a battery management system (BMS), due to limitations in data storage and computational power, Dey et al. [5] proposed a non-linear adaptive observer method that simultaneously estimates the electrochemical model parameters and the temperature state inside the electrodes to predict the SOC and SOH of the battery cell [6]. A dynamic estimation model was derived to quickly identify the electrical parameters employed by a simple single-resistance ECM and used to predict the SOC of a lithium polymer battery. Other researchers have used the Thevenin ECM to derive a real-time diagnostic algorithm for detecting sensor failures in a BMS [7], proposed a hybrid model consisting of an ECM and a convective thermal model to determine the state of the lithium-ion battery (LIB) [8], and used an ECM and Kalman filter observer to estimate the SOC of LIB cells [9].
The SOC of a storage battery module is generally derived by analogy from the analysis of individual cells. However, since the SOC balance differs from cell to cell, the improvement of the accuracy of SOC analysis for modules is still under study and there is much room for improvement. The main objective of this research is to construct and disseminate an energy management system that utilizes the renewable energy of used vehicle-mounted storage batteries. For this purpose, the system using vehicle-mounted storage batteries must be inexpensive. To incorporate the vehicle-mounted storage batteries and the electronic components that make up the surrounding EMS directly into an energy management system with good throughput, it is necessary to analyze the SOC and SOH of each cell.
Unfortunately, it is difficult to use conventional analysis methods because it is excessively time-consuming to analyze the SOC and SOH for each cell. We evaluated the difference between the assumed SOC value and the actual measured value when we evaluated the impedance of a batch of modules. In this study, we adopted the strategy of determining the SOC of a module by estimating the SOC, taking into account the degree of deviation from the assumed SOC value.
The terminal voltage and current are the only input/output information that can be detected from an automotive storage battery. The life state of the storage battery must be estimated from this information in relation to its charge/discharge characteristics. The power generation mechanism of storage batteries is too complex to be explained using first-principles modelling [10,11,12] based on electrochemical knowledge; modelling for system identification using equivalent circuits is common and essential to the accurate estimation of the state of storage batteries. Therefore, in the present study, we determined the SOC and SOH of modules and cells, which are the core parts of storage batteries. Accordingly, the internal impedance was evaluated to indirectly evaluate the load characteristics of storage batteries [10,11,13]. We developed a method to identify the lifetime characteristics of high-capacity automotive storage batteries by means of the following actions:
Establishing an impedance analysis method for high-capacity automotive storage batteries.
Establishing a technique to identify the lifetime characteristics, SOC and SOH, of storage battery modules through impedance analysis.
Improving the accuracy of estimating the battery condition by comparison with the actual charge–discharge characteristics of storage batteries.
In this article, we report the results of these efforts. The module used in this study represents an integrated unit of the storage battery and the cell monitoring and control circuit management unit (CMU) that comprises the storage battery module built into a set of vehicle-mounted storage batteries.
2. Experimental Procedure
To use automotive storage batteries in a low-cost and efficient manner, it is necessary to establish a battery management system for storage battery modules. To reuse storage battery modules from an unspecified number of vehicles (EVs, HVs, PHEVs), it is necessary to understand the charge–discharge performance of the storage batteries, particularly secondary batteries, to enable stable use. To begin with, the SOC and SOH of each storage battery must be diagnosed to understand the corresponding charge–discharge characteristics [10,11,12,13]. The above parameters are crucial parameters that represent the current performance of the recharge/discharge characteristics of storage batteries. Information on full charge (completed discharge) is necessary to strictly quantify the characteristics. However, fully charging and discharging a high-capacity storage battery is time-consuming, which makes it impossible to determine the performance of a storage battery in a short period of time. Therefore, in this study, we propose a highly accurate state estimation technique using first-principles modelling with electrochemical methods and data obtained from the controller area network (CAN) data stored in automobiles as a simple, quick, and effective method of understanding the charge/discharge performance of onboard storage batteries.
The following is a brief description of the development of the proposed SOC diagnostic method. The only input/output information that can be used in state estimation by current accumulation and use of grey box system modelling for storage batteries mounted in a vehicle are the terminal voltage and current. Subsequently, the state of the storage battery must be estimated from this information [14,15,16,17,18,19,20]. The power generation mechanism of storage batteries is too complex to be explained using first-principles’ modelling based on electrochemical knowledge. Therefore, modelling for system identification using equivalent circuits is necessary for estimating the state of storage batteries with high accuracy. The storage battery to be examined is separated into a grey box system, i.e., the open circuit voltage (OCV) resulting from the output of the cell itself, the internal impedance component and the overvoltage resulting from the internal impedance are determined. The Nyquist plot in Figure 1a is derived from the AC impedance measurement of the battery. Information on the internal impedance is extracted by comparing this plot with that of simulation calculations in which the battery is considered to be the simple equivalent circuit shown in Figure 1b. Since the battery terminal voltage is known, the open circuit voltage can be detected from the difference in the overvoltage. More specifically, the SOC can be easily estimated if the impedance characteristics are known [20,21,22,23] because the OCV depends on the SOC and the OCV–SOC characteristic is invariant, regardless of the degree of battery degradation.
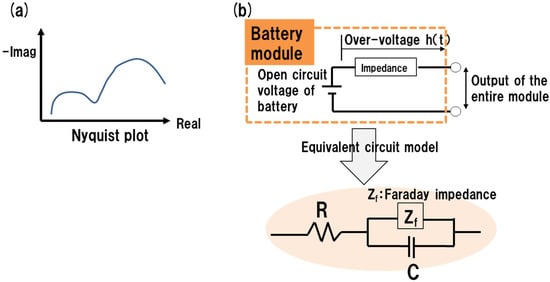
Figure 1.
Derivation of the overvoltage η(t) using the equivalent circuit of the battery. (a) Nyquist plot from impedance measurement. (b) Equivalent circuit model of battery module.
From the modelling of the internal impedance (equivalent circuitization), the equivalent circuit of the battery module illustrated in Figure 1b is obtained. If the terminal voltage at a certain time series is y(t) and the voltage (overvoltage) on the impedance is η(t), then
y(t) = OCV(t) + η(t)
OCV(t) = y(t) − η(t)
OCV(t) is estimated using Equation (2) and SOC is determined from the data in Figure 2a. The SOC is calculated using current accumulation to confirm the accuracy of the SOC calculation. The amount of charge q(t) is obtained from the current i(t) input/output to the storage battery [Equation (3)]. SOC(t0) is estimated using the CAN data on the recharge/discharge of storage batteries accumulated through communication with the automobile system [Figure 2b] and SOC(t) in time series t is derived from the current that actually flows to the storage battery using Equation (4) [9,24,25].
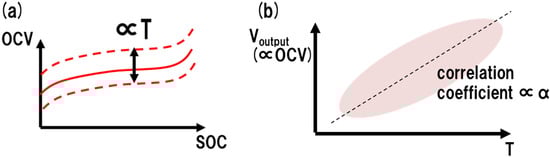
Figure 2.
(a) OCV–SOC correlation temperature fluctuation correction. (b) Correlation chart between Voutput recorded as CAN data and outside temperature T.
The FCC represents the fully charged capacity at a certain time series t. This estimation method is only used for verification because information error in the initial SOC (t0) is directly reflected in SOC(t).
The SOC derived above represents a lifetime characteristic under ideal conditions at an approximate temperature. However, in practice, the open-circuit voltage–SOC correlation fluctuates depending on the external environment and the temperature of the battery; the SOC is obtained using the above equations, the expected temperature, and the output voltage (Voutput) data included in the CAN data. Therefore, it is necessary to enhance the accuracy of the SOC analysis based on the SOC obtained in the verification and the supposed temperature and the output voltage histories obtained from the CAN data extracted from the data presented in Figure 2a. Furthermore, from the correlation chart between Voutput recorded as CAN data and the outside temperature T shown in Figure 2b, the relationship between SOC [SOC(T)] and SOC0 extracted from the CAN data is derived as Equation (5).
Here, we report on the impedance evaluation of an automotive battery module. Specifically, the impedance evaluation of an automotive 12-cell series module was performed to formulate an internal impedance analysis and OCV estimation using Nyquist plots. In this study, we used a module, extracted from a battery pack of an HV, with a capacity of 0.8 kWh to derive the SOC and SOH, and we measured the impedance for the module model 1260A (Toyo System Co., Ltd., Fukushima, Japan) battery modules from HONDA Fit (Figure 3).

Figure 3.
Photograph of the entire battery module from HONDA Fit.
The SOC was obtained from the charge–discharge curve, where the output of a module extracted from an automotive storage battery pack can be arbitrarily controlled by charging and discharging.
3. Results and Discussion
We report on the OCV estimation by internal impedance analysis to derive the OCV of the 12-cell series in a battery module from the HONDA HV. The output voltage of the module was controlled to be 37.5/40/42.5/45/47.5/50 V by charging and discharging, and the OCV was measured from the impedance characteristics in Figure 4 at each output voltage. It is worth noting that, in the impedance measurement, the AC resistance component of the entire module is measured, so the output variation among the cells in the module is not considered. In this case, we assumed that the 12 cells in the module have a single cell SOC and capacitance. Figure 5 shows the OCV–SOC characteristics represented as plots of the output voltage of the module versus SOC determined from the charge–discharge characteristics of the module (blue dots), and the OCV of the 12-cell series calculated from the relevant impedance evaluation of the module by impedance measurement versus the SOC derived from the above calculated OCV and the results calculated from Equations (1)–(5) (red dots).
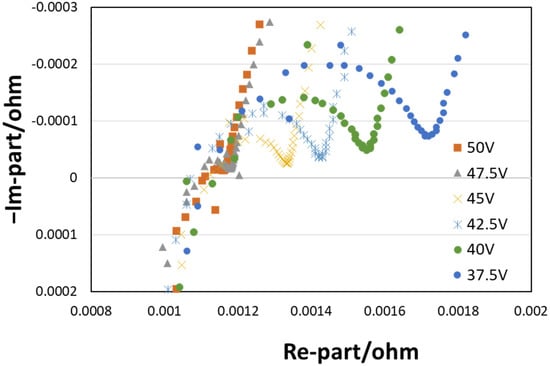
Figure 4.
Module output voltage vs. impedance Cole–Cole plot measurement results.
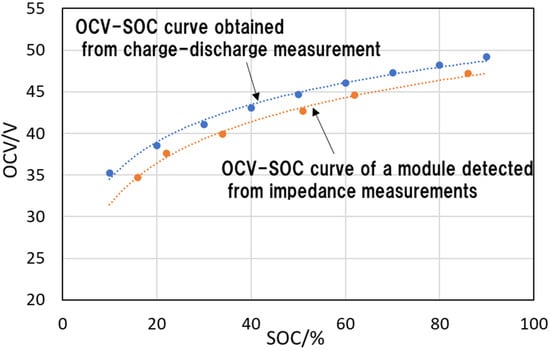
Figure 5.
OCV–SOC plots. Dotted line represents the asymptote of the data points.
We found that the correlation between the SOC obtained from the charge–discharge curve and the open-circuit voltage OCV of the 12-cell series obtained from the Nyquist plot of the impedance measurement in Figure 4 was successfully evaluated.
The SOH decreases slowly and monotonically from the initial fully charged capacity with time of use. Moreover, the OCV information, charge/discharge history, temperature history, including high-temperature exposure time, and the number of elapsed years are extracted from the CAN data of the on-board battery package. Figure 6 presents a schematic block diagram of the system for which the most recent fully charged capacity (FCC) was calculated. It is possible to derive the SOH that depends on the cycle life from the ratio of FCC to the conventional full charge capacity standard value (FCC0) indexed by the battery manufacturer.
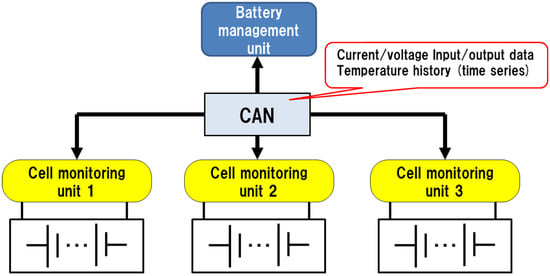
Figure 6.
Schematic diagram of the battery controller system.
In the case of rechargeable batteries, there is a degradation of charge/discharge capacity in accordance with calendar life, primarily because ions are blocked by the formation of a solid electrolyte interphase (SEI) on the active material surface. The degradation (=1 − SOH) is proportional to √t when the degradation rate coefficient relative to the calendar life is expressed as ke and has a power-law relationship with OCV [Equations (6) and (7)] [11,13,16,26].
In Equation (7), ΔOCV represents voltage stress, which is equal to the OCV shift. The power factor α is determined using the performance data of a group of storage batteries statistically collected from multiple storage batteries, as shown in Figure 2b.
The derivation of degradation rate coefficients was studied as a correlation evaluation between the SOH obtained from the charge/discharge measurement of modules and the drive time (driving distance). We targeted the evaluation of individual cells and the charge/discharge evaluated SOH.
The SOH was obtained as the ratio of the most recent FCC to the standard FCC (FCC0). The FCC is obtained from the integration of the SOC detected by impedance measurement of the module and FCC0. Several modules with different SOC values were prepared; the error was within 5% when comparing the capacity calculated from the SOC value obtained from impedance measurement and from the FCC obtained from actual charging. The FCC0 of the module was 0.86 kWh per pack with four mounted modules, which is the standard value, and the FCC of the module alone was approximately 0.22 kWh. The modules used in this verification were used products removed from vehicles. The FCC of each module and the estimated SOH of each module are listed in Table 1. These samples (#1–6) were arbitrarily extracted from used vehicles with different mileages. The reference in Table 1 is the FCC of a single cell before being installed in a vehicle; a simple calculation shows that each module has a charge capacity of approximately 0.25 kWh because there are 12-cell series. Therefore, it is possible to detect the SOH from the FCC of the module, although the SOH differs depending on the treatment of the FCC value.

Table 1.
FCC and calculated SOH values for the module samples.
4. Conclusions
The results obtained indicate that we were able to successfully establish a basic technique for the simple evaluation of the SOC and SOH. In the future, it will be necessary to establish an impedance evaluation method for automotive battery packs and to accumulate data on drive time–SOH curves. Additionally, our technique was verified under the assumption that all cells in a pack have the same charge–discharge characteristics. In reality, there are variations among the characteristics of cells. Therefore, the establishment of SOC and SOH evaluation methods that take into consideration variations in the charge–discharge characteristics of cells will be included in future research.
Author Contributions
Conceptualization, N.S. and K.T.; methodology, N.S.; validation, N.S., K.T.; formal analysis, N.S.; investigation, K.T.; resources, K.T.; data curation, N.S.; writing—original draft preparation, N.S.; writing—review and editing, N.S. and K.T.; visualization, N.S.; supervision, K.T.; project administration, N.S.; funding acquisition, N.S.. All authors have read and agreed to the published version of the manuscript.
Funding
This research was funded by JKA Foundation grant number 2021M-200.
Data Availability Statement
Data available on request due to restrictions eg privacy or ethical. This data is not available to the public at the request of the supplier of the onboard storage batteries.
Acknowledgments
This study was conducted as part of a project consigned by the Japan Keirin Autorace Foundation. We would like to express our sincere gratitude for the guidance we received. All individuals included in this section have consented to the acknowledgement.
Conflicts of Interest
The authors declare no conflict of interest.
References
- Tran, M.-K.; Fowler, M. A Review of Lithium-Ion Battery Fault Diagnostic Algorithms: Current Progress and Future Challenges. Algorithms 2020, 13, 62. [Google Scholar] [CrossRef]
- Li, Y.; Vilathgamuwa, M.; Farrell, T.; Choi, S.S.; Tran, N.T.; Teague, J. A physics-based distributed-parameter equivalent circuit model for lithium-ion batteries. Electrochim. Acta 2019, 299, 451–469. [Google Scholar] [CrossRef]
- Li, Y.; Xiong, B.; Vilathgamuwa, D.M.; Wei, Z.; Xie, C.; Zou, C. Constrained Ensemble Kalman Filter for Distributed Electrochemical State Estimation of Lithium-Ion Batteries. IEEE Trans. Ind. Inform. 2020, 17, 240–250. [Google Scholar] [CrossRef]
- Li, Y.; Vilathgamuwa, D.M.; Wikner, E.; Wei, Z.; Zhang, X.; Thiringer, T.; Wik, T.; Zou, C. Electrochemical Model-Based Fast Charging: Physical Constraint-Triggered PI Control. IEEE Trans. Energy Convers. 2021, 36, 3208–3220. [Google Scholar] [CrossRef]
- Dey, S.; Ayalew, B.; Pisu, P. Nonlinear Adaptive Observer for a Lithium-Ion Battery Cell Based on Coupled Electrochemical–Thermal Model. J. Dyn. Syst. Meas. Control 2015, 137, 111005. [Google Scholar] [CrossRef]
- Gandolfo, D.; Brandão, A.; Patiño, D.; Molina, M. Dynamic model of lithium polymer battery—Load resistor method for electric parameters identification. J. Energy Inst. 2015, 88, 470–479. [Google Scholar] [CrossRef]
- Tran, M.-K.; Fowler, M. Sensor Fault Detection and Isolation for Degrading Lithium-Ion Batteries in Electric Vehicles Using Parameter Estimation with Recursive Least Squares. Batteries 2019, 6, 1. [Google Scholar] [CrossRef]
- Gao, Z.; Chin, C.S.; Woo, W.L.; Jia, J. Integrated Equivalent Circuit and Thermal Model for Simulation of Temperature-Dependent LiFePO4 Battery in Actual Embedded Application. Energies 2017, 10, 85. [Google Scholar] [CrossRef]
- Plett, G.L. Extended Kalman filtering for battery management systems of LiPB-based HEV battery packs. J. Power Sources 2004, 134, 252–261. [Google Scholar] [CrossRef]
- Maura, I.; Sugie, T. Projection-based identification algorithm for grey-box continuous-time models. Syst. Control Lett. 2013, 62, 1090–1097. [Google Scholar]
- Coleman, M.; Lee, C.K.; Zhu, C.; Hurley, W. State-Of-Charge Determination From EMF Voltage Estimation: Using Impedance, Terminal Voltage, and Current for Lead-Acid and Lithium-Ion Batteries. IEEE Trans. Ind. Electron. 2007, 54, 2550–2557. [Google Scholar] [CrossRef]
- Wang, S.; Verbrugge, M.; Wang, J.S.; Liu, P. Multi-parameter battery state estimator based on the adaptive and direct solution of the governing differential equations. J. Power Sources 2011, 196, 8735–8741. [Google Scholar] [CrossRef]
- Verbrugge, M.; Tate, E. Adaptive state of charge algorithm for nickel metal hydride batteries including hysteresis phenomena. J. Power Sources 2004, 126, 236–249. [Google Scholar] [CrossRef]
- Pesaran, A.; Keyser, M.; Burch, S. An Approach for Designing Thermal Management Systems for Electric and Hybrid Vehicle Battery Packs; National Renewable Energy Laboratory: Golden, CO, USA, 1999. [Google Scholar]
- Doughty, D.H. Vehicle Battery Safety Roadmap Guidance; National Renewable Energy Laboratory: Golden, CO, USA, 2012. [Google Scholar]
- Lunz, B.; Sauer, D.U. Electric road vehicle battery charging systems and infrastructure. Adv. Battery Technol. Electr. Veh. 2015, 445–467. [Google Scholar]
- Sadeghian, O.; Oshnoei, A.; Mohammadi-ivatloo, B.; Vahidinasab, V.; Anvari-Moghaddam, A. A comprehensive review on electric vehicles smart charging: Solutions, strategies, technologies, and challenges. J. Energy Storage 2022, 54, 105241. [Google Scholar] [CrossRef]
- Schmid, M.; Vögele, U.; Endisch, C. A novel matrix-vector-based framework for modeling and simulation of electric vehicle battery packs. J. Energy Storage 2020, 32, 101736. [Google Scholar] [CrossRef]
- Omariba, Z.B.; Zhang, L.; Sun, D. Review of Battery Cell Balancing Methodologies for Optimizing Battery Pack Performance in Electric Vehicles. IEEE Access 2019, 7, 129335–129352. [Google Scholar] [CrossRef]
- Chen, Y.; Liu, X.; Fathy, H.K.; Zou, J.; Yang, S. A graph-theoretic framework for analyzing the speeds and efficiencies of battery pack equalization circuits. Int. J. Electr. Power Energy Syst. 2018, 98, 85–99. [Google Scholar] [CrossRef]
- Piller, S.; Perrin, M.; Jossen, A. Methods for state-of-charge determination and their applications. J. Power Sources 2001, 96, 113–120. [Google Scholar] [CrossRef]
- Yang, F.; Xing, Y.; Wang, D.; Tsui, K.-L. A comparative study of three model-based algorithms for estimating state-of-charge of lithium-ion batteries under a new combined dynamic loading profile. Appl. Energy 2016, 164, 387–399. [Google Scholar] [CrossRef]
- He, Y.; Liu, X.; Zhang, C.; Chen, Z. A new model for State-of-Charge (SOC) estimation for high-power Li-ion batteries. Appl. Energy 2013, 101, 808–814. [Google Scholar] [CrossRef]
- Kim, I.S. The novel state of charge estimation method for lithium battery using sliding model observer. J. Power Sources 2006, 163, 584–590. [Google Scholar] [CrossRef]
- Zhang, F.; Liu, G.; Fang, L.; Wang, H. Estimation of Battery State of Charge With H∞ Observer: Applied to a Robot for Inspecting Power Transmission Lines. IEEE Trans. Ind. Electron. 2011, 59, 1086–1095. [Google Scholar] [CrossRef]
- He, H.; Xiong, R.; Zhang, X.; Sun, F.; Fan, J. State-of-Charge Estimation of the Lithium-Ion Battery Using an Adaptive Extended Kalman Filter Based on an Improved Thevenin Model. IEEE Trans. Veh. Technol. 2011, 60, 1461–1469. [Google Scholar]
Publisher’s Note: MDPI stays neutral with regard to jurisdictional claims in published maps and institutional affiliations. |
© 2022 by the authors. Licensee MDPI, Basel, Switzerland. This article is an open access article distributed under the terms and conditions of the Creative Commons Attribution (CC BY) license (https://creativecommons.org/licenses/by/4.0/).