Article

Influence of Different Heat Loads and Durations on the Field Thermal Response Test

1
College of Construction Engineering, Jilin University, Changchun 130026, China
2
Engineering Research Center of Geothermal Resources Development Technology and Equipment, Ministry of Education, Jilin University, Changchun 130026, China
3
Key Lab of Groundwater Resource and Environment, Ministry of Education, Jilin University, Changchun 130021, China
4
State Key Laboratory for Geomechanics and Deep Underground Engineering, China University of Mining and Technology, Xuzhou 221116, China
*
Author to whom correspondence should be addressed.
Energies 2022, 15(22), 8759; https://doi.org/10.3390/en15228759
Submission received: 12 October 2022 / Revised: 5 November 2022 / Accepted: 17 November 2022 / Published: 21 November 2022
(This article belongs to the Section H2: Geothermal)

Abstract

:
Geothermal energy exhibits considerable development potential in space heating. Shallow geothermal energy stored in the soil in the form of low-grade energy is mainly extracted via the ground source heat pump (GSHP) system. GSHP systems use the subsoil as a heat source, typically involving a vertical borehole heat exchanger (BHE) to extract heat from the formation. Accurate measurement of the thermal properties of the formation is very important for the design of BHEs. At present, the most common and effective method to measure the thermal conductivity of the formation in the field is the thermal response test (TRT). However, the test conditions (heat load, test time) during the thermal response test can impact the test results. Therefore, in this study, a borehole with a depth of 130 m was evaluated in the field. The TRT module and the distributed thermal response test (DTRT) module based on distributed optical fiber temperature sensor (DOFTS) technology were used to monitor the test with different working conditions in real-time. In the field tests, geothermal conditions and the evolution of the formation temperature with time and depth were determined. Based on the test results under different heat loads and test times, the influence of the test conditions on the thermal conductivity results was analyzed and described. A constant temperature zone was located at a depth from 25 m to 50 m, and an increasing temperature zone was located at a depth from 50 m to 130 m, with a geothermal gradient of 3 °C/100 m. The results showed that the heat load slightly influenced the thermal conductivity test results. At the initial stage of the test, the temperature significantly increased from 0 to 12 h. After reaching the quasi-stable state, the test time slightly influenced the thermal conductivity test results. The characteristics of the formation thermal recovery stage after the test stage were studied. The heat load decreased, which could shorten the time for the formation to recover the initial temperature. The results could provide a basis for the optimization of thermal response test conditions.

1. Introduction

With the growth in modern industries and economic activities over the past few decades, the extensive use of traditional energy sources, particularly the burning of fossil fuels, has contributed to a number of issues, including air pollution, global warming and resource depletion [1]. Climate change and environmental degradation are now important worldwide concerns, and the cost-effectiveness and reliability of renewable low-carbon energy systems have been proven, so switching from conventional fuels to renewable sources should be actively encouraged [2]. Renewable energy is defined as energy that can be continually regenerated via natural processes. Examples of this type of energy include solar energy, wind energy, biomass energy, geothermal energy, ocean energy (tidal and wave energy) and hydrogen energy [3,4]. Renewable energy is regarded as pollution-free energy, exhibits minimal operating and management costs, and is kind to the environment [5]. Geothermal energy is a type of clean energy that can be categorized and optimized based on the fundamental characteristics of the reservoir formation depth (shallow, medium and deep reservoirs), reservoir temperature (low, medium and high temperatures), development and utilization mode (hydrothermal, dry thermal, etc.) and target use (refrigeration, heating, and power generation) [6]. Geothermal energy is extremely effective and potent in regard to creating electricity as well as in regard to cooling and heating buildings [7]. By 2050, geothermal energy may produce 1400 TWh annually, approximately 3.5% of all energy produced worldwide. This could result in an annual CO2 emission reduction of 800 Mt [8]. Shallow geothermal energy stored in soil in the form of low-grade energy is mainly extracted through the ground source heat pump (GSHP) system. The GSHP system employs the subsoil as a heat source or radiator according to the heating or cooling requirements of the buildings it serves and interfaces with the subsoil through ground heat exchangers along either the vertical or horizontal direction. Among them, the vertical ground heat exchanger is most commonly referred to as the borehole heat exchanger (BHE) [9].
The ground source heat pump system’s success depends on the BHE’s practical design. The divergence in the BHE design length can vary between 4.5 and 5.8% if the relative inaccuracy of the soil thermal conductivity reaches 10% [10]. The environmental benefits of the GSHP will be lost if the design length of the BHE exceeds the required length by 10–33% [11]. Therefore, it is essential for the design of BHEs to obtain precise measurements of the thermal characteristics of the formation. The thermal response test (TRT), which is executed in the field and was first developed by Mogensen, is the most popular and efficient technique for determining the formation thermal conductivity [12]. Typically, field tests are conducted involving a BHE with roughly the same diameter and depth as those of the heat exchanger that will be installed in the field. The most typical thermal response test deployment involves inserting a U-shaped polyethylene pipe into the borehole and packing heat transfer-enhanced grout material into the area between the pipe and the wall grout material. Water is heated by a controlled electric heater and is circulated in a U-shaped pipe, exchanging heat with the formation. To inversely generate soil thermal response parameters from a given identification model, the input and outflow fluid temperatures are typically monitored [13]. The distributed thermal response test (DTRT) was created based on the conventional thermal response test due to the quick development of distributed temperature sensing technology. While the DTRT uses the same heating technique as the conventional TRT, temperature readings are obtained along the full length of the BHE rather than only at the intake and output of the pipeline. Temperature recording frequently relies on optical fibers [14]. The purpose of analyzing the influencing factors of thermal response tests is to identify error sources in the testing process and data processing, remove major error factors as much as possible, and thus improve the accuracy of the test results. There are unavoidable errors between the data results obtained from field tests and the real thermal physical property values. Researchers typically perform field tests and numerical simulations to study the effects of various operating parameters, such as the heat load, medium flow rate, and test time, on thermal response testing [15,16].
In the thermal response test, it is important to maintain a constant heat load. The heat load can affect the accuracy of the test results; otherwise, the effective thermal conductivity obtained through the test does not reflect the true value [17]. However, there is not a common standard across all locations for the thermal load of the thermal response test. ASHRAE guidelines for the TRT [18] recommend a heat input rate between 45 and 75 W/m. The TRT Italian Standard (UNI 11466) [19] recommends that if the ILS model is applied in TRT analysis, the heat input rate should range from 30–80 W/m. Numerous studies on thermal response testing using different thermal loads have been conducted recently. In a 120-m deep borehole in Jixi, China, Zhang [20] conducted two thermal response tests with thermal loads of 4.2 kW and 5.6 kW. Javier [21] and Borja [22] conducted some TRTs with a variety of power test conditions at their university campus in Valencia (Spain). To conduct multiple thermal response tests under various thermal loads in the same borehole or to drill multiple boreholes for thermal response tests is, however, too expensive for actual small-scale ground source heat pump projects. As a result, researchers have emphasized the significance of the heat load in thermal response tests. Through numerical and experimental research, Wang [23] examined the impact of the thermal injection power rate on the outcomes of the thermal response test. The findings demonstrated that the heater injection power exerted no impact on determining the ground thermal conductivity when heat exchange was modeled as pure heat conduction. Yu [24] used a real engineering project in the city of Shijiazhuang as an illustration to examine the thermal properties of the ground. The findings indicated that the predicted thermal conductivity value increased with increasing thermal load. The findings of Zhou [25] demonstrated that while the heating power slightly impacted the soil thermal conductivity, it exerted a significant impact on the heat transfer capacity and the time to reach the quasi-steady state. Under the condition of groundwater flow, Gustafsson [26] conducted thermal response experiments under various heating powers, and it was noted that the higher the heating power was, the higher the effective thermal conductivity of soil. The majority of these studies, however, only considered the changes in the inlet and outlet temperatures in response to various thermal loads; they did not account for temperature changes in the formation. Additionally, many academics have employed numerical modeling to examine how the heat load affects thermal response tests. Choi [27] created an analysis model to represent the heat exchange process in the ground TRT device to better design thermal response test conditions. He suggested that if the dominating conduction conditions could be guaranteed, a high heat injection rate is a suitable indicator of stable estimation. Zhang [11] investigated how geological stratification affected the precision with which ground thermal parameters could be estimated via the TRT and then created a validated numerical stratification BHE model (NLBM) to simulate the TRT. The model must still be created using field test parameters notwithstanding the numerical simulation approach. Therefore, it is essential to consider a range of thermal loads during the field test to track the change in the formation temperature and offer fundamental information for model development and validation.
A main aspect affecting how accurate the thermal response test is in regard to rock and soil thermal responses is the test duration. An insufficient test time can result in a significant discrepancy between the measured thermal property parameters and the actual rock and soil characteristics, which can impact future design and construction. The thermal response test period cannot, however, be excessively long in practical engineering due to the cost issue. As a result, the minimum test time should be considered, which not only ensures the test accuracy but also prevents the cost issue associated with an excessively long test time. The Chinese specification for ground source heat pumps requires the geotechnical thermal property test time to be at least 48 h [28]. According to relevant specifications of the ASHREA, a reasonable test time ranging from 36 to 48 h is required [29]. Wang [23] concluded that the test time should be longer than 70 h to ensure stability based on numerical and experimental research. According to Zhou [25], if the heating power is properly selected, a quasi-steady state may be reached within a 24-h test period, and test period extension exerted little to no impact on the test accuracy. According to Choi’s [30] statistical research of 36 TRTs, a minimum of 60 h is advised for the TRT. According to Sarah’s study [31] of various test durations, a test period of approximately 50 h could generally yield satisfactory results under ideal simulated conduction conditions. With the use of the TRT method, Bujok [32] measured eight boreholes and demonstrated that the test duration was decreased to 24 h and that the differences between the calculated values of the soil thermal conductivity and borehole thermal resistance were smaller than those between individual boreholes during the actual measurements. The findings of the thermal response test involving a water-filled borehole performed by Nieto [33] in the Spanish province of Avila revealed that there was little variance in the thermal conductivity measured at different times. However, these studies still ignore the temperature change within the formation. Due to the cost and other reasons, the field test cannot be indefinitely extended, so the test time can be studied by means of numerical simulations. To precisely calculate the transient heat transfer in the borehole, Bozzoli [34] proposed a three-dimensional finite element model. He then demonstrated that using only the thermal response parameters over the first 12 h, the relative error of the soil and grout thermal conductivity was less than 1.4%. Han and Zhang [35] developed a three-dimensional numerical heat transfer model for the thermal response test of a soil-source heat pump and discovered that the optimal test time could be effectively shortened by increasing the temperature data discarding time during the initial test phase and decreasing the circulating fluid velocity. By choosing the right test time, the identification accuracy could be improved. This demonstrates that it is unreliable to increase the test duration alone in an effort to increase the recognition accuracy. Han and Li [36] concluded that while the identification error curve of the volume heat capacity increased with increasing test time, the identification error curve of the thermal conductivity generally decreased with increasing test time. Similarly, the modeling basis and verification conditions of numerical simulations still depend on field test parameters, and their determination is indispensable.
The thermal response test usually has multiple test stages. Before another in situ TRT can be performed, enough time must pass to ensure that the ground temperature has returned to the initial value [17]. For interrupted testing, the ASHARE [37] recommends waiting 10 to 12 days before retesting the drill hole after completing a 48-h test and suggests that the waiting time can be reduced in proportion to the reduced test time. However, the time to recover the initial ground temperature is not considered in many studies. Although the time to recover the initial ground temperature usually depends on turning off the heating device, an excessive heat recovery time can extend the duration of the entire TRT and increase the cost. Therefore, the thermal recovery time in the thermal response test should be studied.
In summary, research on the impact of test conditions on the test results is mostly based on the traditional TRT. It is impossible for the standard TRT temperature sensor, which is only mounted at the inlet and outflow, to accurately reflect the temperature along the entire depth during the test and the temperature of the bottom hole. Formation temperature fluctuation was not considered when analyzing the impact on the thermal conductivity measurement results. The thermal recovery time should also be accounted for to shorten the overall test duration and lower the cost of the thermal response test.
The on-site thermal response in a borehole in Changchun city was investigated in this work by combining the conventional thermal response test and the distributed optical fiber-based DTRT. The DOFTS continuously measures the temperature change at each location in the stratum, while the TRT module continuously tracks the temperature change at the intake and outlet. Within 130 m of the shallow layer, geothermal features were identified, and the variation trends of the formation temperature with the operation time and test depth were examined. The borehole was evaluated under three heat load conditions. The effects of the heat load and thermal load test time on the thermal conductivity results were studied in conjunction with the intake and outlet temperature data, as well as the temperature data at various depths in the formation. The parameters of temperature change during the thermal recovery phase of the formation following the test phase were also researched. The appropriate heat load, test time, and heat recovery time should be chosen based on the features of the temperature change at each depth in the formation during the test period and the initial temperature recovery period, considering the requirements of the cost and test accuracy.

2. Materials and Methods

2.1. In-situ Test Principle

Due to the inevitable errors between the data results obtained via field testing and the real thermal physical property values, the purpose of analyzing the influencing factors of thermal response testing is to determine error sources in the testing process and data processing and remove major error factors to the greatest extent to improve the accuracy of the test results. In this paper, the slope method of the linear heat source model was used to calculate parameters. The linear heat source model regards the buried pipe heat exchanger as an infinitely long line heat source model with a constant heat flow and regards the backfill material and soil outside the buried pipe as an infinite medium with uniform thermal resistance. The strata were assumed homogeneous, isotropic and borderless. The average temperature of the circulating liquid at the inlet and outlet can be expressed as Equation (1):
T f = Q 4 π λ s L ln τ Q L 1 4 π λ s ln 4 α r b 2 γ ) R b + T 0
In Equation (1), Tf is the average temperature of the fluid at the inlet and outlet of the buried pipe, (K); Q is the heat load, (W); λs is the average thermal conductivity of the rock and soil mass, (W/(m∙K)); L is the length of the buried pipe, (m); rb is the drilling radius, (m); α is the thermal diffusivity, (m2/s); γ is Euler’s constant, 0.5772; T0 is the average initial temperature of the rock and soil mass, (K); Rb is the thermal resistance of the drilling hole, (m∙K/W).
Equation (1) can be simplified as:
T f = k ln t + b
By measuring the inlet and outlet temperatures of the buried pipe fluid at each time, the average fluid temperature at each time can be obtained:
T f = T i n + T o u t / 2
According to the linear relationship between the fluid temperature and logarithmic time at each time point, the slope coefficient k can be determined via linear regression with the least square method, and the thermal conductivity of rock and soil λs can be further obtained:
λ s = q 4 π k
By analyzing Equation (1), the factors related to the calculated parameters mentioned in the equation include the initial soil temperature, measurement time, heat load, physical parameters of the backfill material and borehole aperture. The deviation in these parameters exerts a direct impact on the calculation and determination of the soil thermal conductivity.

2.2. Field Test Procedure

As shown in Figure 1, the Fengyue Automobile Factory plans to build a ground source heat pump in a plant located in Changchun city, Jilin Province, China. Therefore, the thermal response field test was conducted at the plant before construction to obtain the thermal physical property parameters of the rock and soil. Changchun city is located in the mid-temperate continental monsoon climate zone, with an annual average temperature of 4.8 °C and a low temperature of −39.8 °C in winter. Heating is required for up to 6 months of the year, which is essential for local production and life. The heat extracted from the proposed GSHP will be used to increase the temperature in the industrial workshop (heating target) to ensure that the workshop can be properly operated in winter. The distance between the heating target and the borehole is 300 m, and heat will be transported to the workshop through insulation pipes buried in the ground.
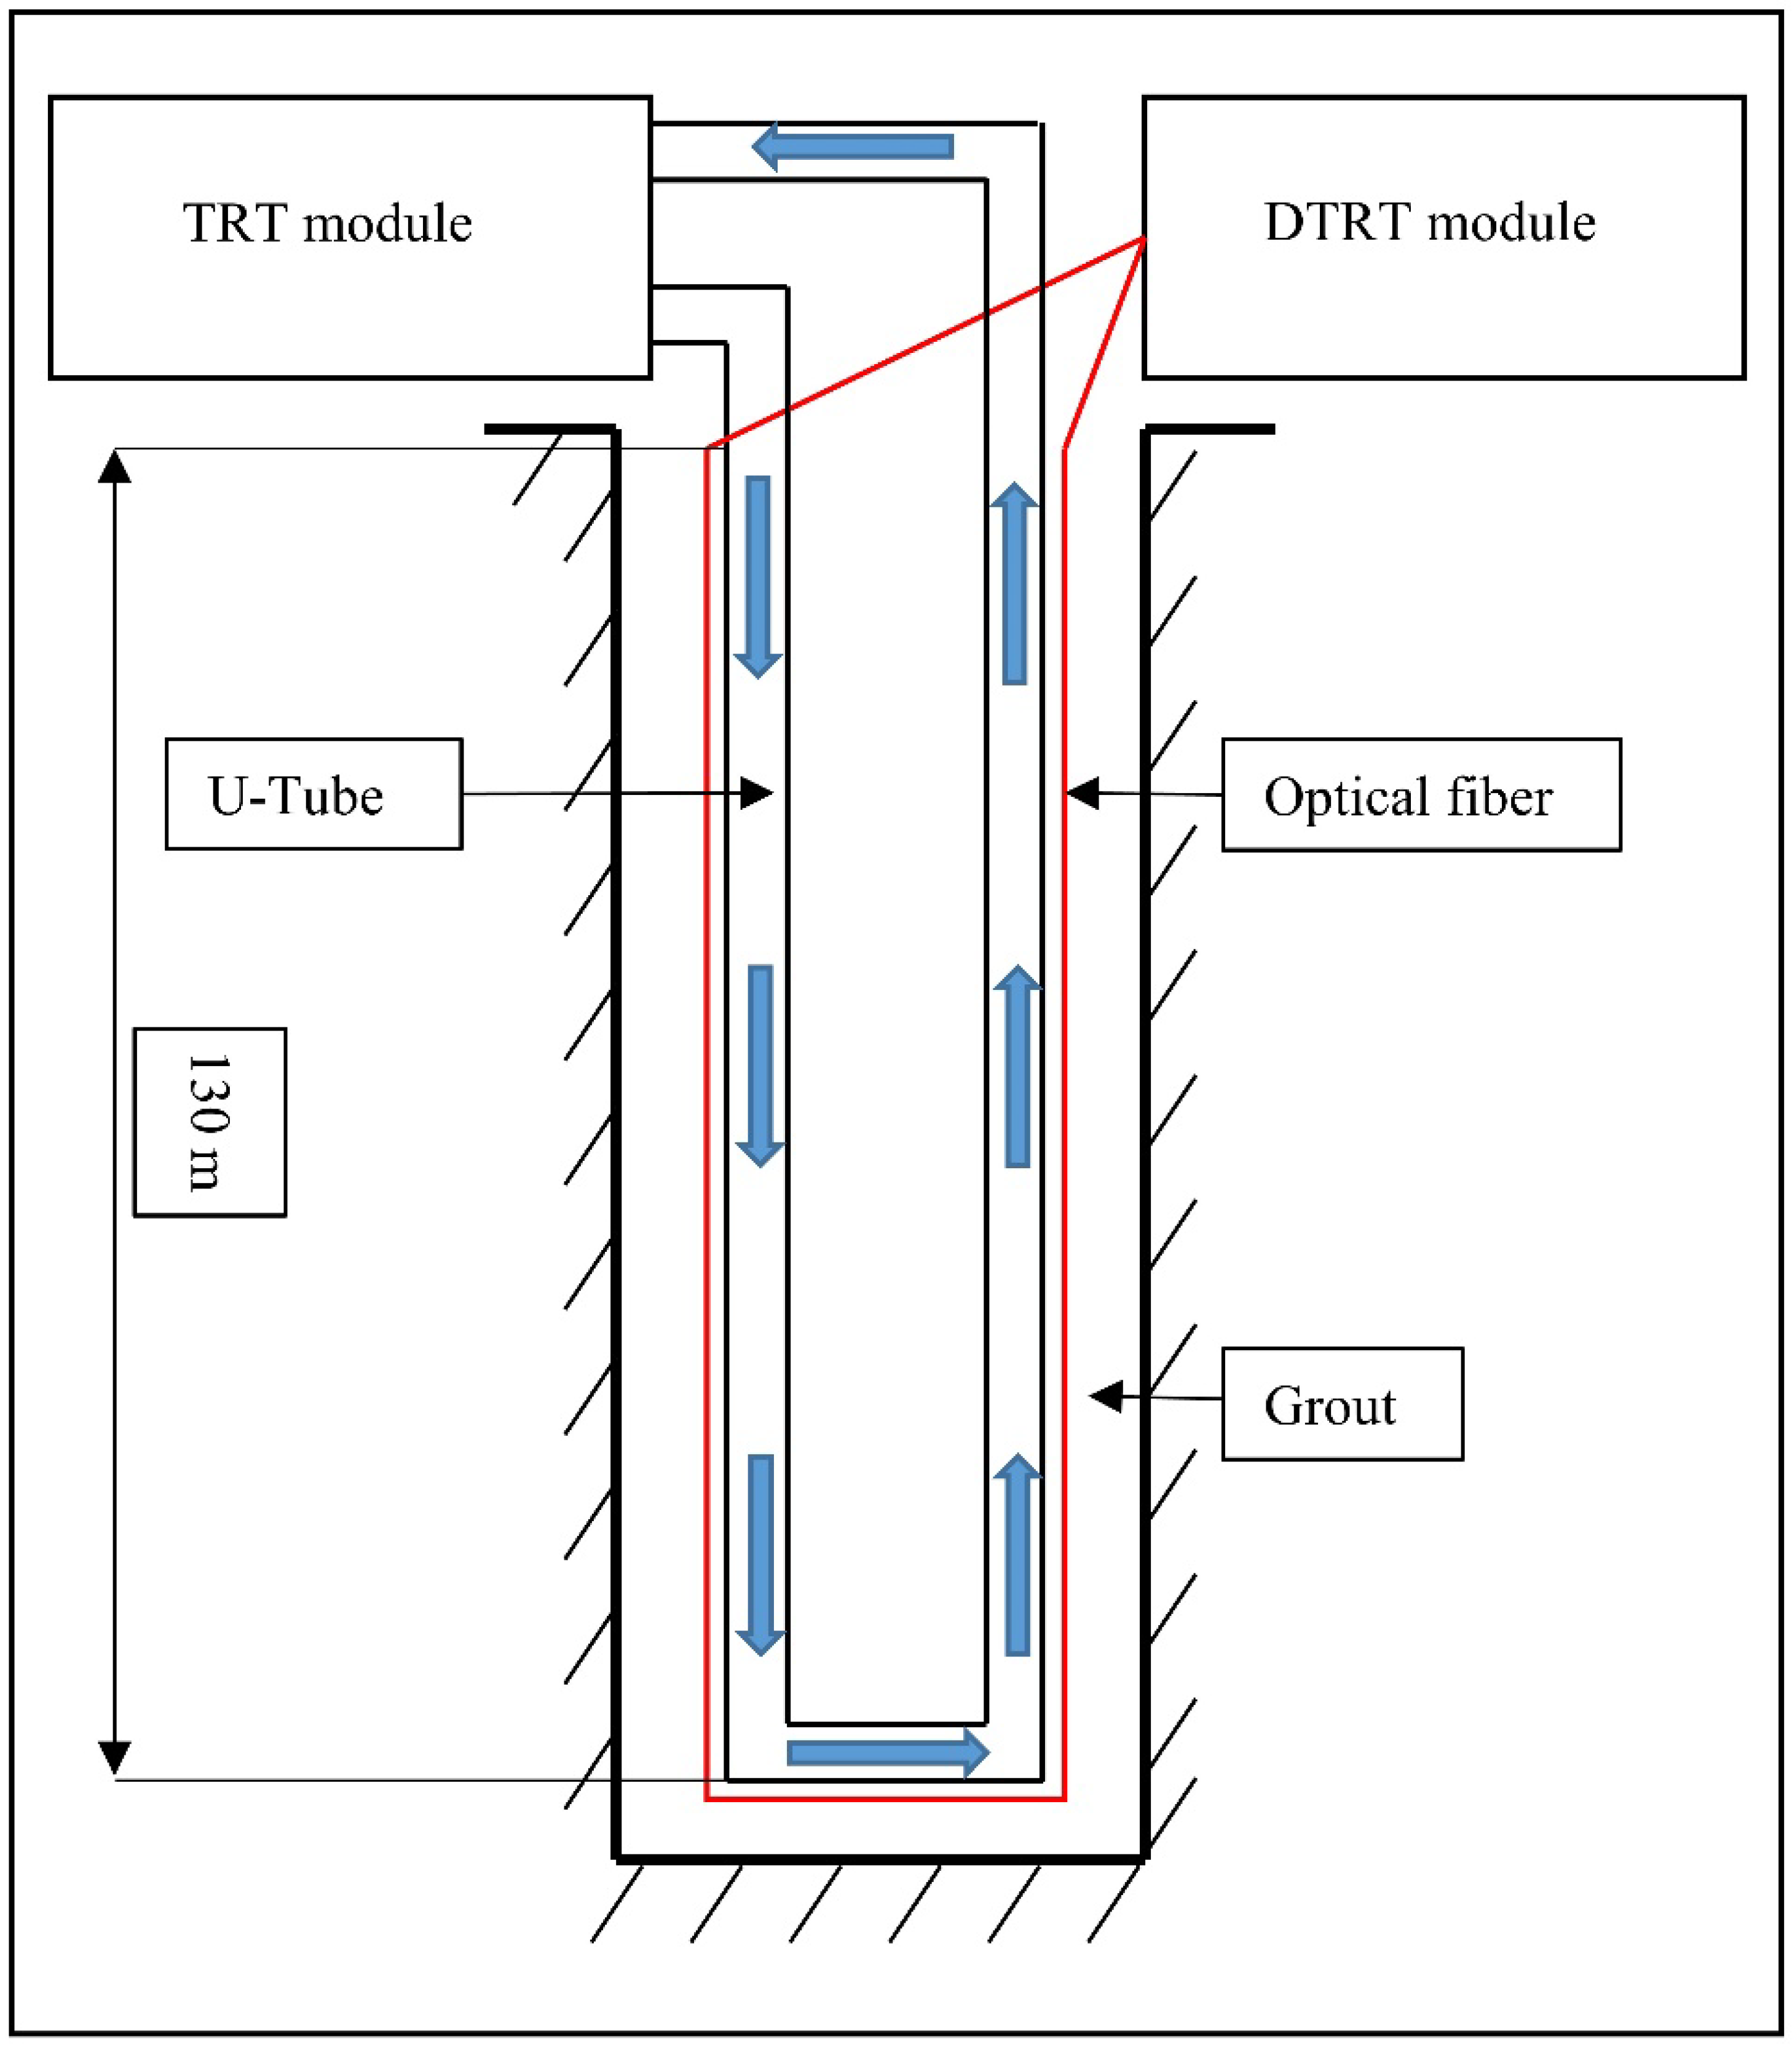
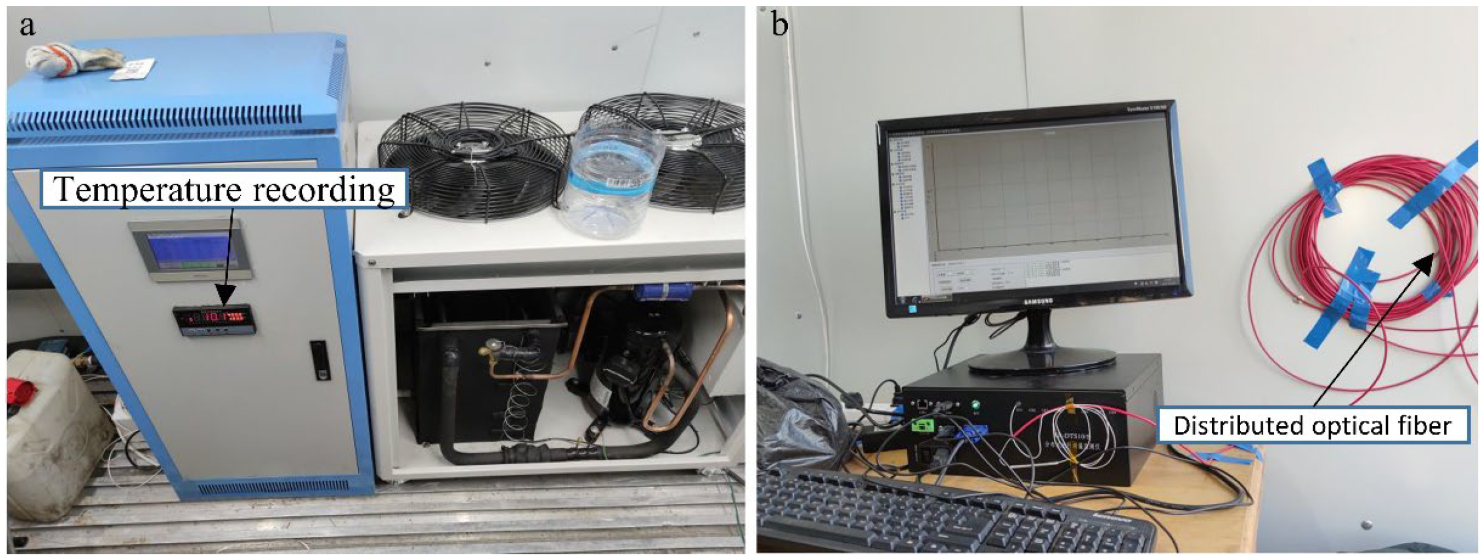
The thermal response test system consists of a traditional thermal response test module (TRT module) and a distributed thermal response test module (DTRT module), as shown in Figure 2. After the drilling process was completed and stable conditions were obtained, a high-density PE pipe was vertically lowered into the drilling hole under pressure. During the test, the circulating fluid was circulated in a U-Tube, as shown in Figure 2. Accordingly, the temperature acquisition probe (Figure 3a) arranged at the inlet and outlet of the pipe and the distributed optical fiber temperature sensor (Figure 3b) arranged throughout the well were used to monitor and collect temperature data. To stabilize the measurement of the DOFTS, in the installation process, the optical fiber was fixed on the tube wall at 0.2 m intervals through a high-temperature-resistant rolling strip. The temperature probe and recorder were connected with a temperature cable protected by a flexible metal hose, which also protected the optical fiber from breaking and being affected by the surrounding environment. Distributed optical fibers and steel tubes (fluid inlet and outlet) were introduced into the field thermal physical property test chamber to connect the DTRT module and TRT module, respectively. The TRT module recorded the temperature at the water outlet hole and water inlet hole in real-time, and the DTRT module observed the temperature at each depth in the formation in real-time. Temperature data measured by the DOFTS were automatically collected every 7 s and saved every 15 min. Therefore, the temperature changes with the depth and time during the test could be displayed on the computer.

2.3. Materials of the BHE

The length of the U-Tube was designed to be 130 m to match the drilling depth. In terms of the stratigraphic structure, silty clay, mudstone, argillaceous siltstone and mudstone mainly developed from top to bottom. The tube adopted a DN32 high-density PE double U-Tube. The backfill consists of mixed paddle material of bentonite and fine sand. The bentonite content ranged from 4 to 6% and the fine sand content reached 95%. After filling, the system was left to stand for 48 h. Backpacking prevents wall collapse during construction. It also improves thermal conductivity. Water was chosen as the circulating working fluid. For the field test, the parameters of the borehole and U-Tube are listed in Table 1.

2.4. Field Test Procedure

To measure the influence of the heat load and test time on the thermal conductivity, three operating conditions (A, B and C) and three restoration conditions (R1, R2 and R3) to restore the ground temperature were designed. The duration of the A, B and C conditions was set to 48 h, and the heat loads were 12, 8, and 4 kW, respectively. The duration of the three restoration conditions was set to 72 h. Test condition information is provided in Table 2. After the undisturbed ground temperature was measured, the constant heat flow experiment under working condition A was conducted first, and the heat transfer medium in the loop was heated under a 12 kW heat load. During the test, the thermal load and flow rate were basically maintained constant (a fluctuation range within ±5%). The TRT module recorded the flow rate and inlet and outlet temperatures of the heat transfer medium in the loop, and the DTRT module recorded the temperature at different depths of the stratum at different times. The observation time should not be less than 24 h after the temperature remains stable. After the test under working condition A, Condition R1 was employed, and heating was stopped for 72 h to restore the initial ground temperature. Similar to operating condition A and restoration condition R1, after restoring the initial ground temperature under Condition R1, Conditions B, R2, C and R2 were employed in sequence.

2.5. Uncertainty Analysis

According to the experimental observations, the parameters were obtained. The calculation results contain inaccuracies because the experimental equipment suffers a certain inaccuracy. Error propagation theory was used to examine the temperature uncertainty and ensure the efficacy of the results to validate the accuracy of test result processing. The circulation flow was measured using an ultrasonic flowmeter during the experiment, with a maximum measurement inaccuracy of ±1%. A heater was used to apply the thermal load during the test, and the power supply voltage exhibited a maximum inaccuracy of ±3%. The thermal resistance, with a maximum inaccuracy of ±0.05%, measured the fluid temperature at the input and output. With a measuring precision of 1 °C and a maximum uncertainty of ±0.5%, dispersed temperature sensors were used to continuously monitor the formation temperature. The distributed optical fiber provided a positioning precision of 1 m and a maximum error of ±0.4%.
Based on these parameters, the uncertainty in the thermal conductivity can be calculated as ±3.2% via Equation (5).
U λ s = ± λ s Q U Q 2 + λ s A C V U A C V 2 + λ s T i n U T i n 2 + λ s T o u t U T o u t 2 + λ s T d t s U T d t s 2 + λ s L U L 1 2

3. Results and Discussion

3.1. Determination of the Geothermal Conditions

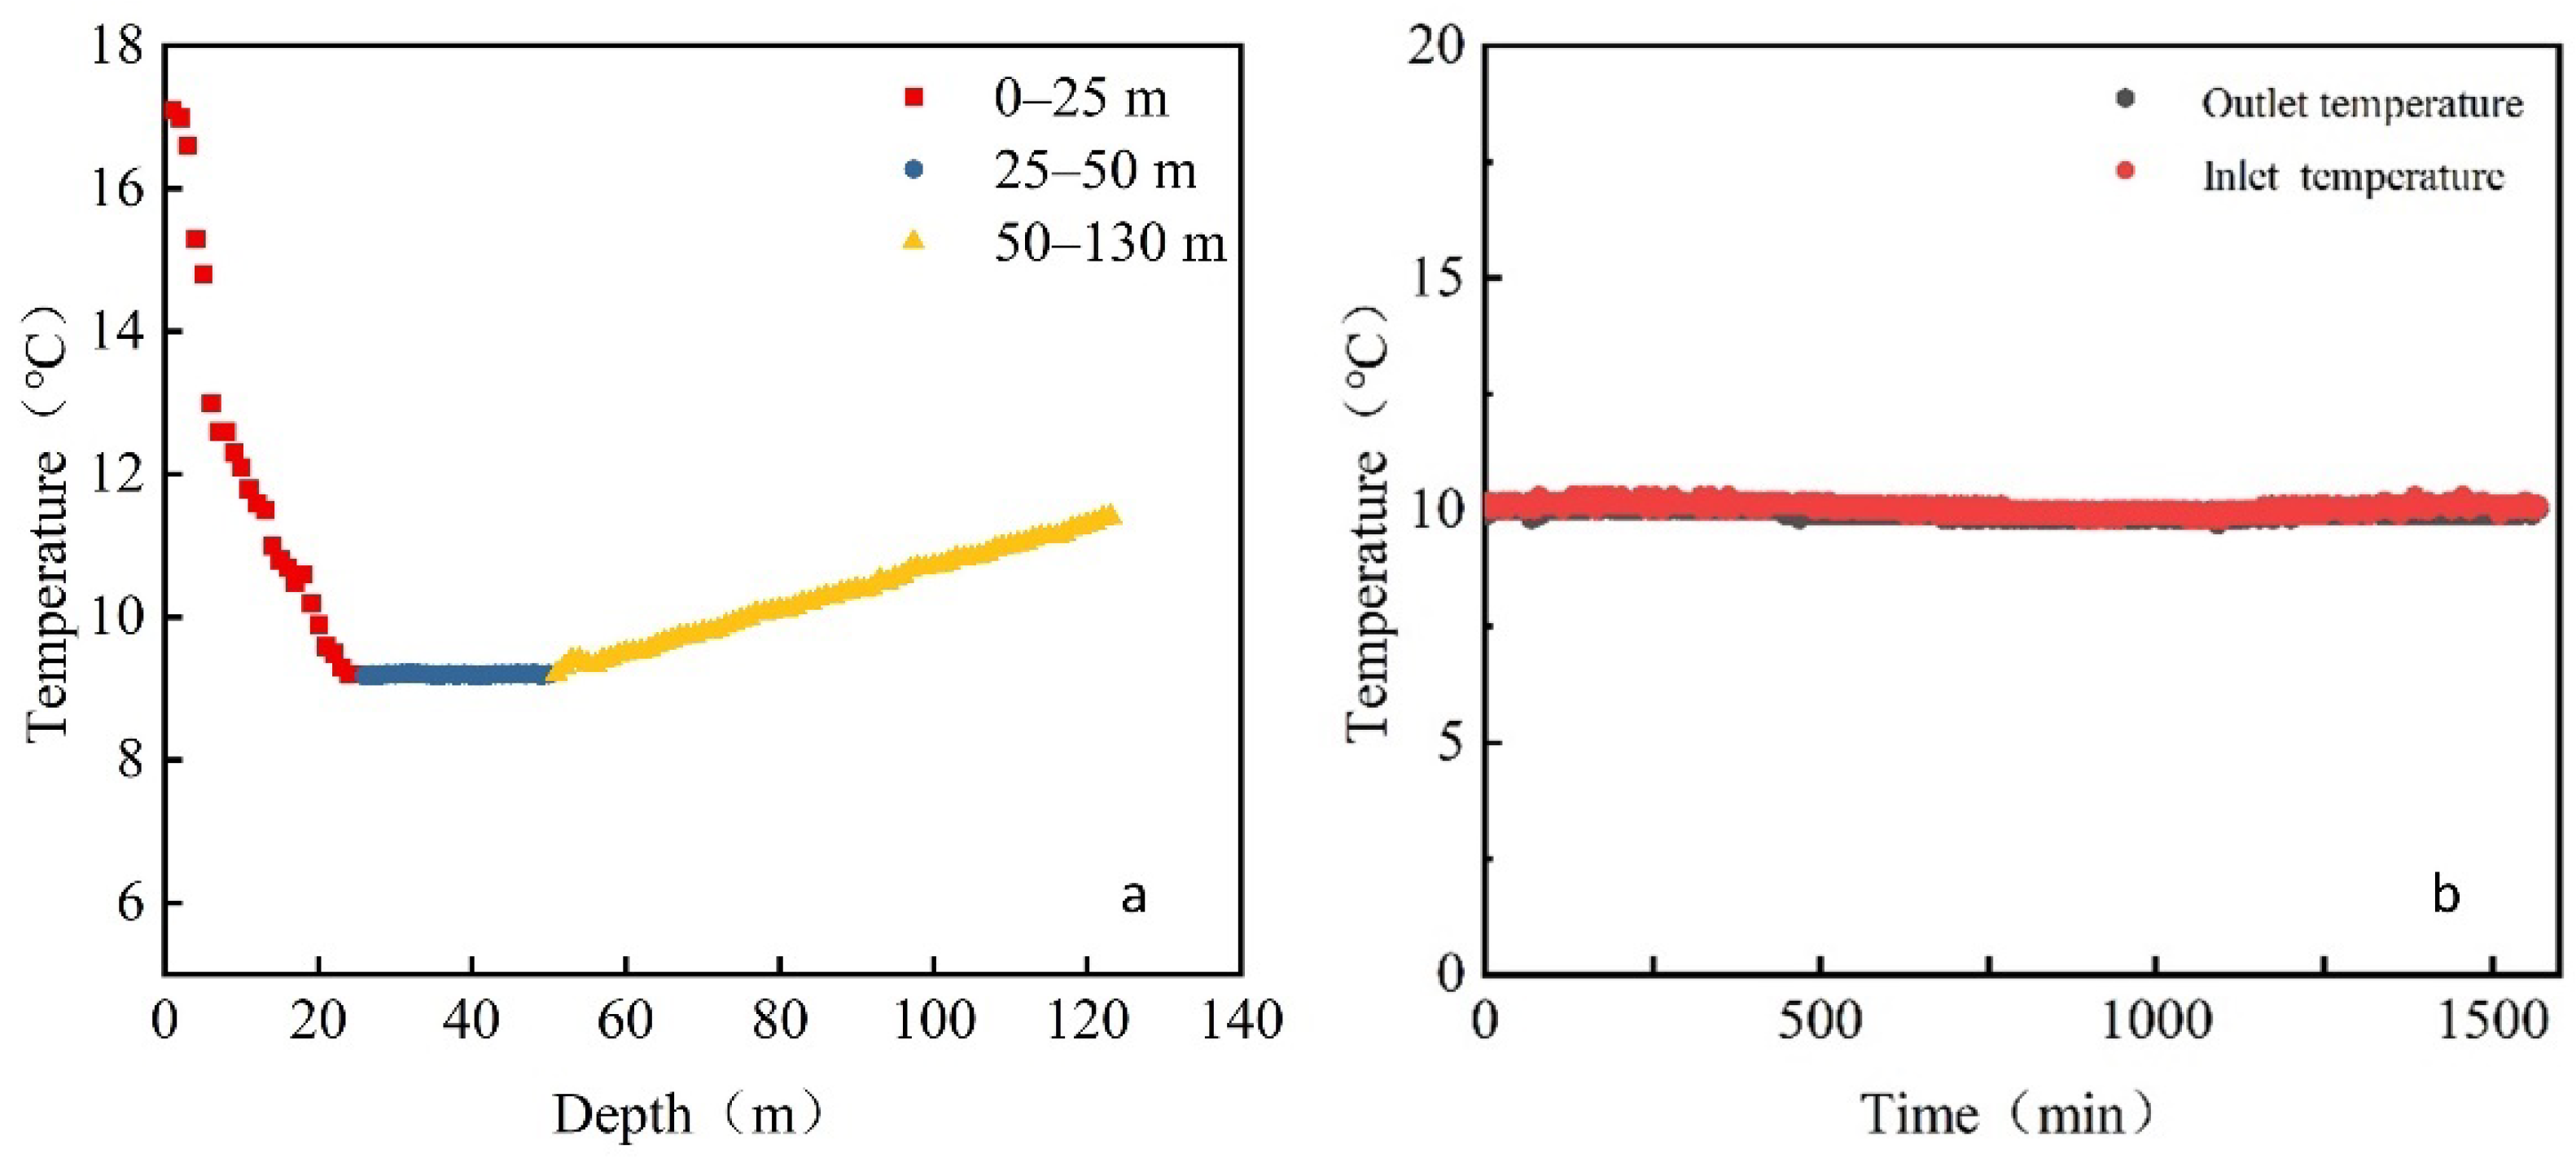
Geothermal conditions can determine the amount of heating. After the lower pipe was buried for 48 h, the distribution of the stratum temperature recorded by the distributed temperature measurement fiber along the depth is shown in Figure 4a. The bottomhole temperature was 11.4 °C at 130 m, with an average geothermal gradient of 3.0 °C/100 m. According to the temperature distribution trend, the underground temperature field could be divided into three layers: the 0–25 m stratum temperature was greatly affected by the surface covering layer, atmosphere and solar radiation and varied greatly in different seasons and regions; the formation temperature from 25–50 m remained basically constant, and this area could be regarded as a constant area of the underground temperature; then, the temperature increased linearly with increasing depth from 50–130 m, and it could be determined that 50–130 m was the temperature increasing area. The average temperature within the study depth range of 130 m was 10.0 °C without considering the 0–25 m variable-temperature area, which was greatly affected by atmospheric and light factors. Then, the circulating water pump was turned on, the heater was turned off, and the inlet and outlet temperature curves of the fluid were recorded, as shown in Figure 4b. When the temperature reached stability, the outlet temperature was 10.1 °C, which is consistent with the results obtained via distributed temperature measurement. Therefore, it is recommended to adopt the method of distributed temperature measurement, which can divide the temperature field of the stratum. In this paper, 10 °C was selected as the undisturbed ground temperature.

3.2. Influence of the Heat Load

The borehole was tested under Conditions A, B, and C with different heat loads, and the test duration under each condition was 48 h. During the test, the water flow rate in the pipe was kept at 0.68 m/s. The data acquisition system of the TRT module automatically recorded the temperature at the inlet and outlet every 60 s. After the test, the continuously recorded temperature data were considered to generate temperature curves of the inlet and outlet under the three working conditions with time, as shown in Figure 5.
With increasing time, the water temperature at the inlet and outlet of the buried pipe also increased. This occurred because with increasing time, the soil continuously absorbed heat and thus, heat transfer between the soil and the buried pipe gradually decreased. When heat diffusion in the soil reached a stable value with heat transfer between the buried pipe and the soil, the water temperature at the outlet of the buried pipe also reached a stable value. When Conditions A, B and C reached a stable state, the temperature difference between the inlet and outlet was 4.2 °C, 3.0 °C and 1.3 °C, respectively. With increasing heat load, the temperature difference between the inlet and outlet in the steady state increased.
Average temperature and logarithmic time curves of the inlet and outlet under the three working conditions were fitted. According to the slope and intercept of the fitting straight line, the average thermal conductivity of the rock and soil mass within the drilling range under the three working conditions A, B and C was calculated, at 1.864 W/m∙K, 1.859 W/m∙K and 1.826 W/m∙K, respectively. If working condition B was chosen as a reference, the heat load under working condition A increased by 50% and the thermal conductivity increased by 0.27%, while the heat load under working condition C decreased by 50% and the thermal conductivity decreased by 2.08%, with the error remaining within 5%. The heat load slightly influenced the test results of thermal conductivity test results.

3.3. Influence of the Test Time

The Chinese GCHPs technical specification [28] mentions that in a test using the heat load, a certain temperature difference should be maintained between the heat exchange fluid and the rock soil. After the outlet temperature of the buried pipe heat exchanger has stabilized, the temperature should be more than 5 °C higher than the initial average temperature of the rock soil, which is judgment condition I. The stability of the outlet temperature of the buried pipe heat exchanger suggests that the temperature fluctuation is less than 1 °C within no less than 12 h, which is judgment condition II.

3.3.1. Change in the Outlet Temperature of the Heat Exchanger

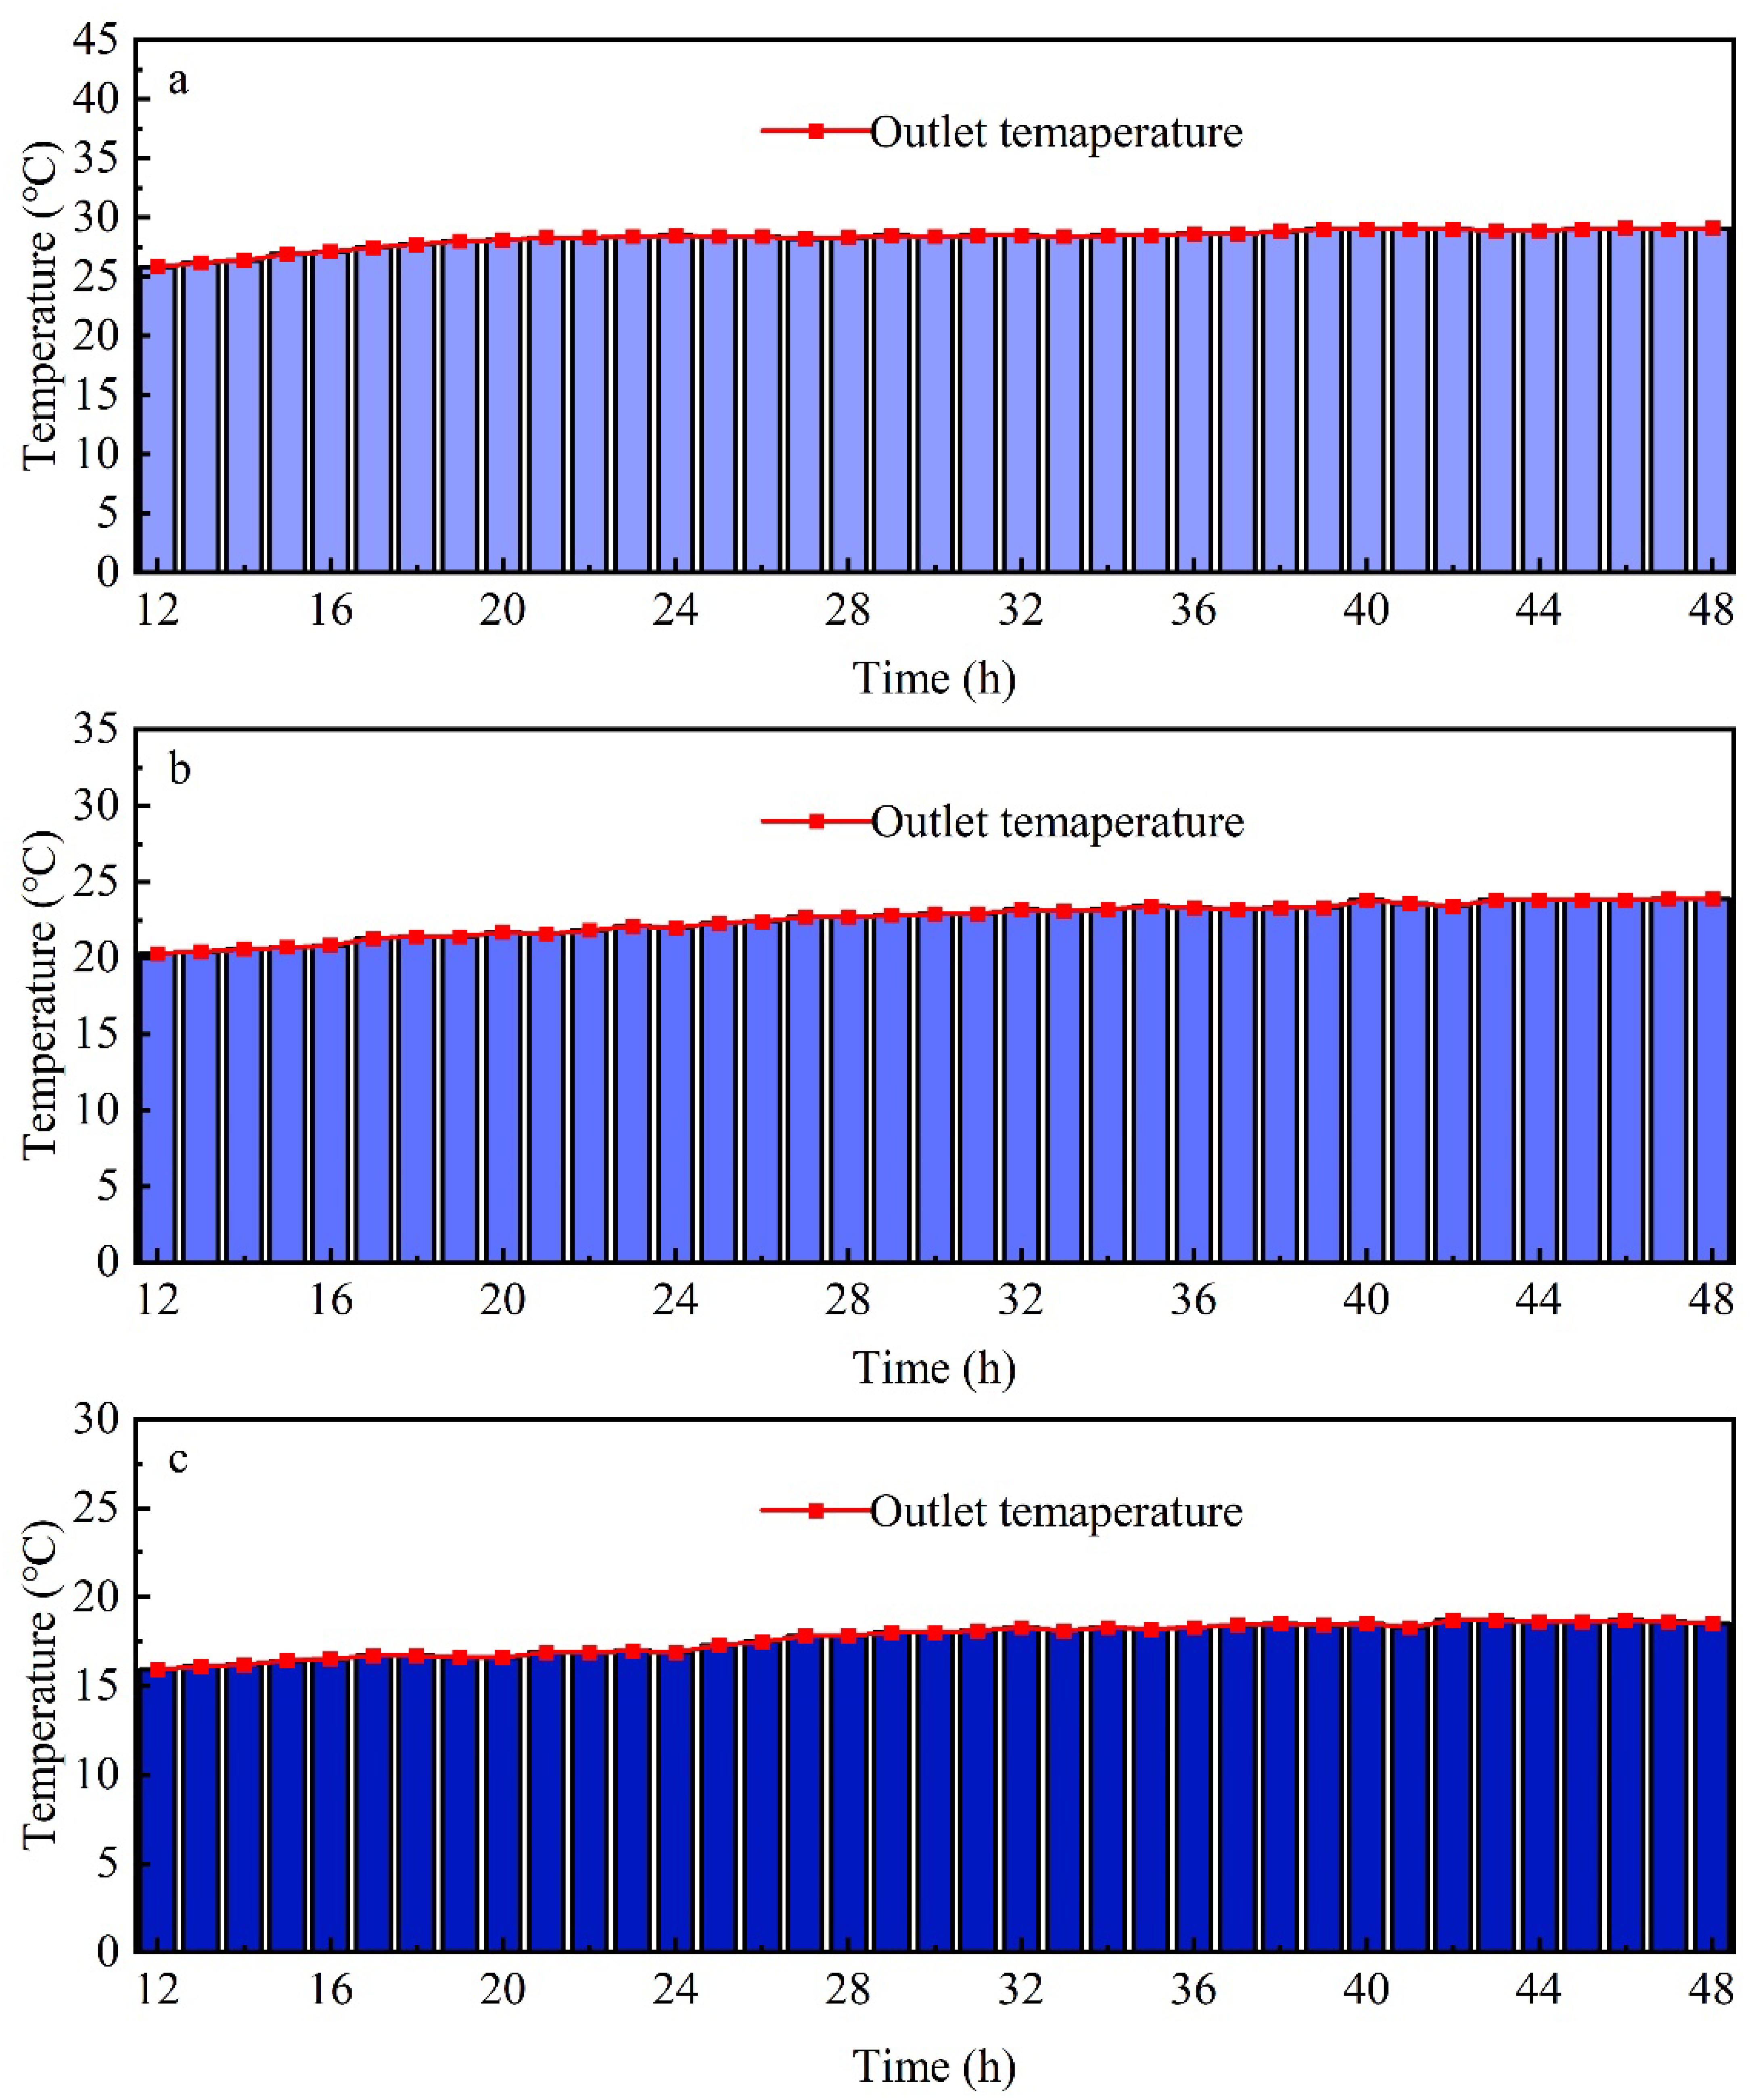
Figure 5 shows that the temperature under the three working conditions significantly increased from 0 to 12 h at the initial stage, and the outlet temperature did not reach the quasi-steady state. The temperature rise range and rate of temperature rise under working condition A were higher than those under working condition B, and the temperature rise rate under working condition B was higher than that under working condition C. To explore the time to reach the quasi-steady state, the changes in the outlet temperature of the heat exchanger within the range of 12 to 48 h under the three working conditions are shown in Figure 6. The outlet temperatures under the three working conditions were 29.1 °C, 23.9 °C and 18.5 °C when the test lasted up to 48 h, which are higher than the initial formation temperature by more than 5 °C, meeting Condition I. When testing for 12 h, the outlet temperatures under working conditions A, B and C were 25.8 °C, 20.3 °C and 15.9 °C, respectively, and 88.6%, 84.9% and 84.1%, respectively, of the quasi-steady state temperature increase range was achieved. Considering that the temperature fluctuation at the outlet of the heat exchanger was less than 1 °C for 12 consecutive hours, Conditions A, B and C met Condition II from 17 to 29 h, 25 to 37 h and 28 to 40 h, respectively, to achieve a quasi-steady state. The time for Condition A to reach the quasi-steady state was shorter than that for Condition B, and that for Condition B was shorter than that for Condition C. The heat load increased, and the temperature rose faster, which helped to reach the quasi-steady state faster.

3.3.2. Formation Temperature Change

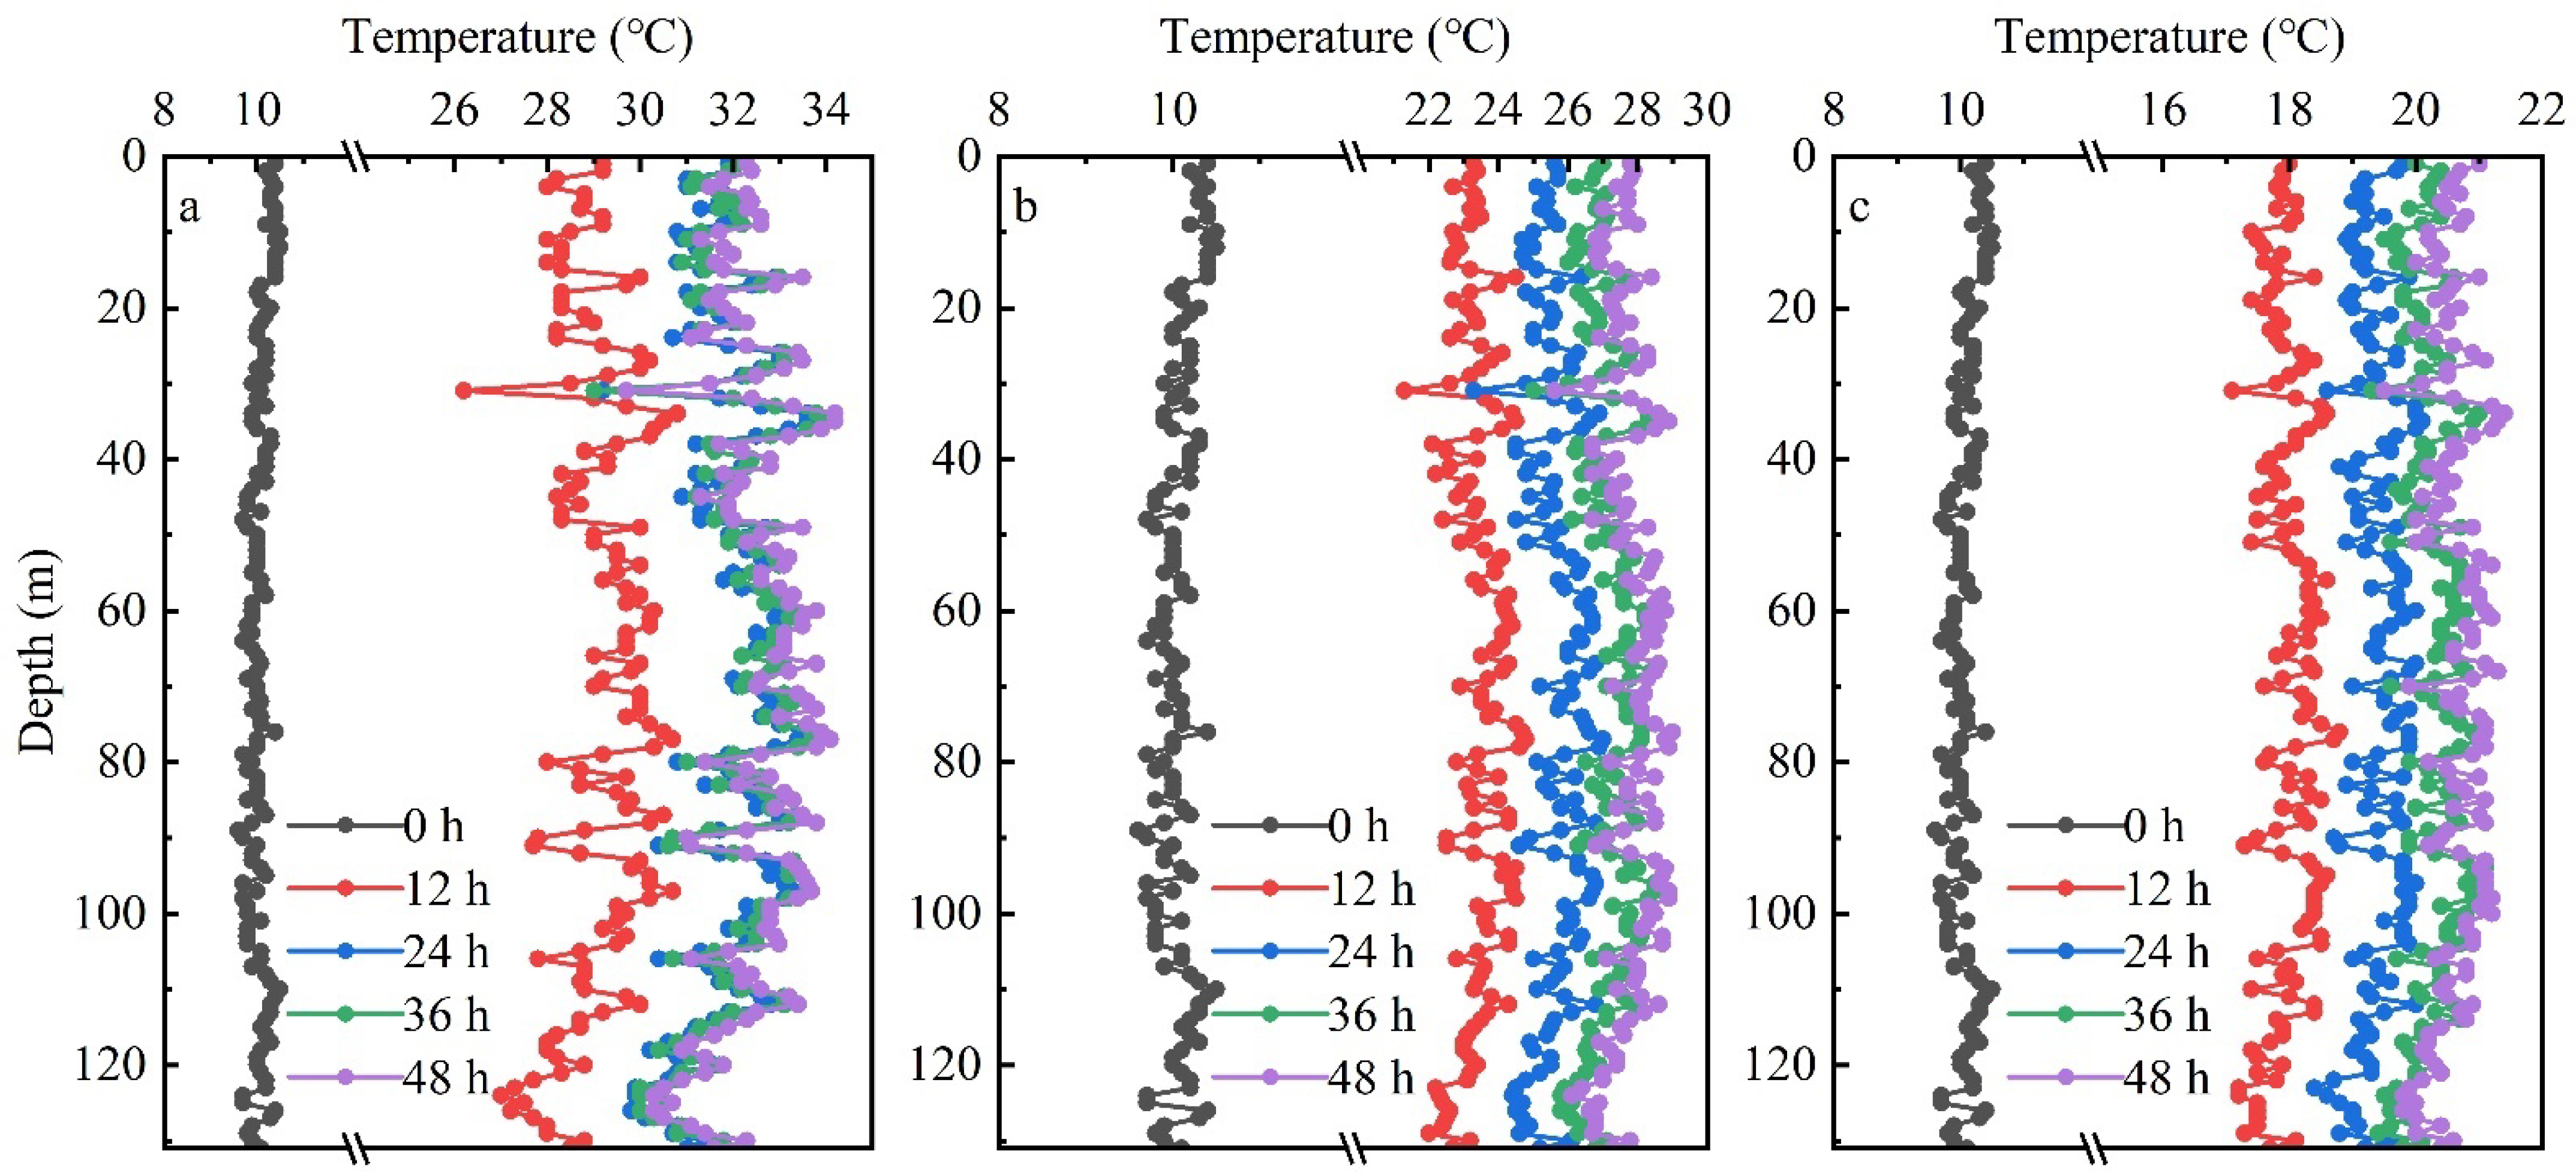
When the inlet and outlet temperatures reached the quasi-steady state, the temperature data at the different depths recorded by the DTRT module were analyzed to observe the temperature changes in the actual formation at different times, as shown in Figure 7. At 0 h, the initial ground temperature applies, the temperature curve is smooth and approximates a straight line, and the temperature at each depth is basically the same. In contrast, the temperature changes at the different depths of the borehole in the heating process were different, which shows that the thermal conductivity of the rock stratum and soil is unevenly distributed among the different strata. The higher the thermal conductivity of the formation is, the faster the heat dissipation process, resulting in a relatively low temperature of the formation with high thermal conductivity, forming a fluctuating temperature curve. The temperature at the same depth under the different working conditions differed, but the changing trend of the temperature over time was the same, forming a temperature curve with a similar shape. Observing the interval of 12 h, the temperature rise at each point in the formation during the testing period under the three working conditions A (Figure 7a), B (Figure 7b) and C (Figure 7c) was large from 0 to 12 h and small from 12 to 24 h, 24 to 36 h and 36 to 48 h, respectively, which is the same as the outlet temperature change trend recorded by the TRT module. After 12 h, the rate of temperature rise declined. At 36 h and 48 h, the temperature curves at the various depths of the formation were nearly coincident, which indicates that the temperature change amplitude at these two time nodes was very small. Among them, the temperature change range under Condition A was very small 24 h later; under Condition B it was very limited 36 h later, and under Condition C it was very narrow 36 h later. Although the temperature change amplitude at each depth of the formation was different, the temperature change speed and temperature change trend were the same as those of the inlet and outlet temperatures. The temperature greatly increased from 0 to 12 h and the growth rate declined after 12 h, and the increase in the heat load accelerated the temperature change and shortened the time to reach the quasi-steady state.

3.3.3. Thermal Conductivity under the Different Test Times

Considering the time when the quasi-steady state was reached during the test, the thermal conductivity corresponding to this time under the times of 24, 30, 36, 42, and 48 h was calculated at 6 h intervals, and the results are listed in Table 3. The calculated soil thermal conductivity varied with the test time, as shown in Figure 8. The thermal conductivity fluctuated with increasing test time at intervals of 6 h, but the fluctuation was relatively limited. When the heat load under working condition A was 12 kW, the thermal conductivity ranged from 1.846 to 1.871 W/m∙K with increasing test time. When the heat load was 8 kW under working condition B, the thermal conductivity ranged from 1.791 to 1.826 W/m∙K with increasing test time. When the heat load was 4 kW under working condition C, the thermal conductivity ranged from 1.791 to 1.826 W/m∙K with increasing test time. It could be inferred from the analysis that if the test time is long enough, the fluctuation in the soil’s thermal conductivity decreases, and eventually converges to a certain fixed value. The thermal response experiment for measuring thermal conductivity requires a stable process under a certain time. According to Figure 8, when the heat load was 12 kW, 8 kW and 4 kW at time intervals of 24 h, the test results of the thermal conductivity decreased by 0.97%, 3.06% and 1.92%, respectively, from the levels at 48 h intervals. Compared to the test times of 36 h and 48 h, the test results of the thermal conductivity decreased by 0.64%, 0.91% and 1.92%, respectively, and the relative errors were small. The test time after reaching the quasi-steady state exerted little impact on the test results of the thermal conductivity.

3.4. Formation Temperature Recovery Characteristics

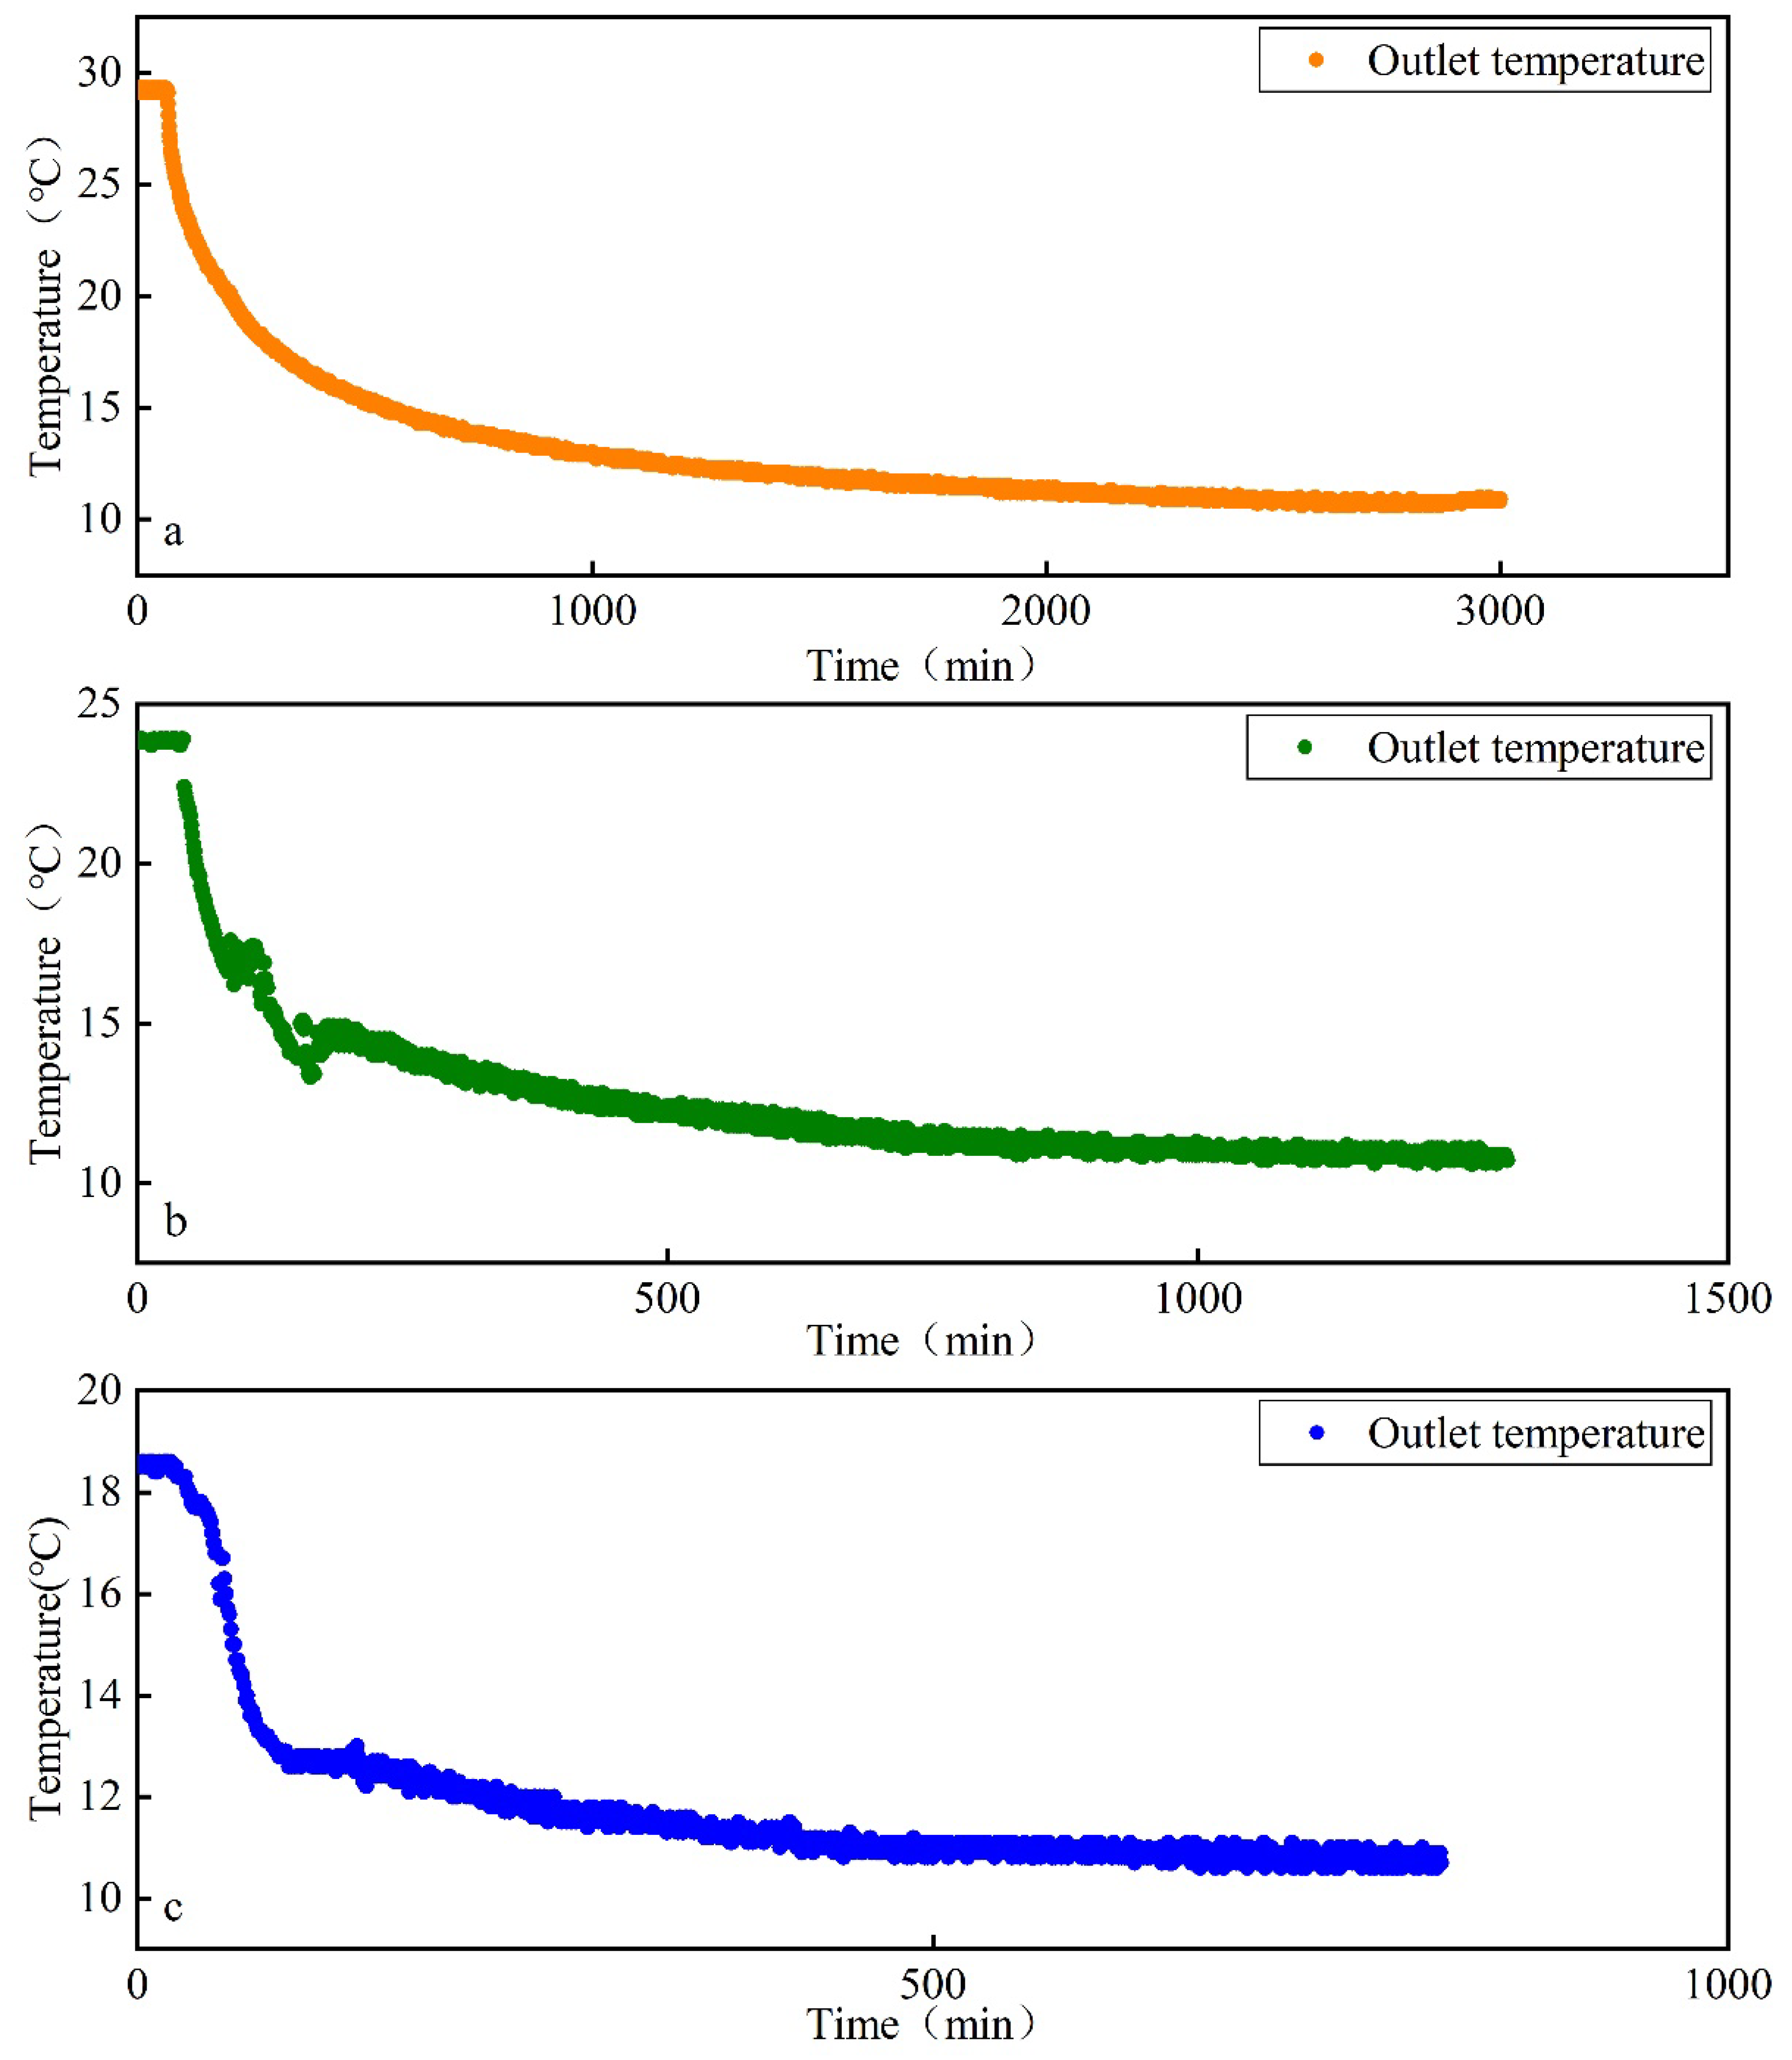
When the thermal response unit is running, the heat delivered to the soil under the different heat loads varies, and the final temperature of the stratum is also different. To study the formation temperature recovery, the TRT module recorded the change in the inlet and outlet temperatures under restoration conditions R1, R2 and R3, as shown in Figure 9. It should be noted that after 1.5 h and 2.7 h, heating was stopped under working condition R2, and the inlet and outlet interfaces were inspected twice to prevent water leakage. The heating was stopped after 1.7 h under working condition R3, and the TRT measurement module was moved for a safety inspection. The safety inspection led to a temporary abnormal rise in the measured temperature at these three time points, but this did not affect the thermal recovery of the entire formation. It could be found that with increasing recovery time, the outlet temperature gradually approached the initial temperature. During the first 12 h of the recovery period, the outlet temperature dropped rapidly. The outlet temperature dropped to 10.5 °C at 35 h, 16 h and 11 h under Conditions R1 (Figure 9a), R2 (Figure 9b) and R3 (Figure 9c), respectively, and it remained stable until the next heating period. The ground temperature could only be restored to 10.5 °C instead of the initial temperature of 10 °C in still water. The reason is that once the water in the U-Tube starts to circulate, even without heating or cooling, heat exchange between the upper and lower parts cannot be prevented. The water flow velocity in the tube in this experiment was 0.68 m/s, and the water in the tube was turbulent, so the water friction in the tube caused a temperature rise.
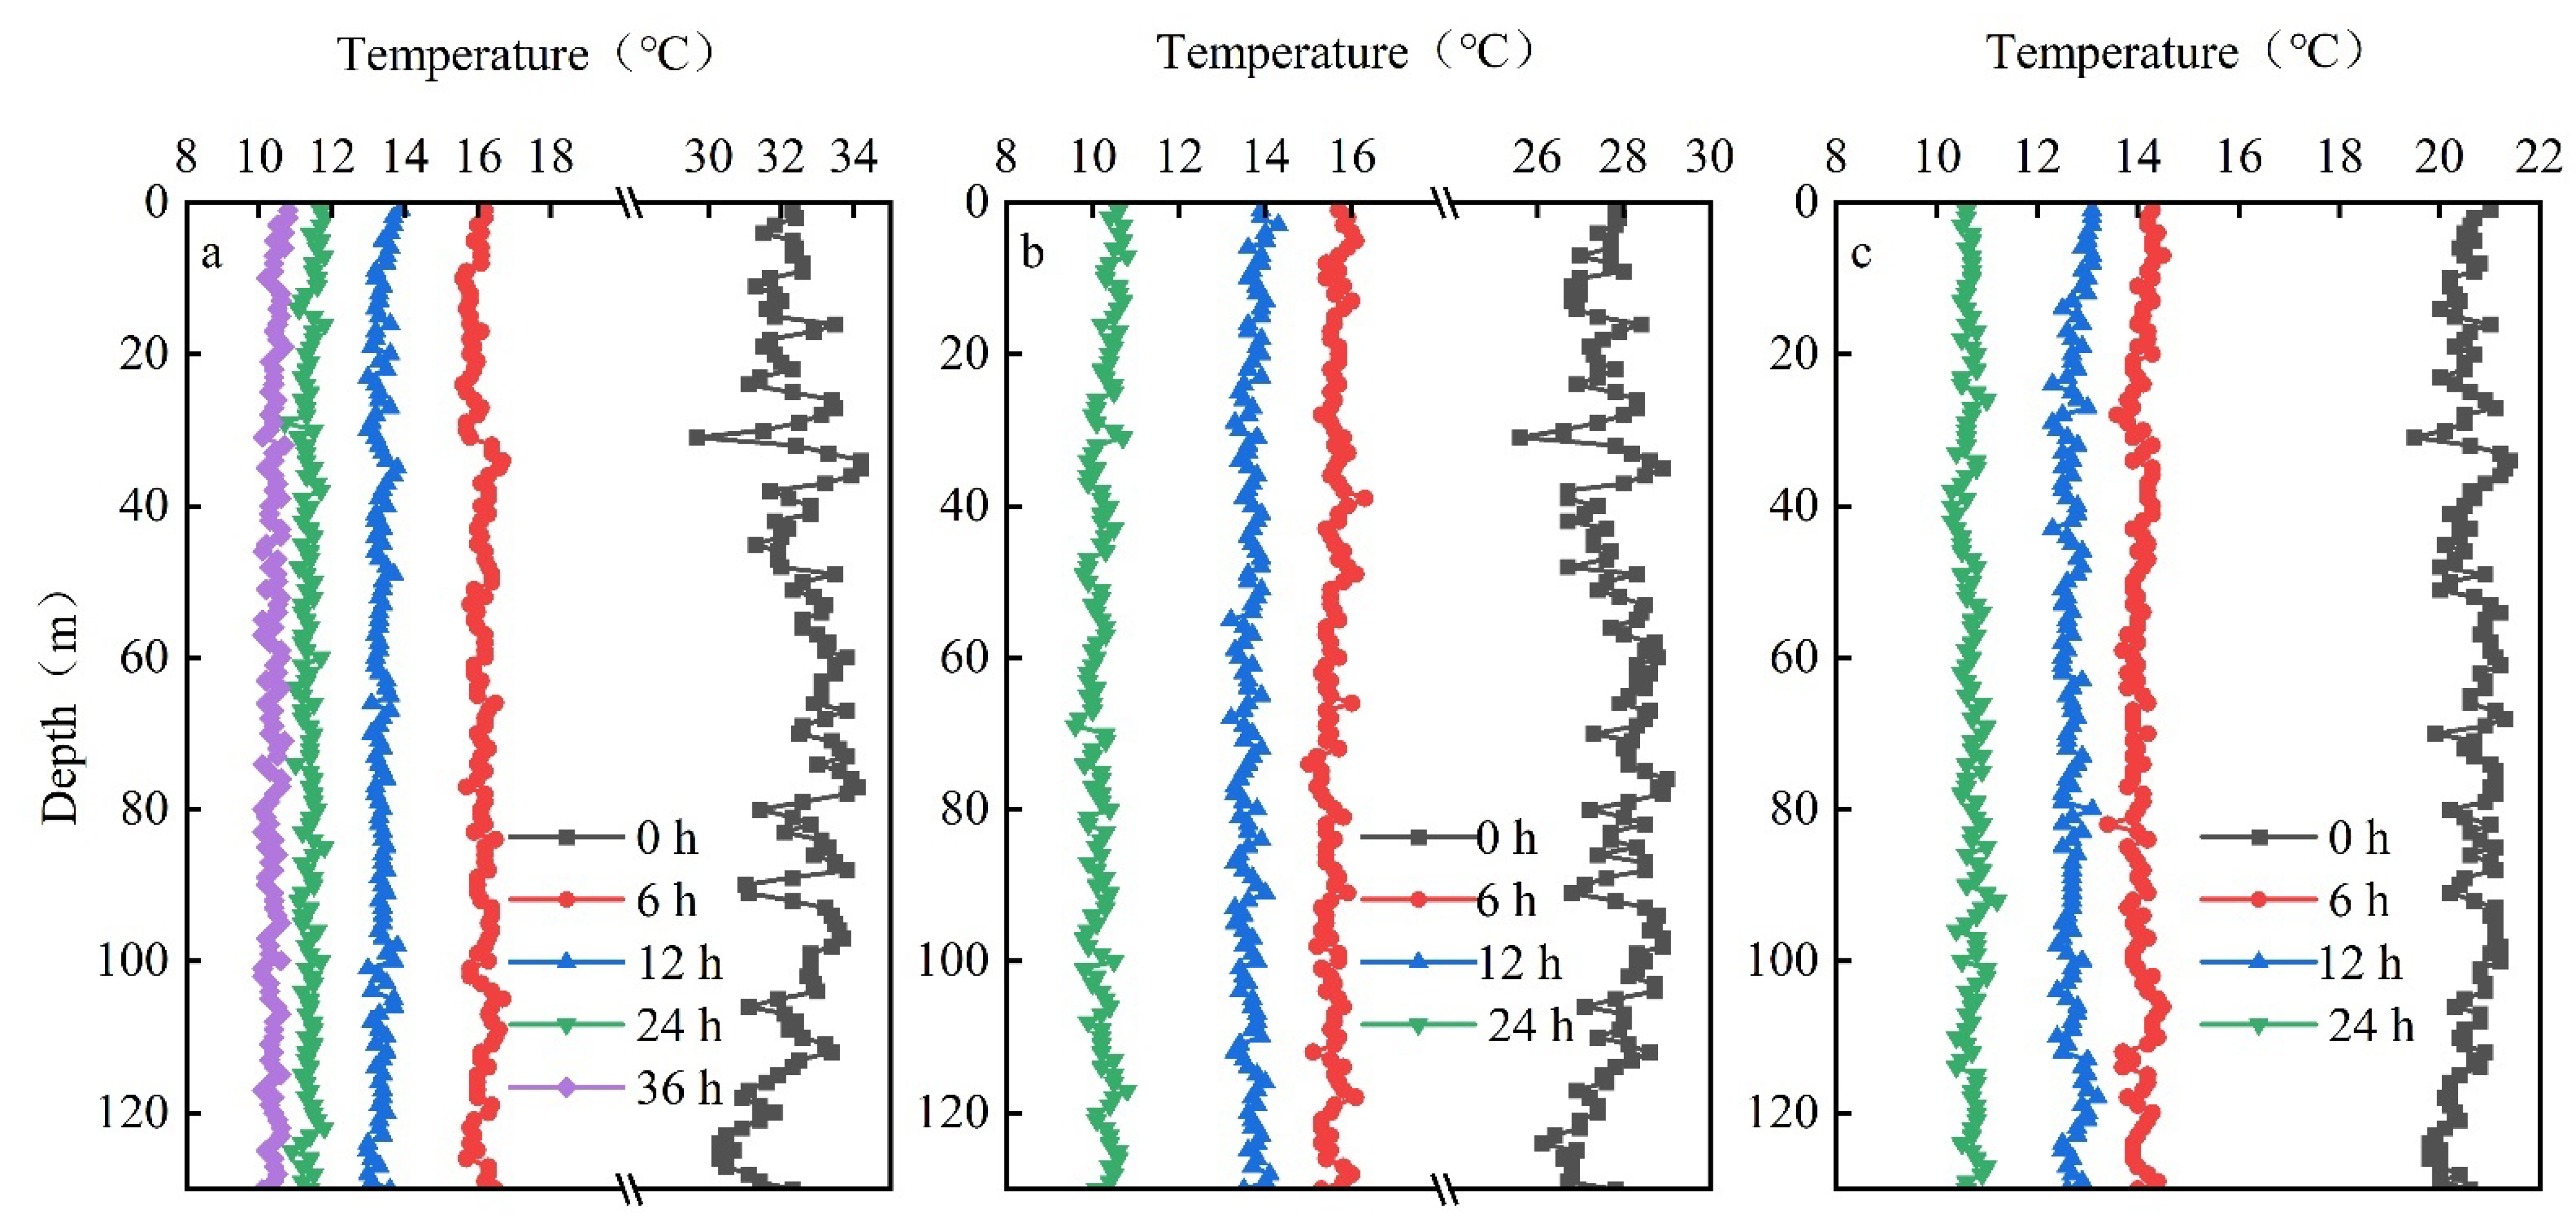
To explore the change in the temperature at the different depths in the stratum, we selected the time node corresponding to the outlet temperature and analyzed the temperature change at the different depths of the stratum over time, as shown in Figure 10. With the increase in recovery time, the soil temperature gradually approached the initial soil temperature, and the temperature change trend was the same at the different recovery time nodes, showing a nearly parallel downward trend. During the first 12 h of the recovery period, the formation temperature decreased rapidly, and the recovery range of the formation temperature was the largest. With increasing time, the speed of soil temperature recovery decreased, and finally, the temperature at each depth in the formation recovered to approximately 10.5 °C. Because the temperature in the formation was different under the different test conditions, the time needed to restore the initial temperature was also different. As shown in Figure 10, the initial temperature was restored at 36 h, 24 h and 24 h under restoration conditions R1, R2 and R3, respectively.
Combining the time to reach the quasi-steady state under Conditions A, B and C; the thermal conductivity test results at the different time nodes; the formation temperature recovery time under restoration conditions R1, R2, and R3 and considering the test accuracy and test cost, it is recommended to select a relatively high heat load of approximately 8 kW to shorten the time to reach the quasi-steady state; 36 h should be selected as both the test time and the time to recover the ground temperature, which can shorten the test time and reduce the test cost.

4. Conclusions

In this study, in-situ thermal response tests were performed involving a U-Tube with a depth of 130 m, and different test conditions were designed. The effects of the heat load and test time on the thermal conductivity were analyzed and described. Based on the temperature sensor probe and distributed optical fiber temperature sensor adopted, the initial formation temperature field was determined, and the temperature change trend of the formation during heating and heat recovery was studied. The specific conclusions are as follows:
  • The bottom hole temperature (130 m) measured by the distributed optical fiber temperature sensor is 11.4 °C. The underground constant-temperature zone is located at depths from 25 to 50 m, the temperature-increasing zone is located at depths from 50 to 130 m, and the geothermal gradient is 3 °C/100 m.
  • With increasing heat load, the temperature difference between the inlet and outlet increases when reaching the quasi-stable state. The heat load imposes a slight effect on the thermal conductivity test results.
  • During the heating test phase, the changing trend of the temperature in the formation is consistent with that of the outlet temperature, and it takes 36 h for the test to reach a quasi-stable state. The temperature rise at the initial stage of the test is obvious from 0 to 12 h. The temperature rise value from 0 to 12 h reaches 80% of the temperature rise range in the quasi-stable state. The heat load increases and the temperature rises faster, which helps to reach the quasi-stable state faster.
  • Once the quasi-stable condition is reached, there are slight differences between the thermal conductivity test results obtained at the various test times, and the test time imposes a slight influence on the thermal conductivity test results.
  • The temperature in the formation is different after test completion under the different test conditions, and the time needed to restore the initial temperature also varies. At the heat recovery stage, the changing trend of the temperature in the formation is consistent with that of the outlet temperature. A reduction in the heat load can shorten the time for the formation to recover the initial temperature. From the perspective of economic benefits and test accuracy, it is recommended to select a relatively high heat load of 8 kW and select 36 h as both the test duration and ground temperature recovery duration.

Author Contributions

Conceptualization, Y.M.; Data curation, Y.M.; Formal analysis, Y.C. and Y.Z. (Yu Zhang); Investigation, Y.Z. (Yanjun Zhang); Methodology, Y.M.; Project administration, Y.Z. (Yanjun Zhang); Resources, Y.Z. (Yanjun Zhang); Software, X.G. and X.Z.; Validation, H.D.; Writing—original draft, Y.M.; Writing—review and editing, Y.M. All authors have read and agreed to the published version of the manuscript.

Funding

This research has been funded by the National Key Research and Development Program of China (NO. 2019YFC0604905), China Postdoctoral Science Foundation (Grant No. 2022M711291), and the Engineering Research Center of Geothermal Resources Development Technology and Equipment, Ministry of Education, Jilin University.

Conflicts of Interest

No conflict of interest exits in the submission of this manuscript, and manuscript is approved by all authors for publication. I would like to declare on behalf of my co-authors that the work described was original research that has not been published previously, and not under consideration for publication elsewhere, in whole or in part. All the authors listed have approved the manuscript that is enclosed.

References

  1. Chien, F.; Hsu, C.-C.; Ozturk, I.; Sharif, A.; Sadiq, M. The role of renewable energy and urbanization towards greenhouse gas emission in top Asian countries: Evidence from advance panel estimations. Renew. Energy 2022, 186, 207–216. [Google Scholar] [CrossRef]
  2. Sovacool, B.K. Contestation, contingency, and justice in the Nordic low-carbon energy transition. Energy Policy 2017, 102, 569–582. [Google Scholar] [CrossRef]
  3. Vakulchuk, R.; Overland, I.; Scholten, D. Renewable energy and geopolitics: A review. Renew. Sustain. Energy Rev. 2020, 122, 109547. [Google Scholar] [CrossRef]
  4. Li, K.; Liu, C.; Jiang, S.; Chen, Y. Review on hybrid geothermal and solar power systems. J. Clean. Prod. 2020, 250, 119481. [Google Scholar] [CrossRef]
  5. Lund, J.W.; Toth, A.N. Direct utilization of geothermal energy 2020 worldwide review. Geothermics 2021, 90, 101915. [Google Scholar] [CrossRef]
  6. Huang, Y.; Zhang, Y.; Hu, Z.; Lei, H.; Wang, C.; Ma, J. Economic analysis of heating for an enhanced geothermal system based on a simplified model in Yitong Basin, China. Energy Sci. Eng. 2019, 7, 2658–2674. [Google Scholar] [CrossRef] [Green Version]
  7. Zhao, X.-G.; Wan, G. Current situation and prospect of China׳s geothermal resources. Renew. Sustain. Energy Rev. 2014, 32, 651–661. [Google Scholar] [CrossRef]
  8. Mott, A.; Baba, A.; Hadi Mosleh, M.; Ökten, H.E.; Babaei, M.; Gören, A.Y.; Feng, C.; Recepoğlu, Y.K.; Uzelli, T.; Uytun, H.; et al. Boron in geothermal energy: Sources, environmental impacts, and management in geothermal fluid. Renew. Sustain. Energy Rev. 2022, 167, 112825. [Google Scholar] [CrossRef]
  9. Galgaro, A.; Dalla Santa, G.; Zarrella, A. First Italian TRT database and significance of the geological setting evaluation in borehole heat exchanger sizing. Geothermics 2021, 94, 102098. [Google Scholar] [CrossRef]
  10. Hakala, P.; Vallin, S.; Arola, T.; Martinkauppi, I. Novel use of the enhanced thermal response test in crystalline bedrock. Renew. Energy 2022, 182, 467–482. [Google Scholar] [CrossRef]
  11. Zhang, C.; Lu, J.; Wang, X.; Xu, H.; Sun, S. Effect of geological stratification on estimated accuracy of ground thermal parameters in thermal response test. Renew. Energy 2022, 186, 585–595. [Google Scholar] [CrossRef]
  12. Mogensen, P. Fluid to duct wall heat transfer in duct system heat storages. In International Conference on Subsurface Heat Storage in Theory and Practice; Swedish Council for Building Research: Stockholm, Sweden, 1983. [Google Scholar]
  13. Lamarche, L.; Kajl, S.; Beauchamp, B. A review of methods to evaluate borehole thermal resistances in geothermal heat-pump systems. Geothermics 2010, 39, 187–200. [Google Scholar] [CrossRef]
  14. Wilke, S.; Menberg, K.; Steger, H.; Blum, P. Advanced thermal response tests: A review. Renew. Sustain. Energy Rev. 2020, 119, 109575. [Google Scholar] [CrossRef]
  15. Badenes, B.; Mateo Pla, M.Á.; Magraner, T.; Soriano, J.; Urchueguía, J.F. Theoretical and Experimental Cost–Benefit Assessment of Borehole Heat Exchangers (BHEs) According to Working Fluid Flow Rate. Energies 2020, 13, 4925. [Google Scholar] [CrossRef]
  16. Franco, A.; Conti, P. Clearing a Path for Ground Heat Exchange Systems: A Review on Thermal Response Test (TRT) Methods and a Geotechnical Routine Test for Estimating Soil Thermal Properties. Energies 2020, 13, 2965. [Google Scholar] [CrossRef]
  17. Lhendup, T.; Aye, L.; Fuller, R.J. In-situ measurement of borehole thermal properties in Melbourne. Appl. Therm. Eng. 2014, 73, 287–295. [Google Scholar] [CrossRef]
  18. ASHRAE Handbook-HVAC Applications; ASHRAE: Atlanta, GA, USA, 2015; Chapter 34.
  19. Morchio, S.; Fossa, M.; Beier, R.A. Study on the best heat transfer rate in thermal response test experiments with coaxial and U-pipe borehole heat exchangers. Applied Thermal Engineering 2022, 200. [Google Scholar] [CrossRef]
  20. Zhang, Y.; Hao, S.; Yu, Z.; Fang, J.; Zhang, J.; Yu, X. Comparison of test methods for shallow layered rock thermal conductivity between in situ distributed thermal response tests and laboratory test based on drilling in northeast China. Energy Build. 2018, 173, 634–648. [Google Scholar] [CrossRef]
  21. Urchueguía, J.; Lemus-Zúñiga, L.-G.; Oliver-Villanueva, J.-V.; Badenes, B.; Pla, M.; Cuevas, J. How Reliable Are Standard Thermal Response Tests? An Assessment Based on Long-Term Thermal Response Tests Under Different Operational Conditions. Energies 2018, 11, 3347. [Google Scholar] [CrossRef] [Green Version]
  22. Badenes, B.; Mateo Pla, M.; Lemus-Zúñiga, L.; Sáiz Mauleón, B.; Urchueguía, J. On the Influence of Operational and Control Parameters in Thermal Response Testing of Borehole Heat Exchangers. Energies 2017, 10, 1328. [Google Scholar] [CrossRef]
  23. Wang, F.-H.; Feng, C.-C.; Yan, L.; Wang, X.-K. Numerical and experimental evaluation on methods for parameter identification of thermal response tests. J. Cent. South Univ. 2012, 19, 816–823. [Google Scholar] [CrossRef]
  24. Yu, X.; Zhang, Y.; Deng, N.; Wang, J.; Zhang, D.; Wang, J. Thermal response test and numerical analysis based on two models for ground-source heat pump system. Energy Build. 2013, 66, 657–666. [Google Scholar] [CrossRef]
  25. Zhou, Y.; Zhao, L.; Wang, S. Determination and analysis of parameters for an in-situ thermal response test. Energy Build. 2017, 149, 151–159. [Google Scholar] [CrossRef]
  26. Gustafsson, A.M.; Westerlund, L. Multi-injection rate thermal response test in groundwater filled borehole heat exchanger. Renew. Energy 2010, 35, 1061–1070. [Google Scholar] [CrossRef]
  27. Choi, W.; Ooka, R. Effect of disturbance on thermal response test, part 1: Development of disturbance analytical model, parametric study, and sensitivity analysis. Renew. Energy 2016, 85, 306–318. [Google Scholar] [CrossRef]
  28. The Ministry of Housing and Urban–Rural Construction of China. Technical Code for GCHPs, 2009 ed.; GB 50366-2005; Chinese Building Industrial Press: Beijing, China, 2009. [Google Scholar]
  29. Zhang, C.; Guo, Z.; Liu, Y.; Cong, X.; Peng, D. A review on thermal response test of ground-coupled heat pump systems. Renew. Sustain. Energy Rev. 2014, 40, 851–867. [Google Scholar] [CrossRef]
  30. Choi, W.; Ooka, R. Effect of disturbance on thermal response test, part 2: Numerical study of applicability and limitation of infinite line source model for interpretation under disturbance from outdoor environment. Renew. Energy 2016, 85, 1090–1105. [Google Scholar] [CrossRef]
  31. Signorelli, S.; Bassetti, S.; Pahud, D.; Kohl, T. Numerical evaluation of thermal response tests. Geothermics 2007, 36, 141–166. [Google Scholar] [CrossRef]
  32. Bujok, P.; Grycz, D.; Klempa, M.; Kunz, A.; Porzer, M.; Pytlik, A.; Rozehnal, Z.; Vojčinák, P. Assessment of the influence of shortening the duration of TRT (thermal response test) on the precision of measured values. Energy 2014, 64, 120–129. [Google Scholar] [CrossRef] [Green Version]
  33. Nieto, I.M.; Blázquez, C.S.; Martín, A.F.; González-Aguilera, D. Analysis of the Influence of Reducing the Duration of a Thermal Response Test in a Water-Filled Geothermal Borehole Located in Spain. Energies 2020, 13, 6693. [Google Scholar] [CrossRef]
  34. Bozzoli, F.; Pagliarini, G.; Rainieri, S.; Schiavi, L. Short-time thermal response test based on a 3-D numerical model. J. Phys. Conf. Ser. 2012, 395, 012056. [Google Scholar] [CrossRef]
  35. Han, Z.; Zhang, S.; Li, B.; Ma, C.; Liu, J.; Ma, X.; Ju, X. Study on the influence of the identification model on the accuracy of the thermal response test. Geothermics 2018, 72, 316–322. [Google Scholar] [CrossRef]
  36. Han, Z.; Li, B.; Ma, C.; Hu, H.; Bai, C. Study on accurate identification of soil thermal properties under different experimental parameters. Energy Build. 2018, 164, 21–32. [Google Scholar] [CrossRef]
  37. ASHRAE. ASHRAE Handbook: HVAC Applications; ASHRAE: Atlanta, GA, USA, 2011. [Google Scholar]
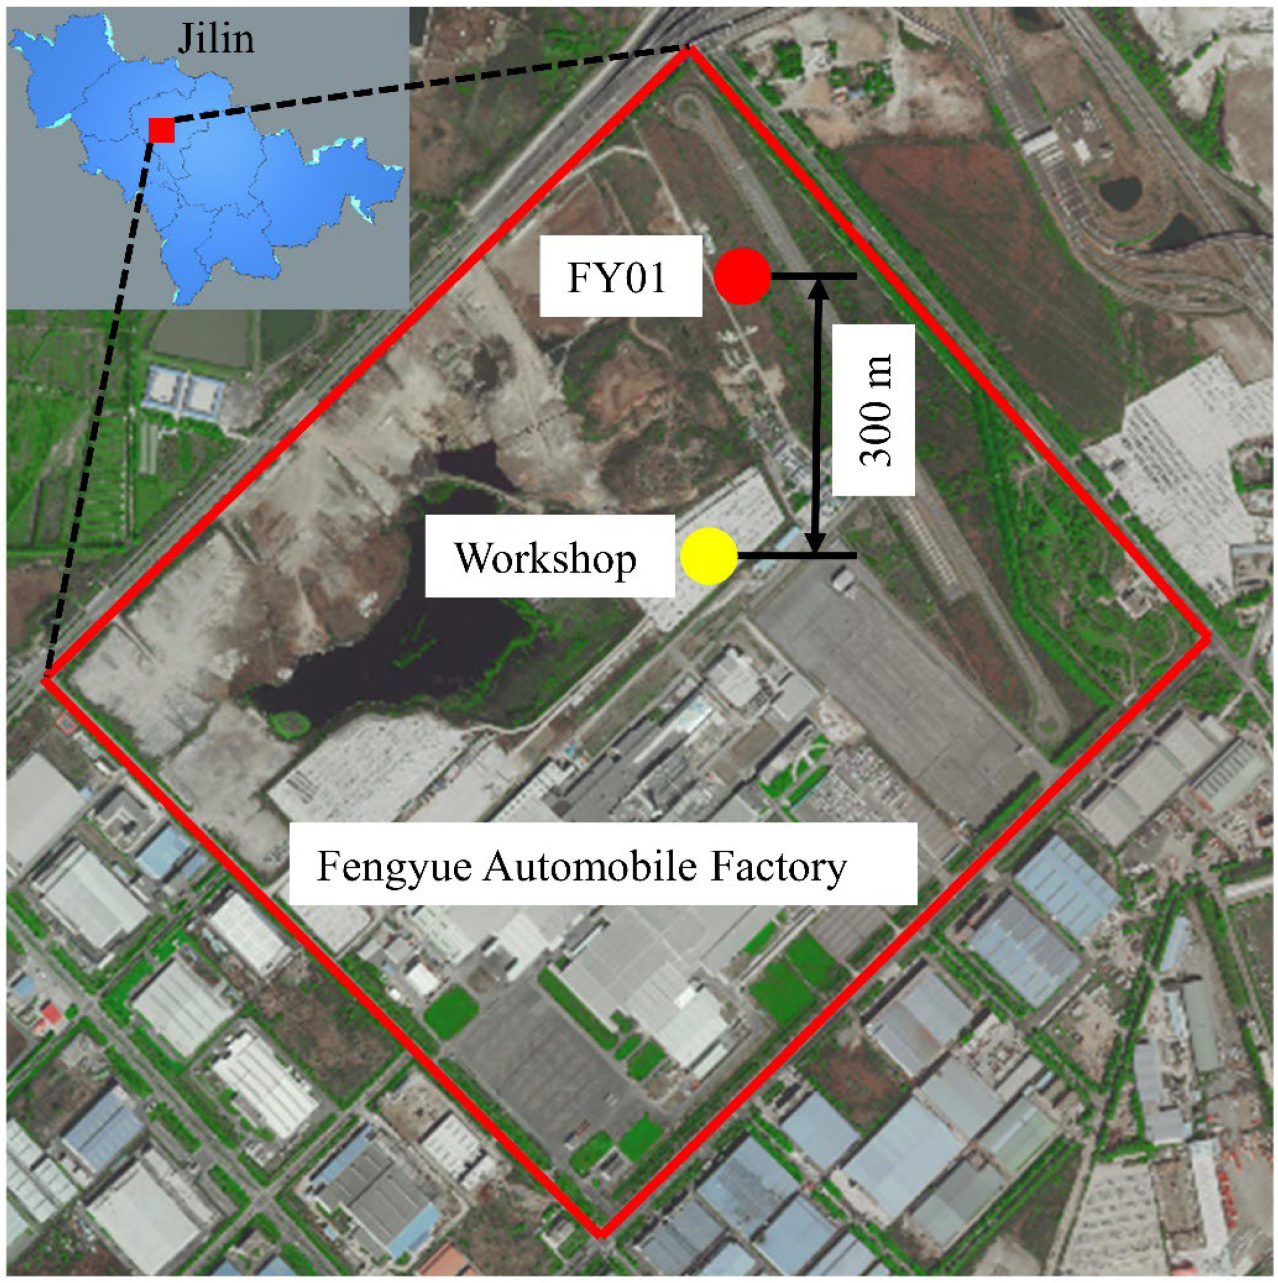
Figure 1. Regional and specific locations of the borehole and heating target.
Energies 15 08759 g001
Figure 2. Schematic diagram of the combined thermal response test system.
Energies 15 08759 g002
Figure 3. Field thermal response test system. (a) TRT module. (b) DTRT module.
Energies 15 08759 g003
Figure 4. Undisturbed formation temperature. (a) Temperature distribution with the depth. (b) Stable inlet and outlet temperatures after water circulation initiation.
Energies 15 08759 g004
Figure 5. Inlet and outlet time temperature curves. (a) Condition A. (b) Condition B. (c) Condition C.
Energies 15 08759 g005
Figure 6. Change in the outlet temperature of the heat exchanger. (a) Condition A. (b) Condition B. (c) Condition C.
Energies 15 08759 g006
Figure 7. Temperature change at each depth of the formation. (a) Condition A. (b) Condition B. (c) Condition C.
Energies 15 08759 g007
Figure 8. Thermal conductivity at the different time nodes. (a) Condition A. (b) Condition B. (c) Condition C.
Energies 15 08759 g008
Figure 9. Outlet temperature after stopping heating. (a) Condition R1. (b) Condition R2. (c) Condition R3.
Energies 15 08759 g009
Figure 10. Formation temperature after stopping heating. (a) Condition R1. (b) Condition R2. (c) Condition R3.
Energies 15 08759 g010
Table 1. Borehole and U-Tube parameters.
ItemParameterFY01 U-Tube
BoreholeVertical depth (m)130
Backfill materialFine sand and bentonite
Wellhead diameter (mm)150
PE pipeExternal diameter (mm)32
Internal diameter (mm)26
Table 2. Information on the test conditions.
Working ConditionDuration (h)Heat Load (kW)
Initial ground temperature960
A4812
R1720
B488
R2720
C484
R3720
Table 3. Thermal conductivity under the different test times.
ConditionTest Time (h)2430364248
AThermal conductivity
(W/m∙K)
1.8461.8561.8521.8711.864
B1.7941.7961.8031.8281.859
C1.7911.7941.7911.8021.826
Publisher’s Note: MDPI stays neutral with regard to jurisdictional claims in published maps and institutional affiliations.