Article

Impact of Climate Change and Technological Innovation on the Energy Performance and Built form of Future Cities

1
EMIB Research Group, Faculty of Applied Engineering, University of Antwerp, 2020 Antwerp, Belgium
2
School of Engineering, University of Lincoln, Lincoln LN6 7TS, UK
3
School of Architecture and the Built Environment, University of Lincoln, Lincoln LN6 7TS, UK
*
Author to whom correspondence should be addressed.
Behzad Sodagar is retired now.
Energies 2022, 15(22), 8592; https://doi.org/10.3390/en15228592
Submission received: 5 October 2022 / Revised: 3 November 2022 / Accepted: 11 November 2022 / Published: 16 November 2022
(This article belongs to the Section B1: Energy and Climate Change)

Abstract

:
The building and transportation sectors are responsible for the greatest proportion of energy consumption in cities. While they are intrinsically interlinked with urban built form and density, climate change and technological innovation are having an effect on their relative contributions. This paper aims to develop an optimisation framework to facilitate the identification of the most energy-efficient urban built forms and urban geometry for the future built environment that can be adapted to the changing climate and ongoing technological development. It examines future scenarios for the city of London as a temperate climate zone (as a case study), in 2050, and contrasts it with the present situation. Specifically, the impact of climate change along with the penetration of electric vehicles into the transportation system that can be charged via rooftop photovoltaics is investigated. This study initially develops the geometrical models of four selected urban built forms and, secondly, analyzes their energy performance using an urban energy simulation software. The results, showing the impact of future scenarios on building energy performance, urban built form and density, demonstrate that court and tunnel-court built forms show better energy performance for future development. It is therefore recommended that for future urban developments in London, deep plan court and tunnel-court buildings with a lower number of storeys and a large cut-off angle are more advantageous in terms of building energy to accommodate the expected climate change. Finally, results of simulation trials indicate that the total building energy demand in 2050 is considerably higher than in the present climate as a result of additional cooling load and electric vehicle charging load.

1. Introduction

The average temperature of the earth has been increasing since the mid-20th century due to greenhouse gas emissions into the atmosphere. This anthropogenic climate change has been caused by human activities, particularly the burning of fossil fuels. Cities are recognised as among the main contributors to this phenomenon by producing high amounts of carbon emissions from the building [1,2] and transportation sectors [3]. This obliges humans to urgently take serious action, and an important aspect of this is the planning of future cities. Although climate change is a result of energy consumption on earth, specifically in cities, the fact that it has a reciprocal impact on the energy performance of cities should not be neglected. For instance, unpredictable and severe weather events will cause excessive heating/cooling demands in buildings [4,5], which together with changes in mean weather patterns have both direct and indirect impact on the performance of energy systems [6]. Therefore, adaptation and mitigation strategies to tackle climate change must be taken into consideration [7,8] to design resilient urban areas. Sustainable energy use in urban areas is feasible through the integration of improved building energy performance, urban geometry [9] and climate change at the planning and design stages [10]. Although there are many studies on the impact of climate change on building energy performance [11,12,13], there is a lack of thorough investigations on the impact of climate change on the relationship of building energy performance with urban built form and density. This consideration is important because identifying the most energy-efficient urban built forms and optimum densities helps cities to adapt to climate change.
A further factor that can influence the optimal form and shape of future cities is technological development, such as renewable energy technologies, electric vehicles (EVs) and blockchain (a technology that facilitates digital transactions between generators and consumers of energy in a decentralised energy generation system). Studies on transportation energy consumption have traditionally focused on internal combustion engine vehicles (ICEVs) and many researchers conclude that denser urban areas reduce transportation energy consumption [14,15]. The first justification for the increase in transportation energy consumption in the case of urban sprawl [16] is that people should commute longer distances in a sprawling neighbourhood. However, EVs and Plug-in Hybrid Electric Vehicles (PHEVs), which are significantly more energy efficient, are replacing ICEVs. More recent research on the relationship between transport energy and urban density shows that there is the possibility of charging EVs by decentralised energy supplies such as urban roof-mounted photovoltaics (PVs) [17], with peer-to-peer or microgrids used for distributing the harvested renewable energy in cities [18]. This system promotes the ‘prosumer’ concept, where residents are both buyers and sellers [19]. The presence of decentralised energy systems can have an essential impact on building and urban design aspects, emphasising that the design of energy systems should be an integral part in the decision-making process [20]. Hence, the advent of these disruptive technologies, which are innovations that significantly alter the way that consumers and industries operate, should be contemplated when designing the new urban areas.
In this study, consideration is given to the impact of global warming and the penetration of EVs, and how they will influence decision making for future urban developments. This includes an investigation of their impact on the relationship of city energy performance with urban form, since the form of the city has an impact on its energy usage [21,22]. However, urban form has a variety of attributes such as density, compactness, diversity, green areas, connectivity, orientation, shading and passivity that influence energy utilisation [23]. In identifying the relationship between energy and urban form, the primary parameter analyzed by researchers is density [24,25,26]. There has been a debate among researchers regarding the advantages of high density or sprawl urban developments. Some studies emphasised that a compact built form with higher urban density results in less energy usage [27,28] compared to urban sprawl [14,29] while others indicate that a dispersed urban form may provide improved energy efficiency [30,31] due to the increase in utilisation of renewable sources in urban areas [32]. For instance, roof-mounted PVs and ground source heat pumps require a large area that cannot be achieved by compact buildings [33,34]. Meanwhile, the definition of density is also debated due to a variety of density indicators being used in different studies that are not equivalent, making it challenging to directly compare results across studies. Rafiee, Dias [35] used ‘numbers of housing units per building’ as the density indicator for analysing heating demand. Leng, Ma [36] adopted some density indicators (such as site coverage and floor area ratio) to illustrate the relationships of urban morphology with building heating demand. Perera, Coccolo [37] used ‘volume–area ratio’ to identify the impact of urban climate on urban energy performance. In addition to density, another urban parameter, built form, reflects the shape of buildings [38], and affects the environmental performance of buildings [39]. Therefore, it is crucial to consider the urban built form and its impact on microclimatic conditions [40] that consequently affect building energy consumption [41]. There has historically been a lack of a unified set of guidelines to communicate urban density indicators and their relationships with urban built forms [42] to investigate their simultaneous correlation with energy.
Whilst previous studies have tried to establish this relationship, most are not comprehensive enough to include urban built form, suitable density indicators and the key urban geometric parameters. Ahmadian, Sodagar [43] established this relationship by proposing an innovative urban planning tool called the Form Signature. This graphical tool simultaneously considers different urban built forms, two important density indicators and three main geometric parameters of the built environment. In a later study, they used this framework to identify the relationship of building energy performance with all the aforementioned urban parameters [44]. This paper further develops this framework by adding the impact of climate change and future transportation methods to predict the optimum urban built forms and geometries for the future. It enhances the framework to an advanced stage to be used in practice and provides a predictive nature. Previously reported models have been based on the prevalence of existing technologies and currently available energy sources. There are very few studies that consider the effect of urban built form and density on both building and transportation energy of cities simultaneously, and if so, they have considered ICEVs [25,45]. However, as disruptive technologies such as EVs are penetrating normal city life, it is argued that policy on urban form should be based on the technologies of the future rather than those of the present and past.
The city of London, representing a temperate climate, is selected as a case study, and CitySim software [46] (an urban energy simulation tool) is adopted to perform simulation trials using the predicted climatic conditions of London in 2050. The penetration of private EVs and scenarios of charging from roof-mounted PV panels is considered. The results are compared with present conditions in London to inform necessary future changes. The novelty of this paper is developing an optimisation framework able to identify the most energy-efficient urban built forms and urban geometry of future cities that can be adapted to changing climate and ongoing technological development. Although the analysis is focused on a London temperate climate, the framework can be adopted for any other climatic conditions. It determines the combined effect of climate change, technological developments and government policies on the future of cities, and relates them to urban built form and density indicators simultaneously.

2. Research Methodology

The research methodology is composed of the geometrical characterisation of different built forms along with energy modelling and simulation analysis. Initially, geometric models of four urban built forms, namely pavilion, terrace, court and tunnel-court forms (Figure 1, top), are developed using three influential geometric parameters, namely plan depth (x), number of floors (n) and the cut-off angle (θ). The cut-off angle is the angle between the ground and the line joining the base of one façade to the roofline of another façade (Figure 1, down) that represents the distance between buildings (L). These three variables are chosen because the whole geometry of a built environment (in three dimensions) can be explained using them, and translated to urban density. Meanwhile, altering these variables affects the energy demand of buildings by changing parameters such as the shadowing effect, building size and the urban heat island (UHI) effect. Ahmadian, Sodagar [43] previously used these parameters to establish the relationship of urban built forms with two crucial density indicators (i.e., site coverage and plot ratio) to introduce the Form Signature indicator. Site coverage is the ‘total area covered by buildings’ over the ‘total site area’, and the plot ratio is the ‘total floor area’ over the ‘total site area’, which have been widely used in the literature and are used in this study within the Form Signature graphs (see Section 3. The Form Signature indicator was subsequently adapted by Ahmadian, Sodagar [44] to analyse the building energy performance of London, and finally, propose an urban energy planning tool. This paper builds on the original tool, by adding two more layers relating to the impact of climate change along with an additional transportation model that considers technological advancement by 2050. Hence, the city of London is taken as the case study to facilitate comparison of the results of this study with the present condition of London provided by Ahmadian, Sodagar [44], though it is acknowledged that the impact of climate change on a building energy consumption is different from one region to another [47].
Subsequently, CitySim software is used to perform an energy analysis on the geometrical models of the chosen built forms. CitySim is an urban energy simulation package that considers parameters such as inter-reflection between external surfaces through short/longwave radiation, the shadowing effect of adjacent buildings and the UHI effect [48]. These features are advantageous compared with other building simulation tools, which are very important for the urban-level comparative energy analysis in this study as it investigates the urban microclimatic condition and its Impact on building energy performance. CitySim has already been validated in several studies by comparing its performance with both monitored data [49] and data obtained from other simulation software [49,50]. Furthermore, the simulation model of the urban blocks used in this study is specifically validated against real energy data of a pilot study comprising of four terraced houses, sited in Gainsborough (UK) [44]. The future climate data of London, predicted by the Intergovernmental Panel on Climate Change (IPCC), are obtained from the Meteonorm software database [51]. Meteonorm is selected for this study because it integrates well with CitySim and provides 10 years of average temperature data and 20 years of average irradiation data for the present scenario along with the predicted climate data for future scenarios (e.g., the predicted data of 2050 for this study). The data include air temperature, surface temperature, beam radiation, horizontal diffuse radiation, wind speed, wind direction, relative humidity, precipitation and cloud cover fraction on an hourly basis plus horizon data containing information about natural obstacles around the location. In addition, a transportation model is formulated in this study based on the future penetration of EVs. Excel spreadsheet tools are developed to initially calculate and process the required data before and after simulation trials (see Appendix A) and, secondly, estimate the total energy demand of EVs for each of the cases. An assumption is that EV energy charging requirements are provided by rooftop PV panels. The required energy is therefore considered as an additional building load.

2.1. Formulating the Future Scenario

In the Paris Agreement of 2015, a durable framework was provided to avoid the threatening consequences of climate change by limiting global warming to below 2 °C (and preferably 1.5 °C) above pre-industrial levels. This is possible only through rapid transitions in energy, land, urban infrastructure and industrial systems [52]. To this end, the UK set a legally binding target of net zero emissions by 2050 making it the first major economy to pass net-zero emissions laws [53]. The main areas for carbon emission reduction are power, buildings and transport, by using renewable and clean energy sources, increasing the EPC standard of all homes, and ending the sale of petrol and diesel cars by 2030 [54]. Future climatic conditions of London in 2050 and transportation strategies are therefore investigated to identify their impact on building energy performance and its relationship with urban built form and density.

2.1.1. Global Warming and Climate Change

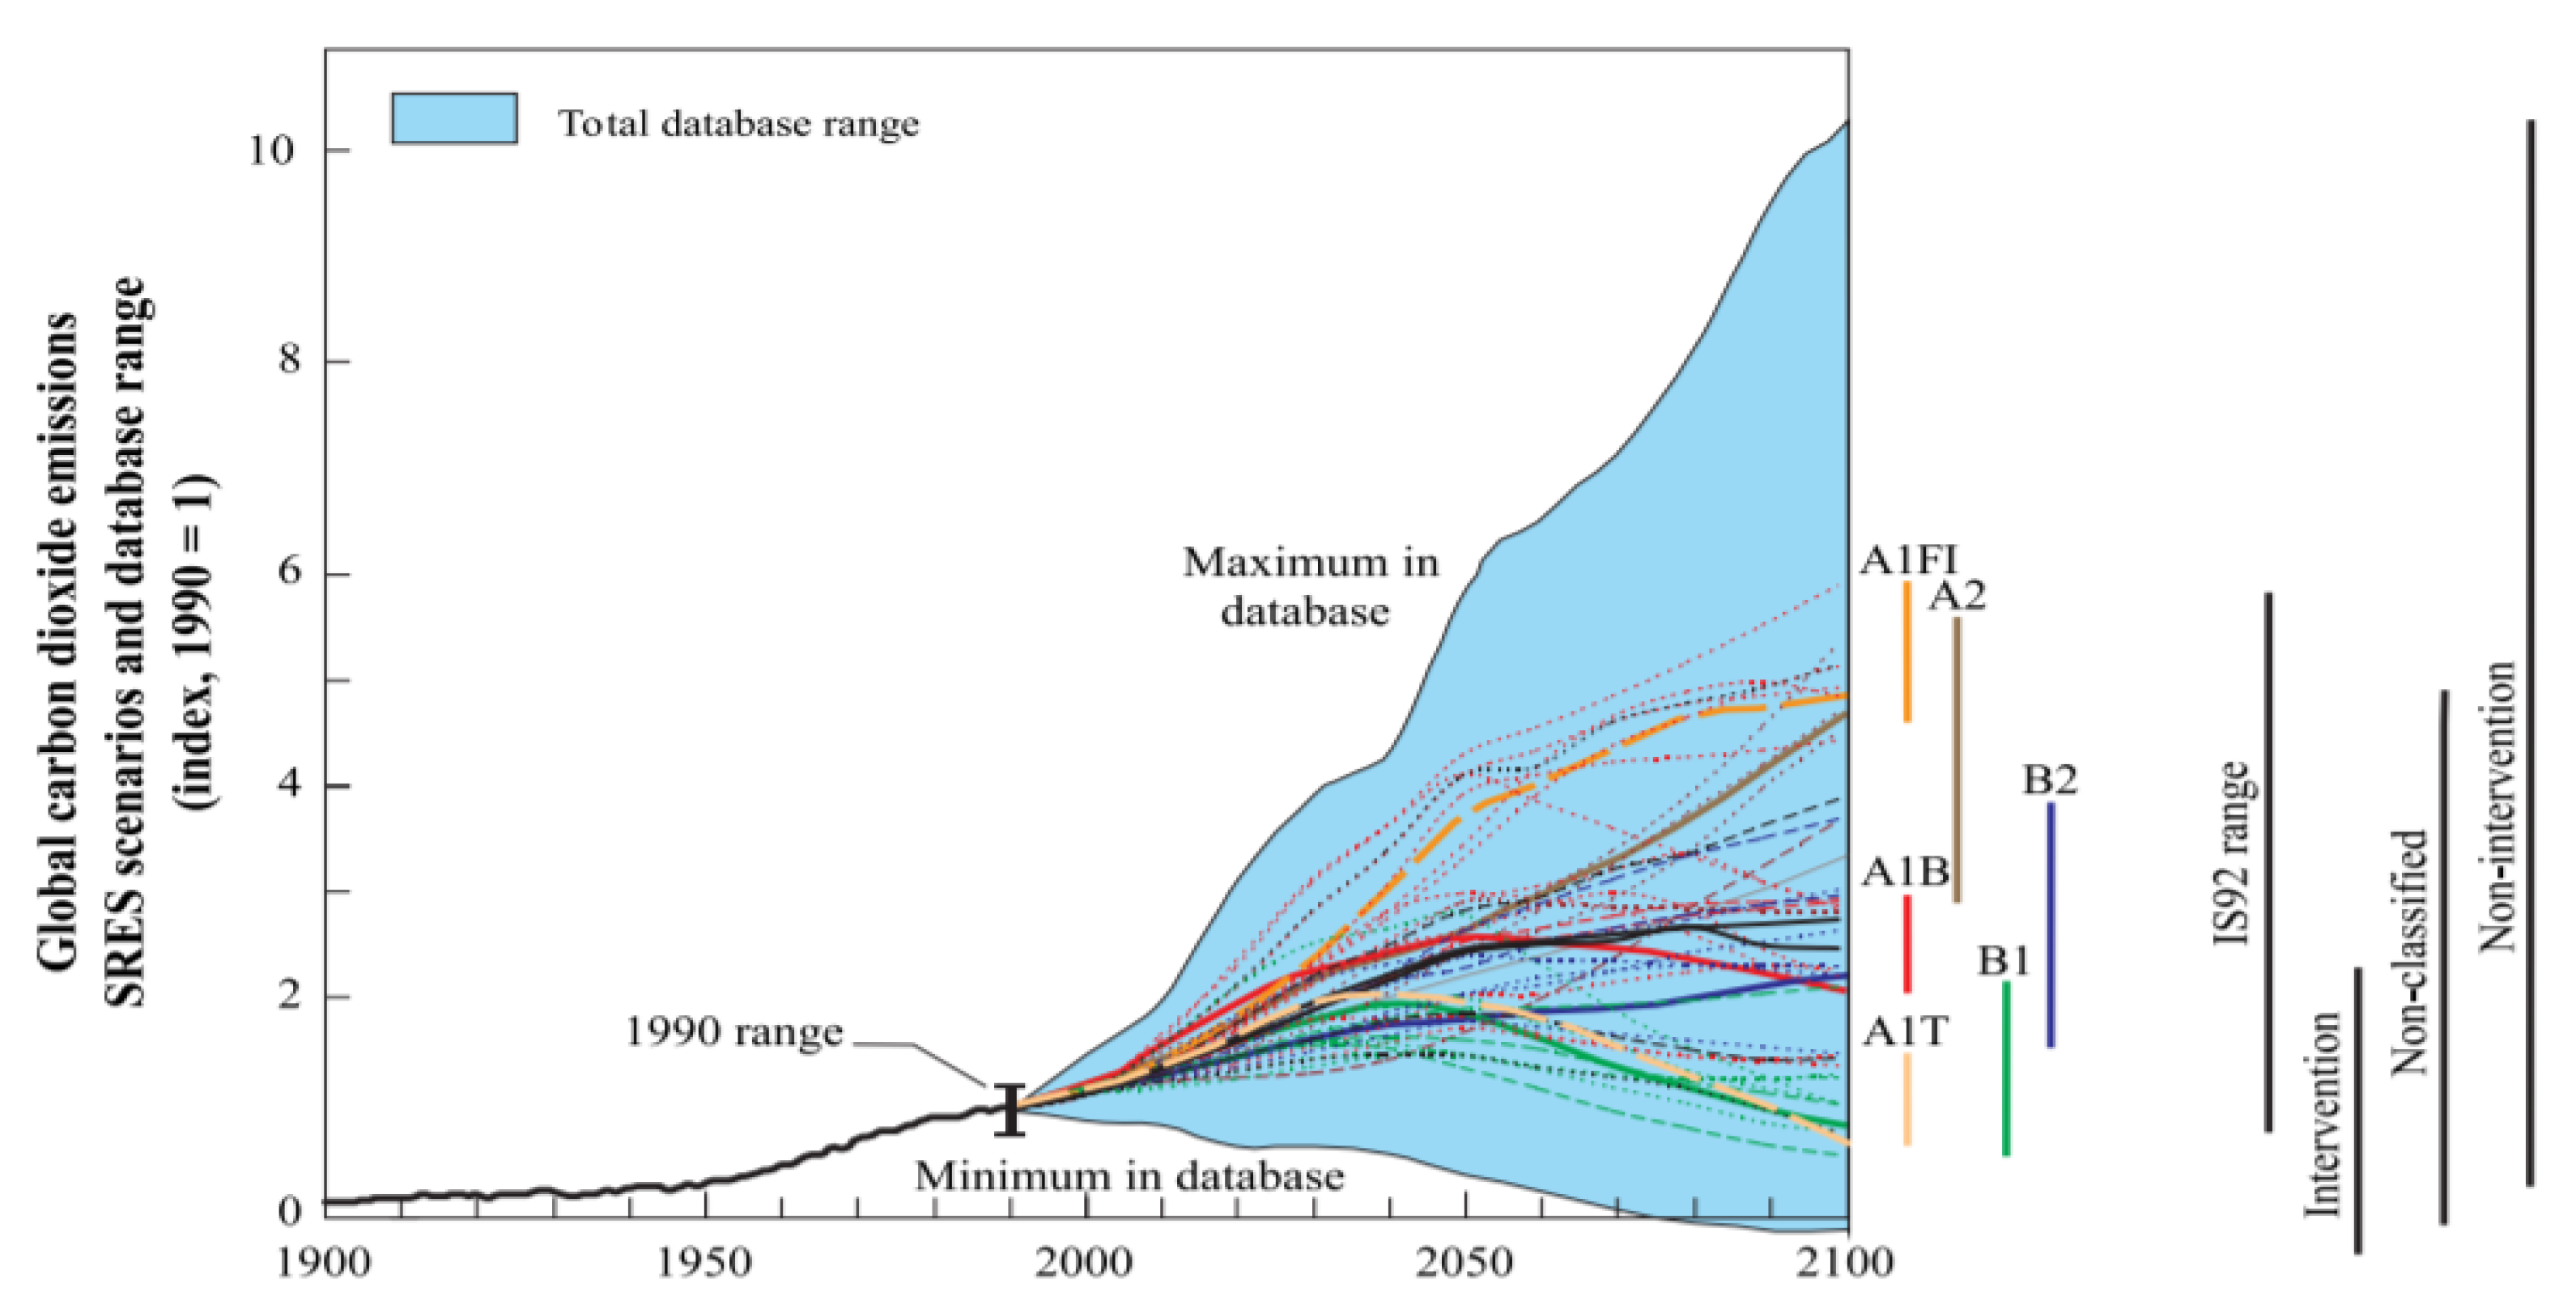
The IPCC issued a special report proposing six different emission scenarios for future climate change [55], which was later updated in AR5 report of the IPCC [56]. The scenarios are alternative visions of how demographic and socio-economic development as well as technological changes might affect the trend of carbon emissions in the future. These are classified into four storyline families. Figure 2 shows the predicted trend of changing carbon dioxide emissions by 2100.
From Figure 2, it is observed that scenarios A1F1 and A2 have the highest emissions. To emphasise the possible consequences of underestimating climate change, this study considers one of the two worst-case scenarios. Meanwhile, since the IPCC’s most likely carbon emission scenario is A2 [57], and Meteonorm software can generate predicted future climate data of this scenario for CitySim software, A2 is specifically chosen for this study. Notably, Jylhä et al. (2015) also show that A2 causes more significant changes in future building energy demand compared with B1 and A1B scenarios. The underlying trends in scenario A2 is self-reliance and preservation of local identities, continuously increasing global population, regionally oriented economic development and per capita economic growth, where technological changes are more fragmented than in other storylines.

2.1.2. Transportation Model and Future Technologies

To achieve the 2050 zero-carbon target in the UK, the transportation system, as a major pollution contributor (accounting for 26% of the UK’s greenhouse gas emissions [58]), needs to be urgently decarbonised. This will be done by replacing ICEVs with EVs. Adoption is now accelerating following several services and financial incentives such as tax reductions, offering free parking spaces to EVs and allowing them to use the bus lanes, and Plug-In Grants towards the cost of installing charge points in domestic dwellings [59]. The latter aspect provides a key foundation for the analysis presented in what follows.
Carbon emissions from the use of EVs are very dependent on the manner in which they are charged. If EVs are charged from PVs mounted on residential buildings, then the energy is comparatively emission and cost-free (regardless of their embodied energy). Furthermore, energy generated from any building can be used by any vehicle thanks to the development of smart- and micro-grids [60]. According to Nikonowicz and Milewski [61], energy stored throughout an urban area can be directed towards electrically powered public transport by utilisation of the future virtual power plants (VPPs). For example, with new disruptive technologies, households will not only consume electricity but are also likely to generate it. With the use of VPPs, the urban population will become ‘prosumers’ and will have a stake in power plants that could be controlled by the local communities or councils. Legislation has been proposed by the UK government to guarantee small-scale renewable energy generators will be paid for exporting electricity to the national grid [62]. This, combined with smart grids and blockchain energy supply [63,64], may suggest that dispersed cities of lower density will be more energy efficient for both buildings and transport. This will challenge the current structure of the grid network providers and their business models, and that is why in London electric vehicle infrastructure delivery plan, these issues are clearly being investigated and actions are being taken accordingly [65]. Utilising the above-mentioned technologies can mitigate the issue of intermittency of PV generation and the need for installing a costly energy storage system at the individual building level [66]. Therefore, since this study investigates the ‘potential’ of PV generation and electricity demand in urban areas, no energy storage system is considered. Moreover, the relative values of PV generation are important for comparative analyses of different built forms and densities (see Section 3.2) rather than the absolute values.
In the scenario considered for this analysis, it is assumed that all household EVs will be charged by domestic plug-in, and supplied by roof-mounted PVs. Therefore, the electricity consumed by EVs is added to the total energy demand of the buildings. To this end, the analysis procedure shown in Figure 3 is adopted. It initially predicts the percentage of EVs in UK private transportation by 2050, then calculates the number of EVs used in the built environment models by using the number of occupants. This is multiplied by the annual travel distance by cars, which subsequently gives the annual electricity consumption of cars for each building that will be added to the building demand from the EVs.
In the geometric building models developed for this study, the number of occupants is based on the constant occupant density of 35 (m2/person) [67,68]. Therefore, when calculating the total number of electric cars used in the building models, it is essential to calculate the number of cars per person (occupant).
The first step is to find the percentage contribution of EVs in the market in 2050. According to the forecast published by The Faraday Institution [69], the uptake of EVs in the UK will increase to 95% by 2040—see Figure 4.
From Figure 4, it can be concluded that this value can reach 100% by 2050. This is supported by the Department for Transport [70] writing that they plan for almost every car and van to be zero-emission by 2050. The next step is to identify the average number of cars per person to be able to estimate the number of cars possessed by the occupants in the building models. According to data provided by the Department for Transport, 39% of London households own a car, 16% own more than one car and 45% have no car [71]. The percentages are very similar to the report published by Transport for London [72] and is equivalent to an average of 0.3 cars per adult. However, to provide an updated estimate, a brief analysis is now undertaken. Statistica [73] showed that the average number of persons per household is 2.36 for the UK. Although this is for the whole of the UK, it is very close to the number announced on the Mayor of London [74] website, which is 2.47 for 2011. This study therefore chooses 2.4 as a value between the two, considering that there has been a decreasing trend since 2011. Since this study requires an estimate of the number of cars per person for simulation trials, the following method of calculation is used.
Considering 16% of the households own two cars [71], this value is accounted twice (i.e., 32%) as the households with one car. By adding this to the percentage of the households with one car (39%, as mentioned in the previous paragraph), the value of 71% is obtained. Therefore, the proportion of people who own cars is obtained through the following (Equation (1)):
0.71 ( car household ) 1 2.4 ( household person ) = 0.3 ( car person )
As a result, the value of 0.3 cars per person is used for energy modelling. Multiplying by the number of occupants in each building model allows the total number of EVs for each building plan to be obtained.
Next, the average distance travelled by each car in London is estimated. According to the data published by the UK Government [75], the annual mileage of private cars is 7200 including business mileage, commuting mileage and other private mileage. By multiplying this by the electricity consumption of an EV per mile, its annual electricity consumption is obtained. The average consumption of all the available EV models listed in the Electric Vehicle Database [76] is 0.307 kWh/mi, with the lowest consumption belonging to the Tesla Model 3 Standard Range Plus with 0.235 kWh/mi. In this study, the most energy-efficient car is considered since we are considering future technological advancement. Finally, assuming a power transfer efficiency of 90% for battery charging with the associated power electronic converters, the electricity demand from EVs is multiplied by 1.1 to obtain the yearly electricity consumption of EVs from PVs (see Equation (2)).
E V   c o n s u m p t i o n = 0.3 N u m b e r   o f   o c c u p a n t s 7200 0.235 1.1
It should be noted that most of the above-mentioned values may differ in future due to changes in government policy, technology development, and occupant lifestyle (e.g., more online shopping, cycling and teleworking), which is affected by family economic conditions and the demography of London: for instance, the number of persons per household, the willingness of people for having their own car (e.g., this might change by the planned development of public transportation), the average distance travelled by car, penetration of new autonomous vehicles into the market and the efficiency of EVs and PVs might change in 30 years. Furthermore, electrification (charging large number of EVs) will need redevelopment of the electricity network to prepare for the greater energy consumption. To this end, deployment of charging infrastructure has been increasing over the last years. Moreover, there have been plans and policies to facilitate the transition towards EVs such as further expansion of public slow to fast charging infrastructure; utilising new charging formats (e.g., wireless charging, mobile charging, and emergency charging); supporting shared business charging infrastructure; shifting to demand-led distribution; maximising potential of legislation; and facilitating smoother installation and matching supply with demand [65].

2.2. Energy Simulation

The average UK surface air temperature has increased by ≈1 °C since the mid-1980s, which has created frequent warmer summers compared to the 1971–2000 average [77]. There has been little attention to the cooling of dwellings in the UK for historical reasons (mainly the climatic conditions); therefore, residential buildings normally do not possess any cooling system for summer months. However, as the temperature rises, there will be a rise in the rate of synthetic cooling requirements during summer periods [78]. Hence, an adaptation of air-conditioning for cooling purposes is being increasingly demanded [79,80]. This is among the key differences between the present and future scenarios for building energy optimisation in the temperate climate of the UK, and is investigated in this study. Nevertheless, natural ventilation still has a positive impact and a good design together with the potential for adaptive comfort can reduce the need for synthetic cooling. Notably, over-reliance on air-conditioning may result in a more compact built form as it displaces cooling by natural cross-ventilation that needs greater space between buildings for larger wind flow [81]. To this end, the importance of transforming the physical form of buildings and cities to be consistent with the changing climate is increasingly significant. Results of this paper give recommendations for the most energy-efficient built forms to be adopted for future climatic conditions.
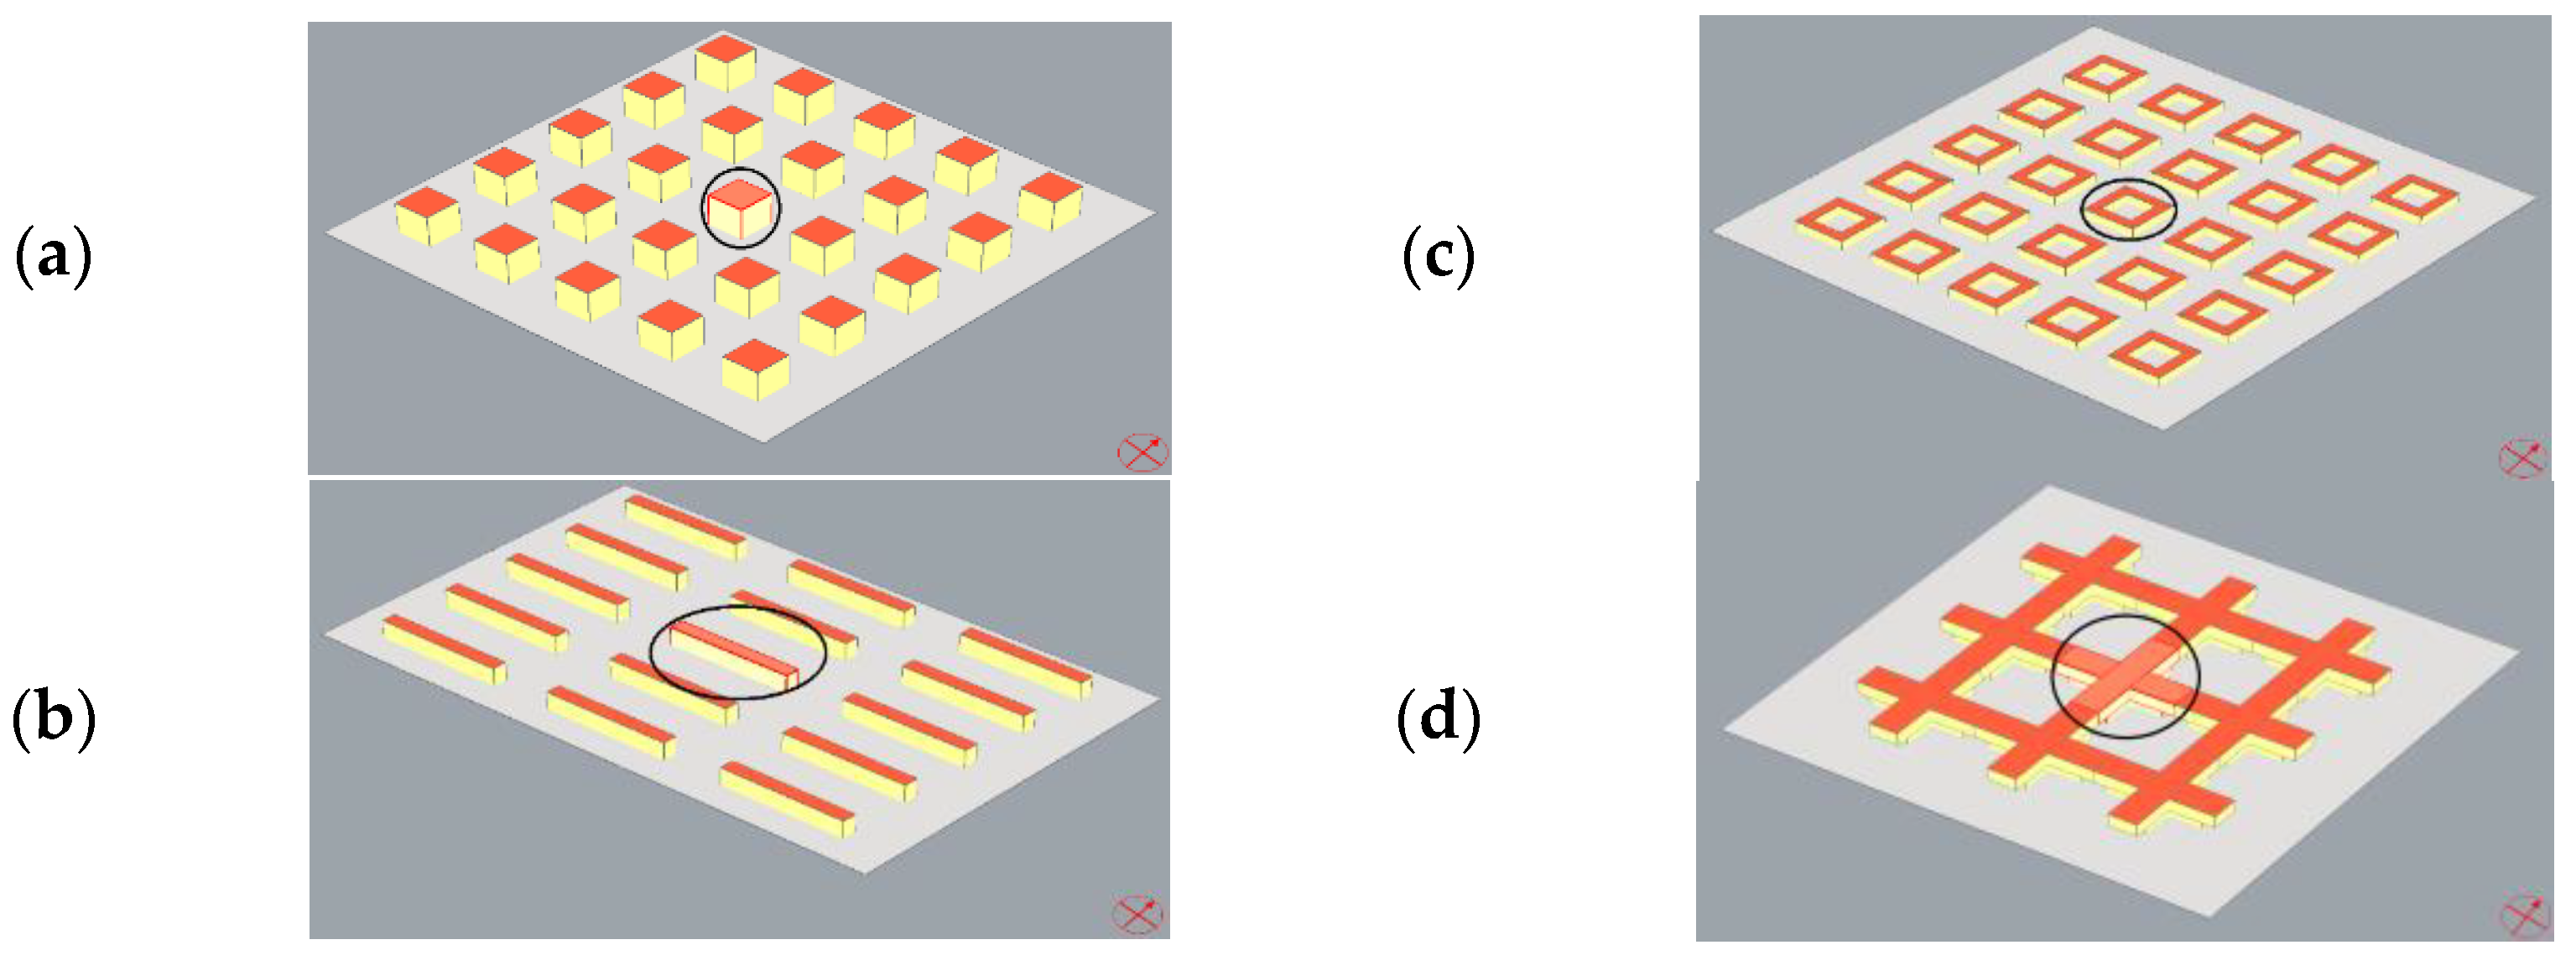
Models of buildings with different built forms are provided for the simulation trials (see Figure 5). For each, geometric parameters (i.e., plan depth, number of floors and the cut-off angle) are varied to examine their impact on the energy performance of the building. Regardless of the built form, all buildings are south facing. Simulation trials are executed for each model of the built forms in turn. The middle blocks (indicated by a black circle in Figure 5) are target buildings to be analyzed while their surrounding buildings present the external environment. Buildings are considered as black boxes with similar internal conditions and interact with each other via the external environment. Here, the hypothesis is that a district is covered by a specific built form to evaluate the performance of each built form at this location and climate while the geometric variables are changed to provide a sensitivity analysis.
The physical/thermal properties of all building envelopes are kept constant to investigate only the impact of form and density on the buildings energy performance. They are chosen according to the best practice from the government-approved documents (Part F and L1A) and Standard Assessment Procedure (SAP) to be aligned with new building construction standards. For instance, a combined infiltration and ventilation rate of 0.5 ACH, U-values of 0.18, 0.13, 0.13 and 1.4 W/(m2·K) for walls, roofs, floors and windows, respectively, and a glazing ratio of 40% (double-glazed windows) are considered for all buildings. However, the simulation models of future scenario could have significant differences compared to the present perspective.
The predicted future climate option (i.e., IPCC A2 for 2050) is selected in Meteonorm to generate a future climate file instead of using the present climate file of London. Additionally, it is assumed that the occupants own EVs, which are charged by the energy harvested from building-integrated PVs. Finally, in addition to heating and electricity demand, cooling loads are also considered in anticipation that buildings will require cooling as a result of global warming [77,80]. Kolokotroni, Ren [80] showed that this requirement will be more significant in urban areas such as London due to intensification of the UHI effect (which is also readily incorporated into CitySim). Moreover, the heating season in the UK will be considered shorter due to global warming [82,83] along with improvements in insulation materials that can offset the heating load during low-demand months. Therefore, months with a low heating demand are eliminated from the heating period, leaving November to March as the chosen heating period. The cooling season is chosen to be between June and August, corresponding to the hottest months of the year according to the climate data, and consistent with other studies [84]. Therefore, here, a PV system is used to cover EV electricity demand plus building electricity consumption, space heating and cooling demand [85], and assumes that all types of energy demand are provided by electricity.
In addition, it is assumed that home appliances and lighting energy consumption will be 22% more efficient in future [86,87]. Typical consumptions of common home appliances (TV, fridge, oven, etc.) in W/m2 plus a mean power consumption of 2.14 W/m2 for lighting (using LEDs for a mean value of 300 lx) are fed to CitySim for calculations (Ahmadian et al., 2021). Therefore, these values are considered 22% lower for the future scenario. Other characteristics remain similar to be consistent with the present conditions in London. Comparative analysis therefore determines the difference between the percentages of heating, cooling and electricity requirements between the present and future.

3. Results

3.1. Correlation of Building/Transportation Energy Demands with Urban Built Form and Density

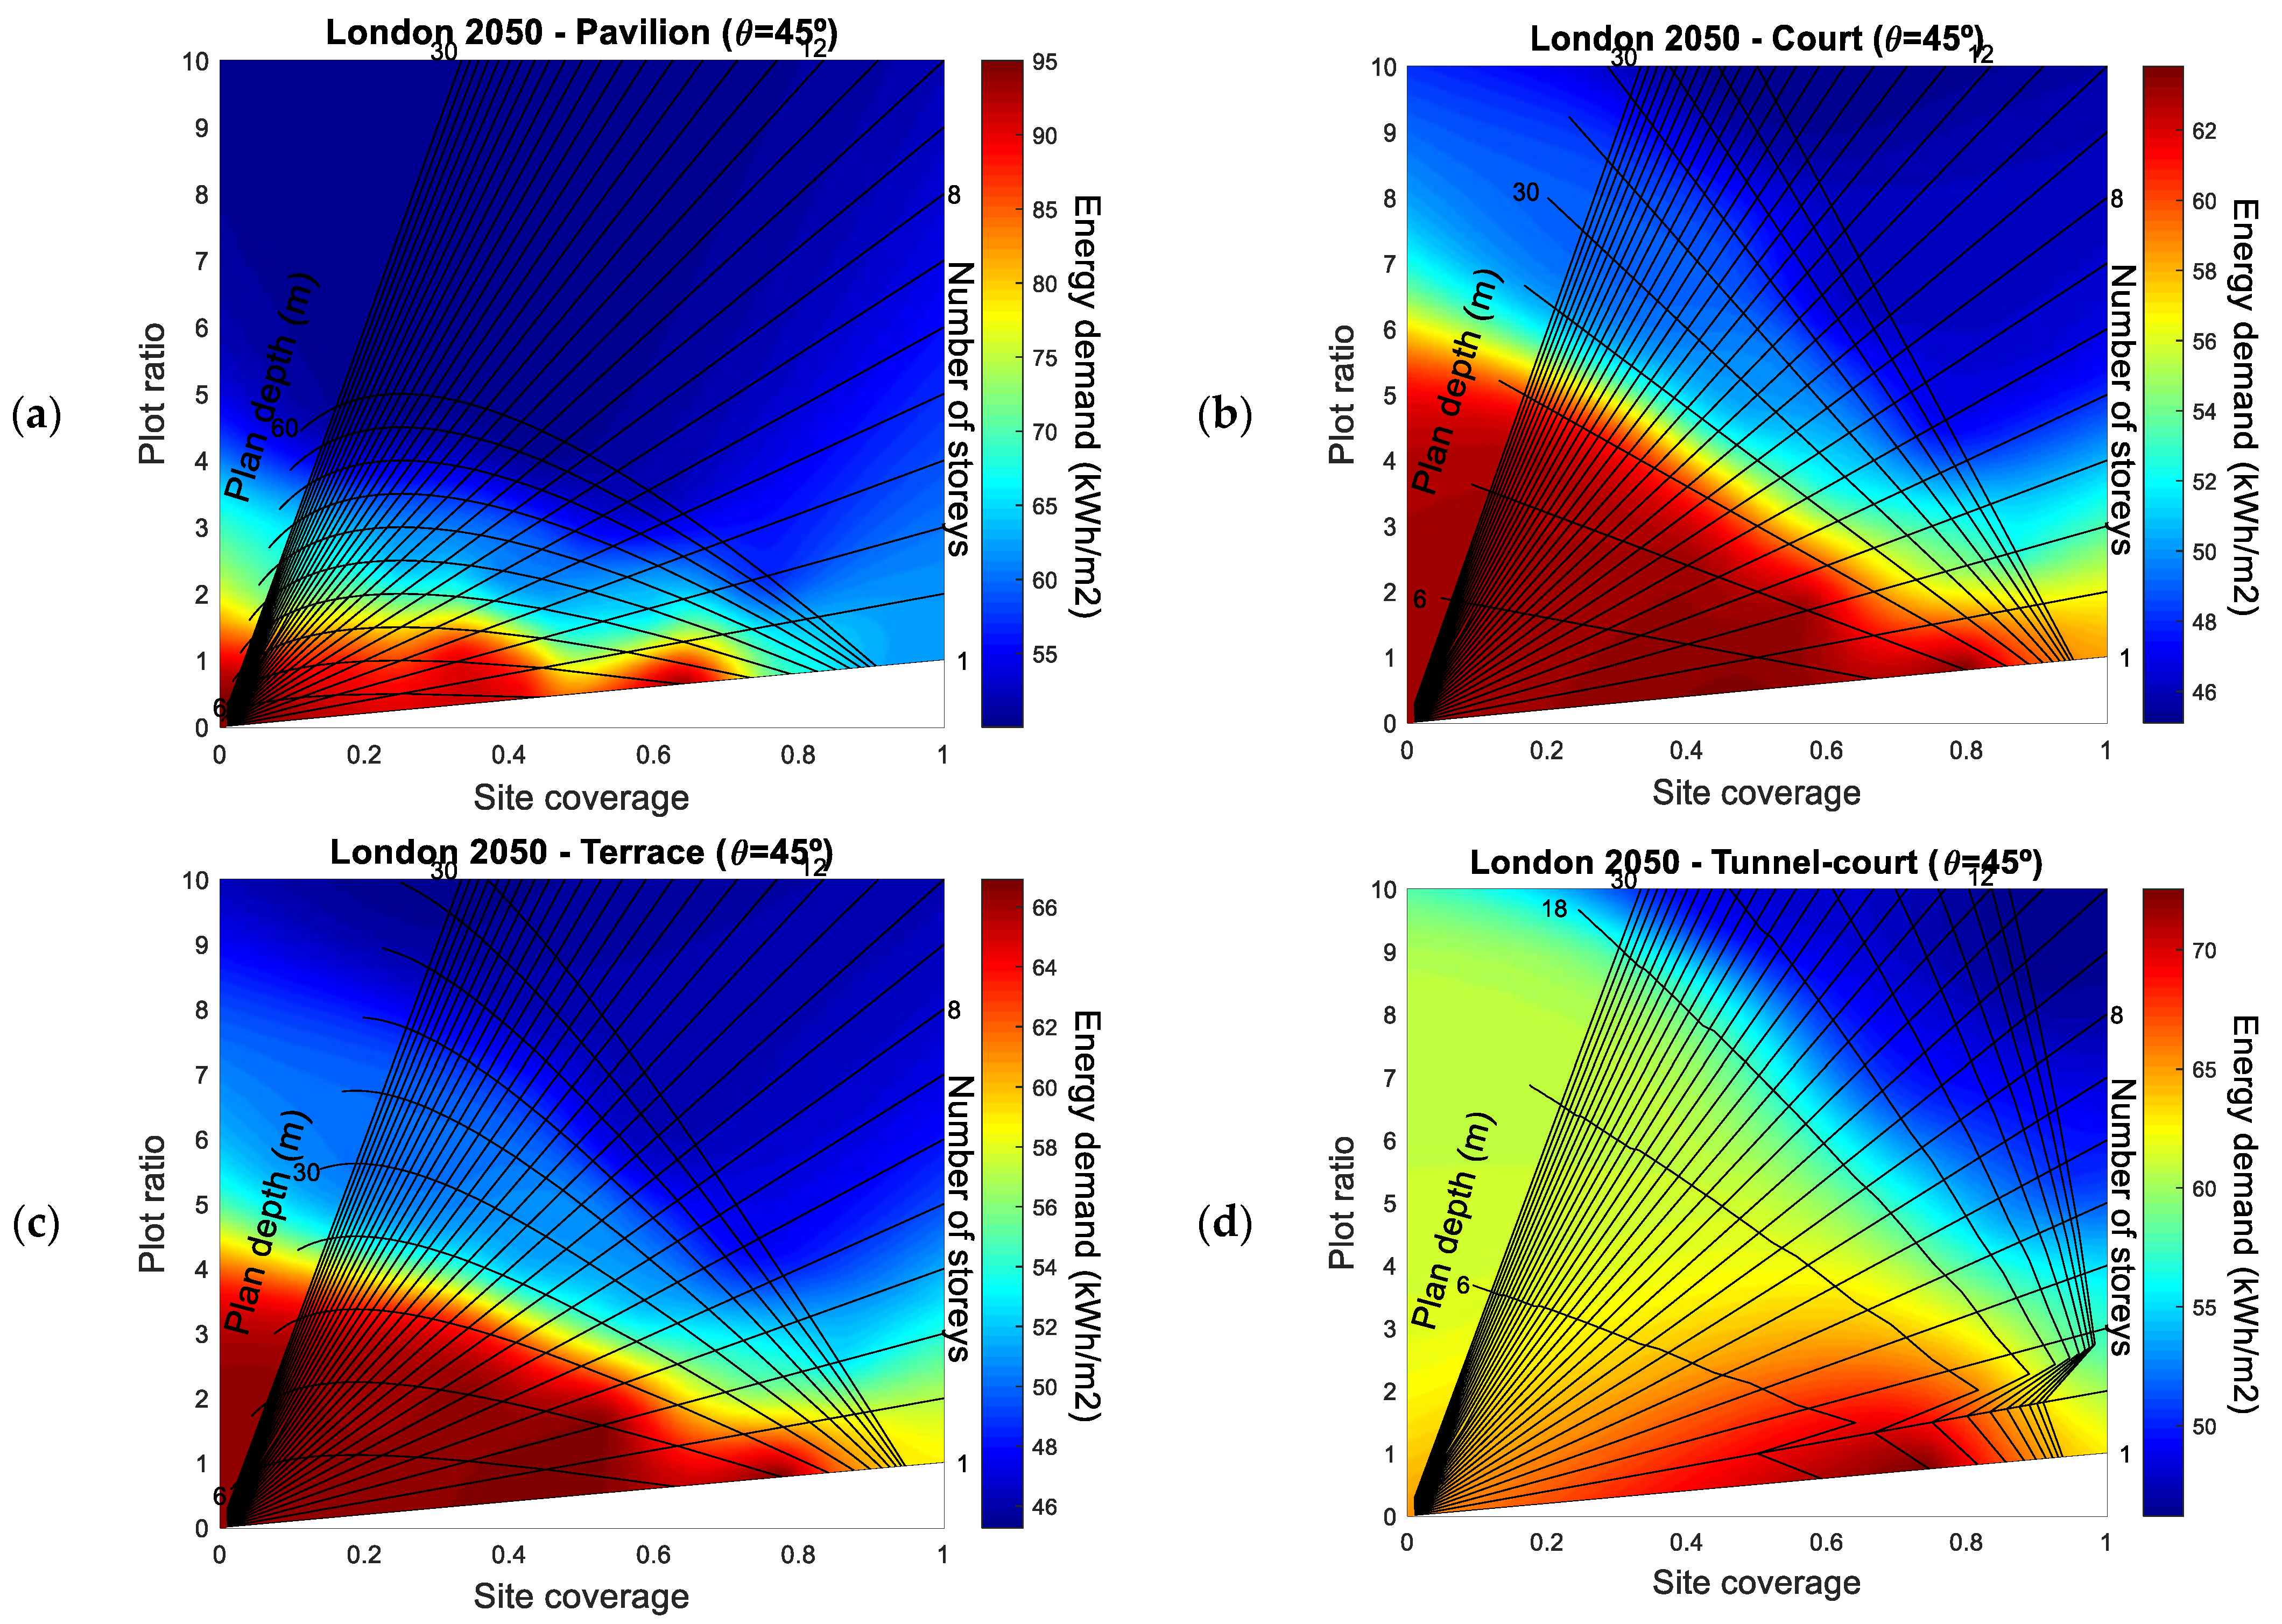
To investigate the correlation of energy with built form and density, a sensitivity analysis is performed. Models of building plans with a specific built form but variable geometric values are used for energy demand simulations. This is achieved by changing the plan depth, the number of storeys and the cut-off angles of each model (with the specific intervals) which consequently changes site coverage and the plot ratio of the plans. As a result, 216 simulation trials are executed for building plans with the proposed built forms, densities and geometries to calculate their annual energy demand. Each then corresponds to a particular point on the Form Signature graphs, shown in Figure 6. A MATLAB script is written to extrapolate energy values and provide a heat map of energy on the graphs.
In Figure 6, only the Form Signature of built forms with θ = 45° are shown (as the average cut-off angle considered for this study). Results for θ = 25° and θ = 65° are not considered to avoid repetition since the trends are very similar.
In general, Figure 6 shows that following the predicted climate of 2050 and usage of EVs, urban built areas with low-rise buildings and low plan depths (shown in dark red) present the worst-case scenarios regarding energy consumption, while buildings with more storeys and greater plan depths (i.e., higher values of both site coverage and plot ratio) will have lower energy demand per unit area. There is only one exception in the pavilion built form when plan depth is small (e.g., x = 12 m), and increasing the number of storeys from 6 to 30 leads to an increase in the energy demand caused by an increase in cooling load during the summer. The reason for this is that the pavilion form has a significantly higher surface to volume ratio compared with other built forms [43]. Therefore, when the building is high, the external walls of the building have a large surface area exposed to the outside environment which has a twofold impact on increasing the cooling load. Firstly, the building has a greater glazing area leading to high solar gain during the day, which consequently requires increased cooling. Secondly, there is more heat gain through the envelope which also increases the cooling load in the hot season. These points are particularly influential for pavilion buildings with small plan depth since the space inside the building is narrow and sensitive to outdoor conditions.

3.2. Correlation of PV Generation, Building/Transportation Energy Loads, Urban Built Form, and Density

The simulations also consider PV energy generation from building roofs. To simultaneously consider the building PV generation and energy consumption, the Energy Equity indicator is used, which represents building energy self-sufficiency [44]. The resulting values of Energy Equity are shown in Figure 7.
The results in Figure 7 demonstrate that buildings with greater plan depths and a lower number of storeys will still be favourable in 2050 because of their greater potential for harvesting solar energy. Therefore, higher values of site coverage and lower values of plot ratio will be desirable. This conclusion is similar to the present situation of London [44], however, the magnitude of Energy Equity will be smaller in 2050 for three reasons, (i) buildings will require cooling energy due to global warming, (ii) the use of EVs and their charging from building-mounted PVs, and (iii) the predicted climate scenario generated by Meteonorm (IPCC AR4 A2) indicates that PV energy generation in 2050 will be slightly lower than at present. Results obtained in this study show a 0.6% reduction in annual PV energy generation from the present to 2050 due to climate change (the reasons are explained in Section 4). The annual PV energy generation in 2050 would be higher than the present scenario, if the future development in PV technology has not been disregarded (which would certainly increase the PV energy efficiency). Overall, the results show that in this future scenario only single-storey buildings (regardless of their built form) can generate sufficient PV energy to supply the total energy demand of the building (i.e., obtaining Energy Equity >1). However, this building configuration might not meet housing demands in areas with high population densities; therefore, this is only recommended in the case that other constraints allow such an urban development.

3.3. PV Generation vs. EV Consumption

To investigate the self-sufficiency of the buildings for generating enough electricity for charging EVs, the PV/EV ratio is defined as in Equation (3), and excludes other types of energy demands except EV consumption. This ratio is calculated for all the 216 simulation trials to investigate the impact of urban geometric variables on this ratio.
0.27 P V   g e n e r a t i o n E V   c o n s u m p t i o n 8.12
This ratio is equal to 8.12 for one-storey buildings and 0.27 for a 30-storey building, regardless of the built form. The results show that buildings with up to eight storeys can provide enough electricity for the total annual EV consumption of the occupants. While buildings with more than eight storeys possess a PV/EV ratio lower than unity.

3.4. Heating to Cooling Ratio and Its Implications

The ratio of heating to cooling energy demand is an indicator of whether the building energy system is either heating or cooling dominated and is dependent on the climatic conditions of the site location. It can be used for the prediction of the building energy performance in different locations and comparing a variety of site plans with different geometry and density. The maximum and minimum threshold ratios for the case of London in 2050 are given in Equation (4).
0.65 H e a t i n g   e n e r g y   d e m a n d C o o l i n g   e n e r g y   d e m a n d 9.65
This ratio is usually greater than unity, reaching values close to 10 at its maximum, except when considering a few cases of the pavilion form with very small plan depth (i.e., 12 m) with a ratio of less than unity. This demonstrates that the amount of heating load is significantly higher than the cooling load in the majority of building plans and the buildings are heating dominated, which is in line with the London climate. In exceptional cases, the plan depths are very small meaning that they have larger exposed surfaces while their glazing ratio is the same as others. Therefore, the solar gain, as well as the heat absorbed by external walls, are significantly higher and the building has a greater cooling demand.
The ratio is larger for court and tunnel-court forms compared with pavilion and terrace forms. It also increases with plan depth, decreasing number of storeys and increasing the cut-off angle. This means that having deep buildings with a lower number of storeys (‘shorter and wider’ buildings) along with a small distance between the buildings would result in a higher portion of heating demand with respect to cooling demand, and vice versa. Indeed, the combined effect of these three geometrical variables along with altering the built form can cause up to 15 times change in the heating to cooling ratio of a building.

3.5. Impact of the Cut-Off Angle on Building/Transportation Energy Loads

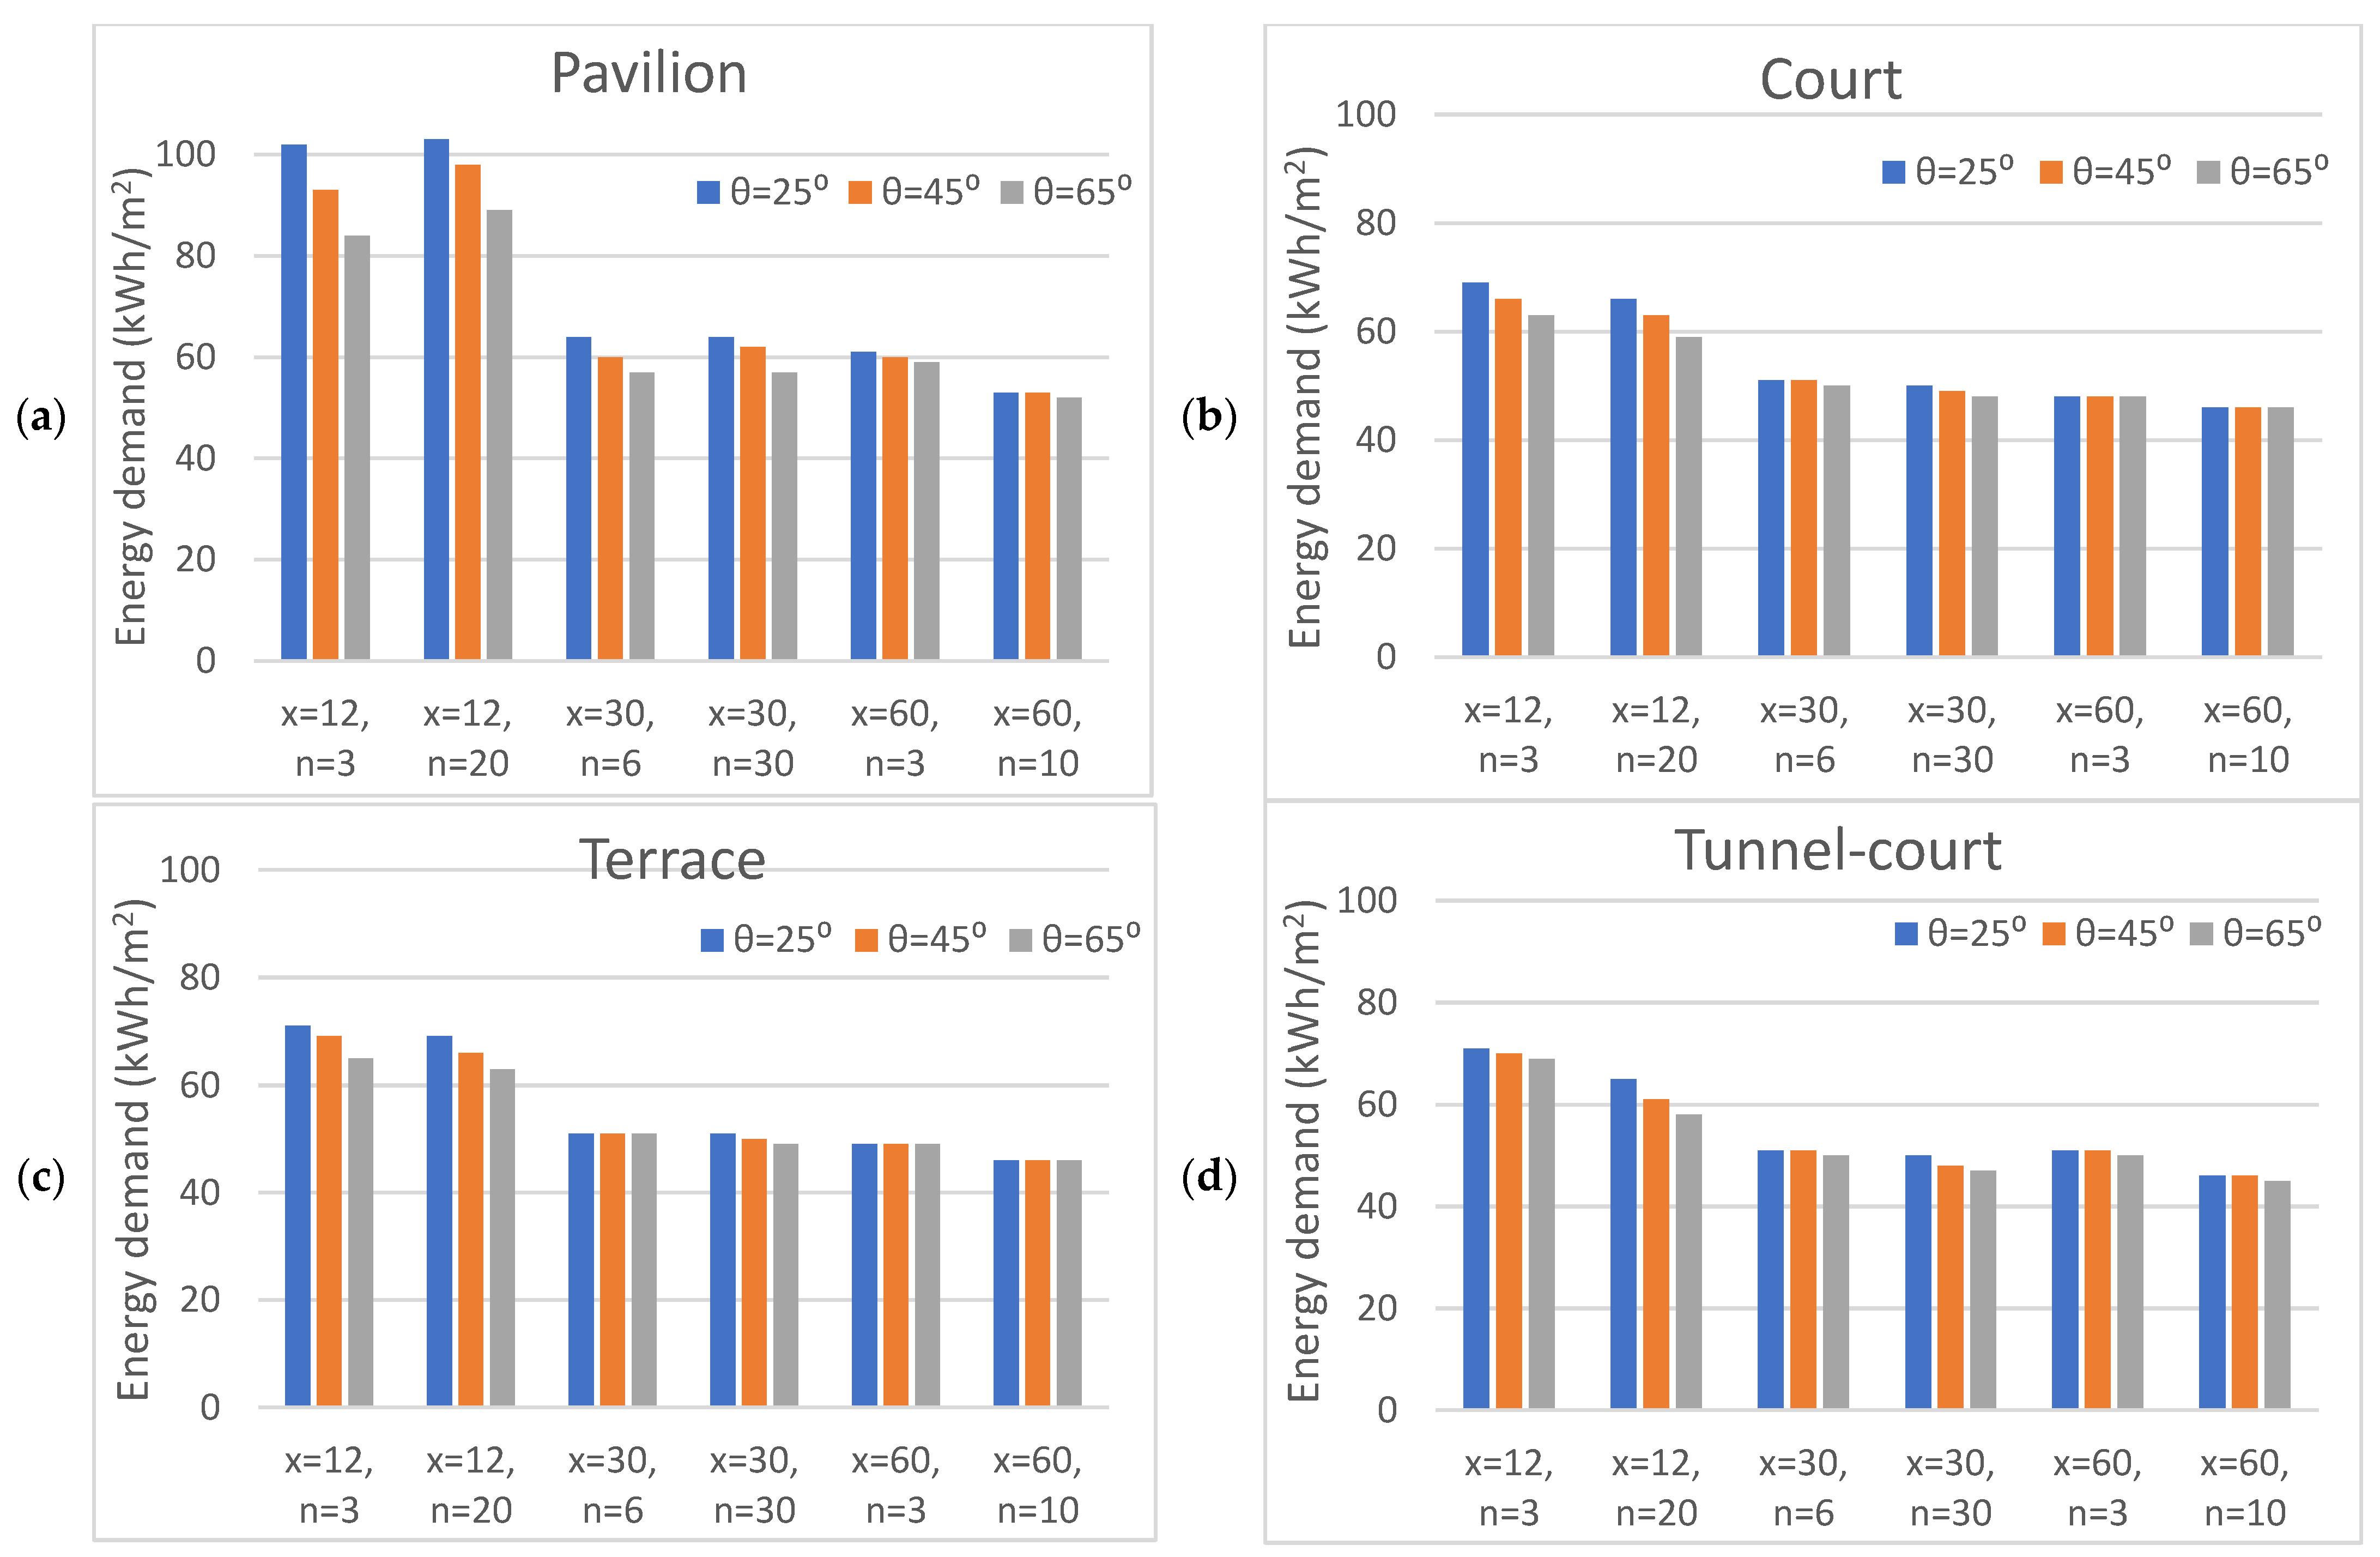
To identify the impact of the cut-off angle on building energy demand in 2050 and predict the optimum cut-off angle, the energy demand of buildings plans with different cut-off angles are analysed; see Figure 8. Here, for each simulation model, the distance between buildings is changed according the change in the cut-off angle.
It can be observed from Figure 8 that increasing the cut-off angle will mainly cause a reduction in building energy demand for those with small plan depths, while it does not make a significant impact in buildings with high plan depths. Therefore, the decreasing trend of building energy demand versus increasing the cut-off angle in buildings with x = 12 m gradually diminishes to no change for x = 60 m. Only pavilion and tunnel-court built forms maintain a decreasing trend of the building energy demand for buildings with greater depths, and still show ~2% decrease in building energy demand when the cut-off angle is varied between 25° to 65°.
By comparison with the results obtained from the present time of London [44], which show an increase in building energy demand with an increasing cut-off angle, the future scenario now indicates the opposite trend. The reason behind this is the presence of cooling loads for future scenarios. Increasing the cut-off angle would decrease the cooling load by blocking a larger portion of the solar energy received by the buildings [88]. Although building energy demand is composed of heating, cooling, electricity and EV consumption, only heating and cooling loads are affected by changing the cut-off angle. The effect of increasing the cut-off angle on the heating demand is opposite to its impact on the cooling demand. It can be concluded from Figure 8 that in small depth buildings, the decrease in cooling load is more significant than the increase in the heating load (due to the ease of cross-ventilation). Therefore, building energy performance acts as a cooling-dominated system, though the absolute amount of heating energy demand is larger than the cooling energy demand as its heating to cooling ratio is normally greater than unity (see Equation (4)). Importantly, it shows that the building cooling load is more sensitive than its heating load with respect to changes in the external environment (such as varying the cut-off angle). This is because the performance of air-conditioning systems is a strong function of ambient temperature [89]. Hence, cooling loads play a key role in the response of building energy demand to the cut-off angle change. In buildings with greater plan depths, the increase in heating demand and decrease in cooling demand almost negate each other, and the total building energy demand does not show a significant variation against increasing the cut-off angle.

3.6. Comparison of the Energy Performance of the Different Built Forms

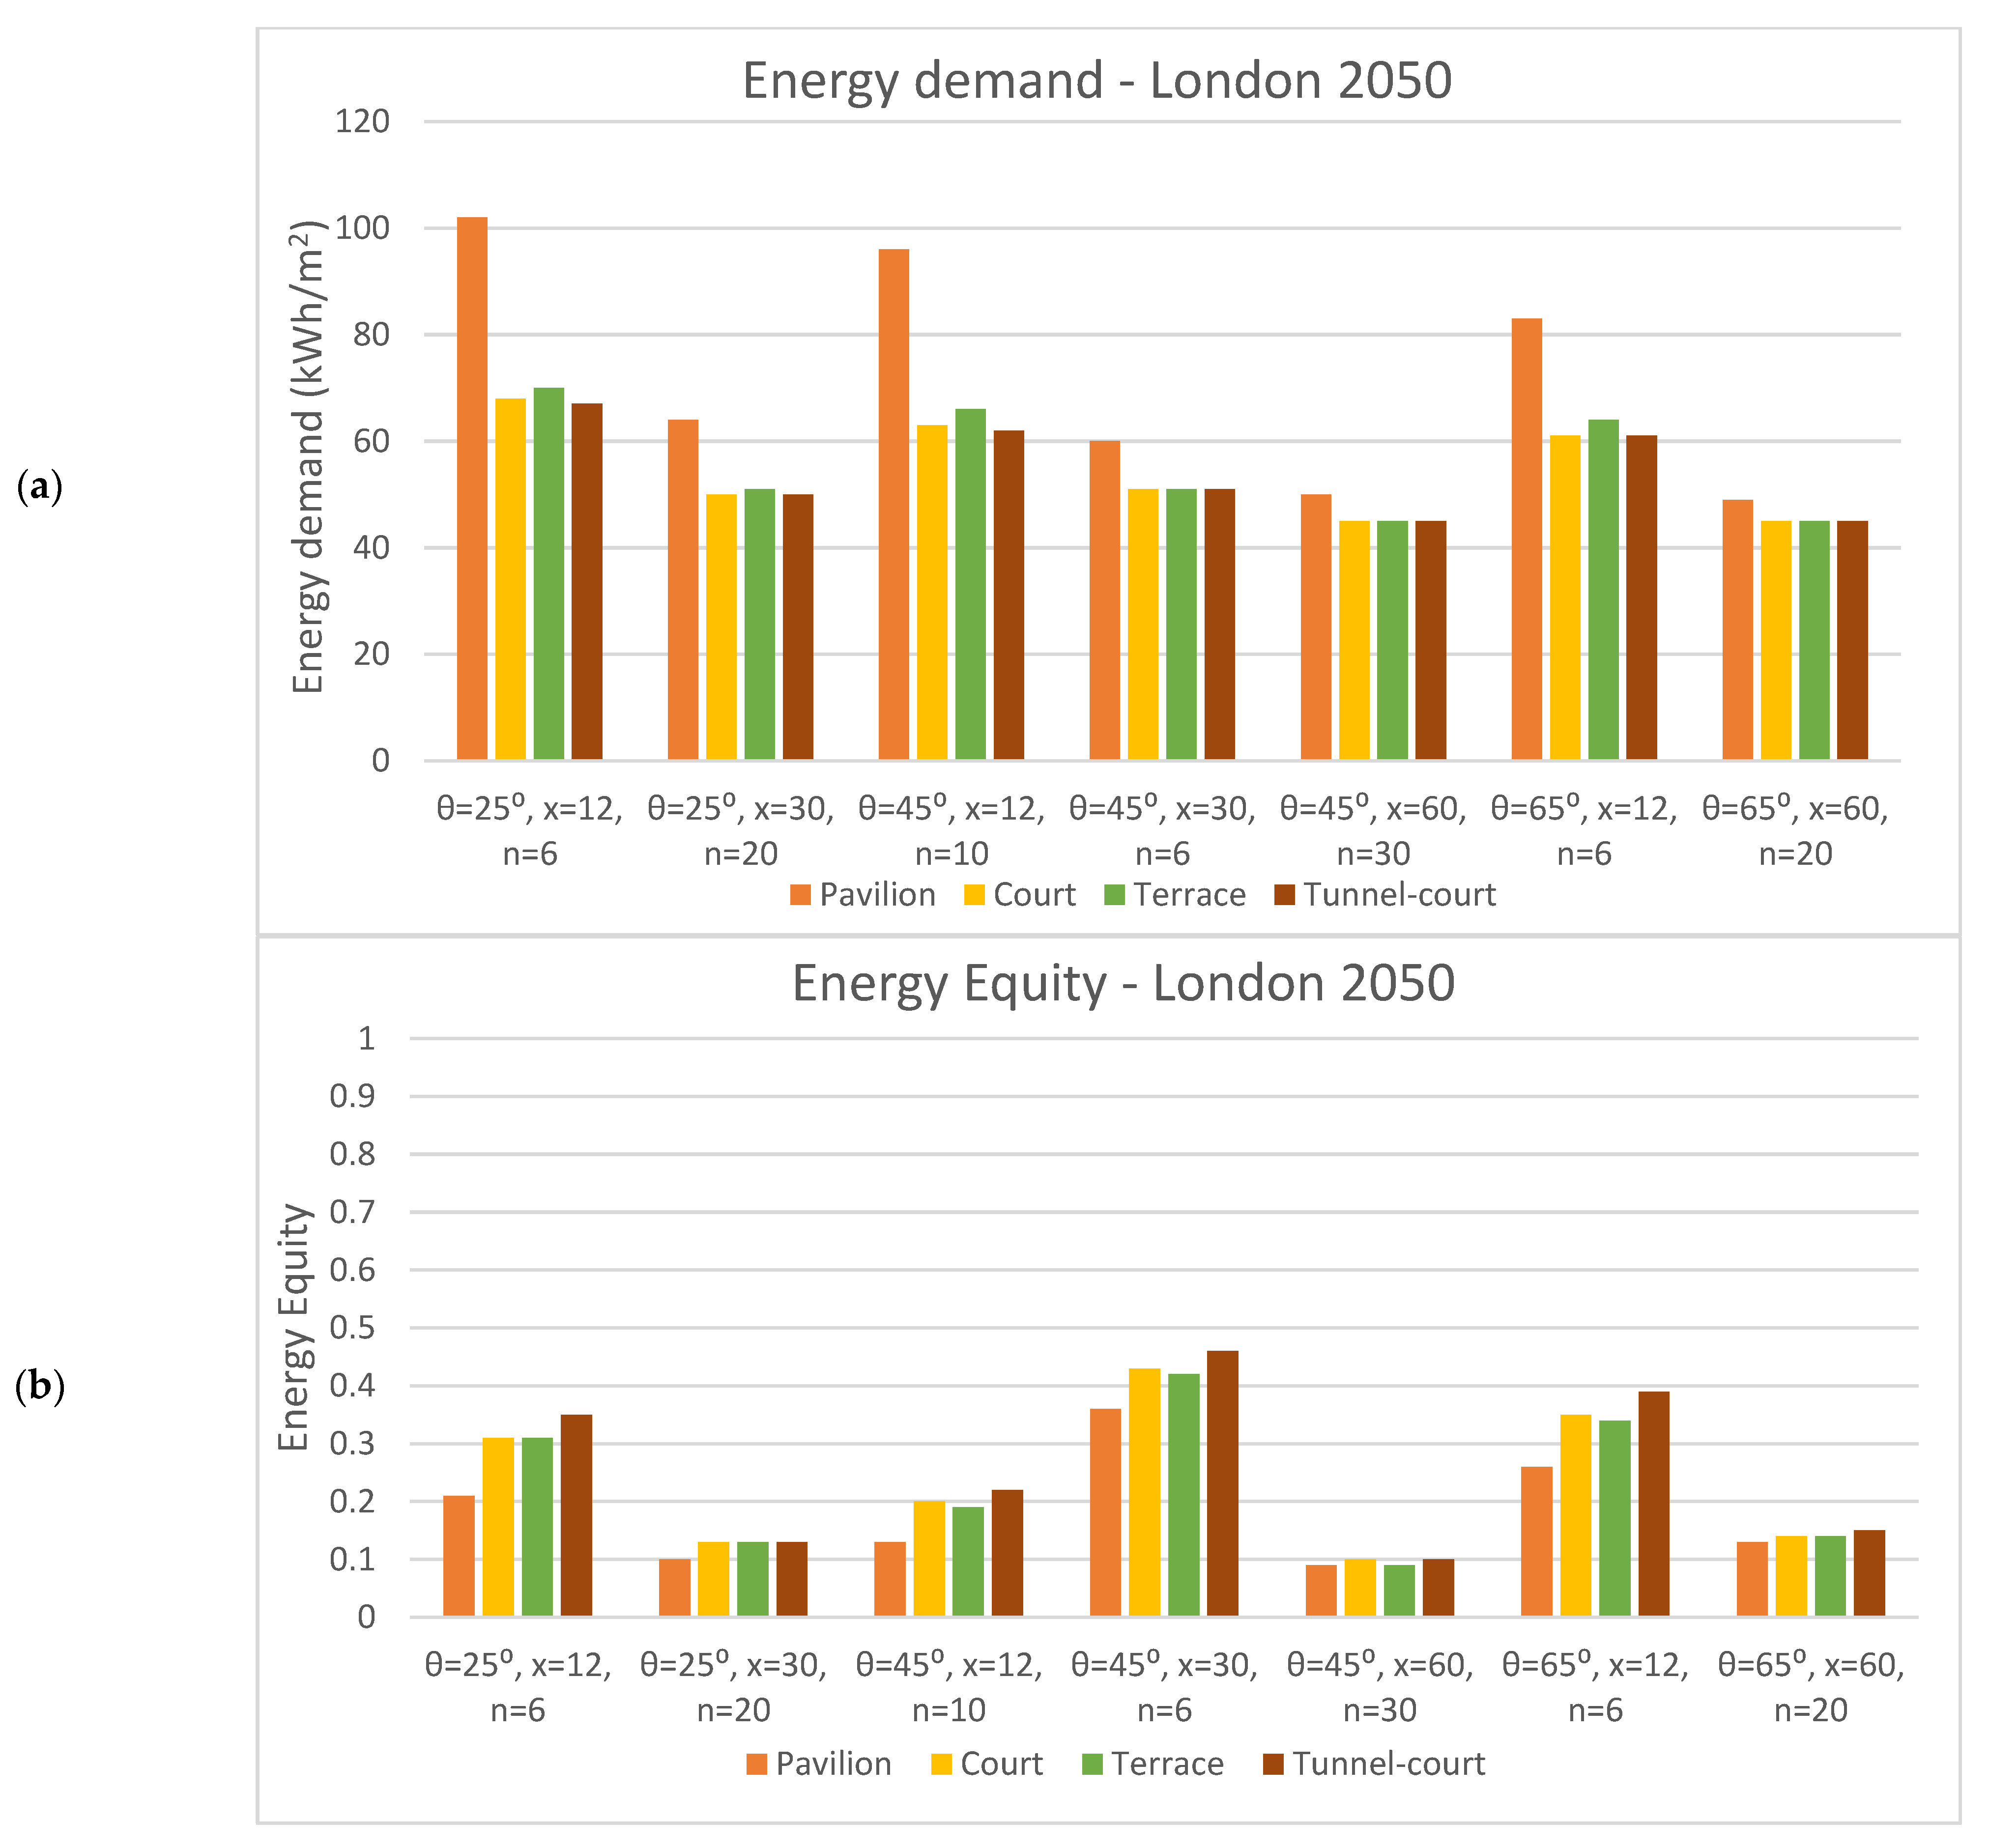
To analyse the energy performance of buildings with different built forms but with similar geometrical parameters, the data obtained from energy simulations are investigated and shown in Figure 9.
From Figure 9, it is observed that tunnel-court built form has the lowest energy demand and also gains the highest value of Energy Equity among all the built forms. In contrast, the pavilion form shows the poorest performance. The performance of terrace and court forms are worse than the tunnel-court form but better than pavilion. Compared to present climatic conditions in London, the outcome of this analysis shows a few important differences. In this analysis, the tunnel-court form shows the lowest energy demand whilst showing higher energy demand than court and terrace forms in the present scenario. Moreover, court form shows lower energy demand than terrace form, while court and terrace forms had identical energy demand in the present-day scenario. These two differences show that court and tunnel-court forms, both of which have an internal courtyard, perform better when cooling energy load is considered in addition to heating. It suggests that these two built forms are more advantageous in terms of energy for future urban developments of London to cope with changing climate, and provides policymakers with an adaptation strategy. Meanwhile, the domination of the Energy Equity of the tunnel-court form compared to the other built forms will be more significant in 2050 (Figure 9).

3.7. Comparison of the Building Energy Deman of 2050 with Present Time

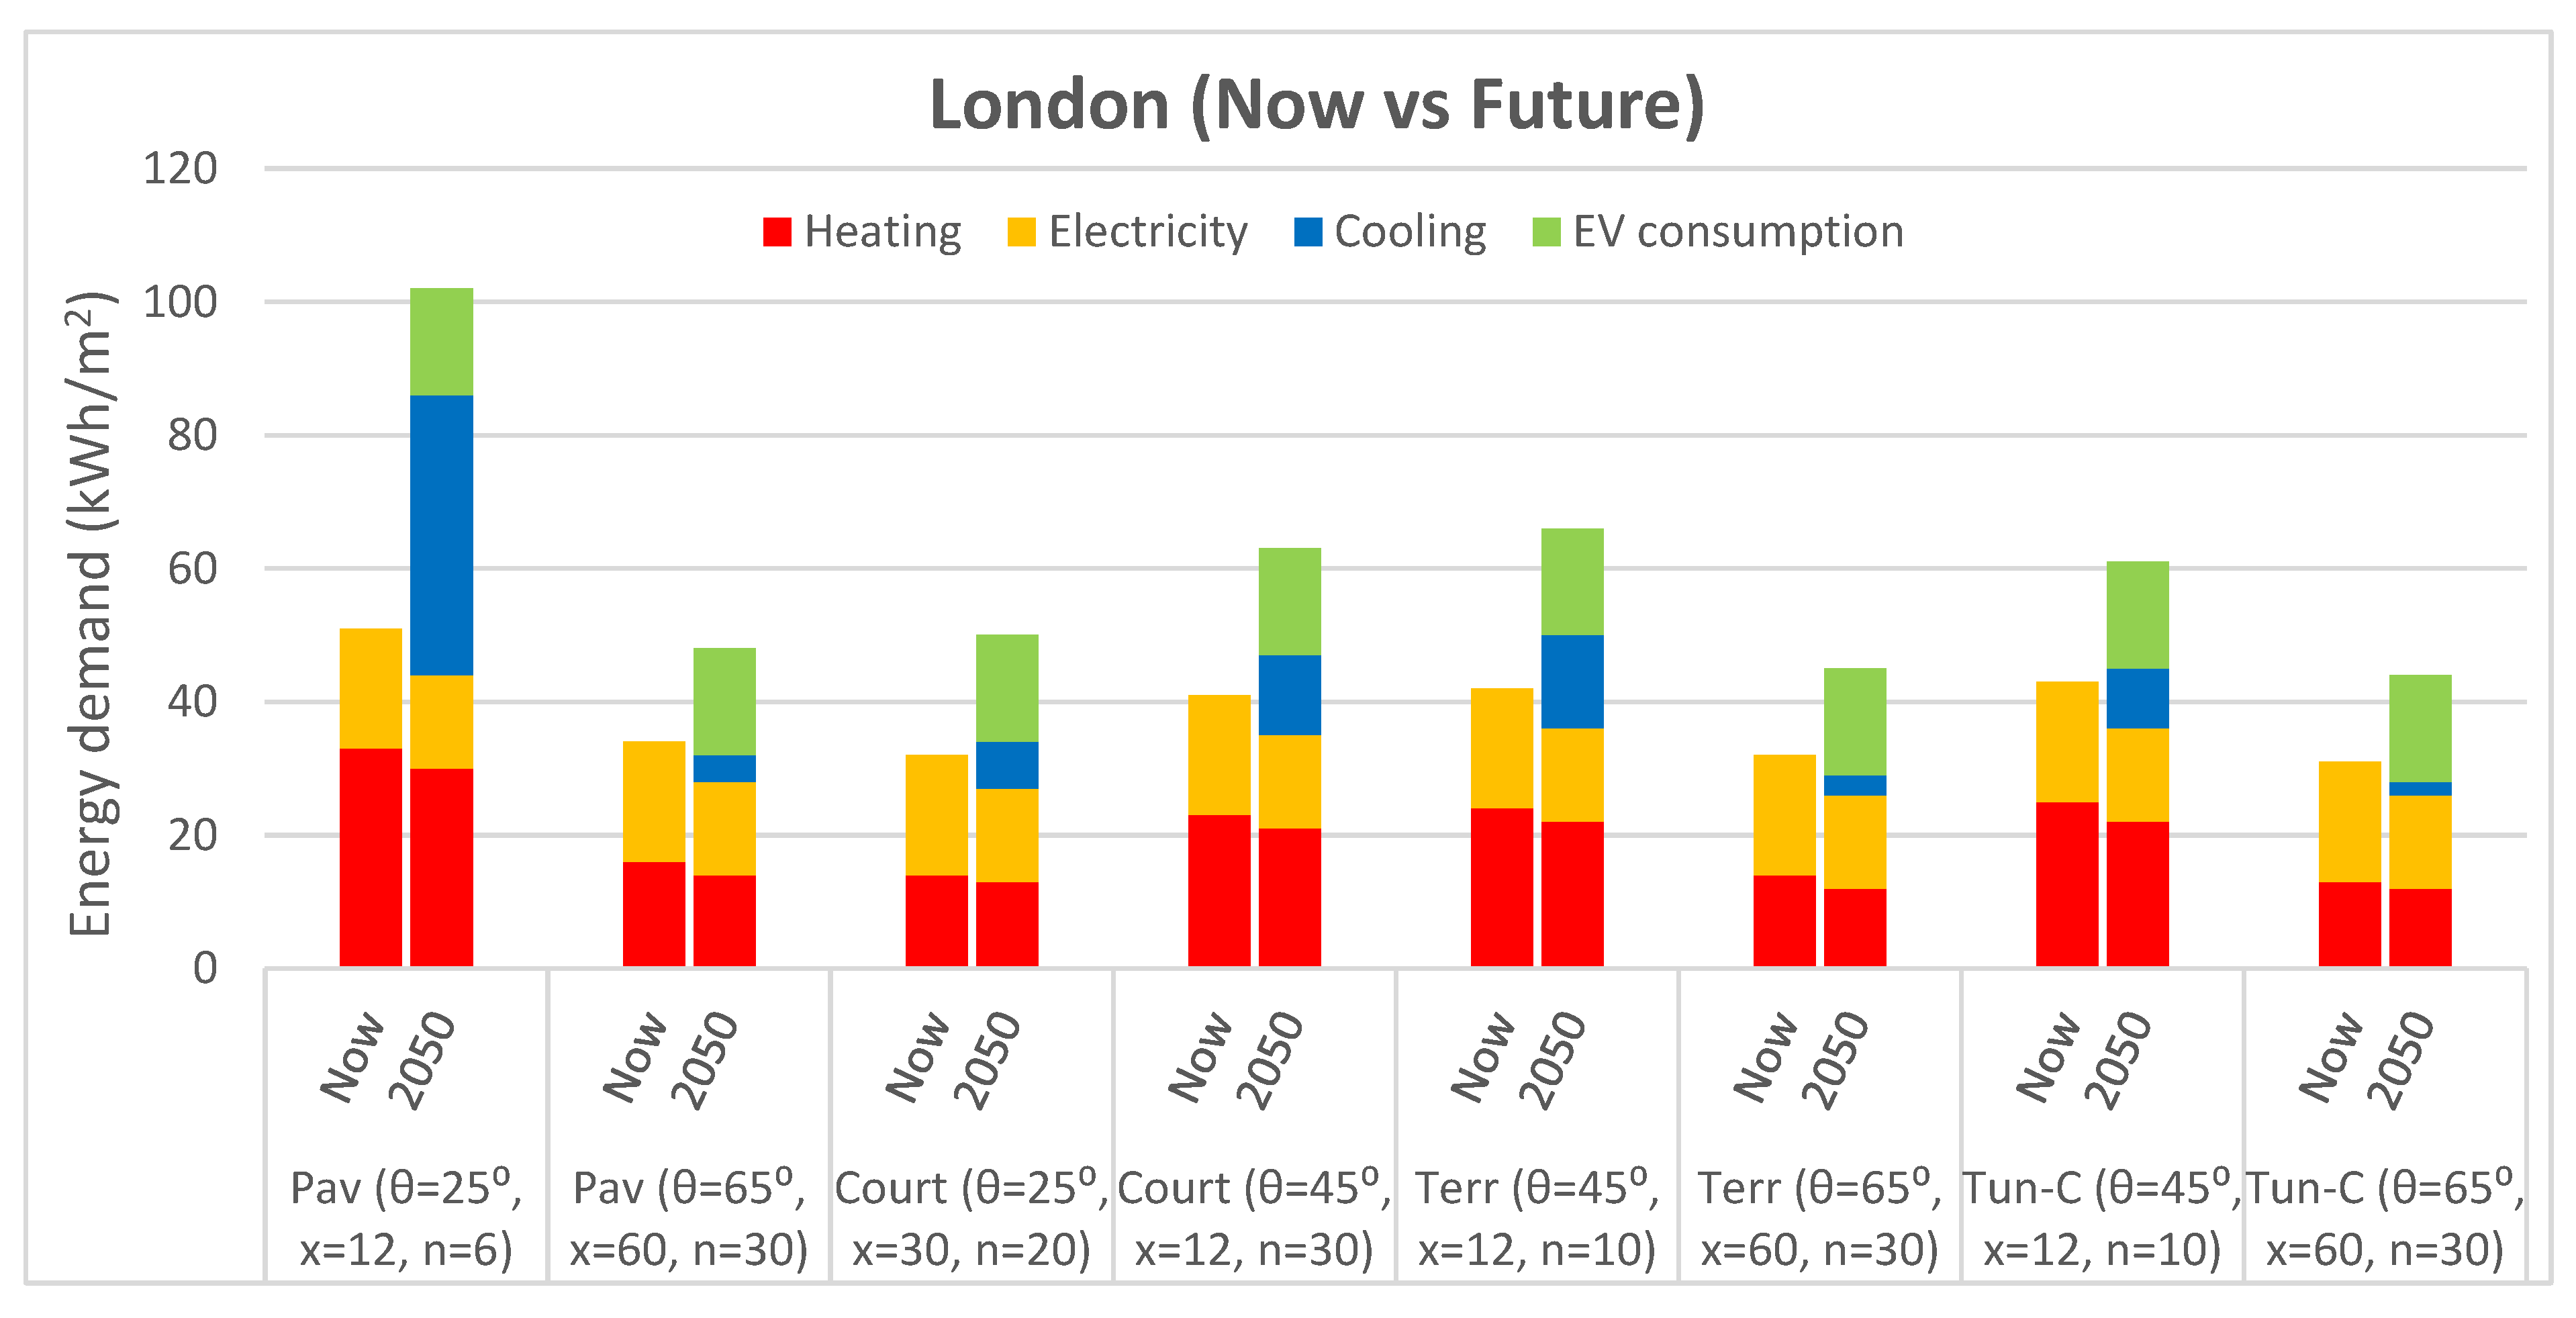
To predict changes in the building energy demand of different built forms and densities in 2050, the data obtained from the analysis of the future scenarios are compared with the results obtained using the present climate of London. The building energy demand of eight sample cases (out of more than 200 sets of data) are compared in the stacked bar chart shown in Figure 10.
From Figure 10, it can be seen that in all cases the total building energy demand in 2050 is significantly higher than at present due to several reasons: additional EV charging load (shown in green). This is equal to 16 kWh/m2/year for all cases since it is calculated according to the number of occupants, and since the occupant density is the same for all the cases, the value of EV consumption per m2 is equal for all the cases; there is an additional cooling load (shown in blue) that was disregarded for the present-day scenario according to the norms in the UK. Conversely, two other types of energy consumption are slightly reduced in 2050: (i) the heating load (shown in red) is lower in the future (between 8% and 15%) compared with the present scenario, and (ii) electricity consumption (shown in orange) is 18 kWh/m2/year for the present and 14 kWh/m2/year in 2050 due to consideration of technology advancement in home appliance energy efficiency.
On average, the total building energy demand in 2050 is 40% higher than at present due to the additional PV and cooling loads. An exceptional case where future building energy demand is much higher than at present (it is 100% higher) is the first case shown on the left side of Figure 10 (pavilion, θ = 45°, x = 12 and n = 6). The reason is the large amount of cooling demand (i.e., 42 kWh/m2/year) that is significantly higher (3-21x) than the cooling demand in the other cases. Indeed, as a pavilion with a small plan depth, its cooling load is higher than its heating load, which is among the rare cases with a heating to cooling ratio less than unity (as explained in Section 3.4).

4. Discussion

Several previous studies have confirmed that the overall building energy consumption will be higher in the future [10,90,91]. However, the percentage increase in previous studies is not as high as that presented here. The reason is that here the buildings are considered as prosumers and generate PV electricity to supply energy for building energy demand and EV consumption. Therefore, EV energy demand is added to the overall energy consumption of the buildings in the future scenario; otherwise, being a prosumer by itself does not mean having higher building energy demand. Furthermore, in this study, the cooling load was not considered for the present-day scenario; therefore, it gave more weight to the total energy demand of the future. Other studies have usually predicted lower heating demand and higher cooling demand for the future [6,8,10,80].
It should be noted that different studies have used alternative climate data sources that can cause divergence in the results due to the predictive nature of the future climate data. For instance, the weather file used by Wan, Li [91] includes information about dry-bulb temperature, wet-bulb temperature, global solar radiation, wind speed and wind direction. However, the weather file used for this study contains additional information regarding cloud cover fraction, precipitation, surface temperature and diffused horizontal radiation. These parameters can change the predicted climatic conditions and add more precision to the energy analysis results. Moreover, Kolokotroni, Ren [80] used UKCIP02 weather files that were available at the time of their study and they mentioned that the resulting weather files for the 2050s may overestimate the impact of climate change. Having considered the weather file generated by Meteonorm for this study, it shows that during the heating season the hourly air temperature in 2050 is not necessarily always higher than the weather file generated for the present climate case. For some days (and nights) in the future, the weather shows higher temperatures and the opposite in others. There are also more fluctuations between the temperature of daytime and night-time in 2050. Meanwhile, as mentioned earlier, the results of this study confirm that the amount of PV energy generation in 2050 is 0.6% lower than the present condition. This can be due to future changes in the relative portions of direct and diffuse radiation plus consideration of nebulosity in the Meteonorm weather file which is an important parameter to be considered for the future as more extreme weather is expected.
Eyre and Baruah [92] presented new scenarios for residential energy use in the UK to 2050 by considering factors such as population, as well as some systemically different approaches for delivering residential heat energy, and concluded that the future of UK residential space heating is very uncertain. The current building form and urban density of the neighbourhoods can lead to an increase in the energy demand [93]. It should be also noted that reducing cooling demand is more important than reducing heating demand in terms of environmental impact, even in a heating-dominated climate since providing cooling energy contributes to greater greenhouse gas emissions [80]. Therefore, to produce less emissions in the future of London’s built environment, deep plan court and tunnel-court buildings with a lower number of storeys and a greater cut-off angle are recommended.

5. Conclusions

The climate is changing across the globe due to global warming which, together with technological developments, will impact on city energy performance including building and transportation energy demand. This study considers London as an example to analyse future scenarios of changing climate and the penetration of EVs into the transportation network by 2050 (following the UK government commitments). It is assumed that they are charged by building-mounted PVs. The main conclusions from this study are summarised below:
  • The results show that by 2050 buildings with greater plan depth and lower number of storeys (being equivalent to high site coverage and low plot ratio) will acquire higher values of Energy Equity that increase the possibility of building energy self-sufficiency. Although this trend is similar to the present scenario, the magnitude of Energy Equity is considerably lower in the future because of (i) additional cooling loads, and (ii) added EV charging to the building load.
  • Unlike the present-day climate of London, increasing the cut-off angle mainly leads to a reduction in energy demand (with no effect on buildings with great plan depth), which shows the impact of having a cooling load as part of the building energy demand. It is also concluded that the building cooling load is more sensitive against the external environment changes such as varying the cut-off angle compared with heating loads.
  • Having a similar geometry, the tunnel-court form indicates the highest Energy Equity and the lowest energy demand, while the pavilion form shows the poorest performance. Generally, court and tunnel-court forms show better energy performance in future climate scenarios compared with their performance in the present climate. Hence, it can be advised that for future urban developments in London, these two built forms are more advantageous in terms of energy to accommodate the changing climate.
  • Finally, results of simulation trials indicate that the total building energy demand in 2050 is 40% higher, on average, than in the present climate, as a result of additional cooling load and EV charging consumption. This increase is much higher for buildings with a low heating to cooling ratio, which is the product of a specific combination of built form, density and geometrical parameters. For instance, this happens for buildings with small plan depth, a low cut-off angle and a high number of storeys, where their effect is magnified in pavilion and terrace forms. Hence, results from this study recommend that these configurations should be avoided for future urban developments in London to avoid excessive building cooling demand that has a higher contribution in environmental pollution compared with heating demand.
The framework proposed in this study can be used for any other geographical location to provide recommendations for optimising the future city energy performance with regard to the urban built form and density/geometry. The summary conclusions and recommendations are the combination of the adaptation and mitigation strategies that should be considered for addressing climate change. It also emphasises the reciprocal influence of cities and climate change not only because cities have significantly contributed to emissions due to their large energy consumption, but also climate change is forcing us to change the form of future cities in order to adapt to the changing climate.

6. Limitations

It should be noted that many assumptions can be taken into consideration that influence the predictive patterns of the future. The energy mix that is used in cities will be different and various types of fuels could be used [94]. For instance, PV panels with greater generation capacity might be developed [95], and more efficient building materials might be available to reduce heat loss [96]. Meanwhile, following the UK gas boiler ban for newbuild homes from 2025 [97], there might be no gas heating in 2050; therefore, this framework can be upgraded to comply with the new measures accordingly. This study acknowledges all the possible upcoming technological developments; however, it focuses on the impact of climate change and the utilisation of EVs. Meanwhile, parameters such as the conservation of the cultural heritage of the city can influence the future changes in the urban development of the city; however, these are out of the scope of this study.

Author Contributions

E.A.: conceptualisation, methodology, validation, formal analysis, investigation, resources, data curation, writing—original draft preparation, writing—review and editing, visualisation, and project administration. C.B.: conceptualisation, methodology, validation, formal analysis, resources, writing—review and editing, and supervision. A.E.: conceptualisation, methodology, validation, formal analysis, resources, writing—review and editing, and supervision. B.S.: conceptualisation, methodology, validation, formal analysis, resources, writing—review and editing, supervision, and project administration. I.V.: formal analysis, writing—review and editing, and funding acquisition. All authors have read and agreed to the published version of the manuscript.

Funding

This research received no external funding and the APC was funded by the University of Antwerp.

Conflicts of Interest

The authors declare no conflict of interest.

Appendix A

Figure A1. An exemplar Excel spreadsheet tool used for calculating the required parameters such as number of occupants for each model (before simulation) and processing the data obtained from simulation to calculate the required values such as electricity consumption, total energy demand per m2, PV generation, Energy Equity and EV consumption.
Energies 15 08592 g0a1

References

  1. Elnokaly, A.; Ayoub, M.; Elseragy, A. Parametric investigation of traditional vaulted roofs in hot-arid climates. Renew. Energy 2019, 138, 250–262. [Google Scholar] [CrossRef]
  2. Li, Y.; Wang, W.; Wang, Y.; Xin, Y.; He, T.; Zhao, G. A review of studies involving the effects of climate change on the energy consumption for building heating and cooling. Int. J. Environ. Res. Public Health 2021, 18, 40. [Google Scholar] [CrossRef] [PubMed]
  3. UN ESCAP. Accelerating SDG7 Achievement in the Time of COVID-19: Policy Briefs in Support of the High-Level Political Forum 2020; 2020; Available online: https://www.google.com/url?sa=t&rct=j&q=&esrc=s&source=web&cd=&cad=rja&uact=8&ved=2ahUKEwi8sZyl6bH7AhWR9jgGHcHBCVEQFnoECAgQAQ&url=https%3A%2F%2Fsustainabledevelopment.un.org%2Fcontent%2Fdocuments%2F26235UNFINALFINAL.pdf&usg=AOvVaw34s-tBP7qwXppDHeH_HBQX (accessed on 25 January 2021).
  4. Pyrgou, A.; Castaldo, V.L.; Pisello, A.L.; Cotana, F.; Santamouris, M. On the effect of summer heatwaves and urban overheating on building thermal-energy performance in central Italy. Sustain. Cities Soc. 2017, 28, 187–200. [Google Scholar] [CrossRef]
  5. Schaeffer, R.; Szklo, A.S.; de Lucena, A.F.P.; Borba, B.S.M.C.; Nogueira, L.P.P.; Fleming, F.P.; Troccoli, A.; Harrison, M.; Boulahya, M.S. Energy sector vulnerability to climate change: A review. Energy 2012, 38, 1–12. [Google Scholar] [CrossRef]
  6. Berger, M.; Worlitschek, J. The link between climate and thermal energy demand on national level: A case study on Switzerland. Energy Build. 2019, 202, 109372. [Google Scholar] [CrossRef]
  7. Masson, V.; Marchadier, C.; Adolphe, L.; Aguejdad, R.; Avner, P.; Bonhomme, M.; Bretagne, G.; Briottet, X.; Bueno, B.; De Munck, C. Adapting cities to climate change: A systemic modelling approach. Urban Clim. 2014, 10, 407–429. [Google Scholar] [CrossRef]
  8. Yang, Y.; Javanroodi, K.; Nik, V.M. Climate change and energy performance of European residential building stocks—A comprehensive impact assessment using climate big data from the coordinated regional climate downscaling experiment. Appl. Energy 2021, 298, 117246. [Google Scholar] [CrossRef]
  9. Tsirigoti, D.; Tsikaloudaki, K. The effect of climate conditions on the relation between energy efficiency and urban form. Energies 2018, 11, 582. [Google Scholar] [CrossRef] [Green Version]
  10. Mangan, S.D.; Oral, G.K. Impacts of future weather data on the energy performance of buildings in the context of urban geometry. Cogent Eng. 2020, 7, 1714112. [Google Scholar] [CrossRef]
  11. Bamdad, K.; Matour, S.; Izadyar, N.; Omrani, S. Impact of climate change on energy saving potentials of natural ventilation and ceiling fans in mixed-mode buildings. Build. Environ. 2022, 209, 108662. [Google Scholar] [CrossRef]
  12. Campagna, L.M.; Fiorito, F. On the Impact of Climate Change on Building Energy Consumptions: A Meta-Analysis. Energies 2022, 15, 354. [Google Scholar] [CrossRef]
  13. Hosseini, M.; Javanroodi, K.; Nik, V.M. High-resolution impact assessment of climate change on building energy performance considering extreme weather events and microclimate–Investigating variations in indoor thermal comfort and degree-days. Sustain. Cities Soc. 2022, 78, 103634. [Google Scholar] [CrossRef]
  14. Ewing, R.; Rong, F. The impact of urban form on US residential energy use. Hous. Policy Debate 2008, 19, 1–30. [Google Scholar] [CrossRef]
  15. Große, J.; Fertner, C.; Groth, N.B. Urban structure, energy and planning: Findings from three cities in Sweden, Finland and Estonia. Urban Plan. 2016, 1, 24–40. [Google Scholar] [CrossRef] [Green Version]
  16. Guhathakurta, S.; Williams, E. Impact of urban form on energy use in central city and suburban neighborhoods: Lessons from the phoenix metropolitan region. Energy Procedia 2015, 75, 2928–2933. [Google Scholar] [CrossRef] [Green Version]
  17. Byrd, H. The Power of Subarbia. In Infinite Suburbia; Berger, A., Kotkin, J., Guzman, C.B., Eds.; Princeton Architectural Press: New York, NY, USA, 2017; pp. 608–623. [Google Scholar]
  18. Appavou, F.; Brown, A.; Epp, B.; Leidreiter, A.; Lins, C.; Murdock, H.; Musolino, E.; Petrichenko, K.; Farrell, T.; Krader, T. Renewables 2017 global status report. In Renewable Energy Policy Network for the 21st Century; REN21: Paris, France, 2017. [Google Scholar]
  19. Jones, S.R.; Gillott, M.; Boukhanouf, R.; Walker, G.; Tunzi, M.; Tetlow, D.; Rodrigues, L.; Sumner, M. A system design for distributed energy generation in low-temperature district heating (LTDH) networks. Future Cities Environ. 2019, 5, 2. [Google Scholar] [CrossRef] [Green Version]
  20. Waibel, C.; Evins, R.; Carmeliet, J. Co-simulation and optimization of building geometry and multi-energy systems: Interdependencies in energy supply, energy demand and solar potentials. Appl. Energy 2019, 242, 1661–1682. [Google Scholar] [CrossRef]
  21. Delmastro, C.; Mutani, G.; Schranz, L.; Vicentini, G. The role of urban form and socio-economic variables for estimating the building energy savings potential at the urban scale. Int. J. Heat Technol. 2015, 33, 91–100. [Google Scholar] [CrossRef]
  22. Rickwood, P.; Glazebrook, G.; Searle, G. Urban structure and energy—A review. Urban Policy Res. 2008, 26, 57–81. [Google Scholar] [CrossRef] [Green Version]
  23. Silva, M.; Oliveira, V.; Leal, V. Urban Form and Energy Demand: A Review of Energy-relevant Urban Attributes. J. Plan. Lit. 2017, 32, 346–365. [Google Scholar] [CrossRef]
  24. Bhiwapurkar, P. Determinants of Urban Energy Use: Density and Urban Form. In Proceedings of the ARCC Conference Repository, Charlotte, NC, USA, 27–30 March 2013. [Google Scholar]
  25. Resch, E.; Bohne, R.A.; Kvamsdal, T.; Lohne, J. Impact of urban density and building height on energy use in cities. Energy Procedia 2016, 96, 800–814. [Google Scholar] [CrossRef] [Green Version]
  26. Steemers, K. Energy and the city: Density, buildings and transport. Energy Build. 2003, 35, 3–14. [Google Scholar] [CrossRef]
  27. Güneralp, B.; Zhou, Y.; Ürge-Vorsatz, D.; Gupta, M.; Yu, S.; Patel, P.L.; Fragkias, M.; Li, X.; Seto, K.C. Global scenarios of urban density and its impacts on building energy use through 2050. Proc. Natl. Acad. Sci. USA 2017, 114, 8945–8950. [Google Scholar] [CrossRef] [PubMed] [Green Version]
  28. Steadman, P.; Hamilton, I.; Evans, S. Energy and urban built form: An empirical and statistical approach. Build. Res. Inf. 2014, 42, 17–31. [Google Scholar] [CrossRef] [Green Version]
  29. Boukarta, S.; Berezowska, E. Exploring the Energy Implication of Urban Density in Residential Buildings. J. Appl. Eng. Sci. 2017, 7, 7–14. [Google Scholar] [CrossRef] [Green Version]
  30. Hachem, C.; Athienitis, A.; Fazio, P. Investigation of solar potential of housing units in different neighborhood designs. Energy Build. 2011, 43, 2262–2273. [Google Scholar] [CrossRef]
  31. Mohajeri, N.; Upadhyay, G.; Gudmundsson, A.; Assouline, D.; Kämpf, J.; Scartezzini, J.-L. Effects of urban compactness on solar energy potential. Renew. Energy 2016, 93, 469–482. [Google Scholar] [CrossRef] [Green Version]
  32. Hargreaves, A.; Cheng, V.; Deshmukh, S.; Leach, M.; Steemers, K. Forecasting how residential urban form affects the regional carbon savings and costs of retrofitting and decentralized energy supply. Appl. Energy 2017, 186, 549–561. [Google Scholar] [CrossRef] [Green Version]
  33. Byrd, H.; Ho, A.; Sharp, B.; Kumar-Nair, N. Measuring the solar potential of a city and its implications for energy policy. Energy Policy 2013, 61, 944–952. [Google Scholar] [CrossRef] [Green Version]
  34. Echenique, M.H.; Hargreaves, A.J.; Mitchell, G.; Namdeo, A. Growing cities sustainably: Does urban form really matter? J. Am. Plan. Assoc. 2012, 78, 121–137. [Google Scholar] [CrossRef]
  35. Rafiee, A.; Dias, E.; Koomen, E. Analysing the impact of spatial context on the heat consumption of individual households. Renew. Sustain. Energy Rev. 2019, 112, 461–470. [Google Scholar] [CrossRef]
  36. Leng, H.; Ma, Y.; Wong, N.H.; Ming, T. Urban morphology and building heating energy consumption: Evidence from Harbin, a severe cold region city. Energy Build. 2020, 224, 110143. [Google Scholar] [CrossRef]
  37. Perera, A.; Coccolo, S.; Scartezzini, J.-L.; Mauree, D. Quantifying the impact of urban climate by extending the boundaries of urban energy system modeling. Appl. Energy 2018, 222, 847–860. [Google Scholar] [CrossRef]
  38. March, L. Elementary models of built forms. In Urban Space and Structures; Martin, L., March, L., Eds.; Cambridge University Press: Cambridge, UK, 1972; pp. 55–96. [Google Scholar]
  39. Ratti, C.; Raydan, D.; Steemers, K. Building form and environmental performance: Archetypes, analysis and an arid climate. Energy Build. 2003, 35, 49–59. [Google Scholar] [CrossRef]
  40. Emmanuel, R.; Steemers, K. Connecting the realms of urban form, density and microclimate. Build. Res. Inf. 2018, 48, 804–808. [Google Scholar] [CrossRef] [Green Version]
  41. Lee, G.; Jeong, Y. Impact of Urban and Building Form and Microclimate on the Energy Consumption of Buildings-Based on Statistical Analysis. J. Asian Archit. Build. Eng. 2017, 16, 565–572. [Google Scholar] [CrossRef] [Green Version]
  42. Morganti, M.; Coch Roura, H.; Cecere, C. The effects of urban obstructions in Mediterranean climates: Built form typology, density and energy. ACE Archit. City Environ. 2012, 7, 13–26. [Google Scholar] [CrossRef] [Green Version]
  43. Ahmadian, E.; Sodagar, B.; Mills, G.; Byrd, H.; Bingham, C.; Zolotas, A. Sustainable cities: The relationships between urban built forms and density indicators. Cities 2019, 95, 102382. [Google Scholar] [CrossRef]
  44. Ahmadian, E.; Sodagar, B.; Bingham, C.; Elnokaly, A.; Mills, G. Effect of urban built form and density on building energy performance in temperate climates. Energy Build. 2021, 236, 110762. [Google Scholar] [CrossRef]
  45. Hukkalainen, M.; Virtanen, M.; Paiho, S.; Airaksinen, M. Energy planning of low carbon urban areas-Examples from Finland. Sustain. Cities Soc. 2017, 35, 715–728. [Google Scholar] [CrossRef]
  46. Kaemco. CitySim Pro. Available online: www.kaemco.ch/download.php (accessed on 19 December 2018).
  47. Bazazzadeh, H.; Pilechiha, P.; Nadolny, A.; Mahdavinejad, M. The Impact Assessment of Climate Change on Building Energy Consumption in Poland. Energies 2021, 14, 4084. [Google Scholar] [CrossRef]
  48. Dorer, V.; Allegrini, J.; Orehounig, K.; Moonen, P.; Upadhyay, G.; Kämpf, J.; Carmeliet, J. Modelling the urban microclimate and its impact on the energy demand of buildings and building clusters. Proc. BS 2013, 2013, 3483–3489. [Google Scholar]
  49. Walter, E.; Kämpf, J.H. A verification of CitySim results using the BESTEST and monitored consumption values. In Proceedings of the 2nd Building Simulation Applications Conference, Bozen-Bolzano, Italy, 4–6 February 2015; pp. 215–222. [Google Scholar]
  50. Coccolo, S.; Kämpf, J.H.; Scartezzini, J.-L. Design in the desert. A Bioclimatic project with urban energy modelling. In Proceedings of the 13th Conference of International Building Performance Simulation Association, Chambéry, France, 26–28 August 2013. [Google Scholar]
  51. Meteonorm. Meteonorm Software. Available online: https://meteonorm.com/en/ (accessed on 1 February 2021).
  52. Masson-Delmotte, V.; Zhai, P.; Pörtner, H.-O.; Roberts, D.; Skea, J.; Shukla, P.R.; Pirani, A.; Moufouma-Okia, W.; Péan, C.; Pidcock, R. Global Warming of 1.5 °C; An IPCC Special Report on the Impacts of Global Warming of 1.5 °C; IPCC: Cambridge, UK; New York, NY, USA, 2018.
  53. UK Government. UK Becomes First Major Economy to Pass Net Zero Emissions Law. Department for Business, Energy & Industrial Strategy. Available online: https://www.gov.uk/government/news/uk-becomes-first-major-economy-to-pass-net-zero-emissions-law (accessed on 25 January 2021).
  54. World Wide Fund for Nature UK. Reducing Carbon Emissions in the UK. Available online: https://www.wwf.org.uk/what-we-do/projects/reducing-carbon-emissions-uk?pc=AUT005007&gclsrc=aw.ds&&gclid=CjwKCAiAxp-ABhALEiwAXm6IycfdtCYdytBvNxYcgUW8tkgQ0sKoTv19urUcCc6R4tyuDPDHO77QCRoCwhQQAvD_BwE&gclsrc=aw.ds (accessed on 25 January 2021).
  55. Nakicenovic, N.; Swart, R. Emissions Scenarios. Special Report of the Intergovernmental Panel on Climate Change; Cambridge University Press: Cambridge, UK, 2000. [Google Scholar]
  56. IPCC. IPCC Fifth Assessment Synthesis Report; Intergovernmental Panel on Climate Change: Geneva, Switzerland, 2014.
  57. Xu, P.; Huang, Y.J.; Miller, N.; Schlegel, N.; Shen, P. Impacts of climate change on building heating and cooling energy patterns in California. Energy 2012, 44, 792–804. [Google Scholar] [CrossRef]
  58. Gabbatiss, J. Transport Becomes Most Polluting UK Sector as Greenhouse Gas Emissions Drop Overall. Independent. Available online: https://www.independent.co.uk/climate-change/news/air-pollution-uk-transport-most-polluting-sector-greenhouse-gas-emissions-drop-carbon-dioxide-climate-change-a8196866.html (accessed on 16 February 2021).
  59. Energy Saving Trust. On the Path to Net Zero: Transport. Available online: https://energysavingtrust.org.uk/path-net-zero-transport/ (accessed on 25 January 2021).
  60. Ahmadian, E.; Byrd, H.; Sodagar, B.; Matthewman, S.; Kenney, C.; Mills, G. Energy and the form of cities: The counterintuitive impact of disruptive technologies. Archit. Sci. Rev. 2019, 62, 145–151. [Google Scholar] [CrossRef] [Green Version]
  61. Nikonowicz, L.B.; Milewski, J. Virtual Power Plants-general review: Structure, application and optimization. J. Power Technol. 2012, 92, 135. [Google Scholar]
  62. Edwardes-Evans, H. UK Smart Export Guarantee to Reward Prosumers from 2020; S & P Global: London, UK; Available online: https://www.spglobal.com/commodity-insights/en/market-insights/latest-news/electric-power/061119-uk-smart-export-guarantee-to-reward-prosumers-from-2020 (accessed on 18 May 2022).
  63. Mengelkamp, E.; Notheisen, B.; Beer, C.; Dauer, D.; Weinhardt, C. A blockchain-based smart grid: Towards sustainable local energy markets. Comput. Sci.-Res. Dev. 2018, 33, 207–214. [Google Scholar] [CrossRef]
  64. Pieroni, A.; Scarpato, N.; Di Nunzio, L.; Fallucchi, F.; Raso, M. Smarter City: Smart Energy Grid based on Blockchain Technology. Int. J. Adv. Sci. Eng. Inf. Technol. 2018, 8, 298–306. [Google Scholar] [CrossRef]
  65. Zero Carbon Futures. London Electric Vehicle Infrastructure Delivery Plan; Zero Carbon Futures: London, UK, 2019. [Google Scholar]
  66. Liao, W.; Xu, S.; Heo, Y. Evaluation of model fidelity for solar analysis in the context of distributed PV integration at urban scale. Build. Simul. 2021, 15, 3–16. [Google Scholar] [CrossRef]
  67. Feist, W.; Pfluger, R.; Kaufmann, B.; Schnieders, J.; Kah, O. Passive house planning package 2007. In Specifications for Quality Approved Passive Houses; echnical Information PHI-2007/1 (E); Passivhaus Institut: Darmstadt, Germany, 2007. [Google Scholar]
  68. Hopkin, C.; Spearpoint, M.; Hopkin, D.; Wang, Y. Residential occupant density distributions derived from English Housing Survey data. Fire Saf. J. 2019, 104, 147–158. [Google Scholar] [CrossRef] [Green Version]
  69. The Faraday Institution. The Road to Electrification—From the Internal Combustion Engine to the Battery Electric Vehicle; The Faraday Institution: Didcot, UK, 2019. [Google Scholar]
  70. Department for Transport. The Road to Zero: Next Steps towards Cleaner Road Transport and Delivering our Industrial Strategy; Department of Transport: London, UK, 2018.
  71. Barrett, S.; Wills, J.; Washington-Ihieme, M. Reclaim the Kerb: The Future of Parking and Kerbside Management. Center for London. Available online: https://www.centreforlondon.org/reader/parking-kerbside-mangement/chapter-1/#car-ownership-in-london-has-changed-little-over-time (accessed on 25 January 2021).
  72. Transport for London. Roads Task Force—Technical Note 12. In How Many Cars Are There in London and Who Owns Them? Available online: https://docplayer.net/150497-Roads-task-force-technical-note-12-how-many-cars-are-there-in-london-and-who-owns-them.html (accessed on 25 January 2021).
  73. Statistica. Number of Households in the United Kingdom (UK) in 2019, by Size (in 1000). Available online: https://www.statista.com/statistics/281627/households-in-the-united-kingdom-uk-by-size/ (accessed on 25 January 2021).
  74. Mayor of London. Context and Strategy. Available online: https://www.london.gov.uk/what-we-do/planning/london-plan/current-london-plan/london-plan-chapter-one-context-and-strategy-5#:~:text=However%2C%20the%20Census%20that%20year,projected%20scale%20of%20household%20growth (accessed on 25 January 2021).
  75. UK Government. Vehicle Mileage and Occupancy; Department for Transport: London, UK, 2020.
  76. Electric Vehicle Database. Energy Consumption of Electric Vehicles. Available online: https://ev-database.uk/cheatsheet/energy-consumption-electric-car (accessed on 25 January 2021).
  77. Rodrigues, L.T.; Gillott, M.; Tetlow, D. Summer overheating potential in a low-energy steel frame house in future climate scenarios. Sustain. Cities Soc. 2013, 7, 1–15. [Google Scholar] [CrossRef]
  78. Hanlon, H.M.; Bernie, D.; Carigi, G.; Lowe, J.A. Future changes to high impact weather in the UK. Clim. Change 2021, 166, 1–23. [Google Scholar] [CrossRef]
  79. Hayles, C.S.; Huddleston, M.; Chinowsky, P.; Helman, J. Summertime impacts of climate change on dwellings in Wales, UK. Build. Environ. 2022, 219, 109185. [Google Scholar] [CrossRef]
  80. Kolokotroni, M.; Ren, X.; Davies, M.; Mavrogianni, A. London’s urban heat island: Impact on current and future energy consumption in office buildings. Energy Build. 2012, 47, 302–311. [Google Scholar] [CrossRef] [Green Version]
  81. Javanroodi, K.; Mahdavinejad, M.; Nik, V.M. Impacts of urban morphology on reducing cooling load and increasing ventilation potential in hot-arid climate. Appl. Energy 2018, 231, 714–746. [Google Scholar] [CrossRef]
  82. Collins, L.; Natarajan, S.; Levermore, G. Climate change and future energy consumption in UK housing stock. Build. Serv. Eng. Res. Technol. 2010, 31, 75–90. [Google Scholar] [CrossRef]
  83. Gupta, R.; Gregg, M. Using UK climate change projections to adapt existing English homes for a warming climate. Build. Environ. 2012, 55, 20–42. [Google Scholar] [CrossRef]
  84. Amoako-Attah, J.; Bahadori-Jahromi, A. Impact of future climate change on UK building performance. Adv. Environ. Res. 2013, 2, 203–227. [Google Scholar] [CrossRef]
  85. Roselli, C.; Sasso, M. Integration between electric vehicle charging and PV system to increase self-consumption of an office application. Energy Convers. Manag. 2016, 130, 130–140. [Google Scholar] [CrossRef]
  86. Bansal, P.; Vineyard, E.; Abdelaziz, O. Advances in household appliances—A review. Appl. Therm. Eng. 2011, 31, 3748–3760. [Google Scholar] [CrossRef]
  87. Borg, S.P.; Kelly, N. The effect of appliance energy efficiency improvements on domestic electric loads in European households. Energy Build. 2011, 43, 2240–2250. [Google Scholar] [CrossRef]
  88. Nikoofard, S.; Ugursal, V.I.; Beausoleil-Morrison, I. Effect of external shading on household energy requirement for heating and cooling in Canada. Energy Build. 2011, 43, 1627–1635. [Google Scholar] [CrossRef]
  89. Mitchell, J.W.; Braun, J.E. Principles of Heating, Ventilation, and Air Conditioning in Buildings; John Wiley & Sons: Hoboken, NJ, USA, 2012. [Google Scholar]
  90. Jylhä, K.; Jokisalo, J.; Ruosteenoja, K.; Pilli-Sihvola, K.; Kalamees, T.; Seitola, T.; Mäkelä, H.M.; Hyvönen, R.; Laapas, M.; Drebs, A. Energy demand for the heating and cooling of residential houses in Finland in a changing climate. Energy Build. 2015, 99, 104–116. [Google Scholar] [CrossRef]
  91. Wan, K.K.; Li, D.H.; Liu, D.; Lam, J.C. Future trends of building heating and cooling loads and energy consumption in different climates. Build. Environ. 2011, 46, 223–234. [Google Scholar] [CrossRef]
  92. Eyre, N.; Baruah, P. Uncertainties in future energy demand in UK residential heating. Energy Policy 2015, 87, 641–653. [Google Scholar] [CrossRef]
  93. Perera, A.; Javanroodi, K.; Nik, V.M. Climate resilient interconnected infrastructure: Co-optimization of energy systems and urban morphology. Appl. Energy 2021, 285, 116430. [Google Scholar] [CrossRef]
  94. Weijermars, R.; Taylor, P.; Bahn, O.; Das, S.R.; Wei, Y.-M. Review of models and actors in energy mix optimization–can leader visions and decisions align with optimum model strategies for our future energy systems? Energy Strategy Rev. 2012, 1, 5–18. [Google Scholar] [CrossRef] [Green Version]
  95. Al-Waeli, A.H.; Sopian, K.; Kazem, H.A.; Chaichan, M.T. Photovoltaic/Thermal (PV/T) systems: Status and future prospects. Renew. Sustain. Energy Rev. 2017, 77, 109–130. [Google Scholar] [CrossRef]
  96. Hussain, A.; Kamal, M.A. Energy efficient sustainable building materials: An overview. In Key Engineering Materials; Trans Tech Publications Ltd.: Zurich, Switzerland, 2015; pp. 38–50. [Google Scholar]
  97. EDF Energy. UK Gas Boiler Ban—Everything You Need to Know. Available online: https://www.edfenergy.com/heating/advice/uk-boiler-ban (accessed on 25 October 2022).
Figure 1. Geometrical models of the built forms, developed in AutoCAD: (a) pavilion, (b) terrace, (c) court, (d) tunnel-court built forms (top), and section showing the cut-off angle (down) (adopted from [43]).
Energies 15 08592 g001
Figure 2. Prediction of carbon dioxide emissions in different IPCC scenarios (adopted from Nakicenovic and Swart [55]).
Energies 15 08592 g002
Figure 3. The schematic of the method used for calculation of EVs energy consumption.
Energies 15 08592 g003
Figure 4. Trend of uptake of EVs into the UK market from 2020 to 2040.
Energies 15 08592 g004
Figure 5. Model of the neighbourhood with a series of similar buildings with (a) pavilion, (b) court, (c) terrace, (d) tunnel-court forms for energy simulation purpose (black circle shows the target building).
Energies 15 08592 g005
Figure 6. Correlation of building energy demand (including EV consumption) with urban built form and density for (a) pavilion, (b) terrace, (c) court, (d) tunnel-court built forms for London case study in 2050.
Energies 15 08592 g006
Figure 7. Correlation of Energy Equity indicator with urban built form and density for (a) pavilion, (b) terrace, (c) court, (d) tunnel-court built forms for London case study in 2050.
Energies 15 08592 g007aEnergies 15 08592 g007b
Figure 8. Prediction of the impact of the cut-off angle on building energy demand in London 2050 (a) pavilion, (b) court, (c) terrace and (d) tunnel-court built form.
Energies 15 08592 g008
Figure 9. Comparison of the predicted building energy performance of the studied built forms with the same cut-off angles, plan depths and number of storeys in London 2050: (a) energy demand and (b) Energy Equity.
Energies 15 08592 g009
Figure 10. Comparison between the present and future (2050) building energy demand in London.
Energies 15 08592 g010
Publisher’s Note: MDPI stays neutral with regard to jurisdictional claims in published maps and institutional affiliations.