Atmospheric Drivers of Wind Turbine Blade Leading Edge Erosion: Review and Recommendations for Future Research
Abstract
1. Introduction
1.1. Wind Turbine Blade Leading Edge Erosion
- (i)
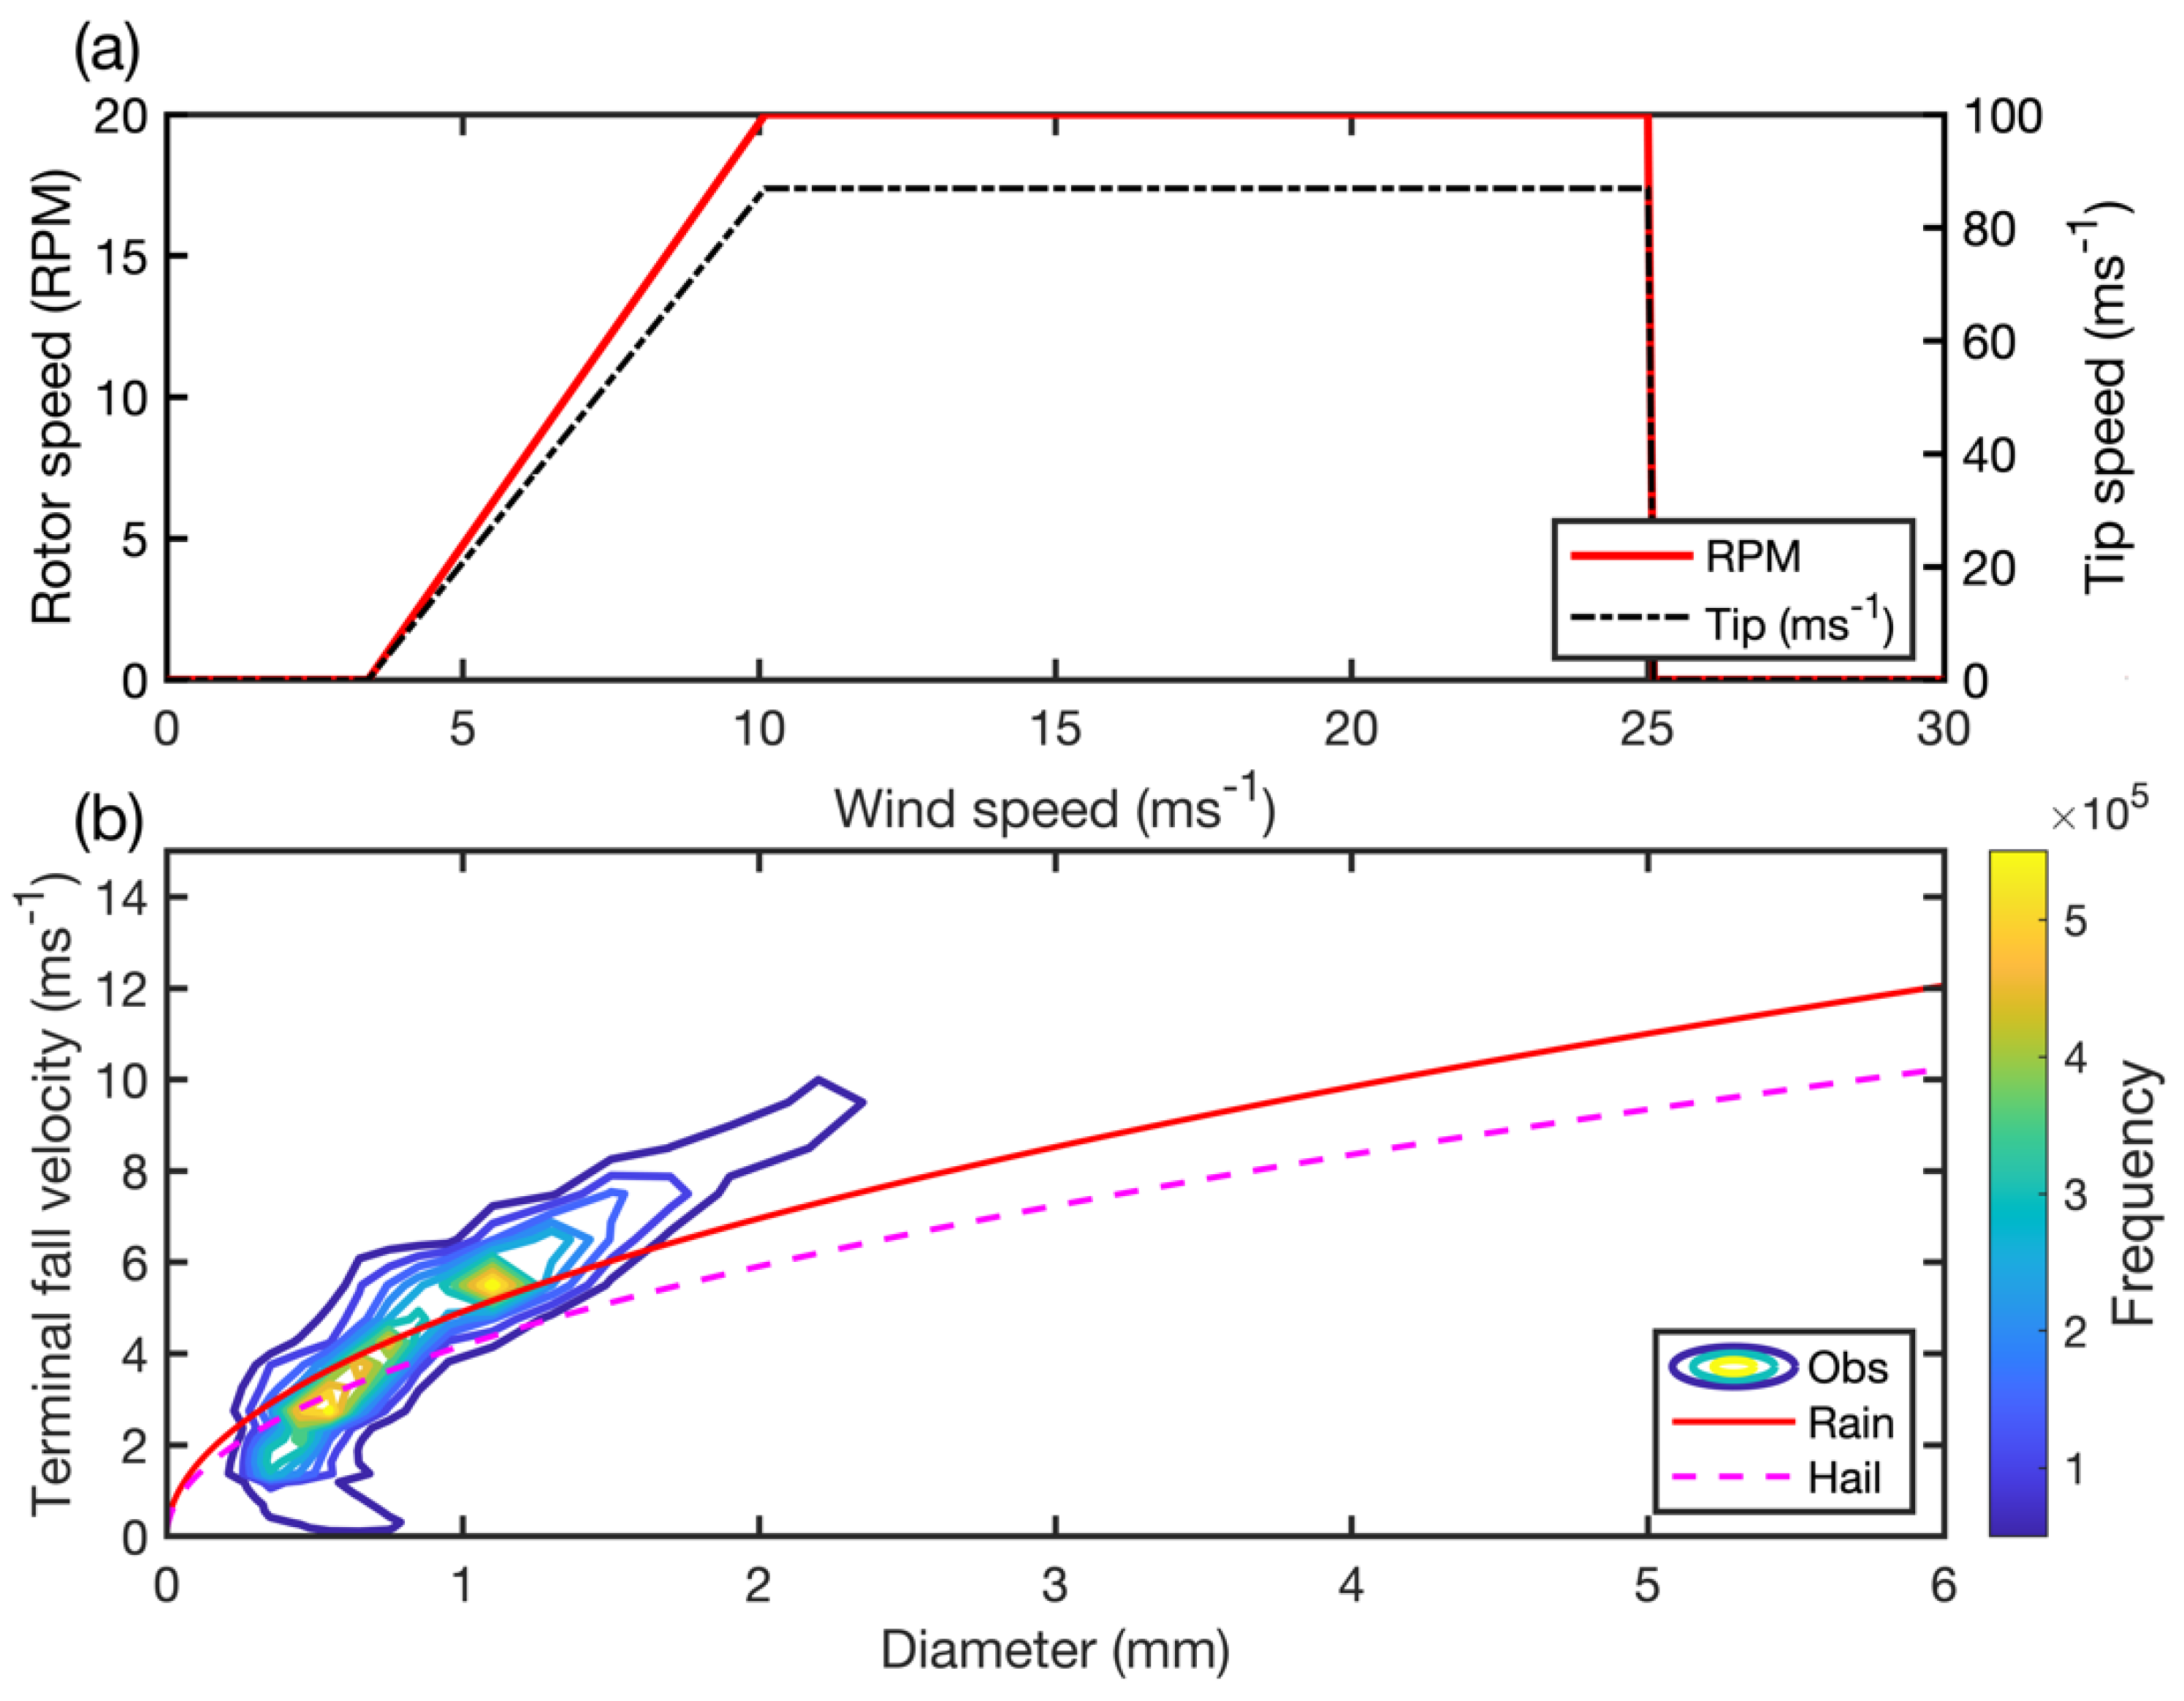
- The closing velocity between the hydrometeors and the blade. Variations in wind turbine rotational speed are a function of incident wind speed (WS) at the hub-height (Figure 1a). The rotational speed of the wind turbine blades during typical operation exceeds the terminal fall velocity (vt) of hydrometeors and hence generally dominates the closing velocity between falling hydrometeors and wind turbine blades.
- (ii)
- The number, size and phase of hydrometeors that impact the blade leading edge. The incubation, transition and steady-state progression of damage on leading edge [48] differs as a function of precipitation climate. There is evidence that larger drops are of greater importance in dictating the incubation period and that smaller drops are critical in the transition and steady-state progression [49]. Further, the materials response to hail (ice) differs from that to collisions with rain (liquid) droplets [35]. The maximum von-Mises stress created by impact of a 10 mm diameter hailstone on a blade leading edge greatly exceeds that from a rain droplet of equivalent size and closing velocity due to differences in mass and hardness [35]. Recent laboratory-based research found that for hailstone with diameters of 15 and 20 mm as few as five impacts at a closing velocity of ≥ 110 ms−1 were needed to cause damage to a glass fibre reinforced plastic composite coated with polyurethane [50].
1.2. Hydrometeor Droplet Size Distributions
1.3. Spatial Variability in the Primary Drivers of Leading Edge Erosion
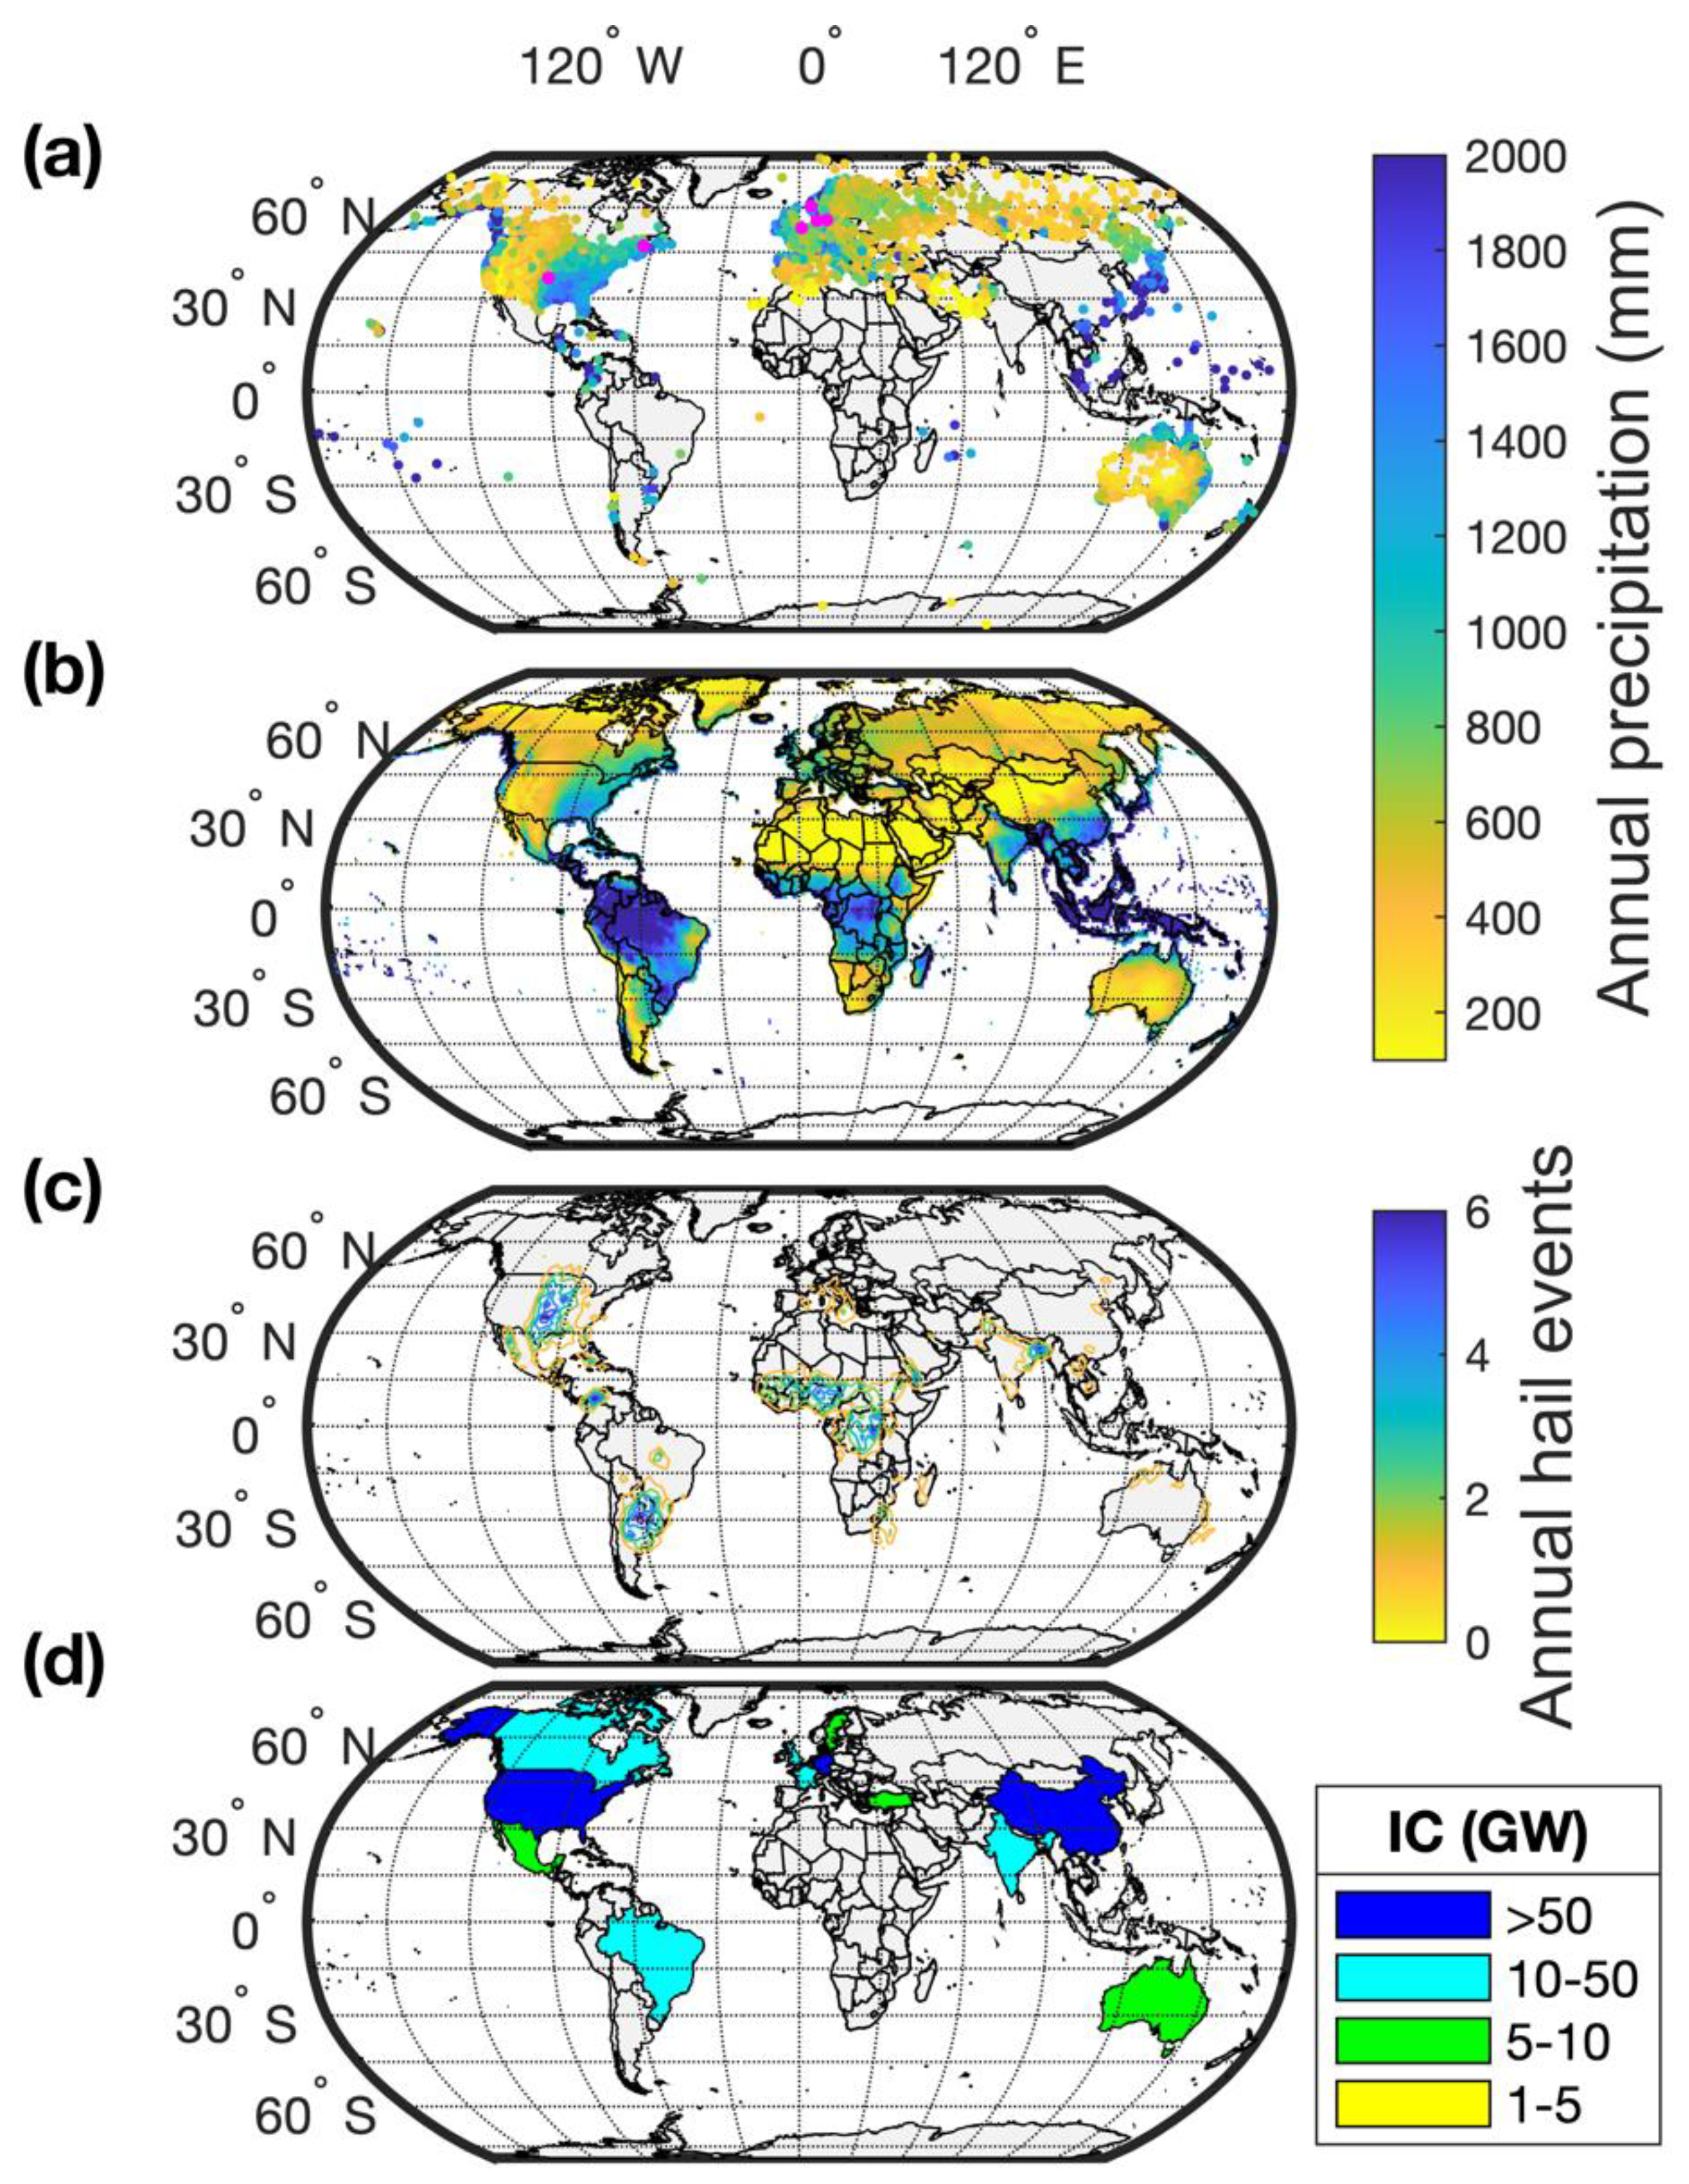
1.4. Objectives
- (1)
- Review and summarize metrologies for measuring RR and DSD. Because of our focus is on wind turbine blade LEE, we concentrate on performance at high rainfall rates, for larger diameter hydrometeors and for detection of solid hydrometeors (hail and graupel).
- (2)
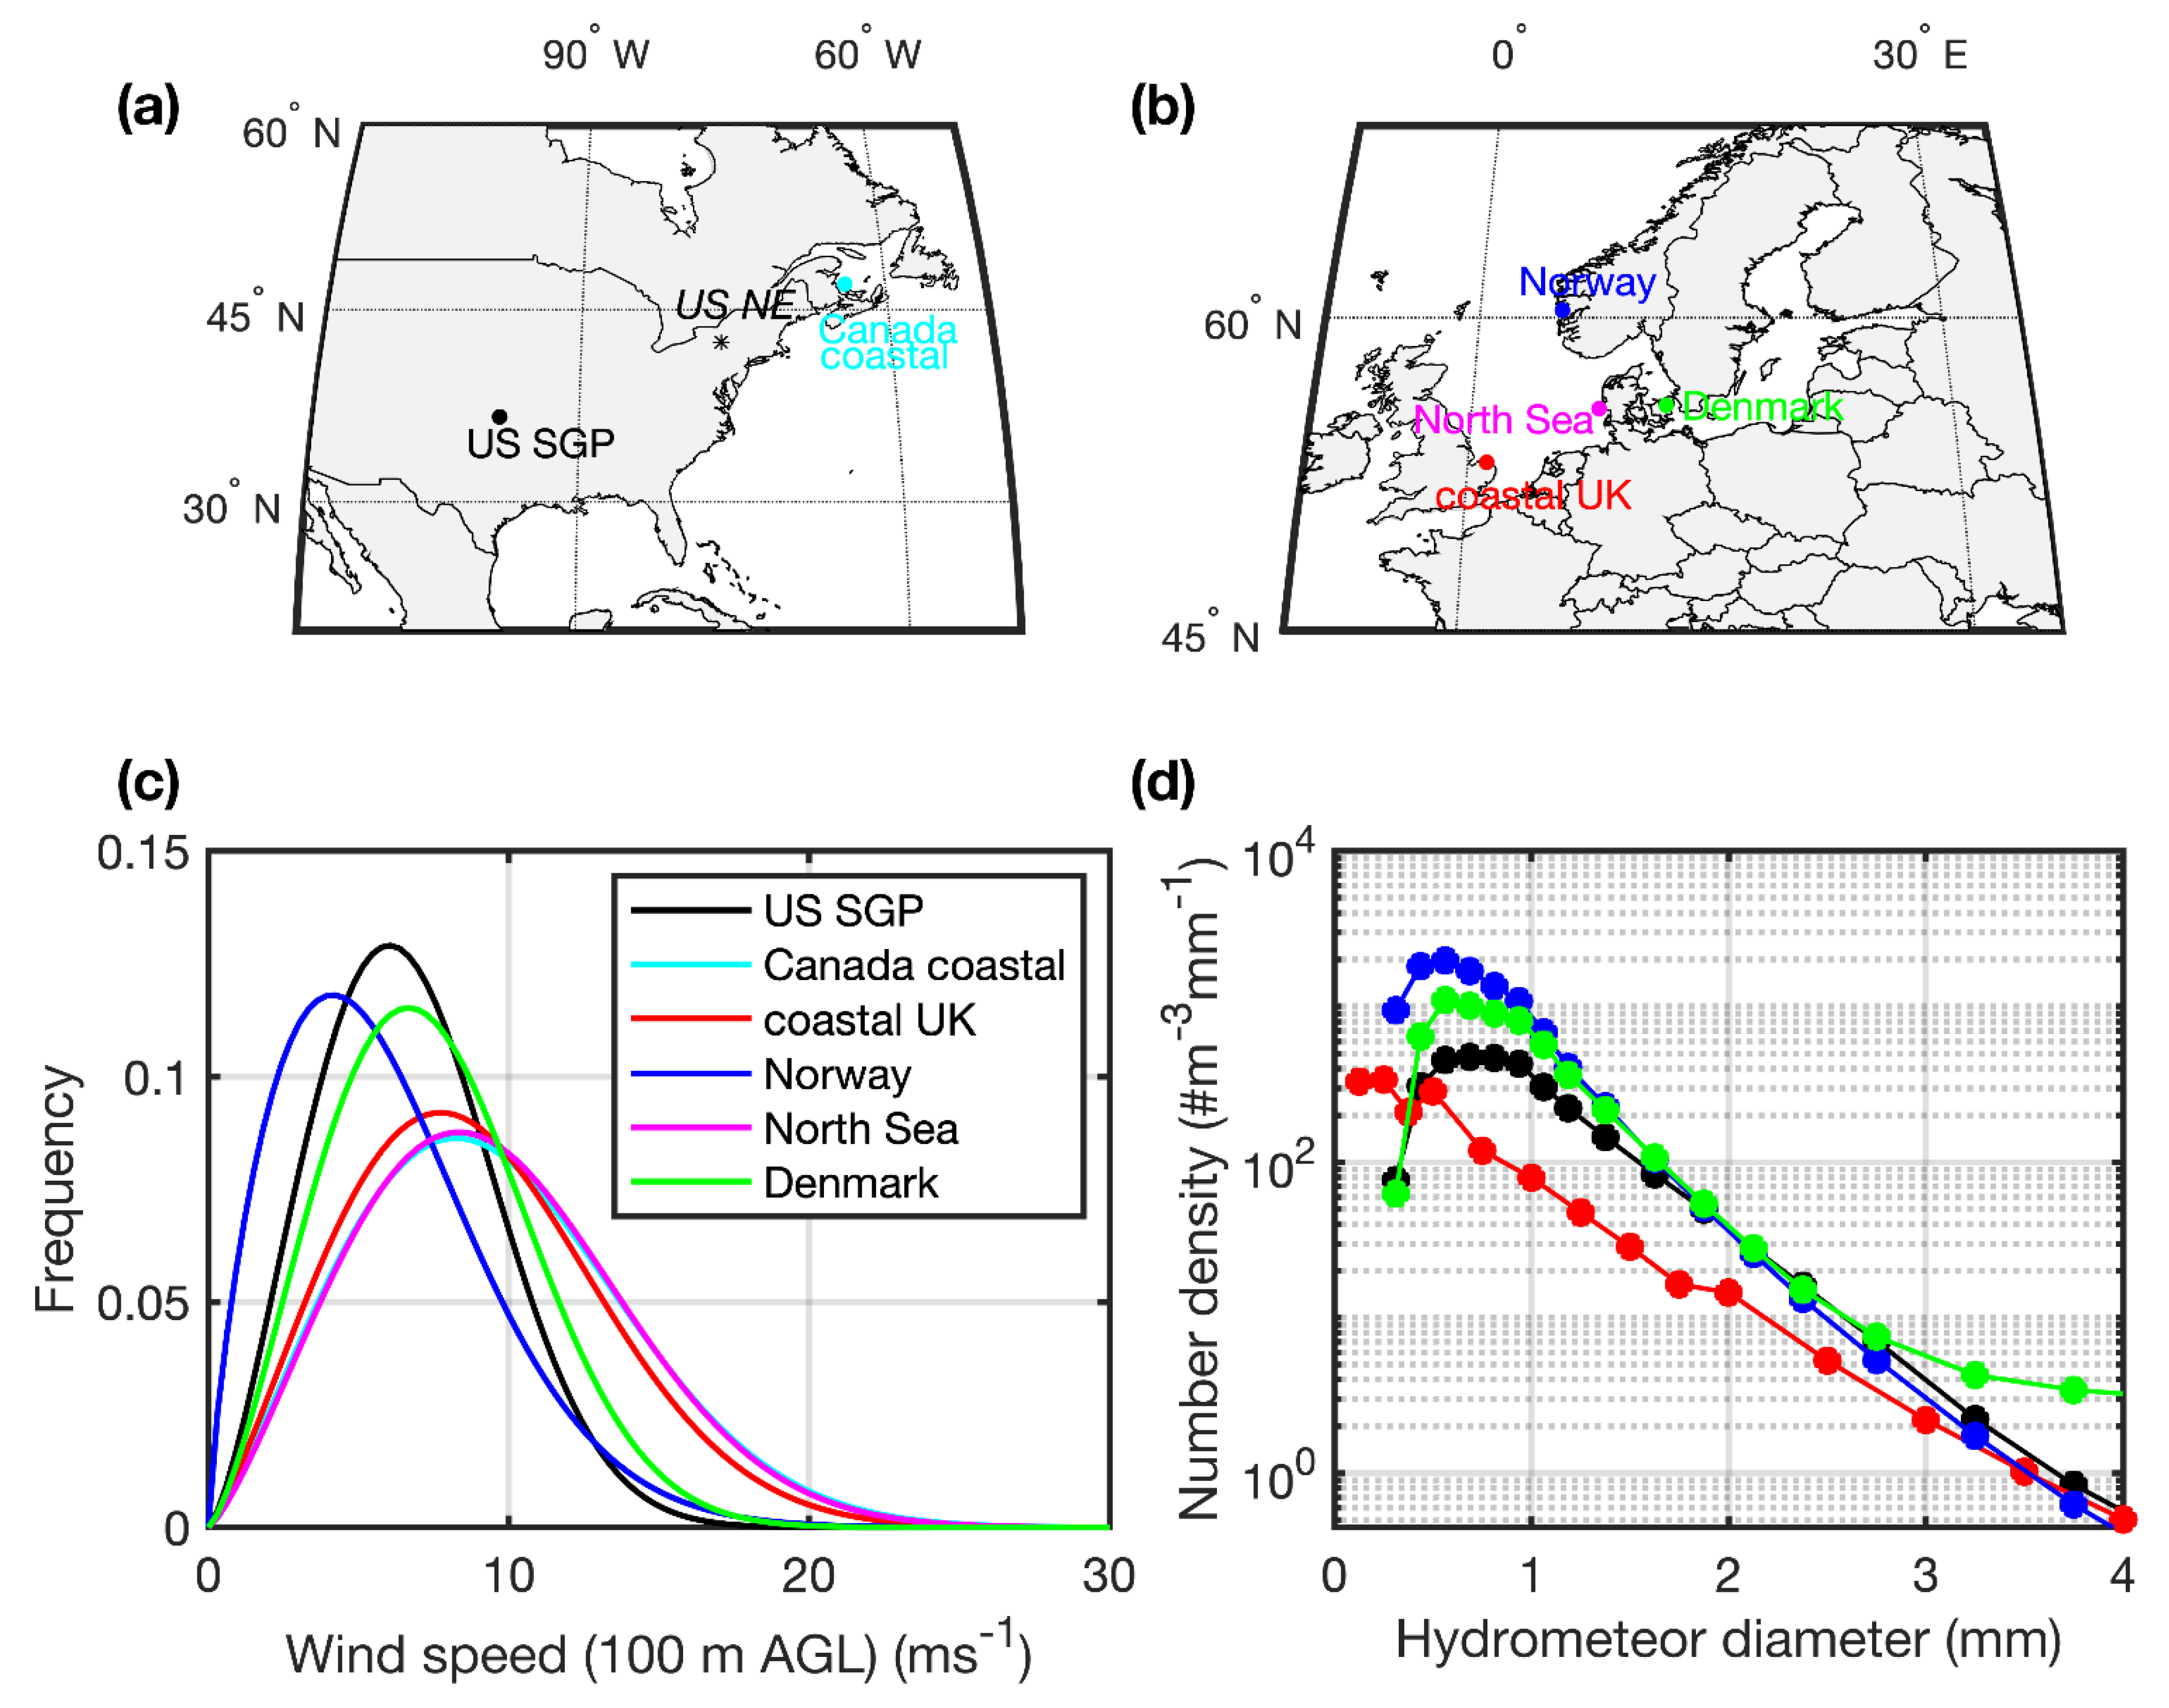
- Summarize aspects of hydroclimates (e.g., RR, hail frequency) at study locations with high wind energy penetration and/or high wind energy potential.
- (3)
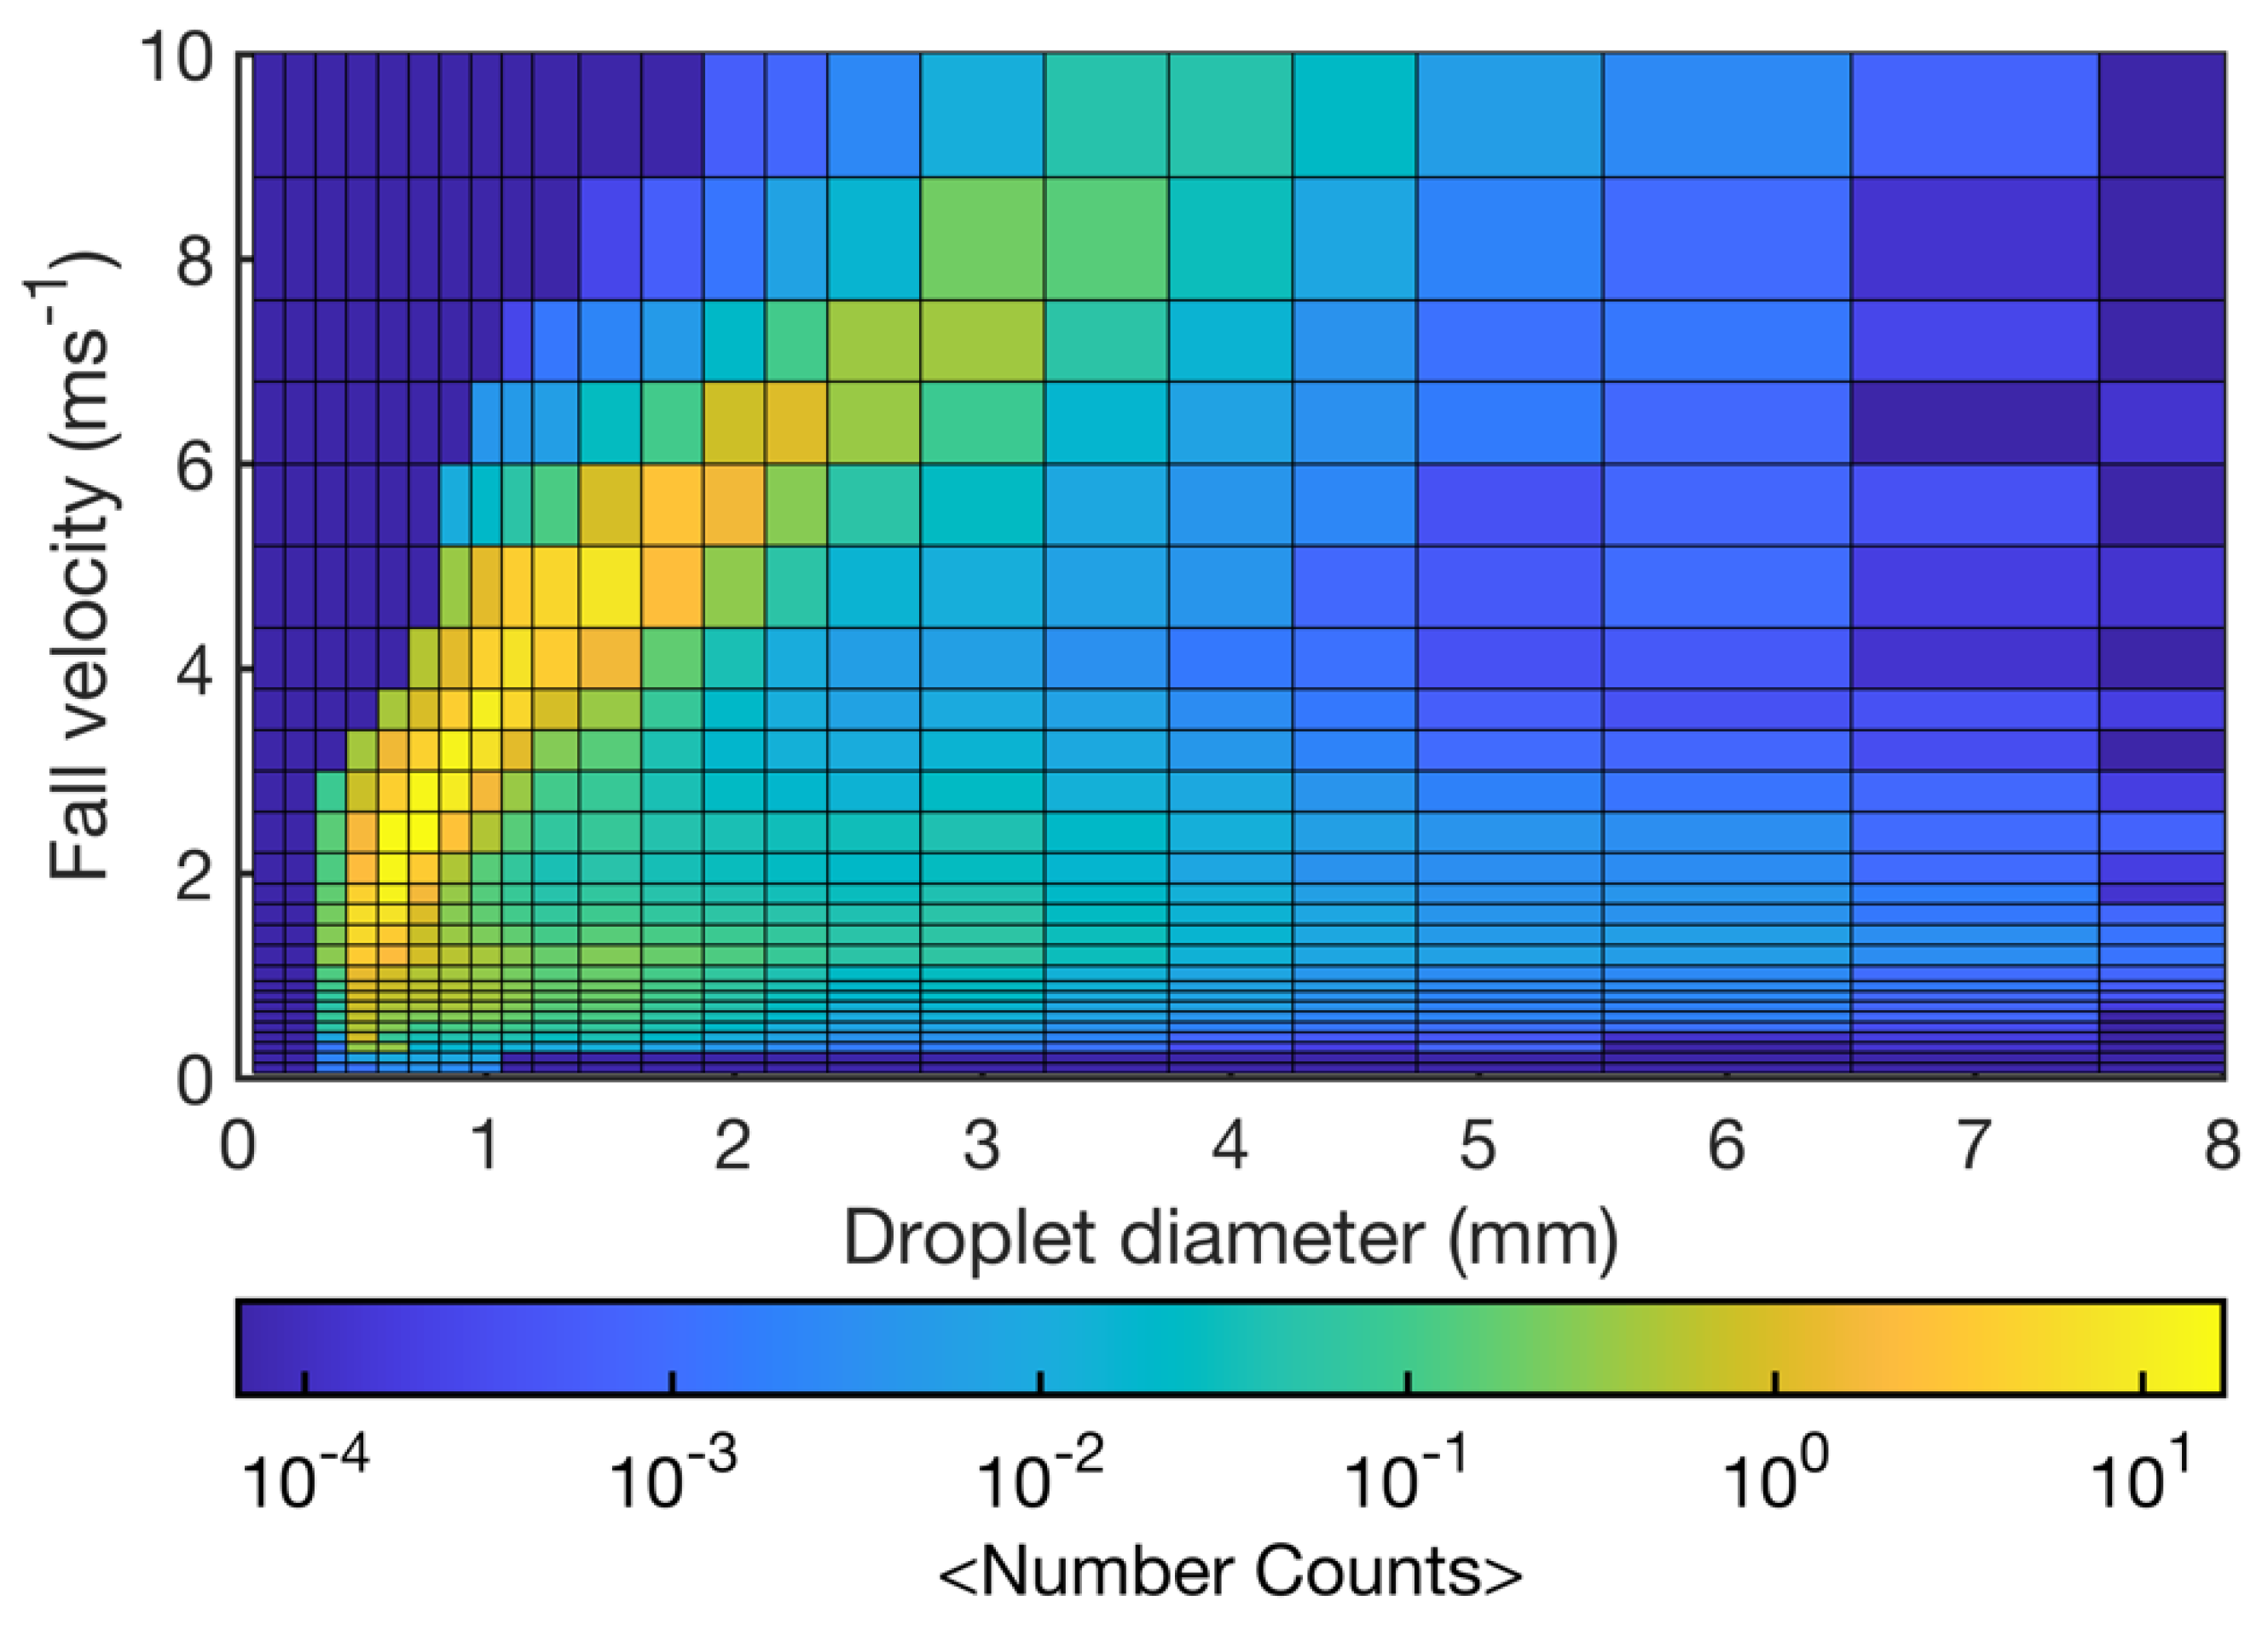
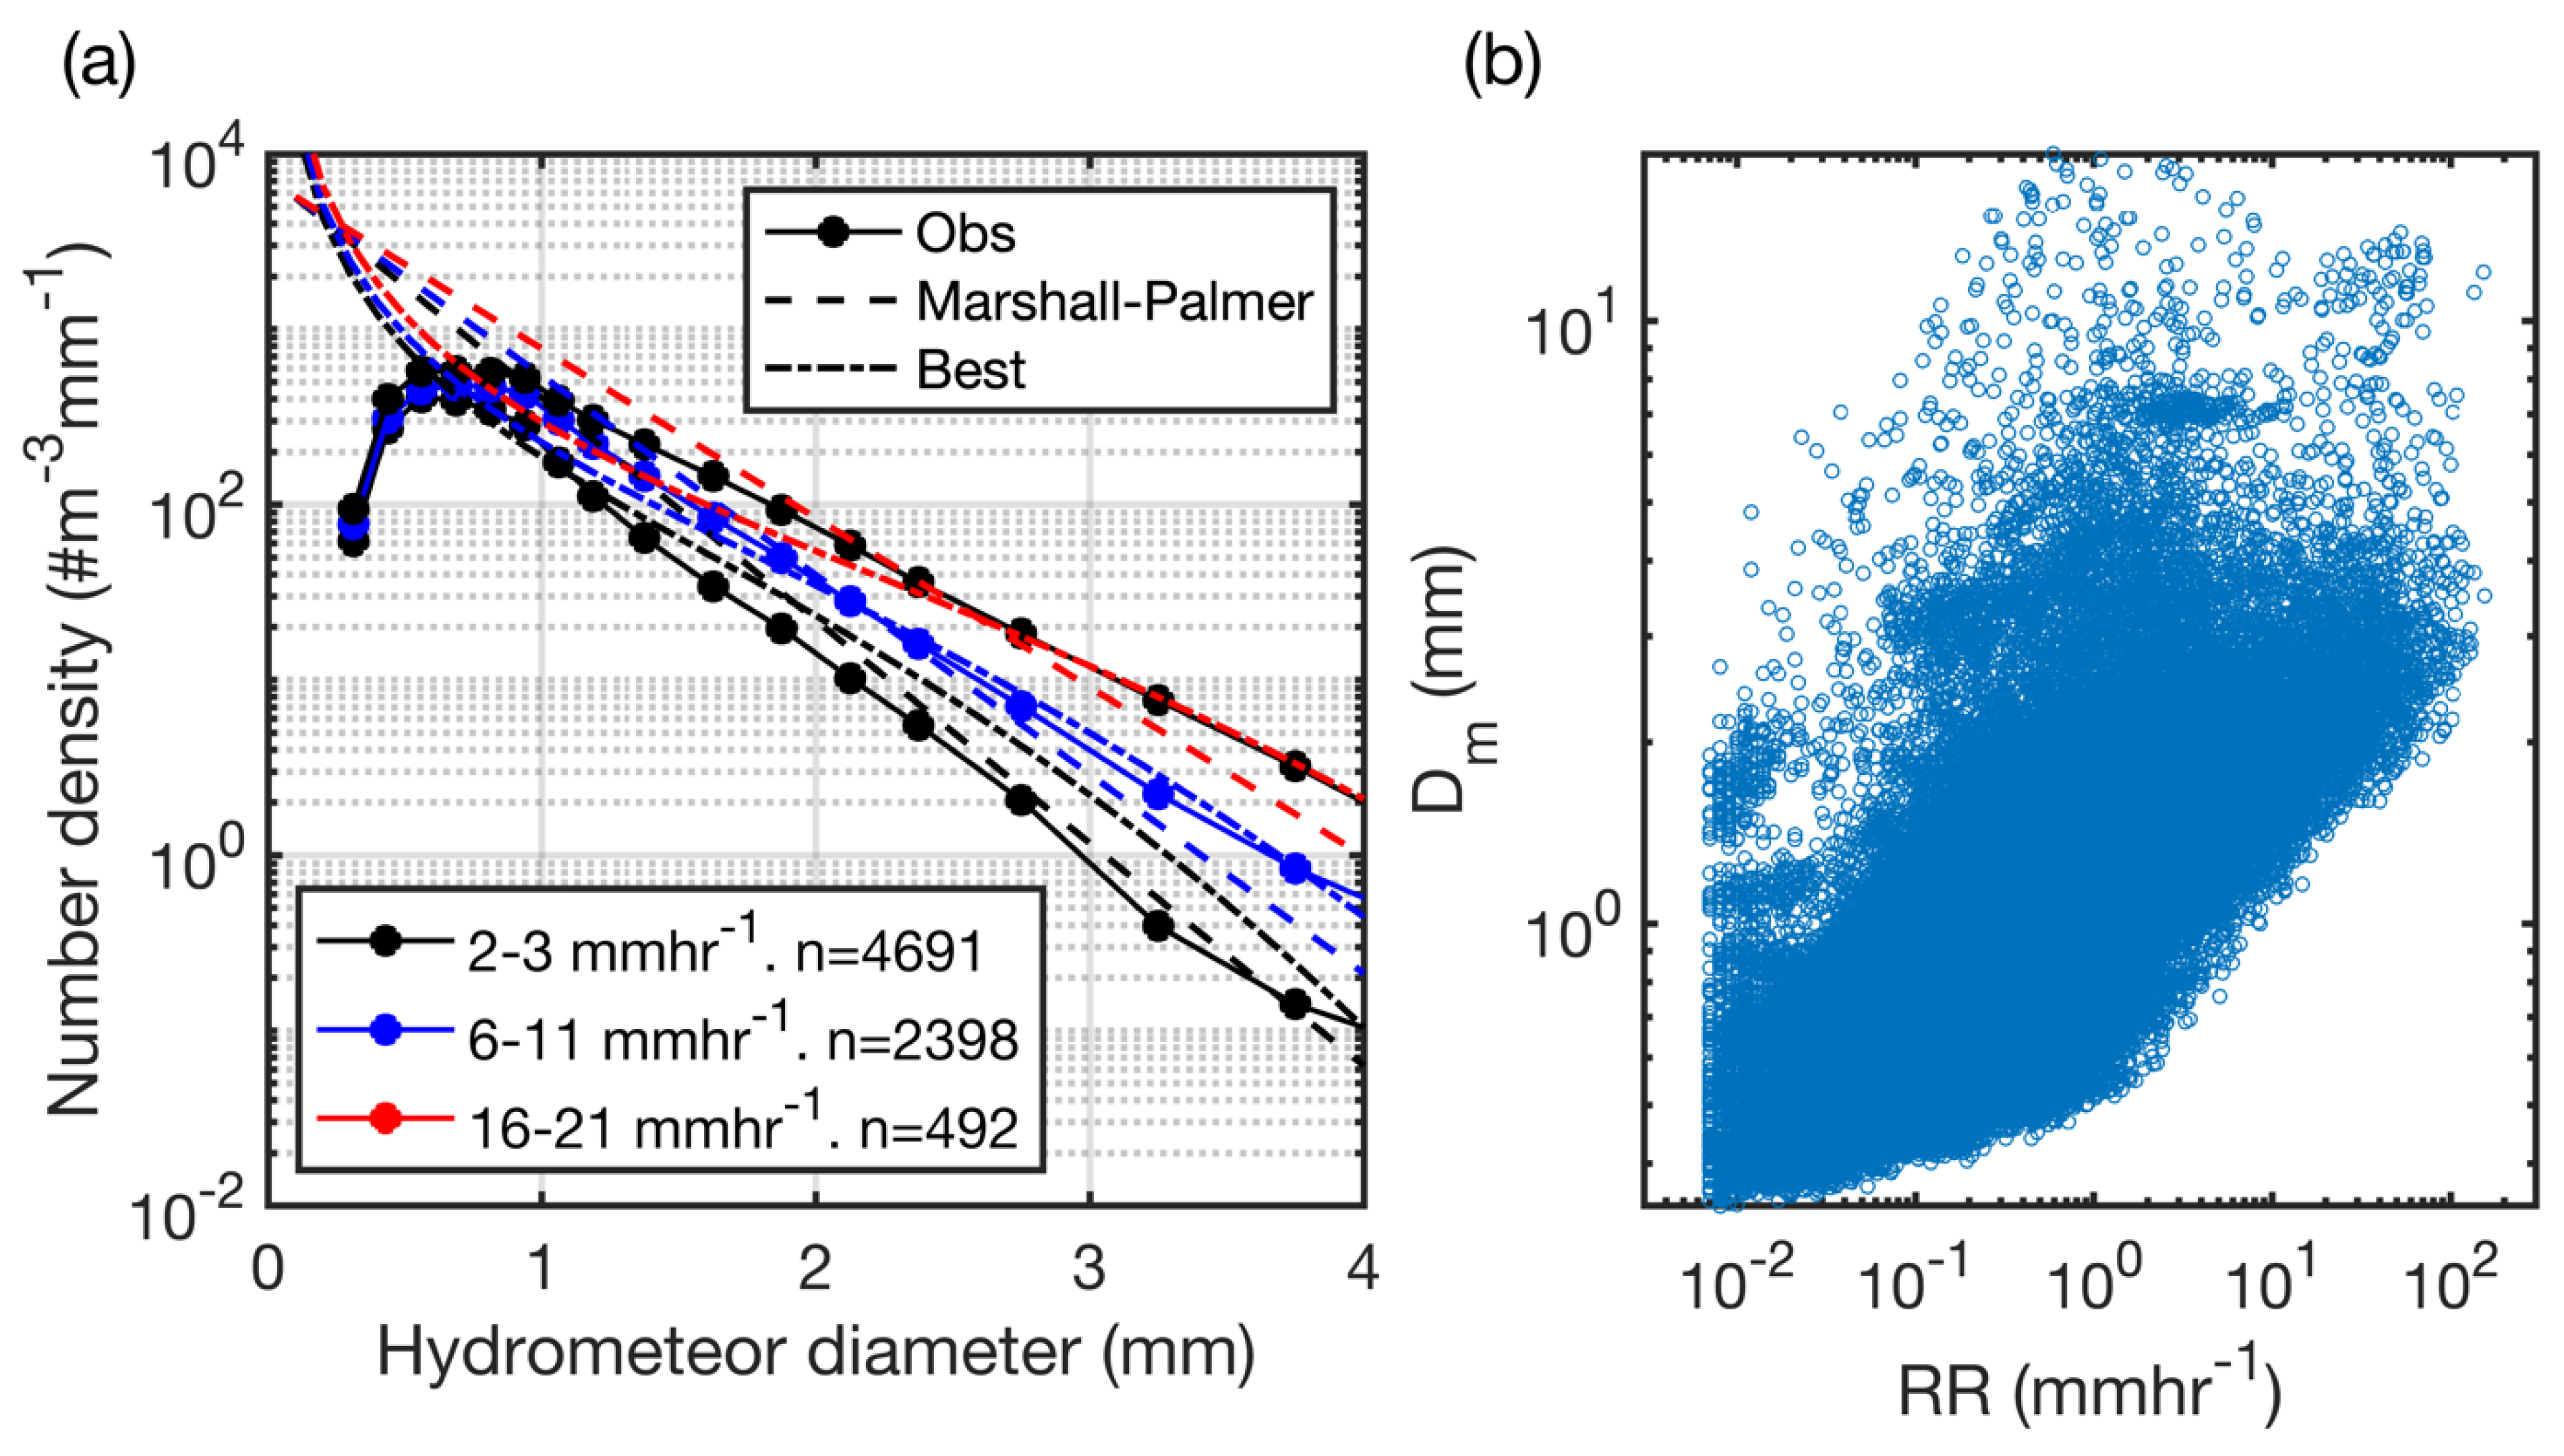
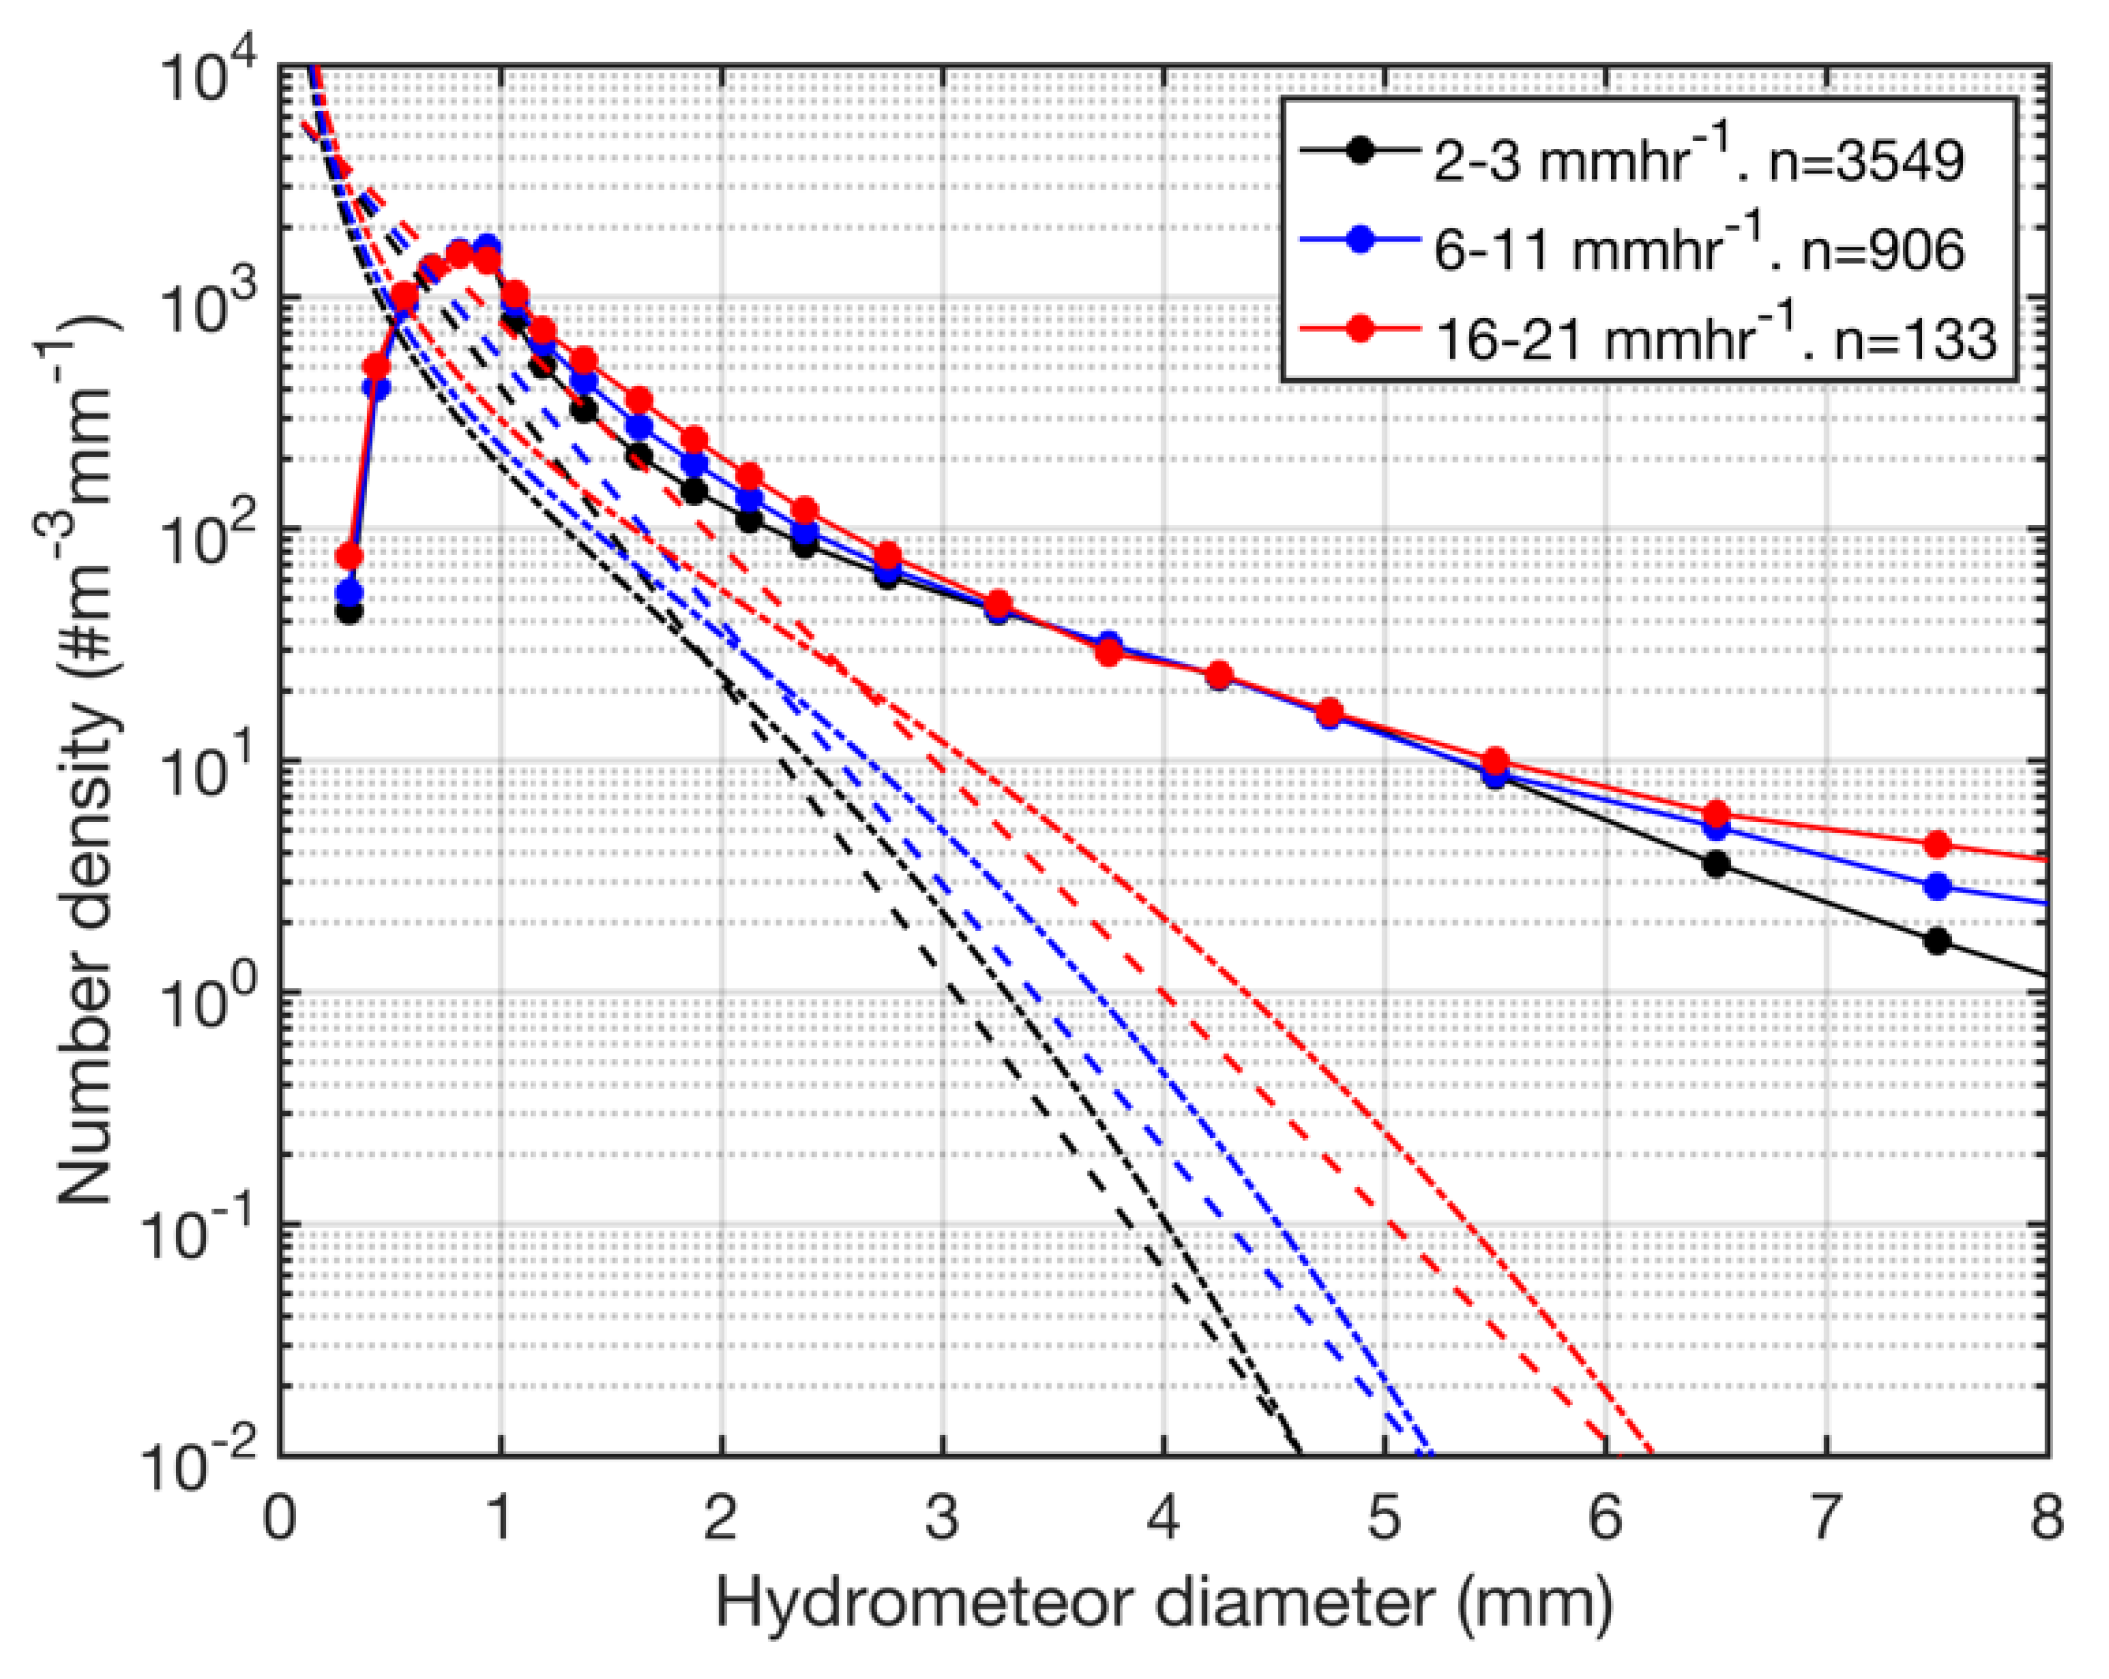
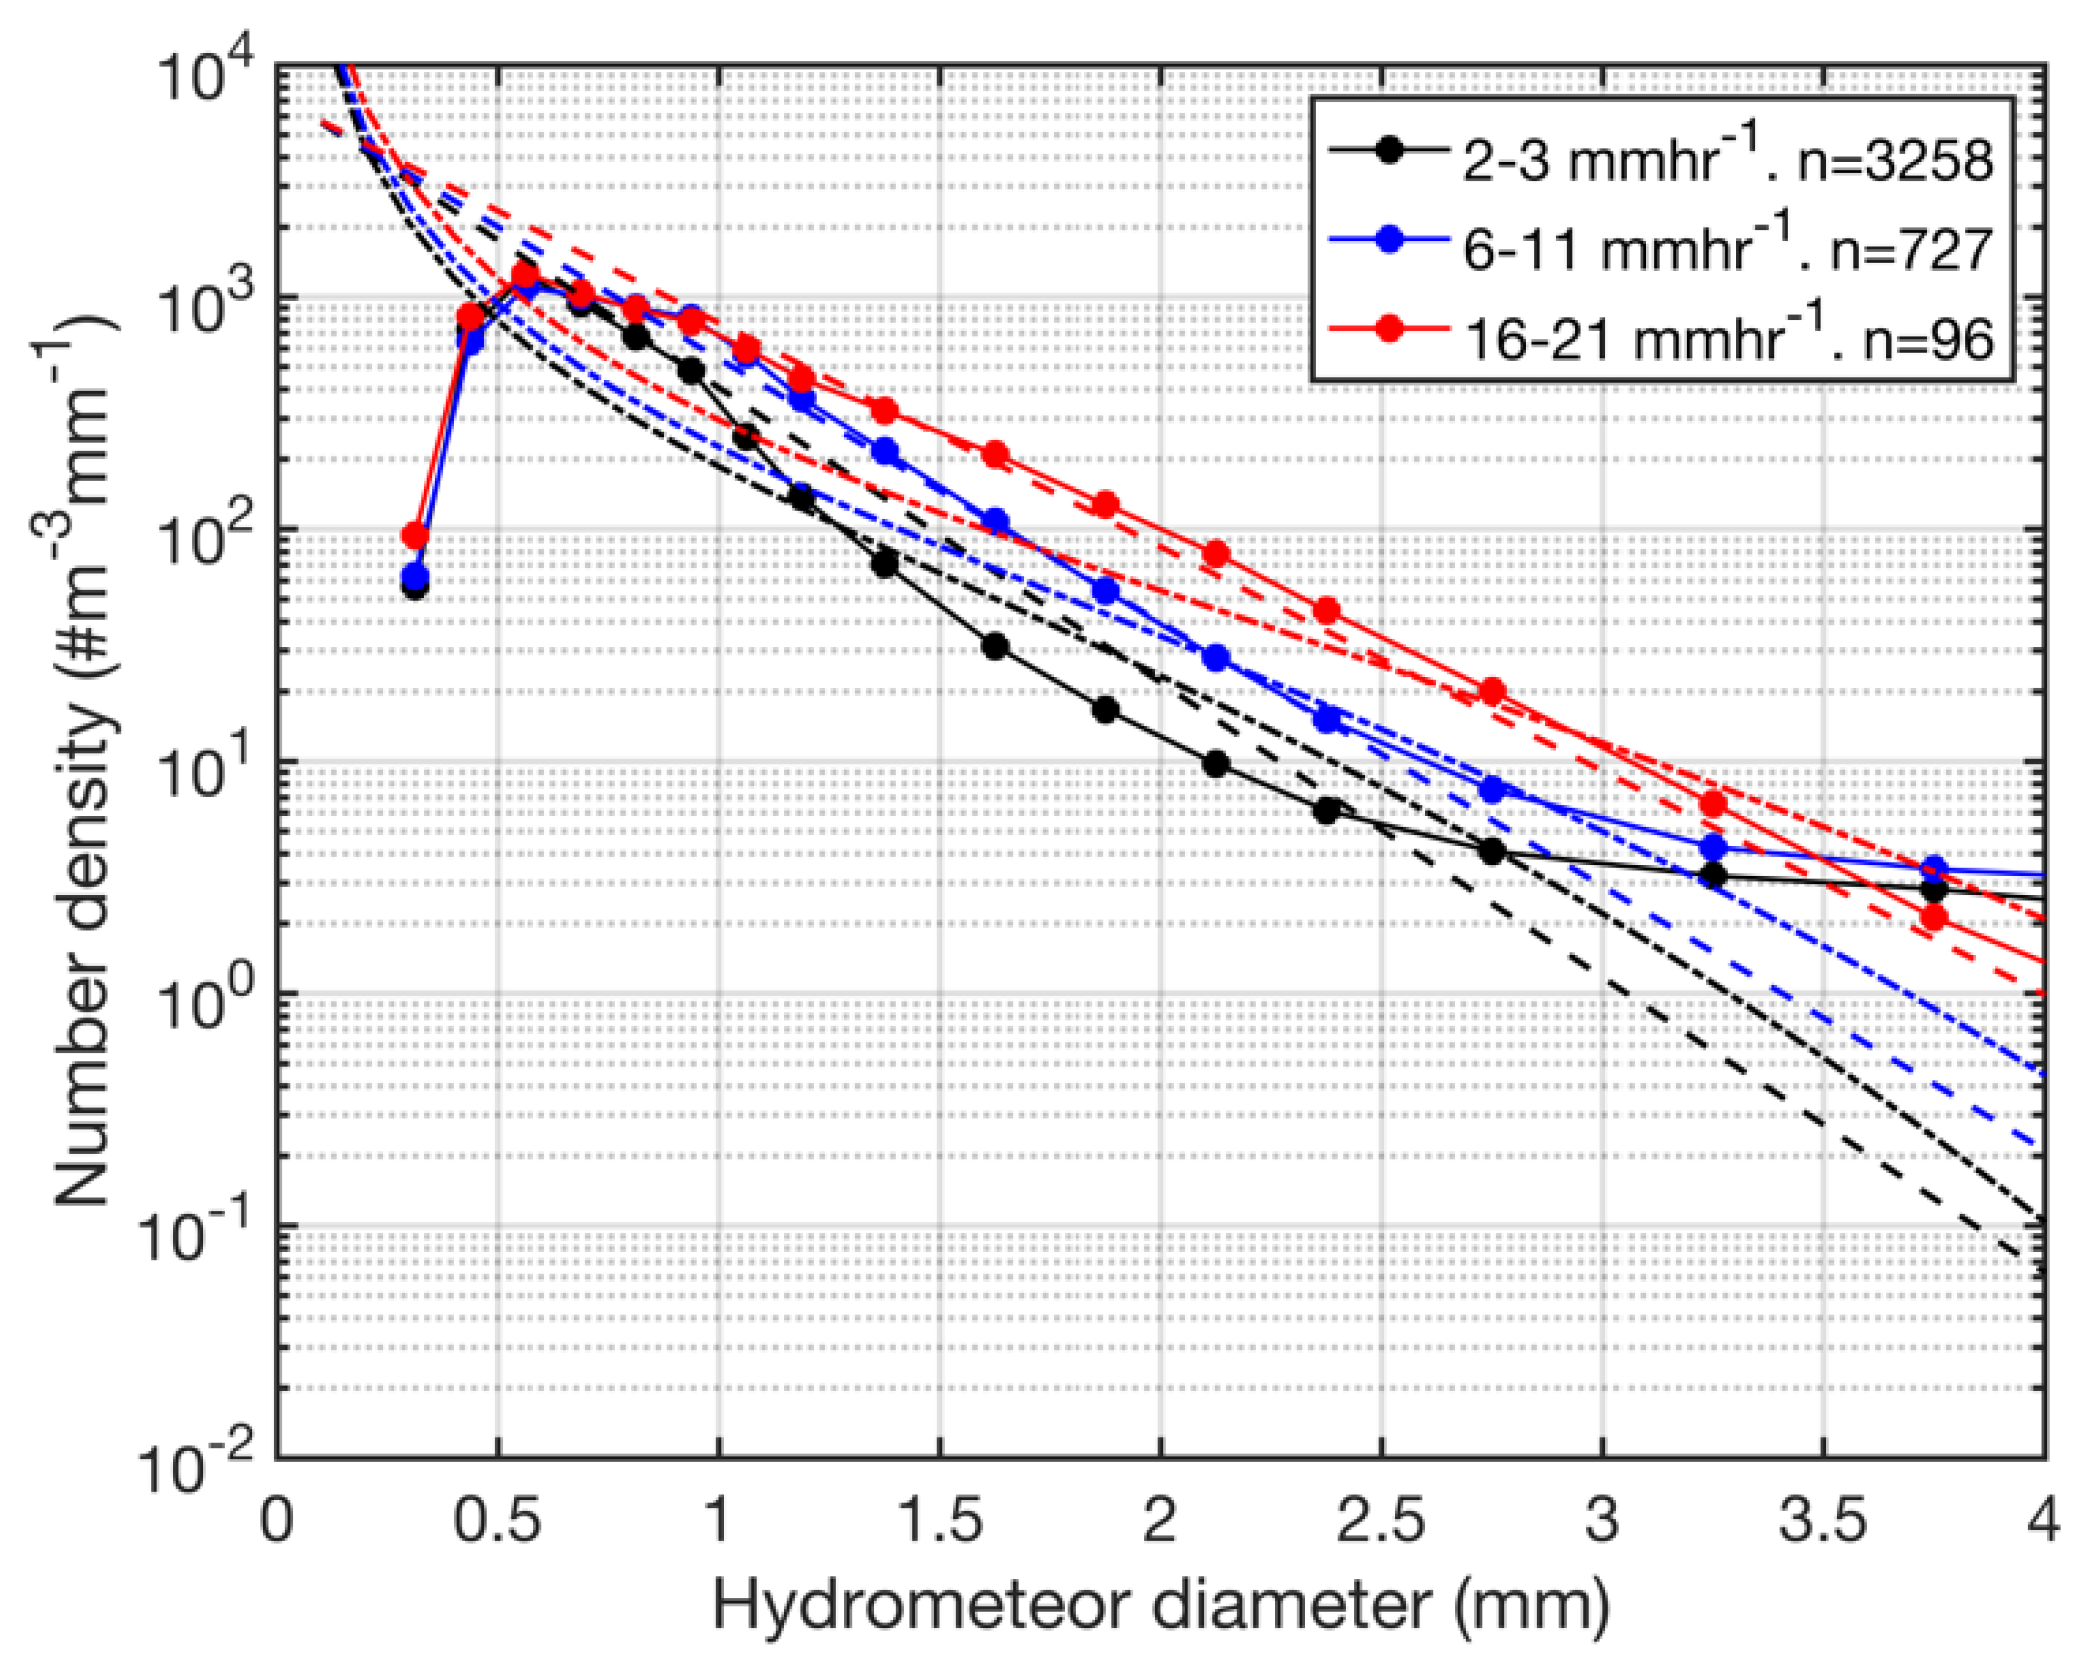
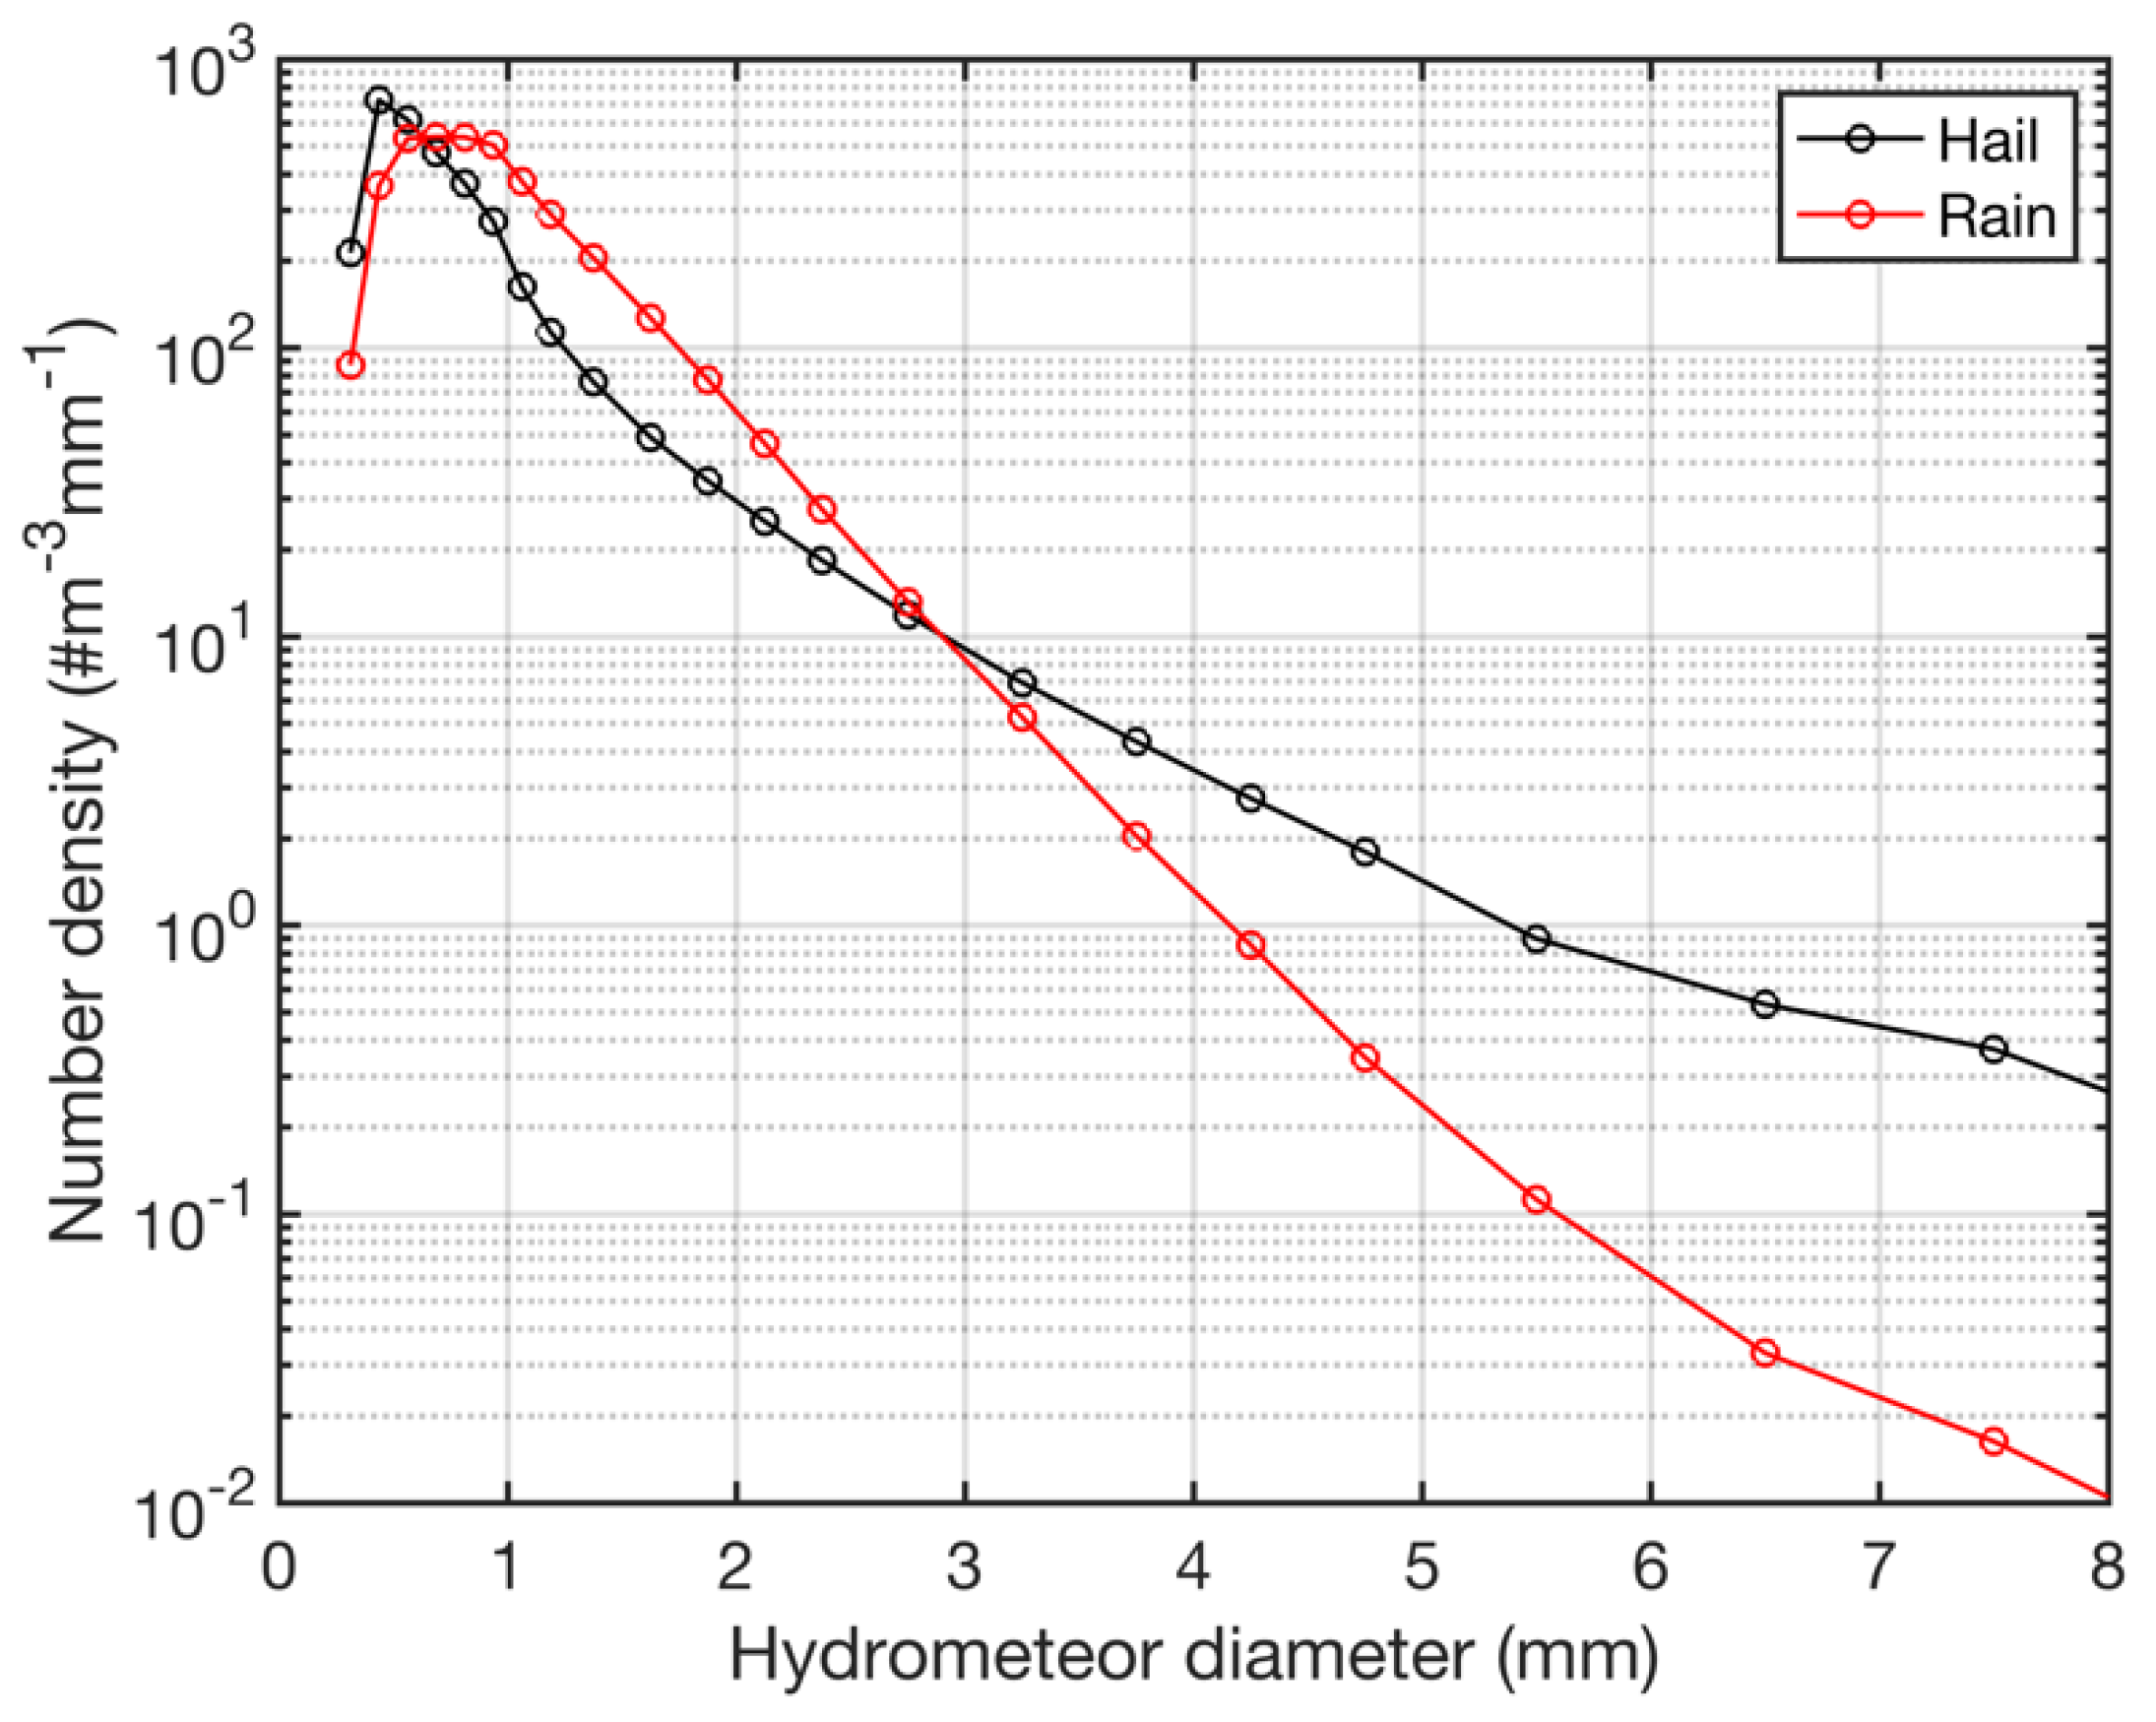
- Compare observed DSD at several sites, and evaluate the degree to which the Marshall-Palmer and/or Best distributions accurately represent the observations. We further assess whether current whirling-arm experimental designs that use the Best DSD to guide the droplet sizes used are optimal to fully characterize surface impact resistance at different RR.
- (4)
- Summarize and compare joint probability distributions of wind speed and rainfall rates (and hail occurrence) to illustrate how inferences can be drawn regarding likely relative LEE potential.
2. Materials and Methods
2.1. Metrologies for Measuring Rainfall Rates and Droplet Size Distributions
2.2. Statistical Methods
2.3. Locations from Which Data Are Presented
| Location Label Used Here | Site | Latitude | Longitude | Instrument Type Used for Droplet Size Distribution Measurements | Instrument Used for the Wind Speed Measurements (Height) | Weibull Distribution Parameters | Sampling Period from Which Data Are Reported |
|---|---|---|---|---|---|---|---|
| US SGP | DoE ARM, Lamont, SGP, USA | 36.6072° N | 97.4875° W | OTT Parsivel2 | Doppler lidar (90 m AGL) | A = 8.96 ms−1 k = 2.183 | January 2017–December 2020 |
| 2D Video | |||||||
| Impact | |||||||
| US NE | Cornell University, New York, USA | 42.4534° N | 76.4735° W | OTT Parsivel2 | None | N/A | December 2021, July–September 2022 |
| Canada coastal | WEICan, Canada | 47.035° N | 64.015° W | CSI PWCS100 | Cup anemometer (80 m AGL) | A = 10.3 ms−1 k = 2.001 | October 2018–December 2020 |
| Coastal UK | WAO, UK | 52.9433° N | 1.1414° E | Thies LPM | None | N/A | February 2017–September 2019 |
| Norway coastal | Bergen, Norway | 60.38° N | 5.33° E | OTT Parsivel2 | ERA5 reanalysis [124] NORA hindcast [125] 2D sonic anemometer (49 m ASL) | A = 6.7 ms−1 k = 1.7 A = 7.0 ms−1 k = 1.7 A = 4.0 ms−1 k = 2.0 | January 2016–December 2021 |
| MRR | January 2010–December 2014 and January 2016–December 2021 | ||||||
| North Sea | Horns Rev, Denmark | 55.6° N | 7.59° E | OTT Parsivel2 | None | N/A | December 2018–October 2021 |
| Denmark inland | DTU, Denmark | 55.693° N | 12.1° E | OTT Parsivel2 | Cup anemometer (94 m AGL) | A = 8.0 ms−1 k = 2.4 | June 2019–December 2021 |
- (1)
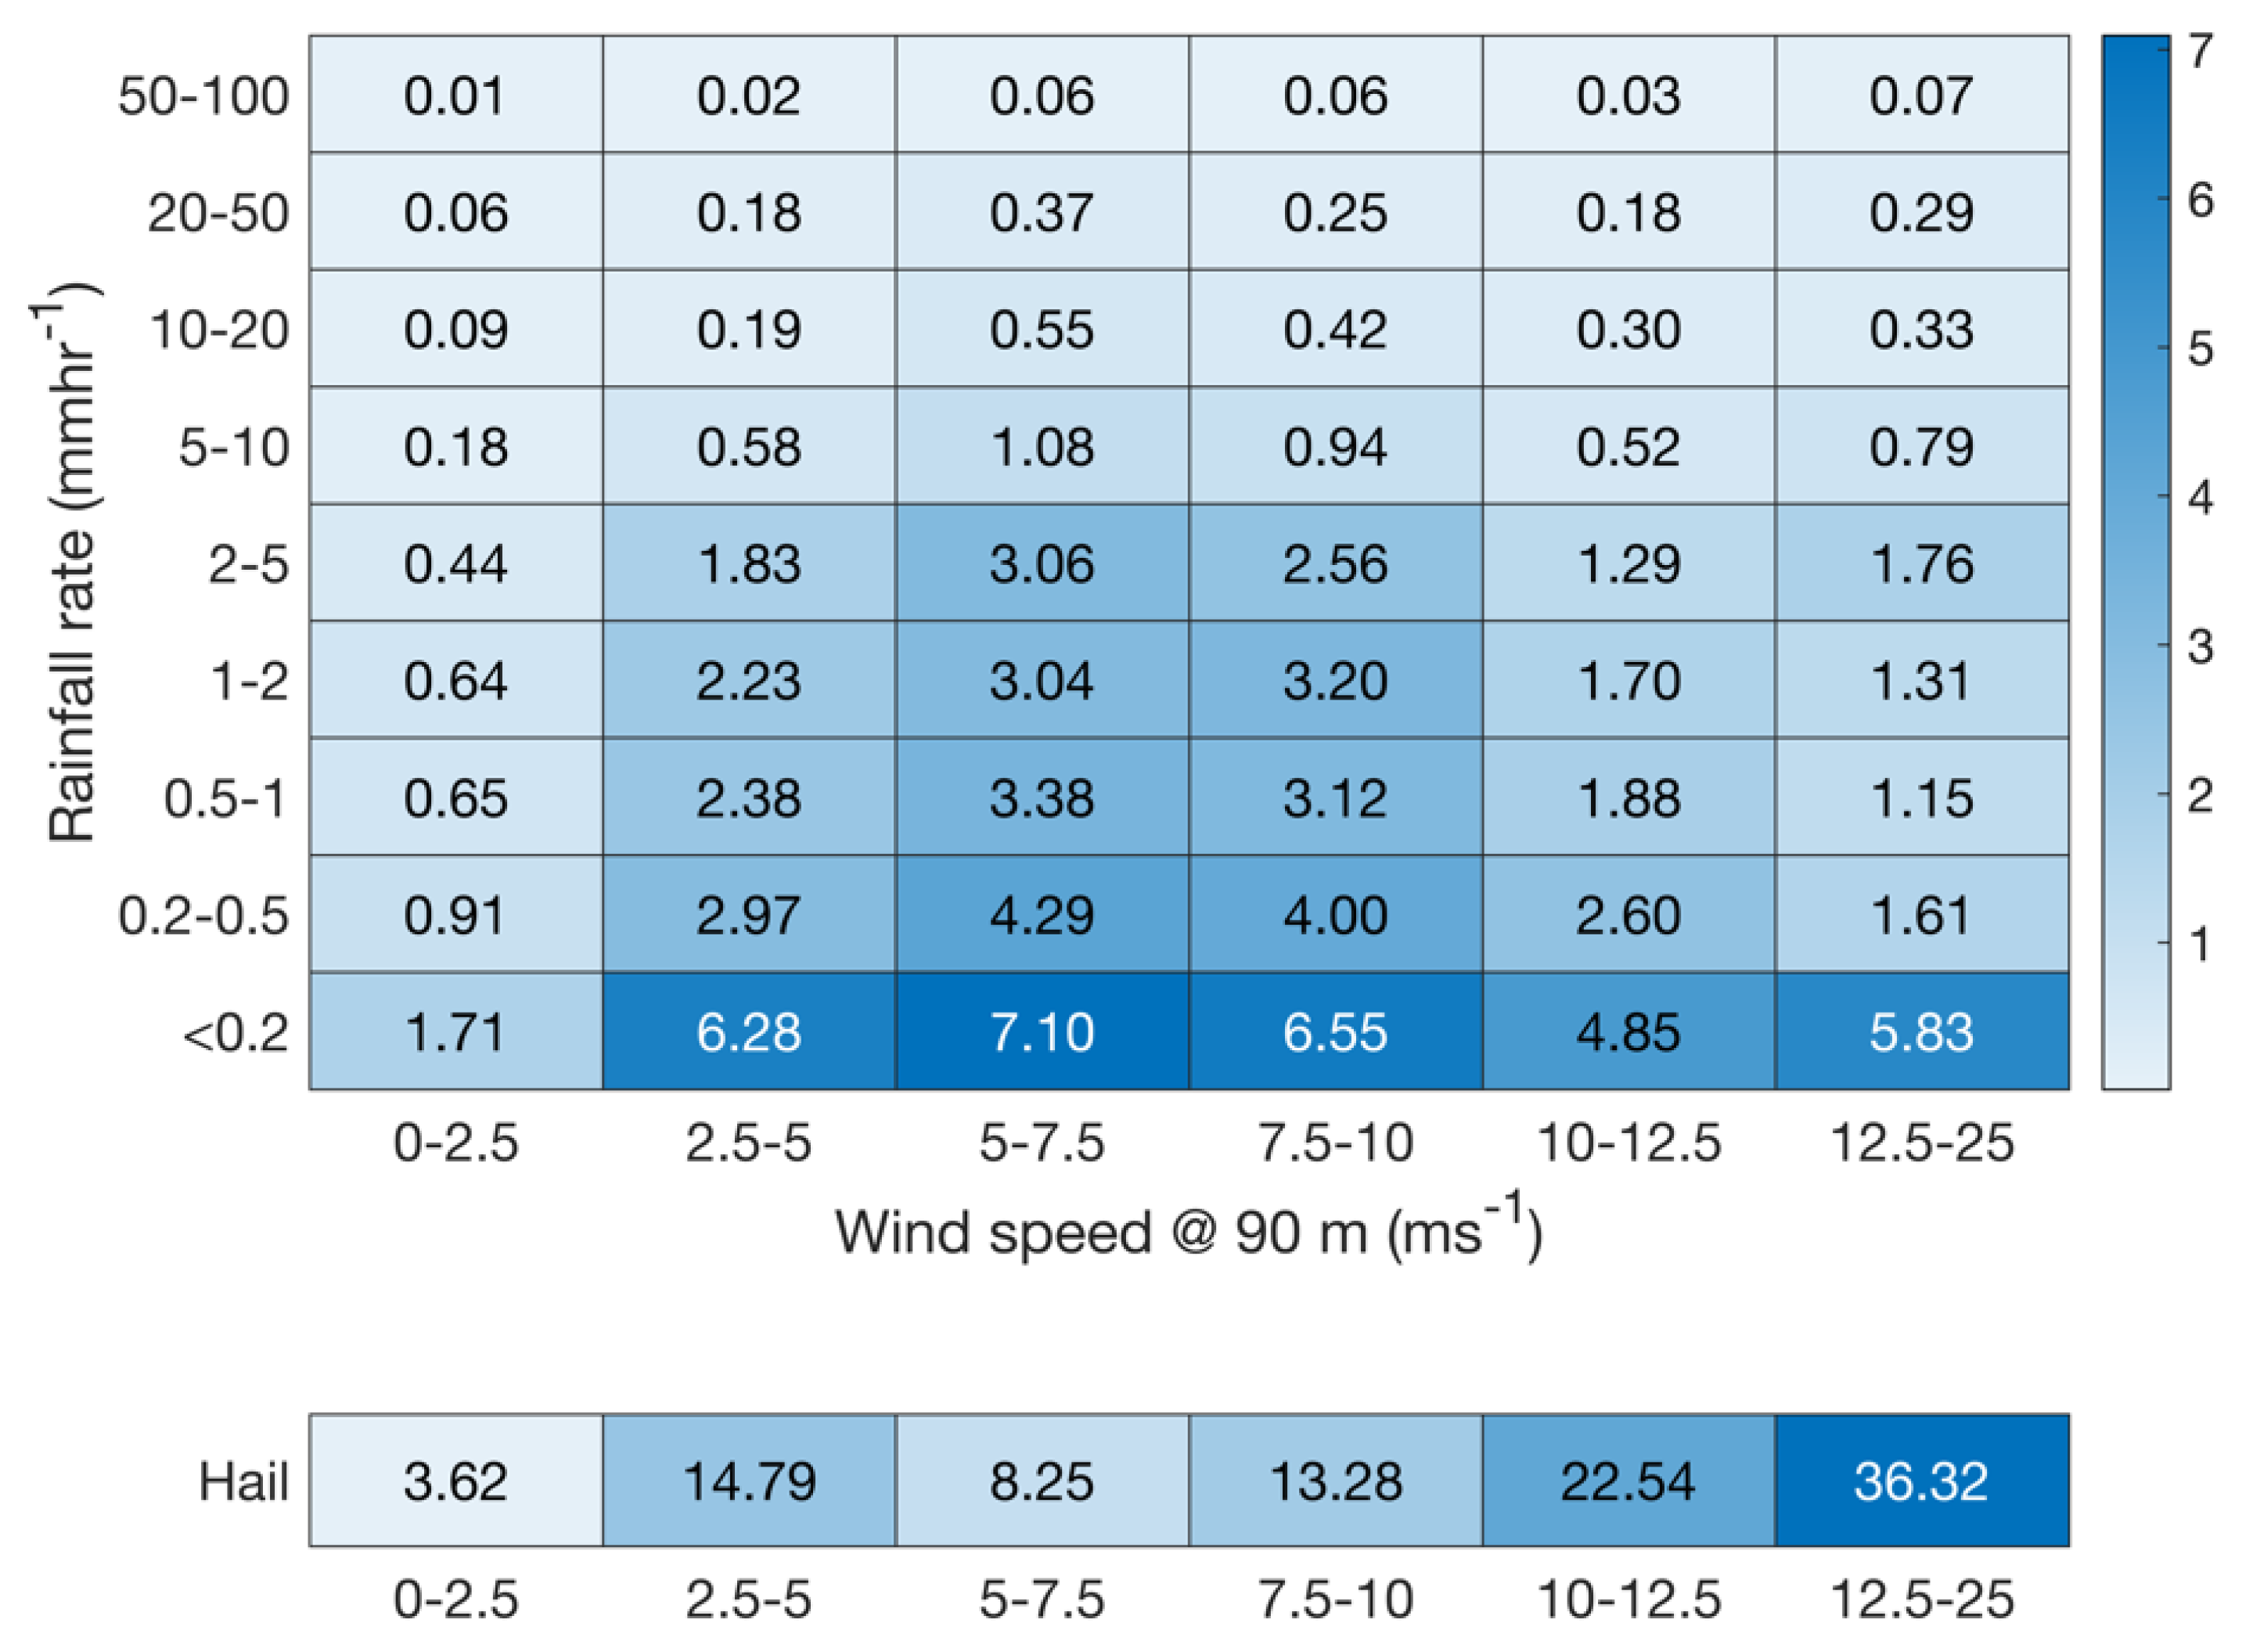
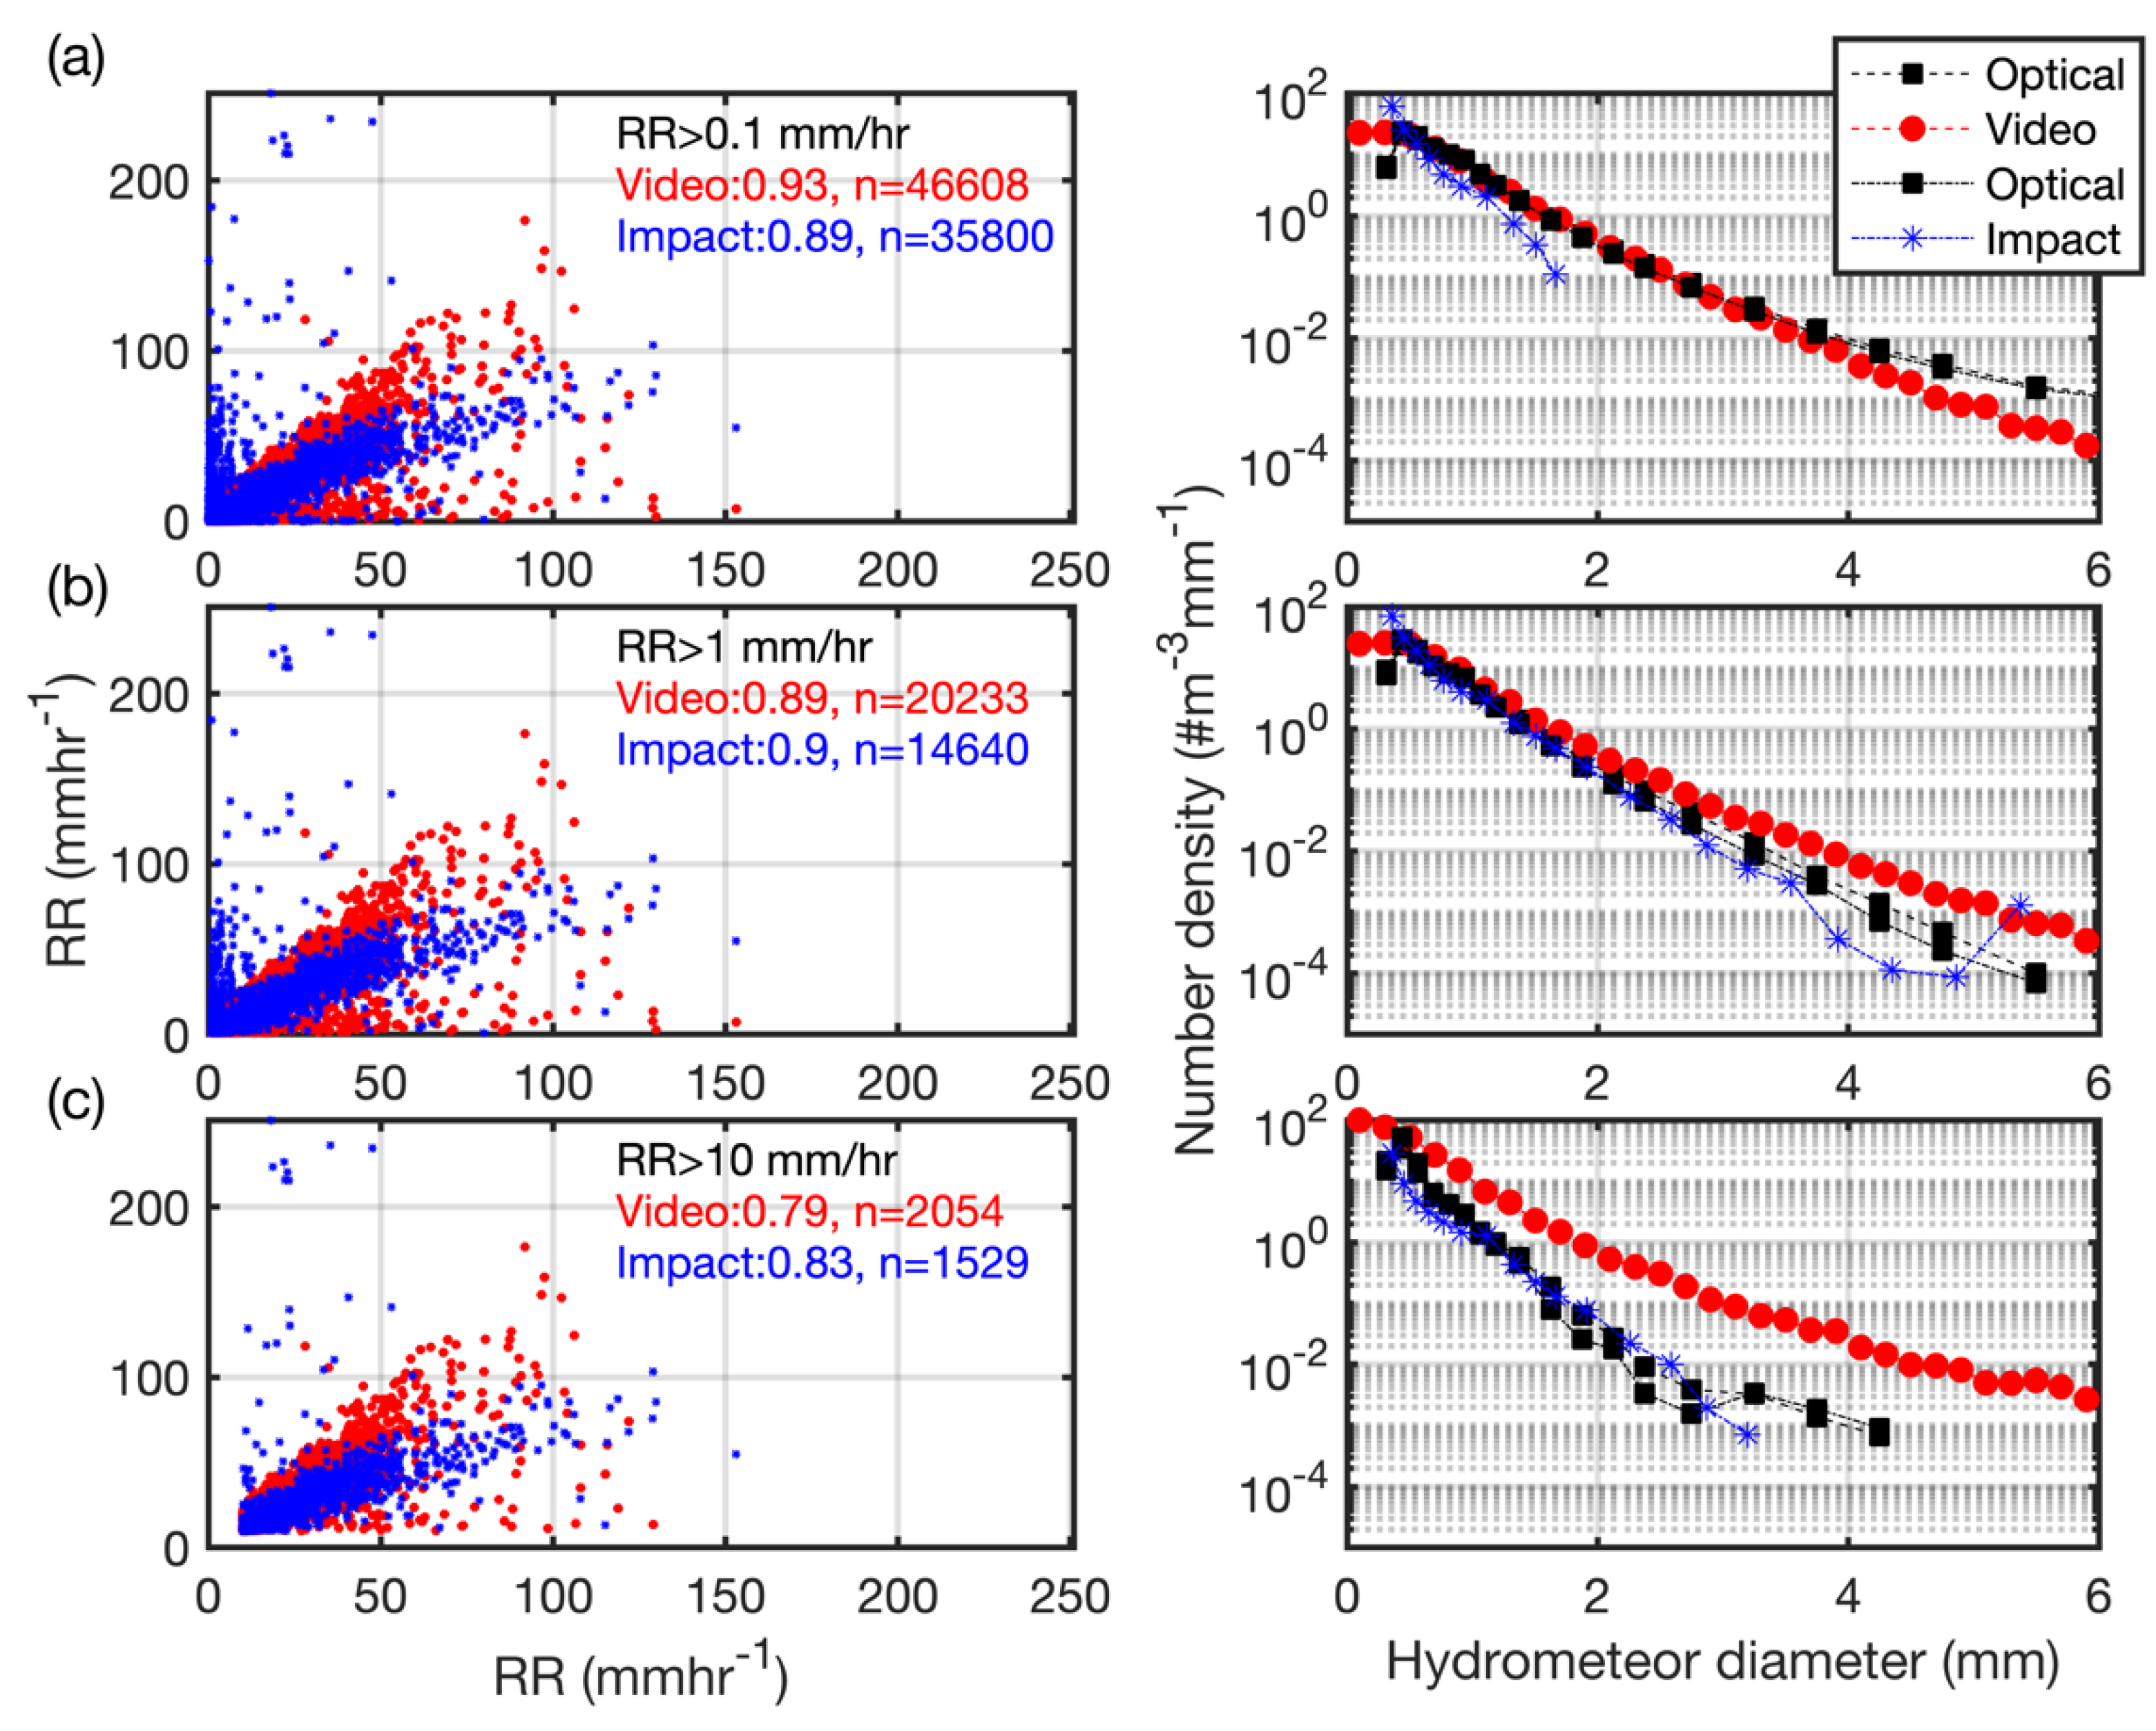
- Southern Great Plains, United States (US SGP): The US Department of Energy (DoE) Atmospheric Radiation Measurement (ARM) site at Lamont in Oklahoma. DSD data from three disdrometers deployed at this site are reported; an impact disdrometer [99], an optical (Parsivel2) disdrometer [101] and a video disdrometer [95]. Data availability during 1 January 2017 to 31 December 2020 from the OTT Parsivel2 is 93%. All disdrometers are recorded every 1-min. To provide a context for the spatial variability in DSD and RR derived from a range of locations, we compare measurements of RR and DSD from these three different disdrometers. It is important to recall that they have different sampling ranges. The Parsivel2 discretizes the hydrometeors into 32 diameter classes, with classes centered at diameters of 0.062 to 24 mm. The video disdrometer uses 50 diameter classes from 0.1 to 9.9 mm. The impact disdrometer uses 20 diameter classes from 0.359 to 5.373 mm. Wind speed data reported for this site are 15 min average values and derive from a Halo Photonics Doppler lidar [127]. As described further below, the US SGP region is subject to frequent deep convection and associated high RR and hail [92,128,129]. There are also substantial wind turbine deployments. Based on data from the USGS wind turbine database (updated from [130]), as of April 2022, there are over 16 GW of wind turbine installed capacity (IC) within 300 km of the US SGP site considered here. This is over 12% of the total US wind turbine IC.
- (2)
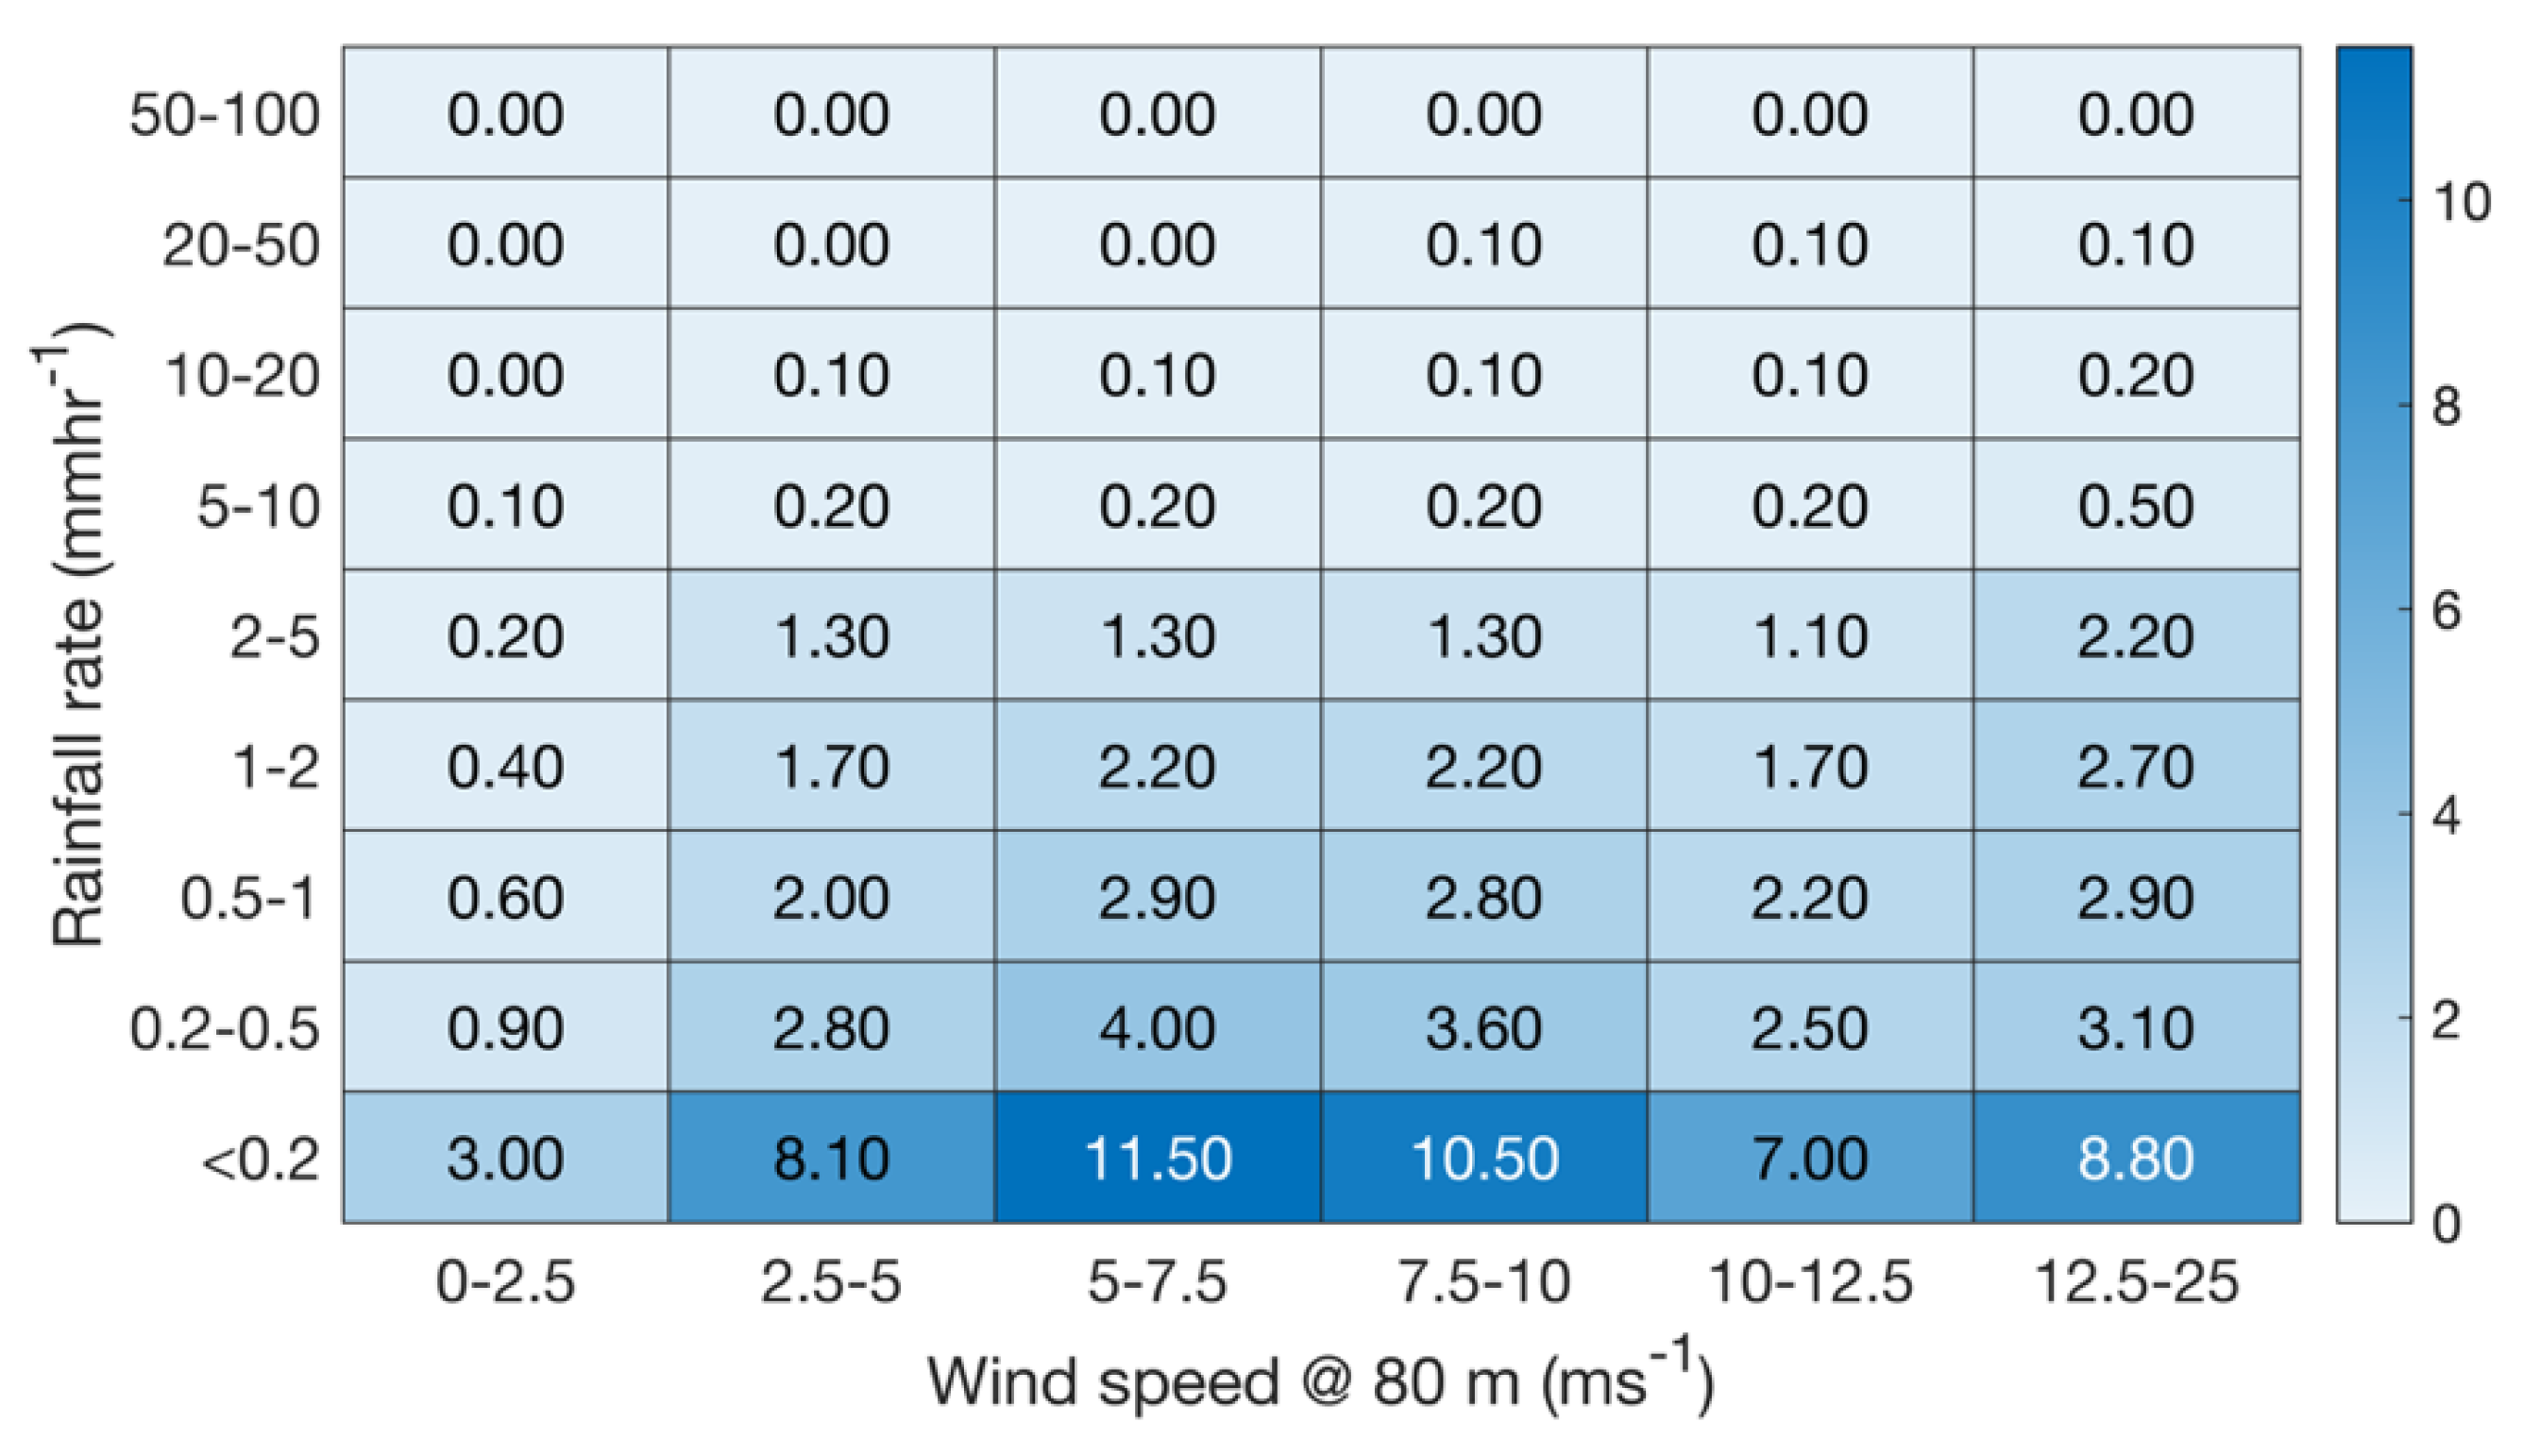
- Canada coastal: The Wind Energy Institute of Canada (WEICan) on Prince Edward Island in eastern Canada. The site has 300 degrees of ocean exposure and contains five 2 MW DeWind turbines that have a hub-height of 80 m AGL, as well as an instrumented 80 m meteorological tower compliant with IEC 61400-12-1 and a 10 m meteorological tower compliant with IEC 61724-1 [131]. Hydroclimatic data presented herein derive from a Campbell Scientific PWS100 deployed at 11 m AGL and the RR data availability is 88.9%. Due to a data logging issue no DSD are available. Wind speed observations are from a Thies cup anemometer at 80 m AGL which is the hub-height of the wind turbines operating at WEICan.
- (3)
- UK coastal: The Weybourne Atmospheric Observatory (WAO) [132], on the north coast of the English county of Norfolk. WAO was one of 14 sites at which Thies LPMs ran as part of the Disdrometer Verification Network (DiVeN) project [111]. This site has an altitude of 16 m above sea level and is landward of a pebble beach. It has an open ocean fetch to the north and a clear view towards many of the major offshore wind farms operating in the western North Sea around the coast of East Anglia. The closest offshore wind farms are; Sheringham Shoals, a 317 MW installation 17–23 km north of the north Norfolk coast, and Race Bank, a 573 MW installation approximately 27 km north-northwest of Weybourne. No in situ or remote sensing wind speeds are presented from this location due to a lack of availability of well-documented, traceable measurements at/close to wind turbine hub-height.
- (4)
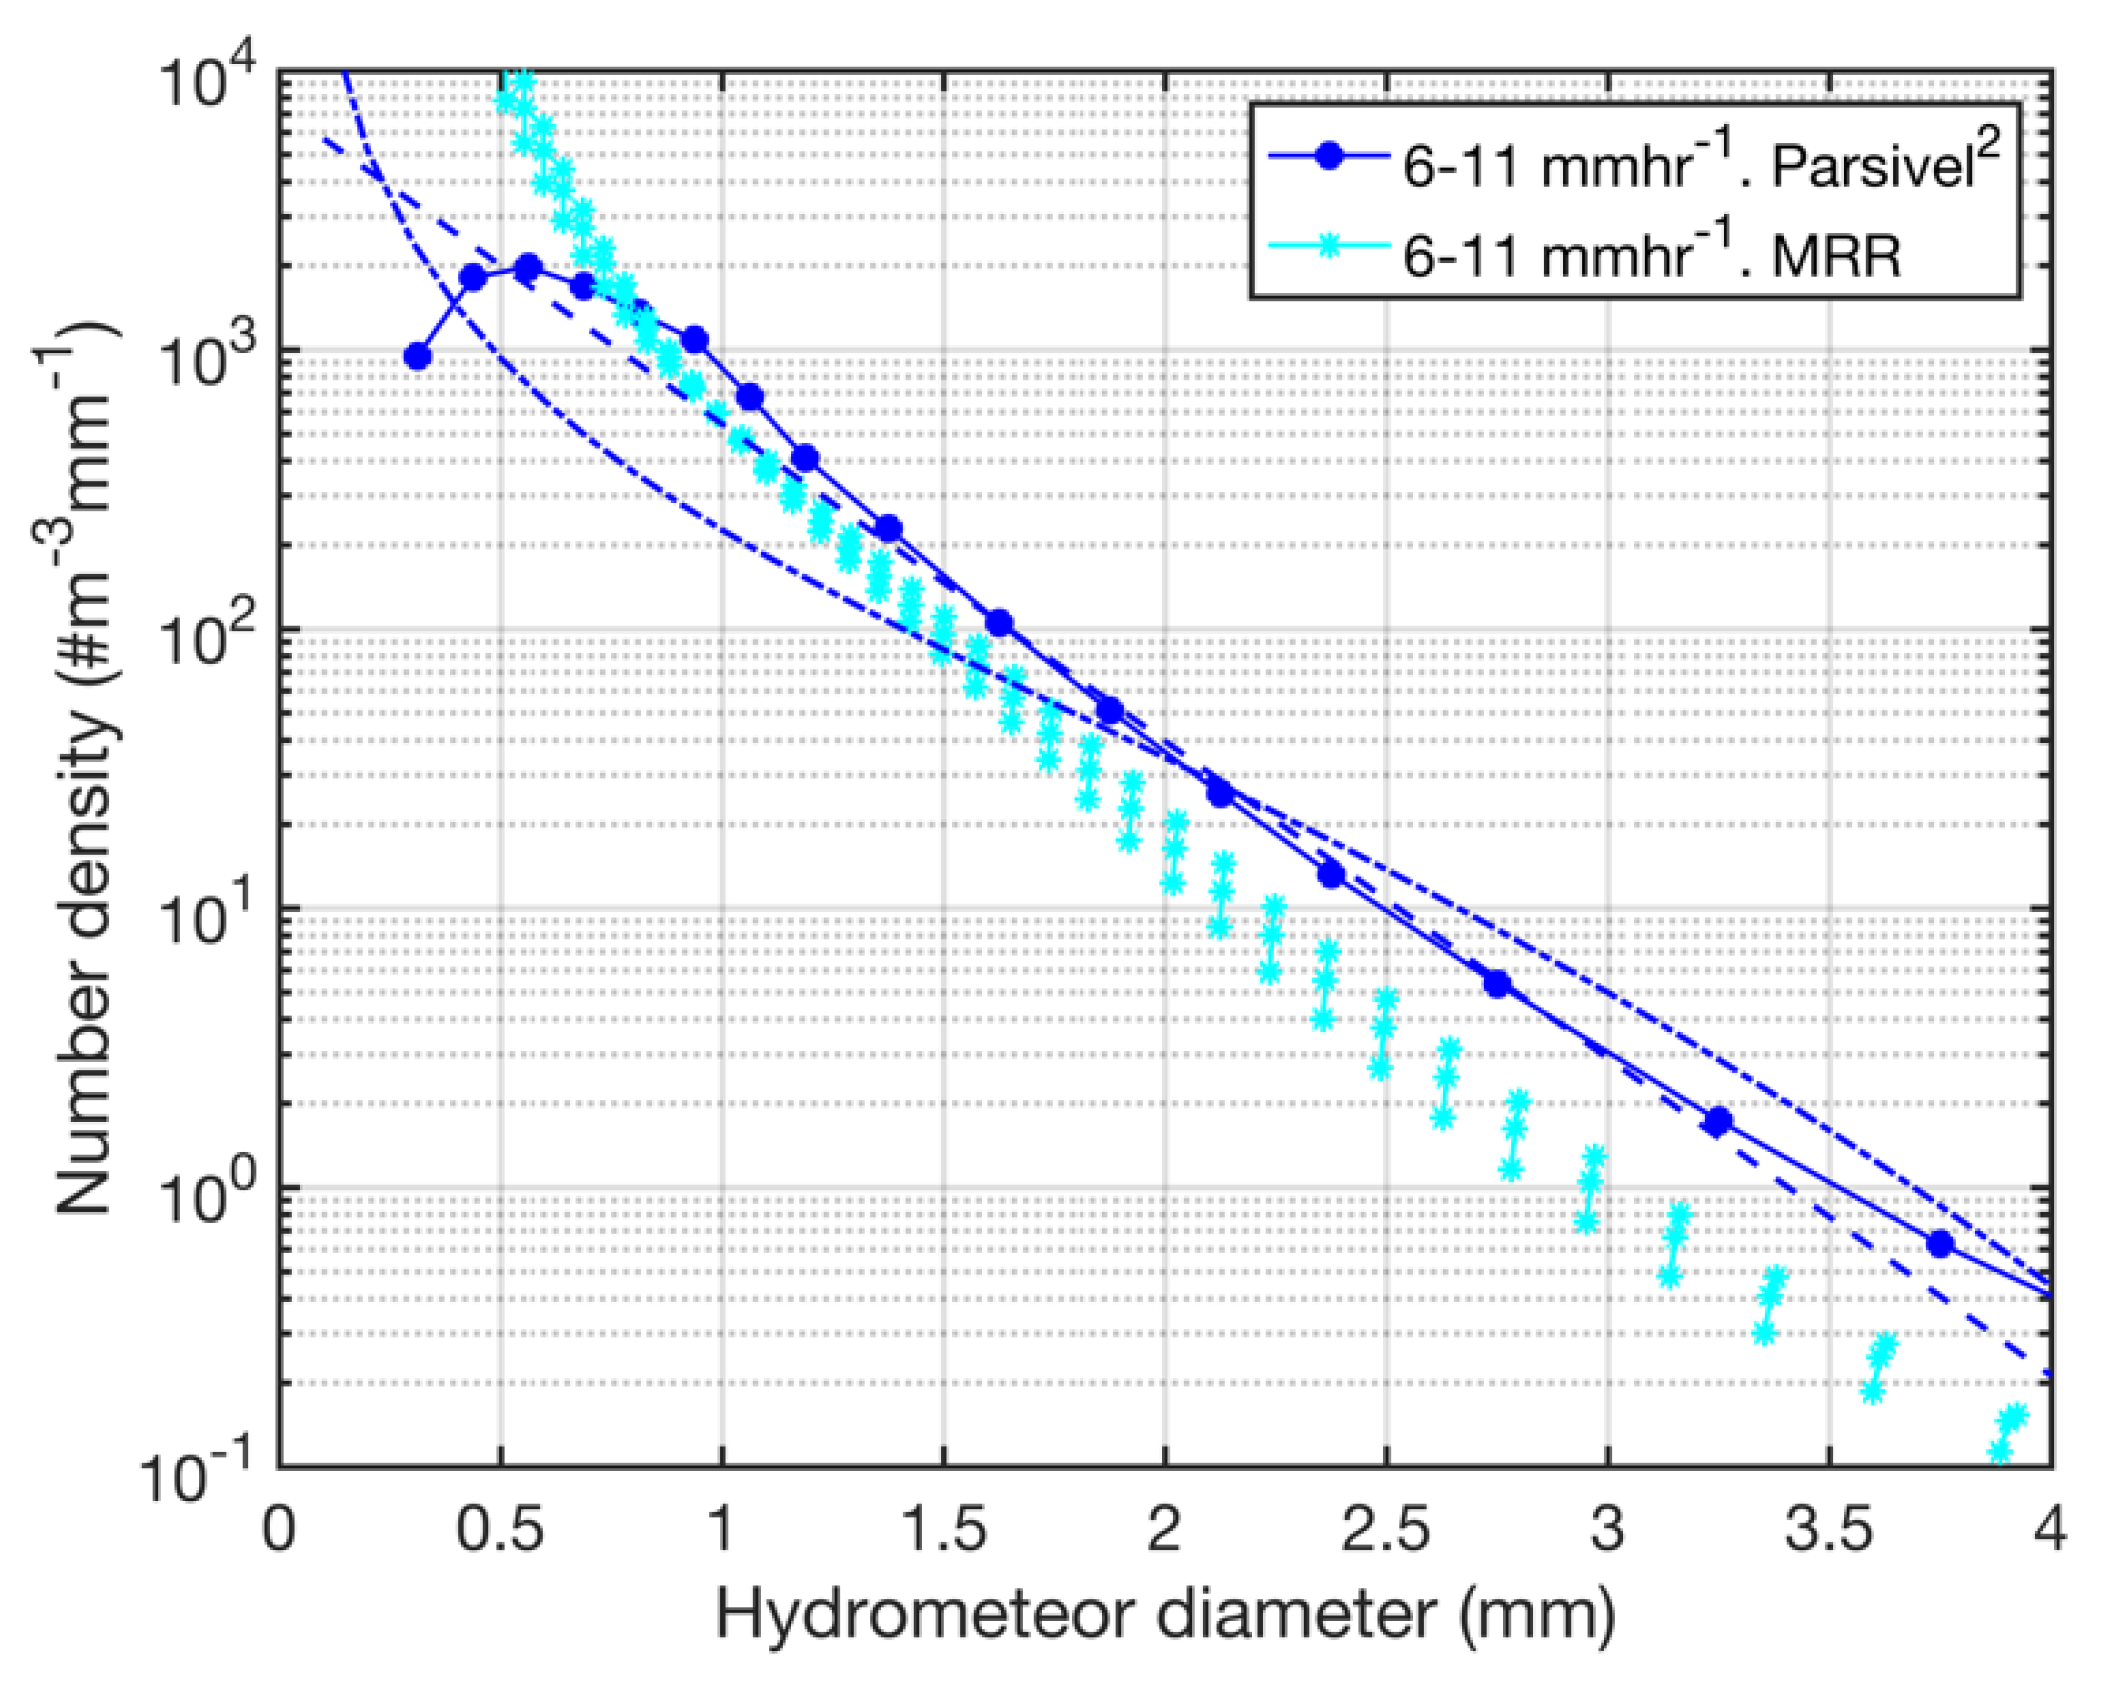
- Norway coastal: The Geophysical Institute at the University of Bergen on the west coast of Norway. The RR and DSD presented here are from a METEK MRR [117,133] operated on a building rooftop (39 m above sea-level (ASL)), and an OTT Parsivel2. Wind speeds are observed using a 2D sonic anemometer on a co-located 10 m mast (49 m ASL). The offshore waters along the west coast of Norway have large wind resources. When commissioned the 94.6 MW Hywind Tampen floating offshore wind farm (140 km from the Norwegian coast and northwest of Bergen) will be the largest floating wind farm in the world [134].
- (5)
- North Sea: Horns Rev2 offshore wind farm off the west coast of Denmark in the North Sea. RR and DSD data are from an OTT Parsivel2 deployed at a height of 22 m ASL. The Horns Rev offshore wind farm comprises three wind turbine clusters; Horns Rev 1 (160 MW), Horns Rev 2 (209 MW) and Horns Rev 3 (407 MW) located approximately 30 km from the Danish west coast. No wind speed measurements are presented from this location since they are deemed commercially sensitive.
- (6)
- Denmark: The Risoe campus of the Danish Technical University (DTU) near Roskilde in Denmark. Denmark was an early adopter of wind technologies and has nearly 6000 wind turbines deployed onshore [135] and nearly 2 GW of offshore installed capacity [79]. The RR and DSD reported herein derive from OTT Parsivel2 instruments recorded with 1 min and 10 min averaging.
3. Results
3.1. Hydroclimate and Wind Regimes at the Focus Sites
3.2. Joint Probabilities of Hydroclimatic Conditions and Wind Speeds
3.3. Influence of Measurement Strategies and Instrument Metrologies

4. Discussion
5. Summary and Recommendations
- (1)
- Best-practice be developed for deployment of disdrometers (e.g., use of wind shields) and analysis of data from disdrometers to ensure comparability of observed DSD across different sites and regions.
- (2)
- A disdrometer network in wind energy rich environments should be developed to allow more detailed assessment of LEE potential. Such data sets will also provide information necessary to evaluate numerical models and remotely sense hydroclimate parameters. Reference sites such as that operated at the US SGP DoE ARM should be run for many years in order to generate robust and comparable data sets. Since the joint probability of RR and hydrometeor size distribution (fall velocity and phase) with wind speeds are the critical determinants of kinetic energy transferred to the blades and the resulting material stresses, these sites should also include high fidelity wind speed measurements at wind turbine hub-heights. Given the current ambiguity in terms of how weather codes (WC) are assigned by disdrometers independent meteorological data and assessments of hydrometer phase would be greatly beneficial.
- (3)
- RR and DSD considered in accelerated RET be greatly expanded to cover a wider range of conditions including simultaneous presence of droplets across a range of diameters and presence of solid hydrometeors.
- (4)
- Research be conducted to better characterize hydrometeor size distributions offshore and advance techniques to avoid contamination from sea spray.
- (5)
- Detailed closure experiments should be conducted that are inclusive of different metrologies and manufacturers. Such experiments should also examine instrument durability.
Author Contributions
Funding
Data Availability Statement
Conflicts of Interest
Nomenclature
| a | constant in Best DSD approximation (Equation (10)) |
| a1 | constant in droplet terminal velocity equation (ƒ(droplet radius)) (Equation (2)) |
| A | Weibull distribution scale parameter (Equation (19)) |
| AEP | annual energy production |
| ARM | Atmospheric Radiation Measurement site operated by the US Department of Energy |
| ASL | above sea level |
| B | constant in droplet terminal velocity equation (ƒ(droplet radius)) (Equation (2)) |
| c | intercept of regression equation (Equation (2)) |
| c1 | density correction factor in the approximation for the terminal fall velocity for deformed droplets (ƒ(ambient pressure)) (Equation (12)) |
| CD | drag coefficient for terminal velocity of hail stones (Equation (3)) |
| CoCoRaHS | Community Collaborative Rain, Hail and Snow network |
| D | hydrometeor diameter |
| Di | hydrometeor diameter class |
| dD or ΔD | hydrometeor diameter interval |
| DiVeN | UK Disdrometer Verification Network |
| D0 | median droplet diameter |
| Dm | mass-weighted droplet mean diameter (Equation (8)) |
| Dmax | hailstone maximum diameter |
| dN/dD or N(D) | number density—i.e., concentrations of hydrometeors per cubic meter as a function of diameter normalized for a fixed diameter interval |
| DNV | Det Norske Veritas |
| DoE | US Department of Energy |
| DSD | droplet size distribution |
| DTU | Danish Technical University |
| ECMWF | European Centre for Medium-Range Weather Forecasts |
| ERA5 | fifth generation ECMWF atmospheric reanalysis of the global climate |
| F | area field of view of the disdrometer |
| FAR | False Alarm Rate |
| Feff | effective sampling area of the disdrometer |
| g | gravitational acceleration |
| GCHN | Global Historical Climatology Network |
| GW | GigaWatt (109 Watts) |
| GPCC | Global Precipitation Climatology Centre |
| GPM | Global Precipitation Measurement |
| GWEC | Global Wind Energy Council |
| HR | Hit Rate |
| IEA Wind TCP | International Energy Agency Wind Technology Collaboration Programme |
| IMERG | Integrated Multi-satellitE Retrievals for the GPM |
| kB | constant in Best DSD approximation (Equation (10)) |
| k | Weibull distribution shape parameter (Equation (19)) |
| L | length of disdrometer viewing area |
| LCoE | levelized cost of energy |
| LEE | leading edge erosion |
| LEP | leading edge protection |
| LPM | Thies Laser Precipitation Monitor |
| LWC | liquid water content of air |
| MW | MegaWatt (106 Watts) |
| Mn | nth moment of the measured hydrometeor size distribution (Equation (17)) |
| m | slope of regression equation (Equation (18)) |
| MRR | Micro-rain RADAR |
| NH | Northern Hemisphere |
| NOAA | US National Oceanic and Atmospheric Administration |
| NORA3 | 3 km Norwegian reanalysis |
| N | Number of droplets above given diameter in Marshall-Palmer approximation (Equation (9)) |
| N0 | constant in the Marshall-Palmer DSD approximation (Equation (9)) |
| NB | number of size bins measured by disdrometer (Equation (17)) |
| n | constant in droplet terminal velocity equation (ƒ(droplet radius)) (Equation (2)) |
| ni | droplet number count in diameter class i |
| Nw | droplet distribution intercept parameter (Equation (6)) |
| PoP | Probability of Precipitation |
| PWS | Present Weather System |
| r | Pearson (parametric) correlation coefficient |
| RADAR | RAdio Detection Additionally, Ranging |
| RET | accelerated Rain Erosion Test |
| R | droplet radius |
| Rh | hailstone radius |
| R0 | constant in approximation for terminal fall velocity of droplets accounting for deformation of the droplet (Equation (8)) |
| R1 | constant in approximation for terminal fall velocity of droplets accounting for deformation of the droplet |
| RR | rain rate (i.e., rate at which water is accumulated at the surface) |
| RPM | revolutions per minute |
| SGP | Southern Great Plains |
| t | Temporal sampling interval |
| US SGP | DoE ARM site |
| UV | ultraviolet radiation |
| vtx | hydrometeor terminal fall velocity, where x = rain or hail (Equations (1)–(5) and (12)). |
| vt(Di) | fall velocity of a hydrometeor of a given diameter |
| V | spherical volume of the droplet |
| VDIS | video disdrometers |
| w0 | constant in approximation for terminal fall velocity of droplets accounting for deformation of the droplet (Equation (8)) |
| w1 | constant in approximation for terminal fall velocity of droplets accounting for deformation of the droplet (Equation (8)) |
| WAO | Weybourne Atmospheric Observatory |
| WA | width of disdrometer viewing area |
| W | total water volume |
| WEICan | Wind Energy Institute of Canada |
| WC | Weather Code |
| WMO | World Meteorological Organization |
| WRF | Weather Research and Forecasting model |
| WS | wind speed |
| k | constant in droplet terminal velocity estimation (Equation (1)) |
| λ | fitting parameter in hail stone distribution (Equation (11)) |
| λw | wavelength of radiation used by disdrometer |
| Λ | constant in the Marshall-Palmer DSD approximation |
| μ | shape parameter of the gamma DSD |
| ρο | air density at sea level |
| ρair | air density at the given the altitude above sea level |
| ρi | density of ice |
| ρw | density of water |
| ρs | Spearman rank correlation coefficient |
References
- Mishnaevsky, L., Jr.; Hasager, C.B.; Bak, C.; Tilg, A.-M.; Bech, J.I.; Rad, S.D.; Fæster, S. Leading edge erosion of wind turbine blades: Understanding, prevention and protection. Renew. Energy 2021, 169, 953–969. [Google Scholar]
- Schramm, M.; Rahimi, H.; Stoevesandt, B.; Tangager, K. The Influence of Eroded Blades on Wind Turbine Performance Using Numerical Simulations. Energies 2017, 10, 1420. [Google Scholar]
- Ravishankara, A.K.; Özdemir, H.; van der Weide, E. Analysis of leading edge erosion effects on turbulent flow over airfoils. Renew. Energy 2021, 172, 765–779. [Google Scholar]
- Papi, F.; Cappugi, L.; Salvadori, S.; Carnevale, M.; Bianchini, A. Uncertainty quantification of the effects of blade damage on the actual energy production of modern wind turbines. Energies 2020, 13, 3785. [Google Scholar]
- Maniaci, D.C.; Westergaard, C.; Hsieh, A.; Paquette, J.A. (Eds.) Uncertainty Quantification of Leading Edge Erosion Impacts on Wind Turbine Performance. J. Phys. Conf. Ser. 2020, 1618, 052082. [Google Scholar]
- Bak, C.; Gaunaa, M.; Olsen, A.S.; Kruse, E.K. What is the Critical Height of Leading Edge Roughness for Aerodynamics? J. Phys. Conf. Ser. 2016, 753, 022023. [Google Scholar] [CrossRef]
- Mishnaevsky, L., Jr.; Thomsen, K. Costs of repair of wind turbine blades: Influence of technology aspects. Wind Energy 2020, 23, 2247–2255. [Google Scholar] [CrossRef]
- McGugan, M.; Mishnaevsky, L., Jr. Damage mechanism based approach to the structural health monitoring of wind turbine blades. Coatings 2020, 10, 1223. [Google Scholar]
- Du, Y.; Zhou, S.; Jing, X.; Peng, Y.; Wu, H.; Kwok, N. Damage detection techniques for wind turbine blades: A review. Mech. Syst. Signal Process. 2020, 141, 106445. [Google Scholar]
- Herring, R.; Dyer, K.; Martin, F.; Ward, C. The increasing importance of leading edge erosion and a review of existing protection solutions. Renew. Sustain. Energy Rev. 2019, 115, 109382. [Google Scholar]
- Duthé, G.; Abdallah, I.; Barber, S.; Chatzi, E. Modeling and monitoring erosion of the leading edge of wind turbine blades. Energies 2021, 14, 7262. [Google Scholar]
- Herring, R.; Dyer, K.; MacLeod, A.; Ward, C. (Eds.) Computational fluid dynamics methodology for characterisation of leading edge erosion in whirling arm test rigs. J. Phys. Conf. Ser. 2019, 1222, 012011. [Google Scholar]
- Mackie, C., Nash, D., Boyce, D., Wright, M., Dyer, K., Eds.; Characterisation of a whirling arm erosion test rig. In Proceedings of the 2018 Asian Conference on Energy, Power and Transportation Electrification (ACEPT), Singapore, 30 October–2 November 2018. [Google Scholar]
- Eisenberg, D.; Laustsen, S.; Stege, J. Wind turbine blade coating leading edge rain erosion model: Development and validation. Wind Energy 2018, 21, 942–951. [Google Scholar]
- Verma, A.S.; Castro, S.G.; Jiang, Z.; Teuwen, J.J. Numerical investigation of rain droplet impact on offshore wind turbine blades under different rainfall conditions: A parametric study. Compos. Struct. 2020, 241, 112096. [Google Scholar] [CrossRef]
- Castorrini, A.; Venturini, P.; Bonfiglioli, A. Generation of Surface Maps of Erosion Resistance for Wind Turbine Blades under Rain Flows. Energies 2022, 15, 5593. [Google Scholar] [CrossRef]
- Hoksbergen, N.; Akkerman, R.; Baran, I. The Springer model for lifetime prediction of wind turbine blade leading edge protection systems: A review and sensitivity study. Materials 2022, 15, 1170. [Google Scholar]
- Major, D.; Palacios, J.; Maughmer, M.; Schmitz, S. Aerodynamics of leading-edge protection tapes for wind turbine blades. Wind Eng. 2021, 45, 1296–1316. [Google Scholar]
- Finnegan, W.; Flanagan, T.; Goggins, J. (Eds.) Development of a novel solution for leading edge erosion on offshore wind turbine blades. In Proceedings of the 13th International Conference on Damage Assessment of Structures; Springer: Berlin/Heidelberg, Germany, 2020. [Google Scholar]
- Fæster, S.; Johansen, N.F.J.; Mishnaevsky, L., Jr.; Kusano, Y.; Bech, J.I.; Madsen, M.B. Rain erosion of wind turbine blades and the effect of air bubbles in the coatings. Wind Energy 2021, 24, 1071–1082. [Google Scholar]
- Frost-Jensen Johansen, N.; Mishnaevsky, L., Jr.; Dashtkar, A.; Williams, N.A.; Fæster, S.; Silvello, A.; Cano, I.G.; Hadavinia, H. Nanoengineered graphene-reinforced coating for leading edge protection of wind turbine blades. Coatings 2021, 11, 1104. [Google Scholar]
- Verma, A.S.; Noi, S.D.; Ren, Z.; Jiang, Z.; Teuwen, J.J. Minimum leading edge protection application length to combat rain-induced erosion of wind turbine blades. Energies 2021, 14, 1629. [Google Scholar] [CrossRef]
- Slot, H.; Gelinck, E.; Rentrop, C.; van der Heide, E. Leading edge erosion of coated wind turbine blades: Review of coating life models. Renew. Energy 2015, 80, 837–848. [Google Scholar] [CrossRef]
- Cortés, E.; Sánchez, F.; Domenech, L.; Olivares, A.; Young, T.; O’Carroll, A.; Chinesta, F. (Eds.) Manufacturing issues which affect coating erosion performance in wind turbine blades. In AIP Conference Proceedings; AIP Publishing LLC: College Park, MD, USA, 2017. [Google Scholar]
- Herring, R.; Domenech, L.; Renau, J.; Šakalytė, A.; Ward, C.; Dyer, K.; Sánchez, F. Assessment of a wind turbine blade erosion lifetime prediction model with industrial protection materials and testing methods. Coatings 2021, 11, 767. [Google Scholar]
- Nash, D.; Leishman, G.; Mackie, C.; Dyer, K.; Yang, L. A staged approach to erosion analysis of wind turbine blade coatings. Coatings 2021, 11, 681. [Google Scholar]
- Bartolomé, L.; Teuwen, J. Prospective challenges in the experimentation of the rain erosion on the leading edge of wind turbine blades. Wind Energy 2019, 22, 140–151. [Google Scholar] [CrossRef]
- Pugh, K.; Rasool, G.; Stack, M.M. Raindrop erosion of composite materials: Some views on the effect of bending stress on erosion mechanisms. J. Bio-Tribo-Corros. 2019, 5, 45. [Google Scholar] [CrossRef]
- Hasager, C.B.; Vejen, F.; Skrzypiński, W.R.; Tilg, A.-M. Rain Erosion Load and Its Effect on Leading-Edge Lifetime and Potential of Erosion-Safe Mode at Wind Turbines in the North Sea and Baltic Sea. Energies 2021, 14, 1959. [Google Scholar]
- Bech, J.I.; Hasager, C.B.; Bak, C. Extending the life of wind turbine blade leading edges by reducing the tip speed during extreme precipitation events. Wind Energy Sci. 2018, 3, 729–748. [Google Scholar]
- Skrzypiński, W.; Bech, J.; Hasager, C.B.; Tilg, A.; Bak, F.V.C. (Eds.) Optimization of the erosion-safe operation of the IEA Wind 15 MW Reference Wind Turbine. J. Phys. Conf. Ser. 2020, 1618, 052034. [Google Scholar]
- Mishnaevsky, L.; Branner, K.; Petersen, H.; Beauson, J.; McGugan, M.; Sørensen, B. Materials for wind turbine blades: An overview. Materials 2017, 10, 1285. [Google Scholar] [CrossRef]
- Brøndsted, P.; Lilholt, H.; Lystrup, A. Composite materials for wind power turbine blades. Annu. Rev. Mater Res. 2005, 35, 505–538. [Google Scholar]
- Zhang, S.; Dam-Johansen, K.; Nørkjær, S.; Bernad, P.L., Jr.; Kiil, S. Erosion of wind turbine blade coatings–design and analysis of jet-based laboratory equipment for performance evaluation. Prog. Org. Coat. 2015, 78, 103–115. [Google Scholar] [CrossRef]
- Keegan, M.H.; Nash, D.; Stack, M. On erosion issues associated with the leading edge of wind turbine blades. J. Phys. D Appl. Phys. 2013, 46, 383001. [Google Scholar] [CrossRef]
- Cortés, E.; Sánchez, F.; O’Carroll, A.; Madramany, B.; Hardiman, M.; Young, T.M. On the Material Characterisation of Wind Turbine Blade Coatings. Materials 2017, 10, 1146. [Google Scholar] [CrossRef]
- Traphan, D.; Herráez, I.; Meinlschmidt, P.; Schlüter, F.; Peinke, J.; Gülker, G. Remote surface damage detection on rotor blades of operating wind turbines by means of infrared thermography. Wind Energy Sci. 2018, 3, 639–650. [Google Scholar]
- Preece, C.M. Treatise on Materials Science and Technology; Doremus, R.H., Tomozawa, M., Eds.; Academic Press: New York, NY, USA, 1979; Volume 16, 450p. [Google Scholar]
- Ellis, R.; Sandford, A.P.; Jones, G.; Richards, J.; Petzing, J.; Coupland, J.M. New laser technology to determine present weather parameters. Meas. Sci. Technol. 2006, 17, 1715. [Google Scholar] [CrossRef]
- Stull, R.B. Practical Meteorology: An Algebra-based Survey of Atmospheric Science; University of British Columbia: Vancouver, BC, Canada, 2017; 940p, ISBN 978-0-88865-283-6. [Google Scholar]
- Best, A. The size distribution of raindrops. Q. J. R. Meteorol. Soc. 1950, 76, 16–36. [Google Scholar]
- Heymsfield, A.J.; Giammanco, I.M.; Wright, R. Terminal velocities and kinetic energies of natural hailstones. Geophys. Res. Lett. 2014, 41, 8666–8672. [Google Scholar]
- Fehlmann, M.; Rohrer, M.; von Lerber, A.; Stoffel, M. Automated precipitation monitoring with the Thies disdrometer: Biases and ways for improvement. Atmos. Meas. Tech. 2020, 13, 4683–4698. [Google Scholar]
- Li, S.; Barthelmie, R.J.; Bewley, G.P.; Pryor, S.C. Quantifying hydrometeor droplet impact probabilities for wind turbine blade leading edge erosion analyses. J. Phys. Conf. Ser. 2020, 1452, 012053. [Google Scholar] [CrossRef]
- Prieto, R.; Karlsson, T. A model to estimate the effect of variables causing erosion in wind turbine blades. Wind Energy 2021, 24, 1031–1044. [Google Scholar]
- DNVGL. Evaluation of Erosion and Delamination for Leading Edge Protection Systems of Rotor Blades. Document #: DNVGL-RP-0573, 44p. Available online: https://www.document-center.com/standards/show/DNVGL-RP-0573 (accessed on 1 October 2022).
- Bolgiani, P.; Fernández-González, S.; Valero, F.; Merino, A.; García-Ortega, E.; Sánchez, J.L.; Martín, M.L. Simulation of atmospheric microbursts using a numerical mesoscale model at high spatiotemporal resolution. J. Geophys. Res. Atmos. 2020, 125, e2019JD031791. [Google Scholar]
- Springer, G.S.; Yang, C.-I.; Larsen, P.S. Analysis of rain erosion of coated materials. J. Compos. Mater. 1974, 8, 229–252. [Google Scholar] [CrossRef]
- Visbech, J.; Göçmen, T.; Hasager, C.B.; Shkalov, H.; Handberg, M.; Nielsen, K.P. Introducing a data-driven approach to predict site-specific leading edge erosion. Wind Energy Sci. Discuss. 2022, 1–30. [Google Scholar] [CrossRef]
- Savana, R. Effect of Hail Impact on Leading Edge Polyurethane Composites: TUDelft. 2022. Available online: http://repository.tudelft.nl/ (accessed on 19 October 2022).
- Barthelmie, R.J.; Shepherd, T.J.; Aird, J.A.; Pryor, S.C. Power and wind shear implications of large wind turbine scenarios in the U.S. Central Plains. Energies 2020, 13, 4269. [Google Scholar] [CrossRef]
- Pryor, S.C.; Barthelmie, R.J.; Shepherd, T.J. Wind power production from very large offshore wind farms. Joule 2021, 5, 2663–2686. [Google Scholar]
- Shields, M.; Beiter, P.; Nunemaker, J.; Cooperman, A.; Duffy, P. Impacts of turbine and plant upsizing on the levelized cost of energy for offshore wind. Appl. Energy 2021, 298, 117189. [Google Scholar]
- Nielsen, J.S.; Tcherniak, D.; Ulriksen, M.D. A case study on risk-based maintenance of wind turbine blades with structural health monitoring. Struct. Infrastruct. Eng. 2020, 17, 302–318. [Google Scholar]
- Steffen, B.; Beuse, M.; Tautorat, P.; Schmidt, T.S. Experience curves for Operations and Maintenance costs of renewable energy technologies. Joule 2020, 4, 359–375. [Google Scholar] [CrossRef]
- Ren, Z.; Verma, A.S.; Li, Y.; Teuwen, J.J.; Jiang, Z. Offshore wind turbine operations and maintenance: A state-of-the-art review. Renew. Sustain. Energy Rev. 2021, 144, 110886. [Google Scholar]
- Mason, B.J.; Andrews, J.B. Drop—Size distributions from various types of rain. Q. J. R. Meteorol. Soc. 1960, 86, 346–353. [Google Scholar]
- Dolan, B.; Fuchs, B.; Rutledge, S.; Barnes, E.; Thompson, E. Primary modes of global drop size distributions. J. Atmos. Sci. 2018, 75, 1453–1476. [Google Scholar] [CrossRef]
- Baltas, E.; Panagos, D.; Mimikou, M. Statistical analysis of the raindrop size distribution using disdrometer data. Hydrology 2016, 3, 9. [Google Scholar]
- Testud, J.; Oury, S.; Black, R.A.; Amayenc, P.; Dou, X. The concept of “normalized” distribution to describe raindrop spectra: A tool for cloud physics and cloud remote sensing. J. Appl. Meteorol. 2001, 40, 1118–1140. [Google Scholar] [CrossRef]
- Marshall, J.S.; Palmer, W.M.K. The distribution of raindrops with size. J. Meteorol. 1948, 5, 165–166. [Google Scholar]
- Straka, J.M.; Zrnić, D.S.; Ryzhkov, A.V. Bulk hydrometeor classification and quantification using polarimetric radar data: Synthesis of relations. J. Appl. Meteorol. 2000, 39, 1341–1372. [Google Scholar]
- Ulbrich, C.W.; Atlas, D. Rainfall microphysics and radar properties: Analysis methods for drop size spectra. J. Appl. Meteorol. 1998, 37, 912–923. [Google Scholar]
- Cheng, L.; English, M. A relationship between hailstone concentration and size. J. Atmos. Sci. 1983, 40, 204–213. [Google Scholar]
- Cheng, L.; English, M.; Wong, R. Hailstone size distributions and their relationship to storm thermodynamics. J. Appl. Meteorol. Climatol. 1985, 24, 1059–1067. [Google Scholar]
- Zhang, A.; Hu, J.; Chen, S.; Hu, D.; Liang, Z.; Huang, C.; Xiao, L.; Min, C.; Li, H. Statistical characteristics of raindrop size distribution in the monsoon season observed in southern China. Remote Sens. 2019, 11, 432. [Google Scholar]
- Allen, J.T.; Giammanco, I.M.; Kumjian, M.R.; Jurgen Punge, H.; Zhang, Q.; Groenemeijer, P.; Kunz, M.; Ortega, K. Understanding hail in the earth system. Rev. Geophys. 2020, 58, e2019RG000665. [Google Scholar] [CrossRef]
- Menne, M.J.; Durre, I.; Vose, R.S.; Gleason, B.E.; Houston, T.G. An overview of the global historical climatology network-daily database. J. Atmos. Ocean. Technol. 2012, 29, 897–910. [Google Scholar]
- Schneider, U.; Finger, P.; Meyer-Christoffer, A.; Rustemeier, E.; Ziese, M.; Becker, A. Evaluating the hydrological cycle over land using the newly-corrected precipitation climatology from the Global Precipitation Climatology Centre (GPCC). Atmosphere 2017, 8, 52. [Google Scholar] [CrossRef]
- Sun, Q.; Miao, C.; Duan, Q.; Ashouri, H.; Sorooshian, S.; Hsu, K.L. A review of global precipitation data sets: Data sources, estimation, and intercomparisons. Rev. Geophys. 2018, 56, 79–107. [Google Scholar] [CrossRef]
- Sadeghi, M.; Nguyen, P.; Naeini, M.R.; Hsu, K.; Braithwaite, D.; Sorooshian, S. PERSIANN-CCS-CDR, a 3-hourly 0.04° global precipitation climate data record for heavy precipitation studies. Sci. Data 2021, 8, 1–11. [Google Scholar]
- Raupach, T.H.; Martius, O.; Allen, J.T.; Kunz, M.; Lasher-Trapp, S.; Mohr, S.; Rasmussen, K.L.; Trapp, R.J.; Zhang, Q. The effects of climate change on hailstorms. Nat. Rev. Earth Environ. 2021, 2, 213–226. [Google Scholar]
- Prein, A.F.; Holland, G.J. Global estimates of damaging hail hazard. Weather Clim. Extrem. 2018, 22, 10–23. [Google Scholar]
- Laviola, S.; Monte, G.; Levizzani, V.; Ferraro, R.R.; Beauchamp, J. A new method for hail detection from the GPM constellation: A prospect for a global hailstorm climatology. Remote Sens. 2020, 12, 3553. [Google Scholar]
- Bang, S.D.; Cecil, D.J. Constructing a multifrequency passive microwave hail retrieval and climatology in the GPM domain. J. Appl. Meteorol. Climatol. 2019, 58, 1889–1904. [Google Scholar] [CrossRef]
- Huffman, G.J.; Bolvin, D.T.; Braithwaite, D.; Hsu, K.-L.; Joyce, R.J.; Kidd, C.; Nelkin, E.J.; Sorooshian, S.; Stocker, E.F.; Tan, J. Integrated multi-satellite retrievals for the global precipitation measurement (GPM) mission (IMERG). In Satellite Precipitation Measurement; Springer: Cham, Switzerland, 2020; pp. 343–353. [Google Scholar]
- Zhang, Y.; Wang, K. Global precipitation system size. Environ. Res. Lett. 2021, 16, 054005. [Google Scholar]
- Letson, F.W.; Barthelmie, R.J.; Pryor, S.C. Sub-regional variability in wind turbine blade leading-edge erosion potential. J. Phys. Conf. Ser. 2020, 1618, 032046. [Google Scholar] [CrossRef]
- GWEC. Global Wind Report 2020: Global Wind Energy Council, Brussels, Belgium. 78p. Available online: https://gwec.net/global-wind-report-2020/ (accessed on 15 June 2021).
- Pryor, S.C.; Barthelmie, R.J. A global assessment of extreme wind speeds for wind energy applications. Nat. Energy 2021, 6, 268–276. [Google Scholar]
- Pryor, S.C.; Barthelmie, R.J.; Bukovsky, M.S.; Leung, L.R.; Sakaguchi, K. Climate change impacts on wind power generation. Nat. Rev. Earth Environ. 2020, 1, 627–643. [Google Scholar]
- Gruber, K.; Regner, P.; Wehrle, S.; Zeyringer, M.; Schmidt, J. Towards global validation of wind power simulations: A multi-country assessment of wind power simulation from MERRA-2 and ERA-5 reanalyses bias-corrected with the global wind atlas. Energy 2022, 238, 121520. [Google Scholar]
- Sivapalan, M.; Blöschl, G. Transformation of point rainfall to areal rainfall: Intensity-duration-frequency curves. J. Hydrol. 1998, 204, 150–167. [Google Scholar] [CrossRef]
- Courty, L.G.; Wilby, R.L.; Hillier, J.K.; Slater, L.J. Intensity-duration-frequency curves at the global scale. Environ. Res. Lett. 2019, 14, 084045. [Google Scholar]
- Haerter, J.O.; Berg, P.; Hagemann, S. Heavy rain intensity distributions on varying time scales and at different temperatures. J. Geophys. Res. Earth Surf. 2010, 115, D17102. [Google Scholar] [CrossRef]
- Tokay, A.; Bashor, P.G.; McDowell, V.L. Comparison of rain gauge measurements in the mid-Atlantic region. J. Hydrometeorol. 2010, 11, 553–565. [Google Scholar]
- Panagos, P.; Borrelli, P.; Meusburger, K.; Yu, B.; Klik, A.; Jae Lim, K.; Yang, J.E.; Ni, J.; Miao, C.; Chattopadhyay, N.; et al. Global rainfall erosivity assessment based on high-temporal resolution rainfall records. Sci. Rep. 2017, 7, 4175. [Google Scholar] [CrossRef]
- Kochendorfer, J.; Earle, M.E.; Hodyss, D.; Reverdin, A.; Roulet, Y.-A.; Nitu, R.; Rasmussen, R.; Landolt, S.; Buisán, S.; Laine, T. Undercatch adjustments for tipping-bucket gauge measurements of solid precipitation. J. Hydrometeorol. 2020, 21, 1193–1205. [Google Scholar]
- Fulton, R.A.; Breidenbach, J.P.; Seo, D.-J.; Miller, D.A.; O’Bannon, T. The WSR-88D rainfall algorithm. Weather Forecast. 1998, 13, 377–395. [Google Scholar] [CrossRef]
- Wallace, R.; Friedrich, K.; Kalina, E.A.; Schlatter, P. Using operational radar to identify deep hail accumulations from thunderstorms. Weather Forecast. 2019, 34, 133–150. [Google Scholar]
- Nijssen, B.; Lettenmaier, D.P. Effect of precipitation sampling error on simulated hydrological fluxes and states: Anticipating the Global Precipitation Measurement satellites. J. Geophys. Res. Earth Surf. 2004, 109, D02103. [Google Scholar] [CrossRef]
- Letson, F.W.; Barthelmie, R.J.; Pryor, S.C. RADAR-derived precipitation climatology for wind turbine blade leading edge erosion. Wind Energy Sci. 2020, 5, 331–347. [Google Scholar]
- Kathiravelu, G.; Lucke, T.; Nichols, P. Rain drop measurement techniques: A review. Water 2016, 8, 29. [Google Scholar]
- Kruger, A.; Krajewski, W.F. Two-dimensional video disdrometer: A description. J. Atmos. Ocean. Technol. 2002, 19, 602–617. [Google Scholar]
- Bartholomew, M.J. Two-Dimensional Video Disdrometer (VDIS) Instrument Handbook. U.S. Department of Energy: Office of Science, DOE/SC-ARM-TR-275. 2020. Available online: https://www.arm.gov/capabilities/instruments/vdis (accessed on 1 October 2022).
- Raupach, T.H.; Berne, A. Correction of raindrop size distributions measured by Parsivel disdrometers, using a two-dimensional video disdrometer as a reference. Atmos. Meas. Tech. 2015, 8, 343–365. [Google Scholar]
- Thurai, M.; Gatlin, P.; Bringi, V.; Petersen, W.; Kennedy, P.; Notaroš, B.; Carey, L. Toward completing the raindrop size spectrum: Case studies involving 2D-video disdrometer, droplet spectrometer, and polarimetric radar measurements. J. Appl. Meteorol. Climatol. 2017, 56, 877–896. [Google Scholar]
- Tokay, A.; Kruger, A.; Krajewski, W.F. Comparison of drop size distribution measurements by impact and optical disdrometers. J. Appl. Meteorol. Climatol. 2001, 40, 2083–2097. [Google Scholar]
- Bartholomew, M.J. Impact Disdrometer Instrument Handbooks; U.S. Department of Energy: Office of Science, DOE/SC-ARM-TR-111. 2016. Available online: https://www.arm.gov/capabilities/instruments/disdrometer (accessed on 1 October 2022).
- Löffler-Mang, M.; Joss, J. An optical disdrometer for measuring size and velocity of hydrometeors. J. Atmos. Ocean. Technol. 2000, 17, 130–139. [Google Scholar]
- Bartholomew, M.J. Laser Disdrometer Instrument Handbooks. U.S. Department of Energy: Office of Science, DOE/SC-ARM-TR-137. 2020. Available online: https://www.arm.gov/capabilities/instruments/ldis (accessed on 1 October 2022).
- Chang, W.-Y.; Lee, G.; Jou, B.J.-D.; Lee, W.-C.; Lin, P.-L.; Yu, C.-K. Uncertainty in measured raindrop size distributions from four types of collocated instruments. Remote Sens. 2020, 12, 1167. [Google Scholar]
- Wang, D.; Bartholomew, M.J.; Giangrande, S.E.; Hardin, J.C. Analysis of Three Types of Collocated Disdrometer Measurements at the ARM Southern Great Plains Observatory; Oak Ridge National Lab.(ORNL): Oak Ridge, TN, USA, 2021. [Google Scholar]
- Friedrich, K.; Higgins, S.; Masters, F.J.; Lopez, C.R. Articulating and stationary PARSIVEL disdrometer measurements in conditions with strong winds and heavy rainfall. J. Atmos. Ocean. Technol. 2013, 30, 2063–2080. [Google Scholar] [CrossRef]
- Okachi, H.; Yamada, T.J.; Baba, Y.; Kubo, T. Characteristics of Rain and Sea Spray Droplet Size Distribution at a Marine Tower. Atmosphere 2020, 11, 1210. [Google Scholar]
- Tokay, A.; Wolff, D.B.; Petersen, W.A. Evaluation of the new version of the laser-optical disdrometer, OTT Parsivel2. J. Atmos. Ocean. Technol. 2014, 31, 1276–1288. [Google Scholar]
- Gunn, R.; Kinzer, G.D. The terminal velocity of fall for water droplets in stagnant air. J. Atmos. Sci. 1949, 6, 243–248. [Google Scholar] [CrossRef]
- Battaglia, A.; Rustemeier, E.; Tokay, A.; Blahak, U.; Simmer, C. PARSIVEL snow observations: A critical assessment. J. Atmos. Ocean. Technol. 2010, 27, 333–344. [Google Scholar] [CrossRef]
- Huang, C.; Chen, S.; Zhang, A.; Pang, Y. Statistical Characteristics of Raindrop Size Distribution in Monsoon Season over South China Sea. Remote Sens. 2021, 13, 2878. [Google Scholar]
- Tapiador, F.J.; Navarro, A.; Moreno, R.; Jiménez-Alcázar, A.; Marcos, C.; Tokay, A.; Durán, L.; Bodoque, J.M.; Martín, R.; Petersen, W.; et al. On the optimal measuring area for pointwise rainfall estimation: A dedicated experiment with 14 laser disdrometers. J. Hydrometeorol. 2017, 18, 753–760. [Google Scholar]
- Pickering, B.S.; Neely, I.I.I.R.R.; Harrison, D. The Disdrometer Verification Network (DiVeN): A UK network of laser precipitation instruments. Atmos. Meas. Tech. 2019, 12, 5845–5861. [Google Scholar]
- Jaffrain, J.; Berne, A. Experimental quantification of the sampling uncertainty associated with measurements from PARSIVEL disdrometers. J. Hydrometeorol. 2011, 12, 352–370. [Google Scholar]
- Friedrich, K.; Kalina, E.A.; Masters, F.J.; Lopez, C.R. Drop-size distributions in thunderstorms measured by optical disdrometers during VORTEX2. Mon. Weather. Rev. 2013, 141, 1182–1203. [Google Scholar]
- Agnew, J.; Space, R. Final Report on the Operation of a Campbell Scientific PWS100 Present Weather Sensor at Chilbolton Observatory; Science & Technology Facilities Council: Swindon, UK, 2013. [Google Scholar]
- Klugmann, D.; Heinsohn, K.; Kirtzel, H.-J. A low cost 24 GHz FM-CW Doppler radar rain profiler. Contrib. Atmos. Phys. 1996, 69, 247–253. [Google Scholar]
- Löffler-Mang, M.; Kunz, M.; Schmid, W. On the performance of a low-cost K-band Doppler radar for quantitative rain measurements. J. Atmos. Ocean. Technol. 1999, 16, 379–387. [Google Scholar]
- Peters, G.; Fischer, B.; Münster, H.; Clemens, M.; Wagner, A. Profiles of raindrop size distributions as retrieved by microrain radars. J. Appl. Meteorol. 2005, 44, 1930–1949. [Google Scholar]
- Garcia-Benadi, A.; Bech, J.; Gonzalez, S.; Udina, M.; Codina, B.; Georgis, J.-F. Precipitation type classification of micro rain radar data using an improved doppler spectral processing methodology. Remote Sens. 2020, 12, 4113. [Google Scholar]
- Reges, H.W.; Doesken, N.; Turner, J.; Newman, N.; Bergantino, A.; Schwalbe, Z. CoCoRaHS: The evolution and accomplishments of a volunteer rain gauge network. Bull. Am. Meteorol. Soc. 2016, 97, 1831–1846. [Google Scholar]
- Towery, N.G.; Changnon, S.A., Jr.; Morgan, G.M., Jr. A review of hail-measuring instruments. Bull. Am. Meteorol. Soc. 1976, 57, 1132–1141. [Google Scholar] [CrossRef]
- Palencia, C.; Castro, A.; Giaiotti, D.; Stel, F.; Fraile, R. Dent overlap in hailpads: Error estimation and measurement correction. J. Appl. Meteorol. Climatol. 2011, 50, 1073–1087. [Google Scholar]
- Soderholm, J.S.; Kumjian, M.R.; McCarthy, N.; Maldonado, P.; Wang, M. Quantifying hail size distributions from the sky–application of drone aerial photogrammetry. Atmos. Meas. Tech. 2020, 13, 747–754. [Google Scholar]
- Wilks, D.S. Statistical Methods in the Atmospheric Sciences; Academic Press: Oxford, UK, 2011; ISBN 9780123850225. [Google Scholar]
- Hersbach, H.; Bell, B.; Berrisford, P.; Hirahara, S.; Horányi, A.; Muñoz-Sabater, J.; Nicolas, J.; Peubey, C.; Radu, R.; Schepers, D.; et al. The ERA5 global reanalysis. Q. J. R. Meteorol. Soc. 2020, 146, 1999–2049. [Google Scholar] [CrossRef]
- Haakenstad, H.; Breivik, Ø.; Furevik, B.R.; Reistad, M.; Bohlinger, P.; Aarnes, O.J. NORA3: A nonhydrostatic high-resolution hindcast of the North Sea, the Norwegian Sea, and the Barents Sea. J. Appl. Meteorol. Climatol. 2021, 60, 1443–1464. [Google Scholar]
- Pryor, S.C.; Nielsen, M.; Barthelmie, R.J.; Mann, J. Can satellite sampling of offshore wind speeds realistically represent wind speed distributions? Part II: Quantifying uncertainties associated with sampling strategy and distribution fitting methods. J. Appl. Meteorol. 2004, 43, 739–750. [Google Scholar]
- Newsom, R.; Krishnamurthy, R. Doppler Lidar (DL) Instrument Handbook; U.S. Department of Energy: Office of Science, DOE/SC-ARM-TR-101. 2020. Available online: https://www.arm.gov/capabilities/instruments/dl (accessed on 1 October 2022).
- Letson, F.; Shepherd, T.J.; Barthelmie, R.J.; Pryor, S.C. WRF modelling of deep convection and hail for wind power applications. J. Appl. Meteorol. Climatol. 2020, 59, 1717–1733. [Google Scholar]
- Pryor, S.C.; Letson, F.; Shepherd, T.J.; Barthelmie, R.J. Evaluation of WRF simulation of deep convection in the US Southern Great Plains. J. Appl. Meteorol. Climatol. 2022, in press. [Google Scholar]
- Hoen, B.D.; Diffendorfer, J.E.; Rand, J.T.; Kramer, L.A.; Garrity, C.P.; Hunt, H.E. United States Wind Turbine Database (v4.3, (January 14, 2022); U.S. Geological Survey, American Clean Power Association, and Lawrence Berkeley National Laboratory Data Release. 2018. Available online: https://www.sciencebase.gov/catalog/item/57bdfd8fe4b03fd6b7df5ff9 (accessed on 1 October 2022).
- Barthelmie, R.J.; Doubrawa, P.; Wang, H.; Giroux, G.; Pryor, S.C. Effects of an escarpment on flow parameters of relevance to wind turbines. Wind Energy 2016, 19, 2271–2286. [Google Scholar]
- Penkett, S.; Plane, J.; Comes, F.; Clemitshaw, K.; Coe, H. The Weybourne atmospheric observatory. J. Atmos. Chem. 1999, 33, 107–110. [Google Scholar]
- Adirosi, E.; Baldini, L.; Roberto, N.; Gatlin, P.; Tokay, A. Improvement of vertical profiles of raindrop size distribution from micro rain radar using 2D video disdrometer measurements. Atmos. Res. 2016, 169, 404–415. [Google Scholar]
- Dahl, I.R.; Tveiten, B.W.; Cowan, E. The Case for Policy in Developing Offshore Wind: Lessons from Norway. Energies 2022, 15, 1569. [Google Scholar]
- Berg, T.L.; Apostolou, D.; Enevoldsen, P. Analysis of the wind energy market in Denmark and future interactions with an emerging hydrogen market. Int. J. Hydrogen Energy 2021, 46, 146–156. [Google Scholar] [CrossRef]
- Pryor, S.C.; Letson, F.W.; Barthelmie, R.J. Variability in wind energy generation across the contiguous United States. J. Appl. Meteorol. Climatol. 2020, 59, 2021–2039. [Google Scholar] [CrossRef]
- Hasager, C.; Vejen, F.; Bech, J.; Skrzypiński, W.; Tilg, A.-M.; Nielsen, M. Assessment of the rain and wind climate with focus on wind turbine blade leading edge erosion rate and expected lifetime in Danish Seas. Renew. Energy 2020, 149, 91–102. [Google Scholar]
- Bartolomé, L.; Teuwen, J. Methodology for the energetic characterisation of rain erosion on wind turbine blades using meteorological data: A case study for The Netherlands. Wind Energy 2021, 24, 686–698. [Google Scholar]
- Tilg, A.M.; Skrzypiński, W.R.; Hannesdóttir, Á.; Hasager, C.B. Effect of drop—Size parameterization and rain amount on blade—Lifetime calculations considering leading—Edge erosion. Wind Energy 2022, 25, 952–967. [Google Scholar]
- Bech, J.I.; Johansen, N.F.-J.; Madsen, M.B.; Hannesdóttir, Á.; Hasager, C.B. Experimental study on the effect of drop size in rain erosion test and on lifetime prediction of wind turbine blades. Renew. Energy 2022, in press. [Google Scholar]
- Mintu, S.A.; Molyneux, D.; Colbourne, B. (Eds.) Multi-Phase Simulation of Droplet Trajectories of Wave-Impact Sea Spray Over a Vessel. International Conference on Offshore Mechanics and Arctic Engineering; American Society of Mechanical Engineers: New York, NY, USA, 2019. [Google Scholar]
- Veron, F. Ocean spray. Annu. Rev. Fluid Mech. 2015, 47, 507–538. [Google Scholar]
- Herring, R.; Dyer, K.; Howkins, P.; Ward, C. Characterisation of the offshore precipitation environment to help combat leading edge erosion of wind turbine blades. Wind Energy Sci. 2020, 5, 1399–1409. [Google Scholar]
- Capozzi, V.; Annella, C.; Montopoli, M.; Adirosi, E.; Fusco, G.; Budillon, G. Influence of wind-induced effects on laser disdrometer measurements: Analysis and compensation strategies. Remote Sens. 2021, 13, 3028. [Google Scholar]
- Johannsen, L.L.; Zambon, N.; Strauss, P.; Dostal, T.; Neumann, M.; Zumr, D.; Cochrane, T.A.; Blöschl, G.; Klik, A. Comparison of three types of laser optical disdrometers under natural rainfall conditions. Hydrol. Sci. J. 2020, 65, 524–535. [Google Scholar]
- de Moraes Frasson, R.P.; Da Cunha, L.K.; Krajewski, W.F. Assessment of the Thies optical disdrometer performance. Atmos. Res. 2011, 101, 237–255. [Google Scholar] [CrossRef]
- Guyot, A.; Pudashine, J.; Protat, A.; Uijlenhoet, R.; Pauwels, V.; Seed, A.; Walker, J.P. Effect of disdrometer type on rain drop size distribution characterisation: A new dataset for south-eastern Australia. Hydrol. Earth Syst. Sci. 2019, 23, 4737–4761. [Google Scholar]
- Tokay, A.; Petersen, W.A.; Gatlin, P.; Wingo, M. Comparison of raindrop size distribution measurements by collocated disdrometers. J. Atmos. Ocean. Technol. 2013, 30, 1672–1690. [Google Scholar]
- Angulo-Martínez, M.; Beguería, S.; Latorre, B.; Fernández-Raga, M. Comparison of precipitation measurements by OTT Parsivel 2 and Thies LPM optical disdrometers. Hydrol. Earth Syst. Sci. 2018, 22, 2811–2837. [Google Scholar] [CrossRef]
- Sarkar, T.; Das, S.; Maitra, A. Assessment of different raindrop size measuring techniques: Inter-comparison of Doppler radar, impact and optical disdrometer. Atmos. Res. 2015, 160, 15–27. [Google Scholar]
- Krajewski, W.F.; Kruger, A.; Caracciolo, C.; Golé, P.; Barthes, L.; Creutin, J.-D.; Delahaye, J.-Y.; Nikolopoulos, E.I.; Ogden, F.; Vinson, J.-P. DEVEX-disdrometer evaluation experiment: Basic results and implications for hydrologic studies. Adv. Water Resour. 2006, 29, 311–325. [Google Scholar] [CrossRef]
- Marzuki, H.H.; Shimomai, T.; Rahayu, I.; Vonnisa, M. Performance evaluation of Micro Rain Radar over Sumatra through comparison with disdrometer and wind profiler. Prog. Electromagn. Res. M 2016, 50, 33–46. [Google Scholar]
- Thurai, M.; Petersen, W.A.; Tokay, A.; Schultz, C.; Gatlin, P. Drop size distribution comparisons between Parsivel and 2-D video disdrometers. Adv Geosci 2011, 30, 3–9. [Google Scholar]
- Wiser, R.; Bolinger, M.; Lantz, E. Assessing wind power operating costs in the United States: Results from a survey of wind industry experts. Renew. Energy Focus 2019, 30, 46–57. [Google Scholar]
- Duffy, A.; Hand, M.; Wiser, R.; Lantz, E.; Dalla Riva, A.; Berkhout, V.; Stenkvist, M.; Weir, D.; Lacal-Arántegui, R. Land-based wind energy cost trends in Germany, Denmark, Ireland, Norway, Sweden and the United States. Appl. Energy 2020, 277, 114777. [Google Scholar]
- Tapiador, F.J.; Turk, F.J.; Petersen, W.; Hou, A.Y.; García-Ortega, E.; Machado, L.A.; Angelis, C.F.; Salio, P.; Kidd, C.; Huffman, G.J.; et al. Global precipitation measurement: Methods, datasets and applications. Atmos. Res. 2012, 104, 70–97. [Google Scholar]
- Kidd, C.; Huffman, G.; Maggioni, V.; Chambon, P.; Oki, R. The Global Satellite Precipitation Constellation: Current status and future requirements. Bull. Am. Meteorol. Soc. 2021, 102, E1844–E1861. [Google Scholar] [CrossRef]
- Labriola, J.; Snook, N.; Jung, Y.; Xue, M. Explicit ensemble prediction of hail in 19 May 2013 Oklahoma City thunderstorms and analysis of hail growth processes with several multimoment microphysics schemes. Mon. Weather Rev. 2019, 147, 1193–1213. [Google Scholar]
- Barrett, A.I.; Wellmann, C.; Seifert, A.; Hoose, C.; Vogel, B.; Kunz, M. One step at a time: How model time step significantly affects convection—Permitting simulations. J. Adv. Modeling Earth Syst. 2019, 11, 641–658. [Google Scholar]
- Jeworrek, J.; West, G.; Stull, R. Evaluation of cumulus and microphysics parameterizations in WRF across the convective gray zone. Weather Forecast. 2019, 34, 1097–1115. [Google Scholar] [CrossRef]
- Tan, J.; Huffman, G.J.; Bolvin, D.T.; Nelkin, E.J. IMERG V06: Changes to the morphing algorithm. J. Atmos. Ocean. Technol. 2019, 36, 2471–2482. [Google Scholar] [CrossRef]
- Beck, H.E.; Pan, M.; Roy, T.; Weedon, G.P.; Pappenberger, F.; Van Dijk, A.I.; Huffman, G.J.; Adler, R.F.; Wood, E.F. Daily evaluation of 26 precipitation datasets using Stage-IV gauge-radar data for the CONUS. Hydrol. Earth Syst. Sci. 2019, 23, 207–224. [Google Scholar]
- Law, H.; Koutsos, V. Leading edge erosion of wind turbines: Effect of solid airborne particles and rain on operational wind farms. Wind Energy 2020, 23, 1955–1965. [Google Scholar]




| Location Label Used Here | Site | Instrument Type | Sampling Period | Probability of Hail/Graupel * (%) | PoP (RR > 0 mmhr−1) (%) | PoP (RR > 0.2 mmhr−1) (%) | 90th, 95th, 99th Percentile Values of RR (mmhr−1) |
|---|---|---|---|---|---|---|---|
| US SGP | DoE ARM, Lamont, SGP, USA * | OTT Parsivel2 | January 2017–December 2020 | 0.059 | 4.20 | 2.81 | 4.18, 7.72, 31.3 |
| 2D Video | N/A | 6.28 | 2.40 | 2.45, 4.70, 20.1 | |||
| Impact | N/A | 6.53 | 1.76 | 1.79, 3.68, 15.5 | |||
| Canada coastal | WEICan, Canada | CSI PWCS100 | October 2018–December 2020 | None reported | 7.47 | 3.81 | 1.99, 3.18, 9.52 |
| Coastal UK | WAO, UK | Thies LPM | February 2017–September 2019 | 0.0094 | 12.3 | 5.17 | 1.69, 2.97, 9.44 |
| Norway coastal | Bergen, Norway | OTT Parsivel2 | January 2016–December 2021 | 0.08 | 20.5 | 14.3 | 2.43, 3.98, 10.1 |
| MRR (100 m AGL) | January 2010–December 2014 and January 2016–December 2021 | N/A | 18.6 | 10.4 | 1.98, 3.48, 9.37 | ||
| MRR (200 m AGL) | N/A | 18.2 | 12.9 | 3.23, 5.60, 19.4 | |||
| MRR (300 m AGL) | N/A | 18.1 | 13.4 | 3.76, 6.56, 19.4 | |||
| North Sea | Horns Rev, Denmark | OTT Parsivel2 | December 2018–October 2021 | N/A | 6.9 | 4.1 | 1.68, 2.73, 7.75 |
| Denmark inland | DTU, Denmark | OTT Parsivel2 | June 2019–December 2021 | 0.03 | 7.4 | 4.19 | 2.05, 3.27, 8.59 |
| OTT Parsivel2 (10 min) | 0 | 11.6 | 4.72 | 1.82, 2.85, 7.15 |
| Reference | Instruments Considered | Comparison of Accumulated Precipitation (acc. PPT) or Rainfall Rates (RR) | Comparison of DSD |
|---|---|---|---|
| Johannsen et al. [145] | PWS100, Theis LPM, Parsivel1 | All underestimated of acc. PPT v weighing rain gauge | PWS100 higher modal D than Parsivel1 |
| Guyot et al. [147] | Theis, Parsivel1 | Theis LPM higher conc. of D < 0.6 mm | |
| Tokay et al. [148] | Impact, 2DVD, Parsivel1 | Negative bias in acc PPT in Parsivel1 | Differences in DSD and total number concentration (2DVD and Parsivel1) amplified at high RR |
| Angulo-Martinez et al. [149] | Theis LPM and Parsivel2 | Theis LPM lower median D than Parsivel2 | |
| De Moraes Frasson et al. [146] | Theis LPM and tipping bucket rain gauges | Large differences (18%) in seasonal acc PPT from 5 different Theis LPM disdrometers. Theis LPM positive bias relative to rain gauges. | |
| Fehlmann et al. [43] | Theis LPM, 2DVD | Theis LPM negative bias in RR | |
| Krajweski et al. [151] | 2DVD, Parsivel1 | RR consistently higher from Parsivel1 | Parsivel1 higher droplet counts, 2DVD higher conc. of D > 4 mm |
| Chang et al. [30] | 2DVD, MRR | MRR higher conc for D < 1 mm than ground-based disdrometers | |
| Marzuki et al. [152] | Parsivel1, MRR | Lower RR from MRR | MRR higher conc for D < 1 mm, Parsivel1 higher conc for D > 2 mm |
| Sarkar et al. [150] | Theis LPM, MRR | RR MAE = 3 mm/hr between instruments, MRR RR lower than Theis LPM | Good agreement for D = 1–3 mm |
| Current study: US SGP | 2DVD, Parsivel2, impact | RR higher from Parsivel2 by 10% v. 2DVD and 37% v. impact (0.1 mm/hr to define wet minute). Difference decreases with use of 1 mm/hr to define a wet minute, but increase for a threshold of 10 mm/hr | Impact disdrometer lower conc of D > 1 mm than Parsivel2 |
| Current study: coastal Norway | MRR, Parsivel2 | MRR higher conc than Parsivel2 for D < 1 mm |
| RR > 0.1 mmhr−1 | RR > 1 mmhr−1 | RR > 10 mmhr−1 | ||||
|---|---|---|---|---|---|---|
| HR | FAR | HR | FAR | HR | FAR | |
| Optical v video | 0.781 | 0.0020 | 0.788 | 0.0018 | 0.705 | 0.0003 |
| Optical v impact | 0.600 | 0.0017 | 0.570 | 0.0013 | 0.525 | 0.0003 |
Publisher’s Note: MDPI stays neutral with regard to jurisdictional claims in published maps and institutional affiliations. |
© 2022 by the authors. Licensee MDPI, Basel, Switzerland. This article is an open access article distributed under the terms and conditions of the Creative Commons Attribution (CC BY) license (https://creativecommons.org/licenses/by/4.0/).
Share and Cite
Pryor, S.C.; Barthelmie, R.J.; Cadence, J.; Dellwik, E.; Hasager, C.B.; Kral, S.T.; Reuder, J.; Rodgers, M.; Veraart, M. Atmospheric Drivers of Wind Turbine Blade Leading Edge Erosion: Review and Recommendations for Future Research. Energies 2022, 15, 8553. https://doi.org/10.3390/en15228553
Pryor SC, Barthelmie RJ, Cadence J, Dellwik E, Hasager CB, Kral ST, Reuder J, Rodgers M, Veraart M. Atmospheric Drivers of Wind Turbine Blade Leading Edge Erosion: Review and Recommendations for Future Research. Energies. 2022; 15(22):8553. https://doi.org/10.3390/en15228553
Chicago/Turabian StylePryor, Sara C., Rebecca J. Barthelmie, Jeremy Cadence, Ebba Dellwik, Charlotte B. Hasager, Stephan T. Kral, Joachim Reuder, Marianne Rodgers, and Marijn Veraart. 2022. "Atmospheric Drivers of Wind Turbine Blade Leading Edge Erosion: Review and Recommendations for Future Research" Energies 15, no. 22: 8553. https://doi.org/10.3390/en15228553
APA StylePryor, S. C., Barthelmie, R. J., Cadence, J., Dellwik, E., Hasager, C. B., Kral, S. T., Reuder, J., Rodgers, M., & Veraart, M. (2022). Atmospheric Drivers of Wind Turbine Blade Leading Edge Erosion: Review and Recommendations for Future Research. Energies, 15(22), 8553. https://doi.org/10.3390/en15228553


