1. Introduction
Energy is an important input for all kinds of activities; however, energy consumption is highly correlated with greenhouse gas emissions: in 2018, the annual energy-related CO
2 emissions reached 33.1 Gt of CO
2 [
1]. In the same year, the industry sector participated with 29% of the world’s energy consumption [
2]. Process heating represents about two-thirds of the energy that the industry uses [
3], this energy comes primarily from burning fossil fuels, meanwhile renewable energy covers just 10% of this heat demand [
4]. Burning fossil fuels also leads to price instabilities, shortages, and political conflicts. As industrial production will increase by a factor of four by 2050 [
5], there is a great interest to deploy renewable technologies for industrial process heating.
Industrial processes can be classified into three temperature levels: low (<100 °C), medium (100–400 °C), and high (>400 °C) temperature processes [
6]. There are several studies about using non-concentrating and concentrating solar thermal technologies for process heat supply. Examples of such applications are found in sectors like the dairy industry [
7,
8], district heating [
9], textile industry [
10,
11], food industry [
12,
13], and pharmaceutical industry [
14]. Nowadays, several solar thermal systems provide heat to a large variety of industrial processes [
15,
16,
17,
18].
Implementation of solar thermal systems requires both technical and economic assessments. Whereas the technical evaluation can be carried out using a specialized software, the economic evaluation can be carried out through several techniques: common techniques include the payback period (PB), the net present value (NPV), and the internal rate of return (IRR); however, a better framework to express the cost of producing heat is the levelized cost of heat (
LCOH) [
19].
The
LCOH has been used to analyze low-temperature solar thermal technologies [
20] and medium-temperature solar thermal technologies [
21,
22,
23,
24]. Nevertheless, these technologies provide heat at temperatures below 350 °C. High-temperature processes and heat loads greater than 10 MW
th are potential opportunities for alternative energy sources [
25].
At the current commercial state, the Concentrating Solar Power (CSP) Central Tower technology produces heat at temperatures above 600 °C and can be scaled in the order of megawatts. Furthermore, CSP systems provide a high-reliable energy supply if combined with fuel-based systems: this combination is known as CSP Hybrid systems [
26]. It should be noted that “CSP” refers to electric power generation; for this work, the term CSP
th was introduced to refer to Concentrating Solar Thermal Power. The above-mentioned characteristics make CSP
th Hybrid Central Tower systems (CSP
th Hybrid-CT systems) a promising technology for delivering high-temperature heat to high-temperature industrial processes.
In this context, CSP
th Hybrid-CT systems have been studied before for the ammonia production process [
27]; however, in that work the economic parameter was the ammonia generation cost instead of the
LCOH. These kinds of economic parameters make it difficult for other industries to visualize the economic potential of using this technology for their processes. On the other hand, studies about the
LCOH of the CSP
th Hybrid Central Tower technology have not been found.
Therefore, the purpose of this paper is to evaluate the economic potential of the CSP
th Hybrid Central Tower technology through the levelized cost of heat, so a wide range of industries might have a clear notion of the competitiveness of this renewable technology against the conventional sources of energy. The paper includes a sensitivity assessment that considers changes in the solar resource, the investment cost (capital expenditure-CAPEX), the O&M expenses, the discount rate, and the solar multiple. The study also includes an estimation of the avoided greenhouse gas emissions and the marginal abatement costs.
Section 1.1 gives a short review of process heating systems and mentions the feasibility of solar thermal technologies for process heating,
Section 2 describes the methodology of this work,
Section 3 presents some characteristics of the CSP
th Hybrid Central Tower systems designed for a reference location,
Section 4 presents results and discussions, and
Section 5 presents the conclusions of this work.
Feasibility of Solar Thermal Technologies for Industrial Process Heating
Process heating systems can be broken into three basic categories: fuel-based process heating, electric-based process heating, and steam-based process heating [
28]. The process characteristics define the selection of the heating system; the process can be either a discrete or a continuous process and require either a direct or an indirect heating method. Industrial processes often take energy from a heat transfer medium (indirect method). Heat transfer mediums should have a low vapor pressure, high heat capacity, low viscosity, high thermal stability, and low corrosiveness [
29]; common mediums are steam, pressurized water, thermal oil, and air.
Steam-based systems supply around 30% of the industrial energy consumption worldwide [
30]. Steam is an efficient energy carrier; it can be used to control temperature and pressure of chemical processes, remove contaminants, and other miscellaneous applications [
28]. Hot air is commonly used at temperatures around 250 °C for drying processes, which are highly relevant in the industry. Hot air is produced either by electrical heating or using a heat transfer medium [
31].
Table 1 lists common applications of process heat and the temperature range of these processes.
Renewable technologies allow energy consumers to use clean energy sources, reducing their fossil fuel dependency. Among renewable energies, solar energy is the most abundant energy source in the planet; it is related to energy self-sufficiency, energy access in isolated areas, and employment creation [
33]. Solar thermal energy is a suitable option for industrial process heating; whereas the conversion efficiency from solar energy to electricity is between 15 and 20%, the conversion efficiency from solar energy to thermal energy is up to 70% [
29].
Table 2 summarizes the temperature range of non-concentrating and concentrating solar thermal technologies. The maximum operating temperature of the current commercial systems is about 600 °C [
34], which corresponds to the Central Tower technology; however, temperatures of about 800 °C have been achieved using air as the heat transfer medium [
35,
36,
37].
Industrial processes require a stable energy source because the stability defines both the process efficiency and the quality of products. In this sense, CSP
th systems have two advantages: CSP
th systems can use thermal energy storage (TES) systems and operate in combination with fuel-based systems. TES systems are low-cost and highly efficient methods to store energy and mitigate short fluctuations. Operating temperature of commercial TES systems can reach about 585 °C for CSP
th Central Tower systems [
39].
2. Methodology
The methodology consisted of five major steps: (1) defining the CSPth Hybrid-CT system, (2) generating the layout of the CSPth Central Tower (using SolarPILOT), (3) evaluating the layout’s performance, (4) evaluating the steady-state energy balance of the CSPth Hybrid-CT system, and (5) estimating the LCOH of the CSPth Hybrid-CT system. Three geographic sites were chosen to carry out the analysis. These locations correspond to Hermosillo, Sonora (annual DNI 2680 kWh/m2); Altamira, Tamaulipas (annual DNI 1851 kWh/m2); and the Region of Antofagasta, Chile (annual DNI 3576 kWh/m2).
2.1. Definition of the CSPth Hybrid-CT System and Suppositions for the Analysis
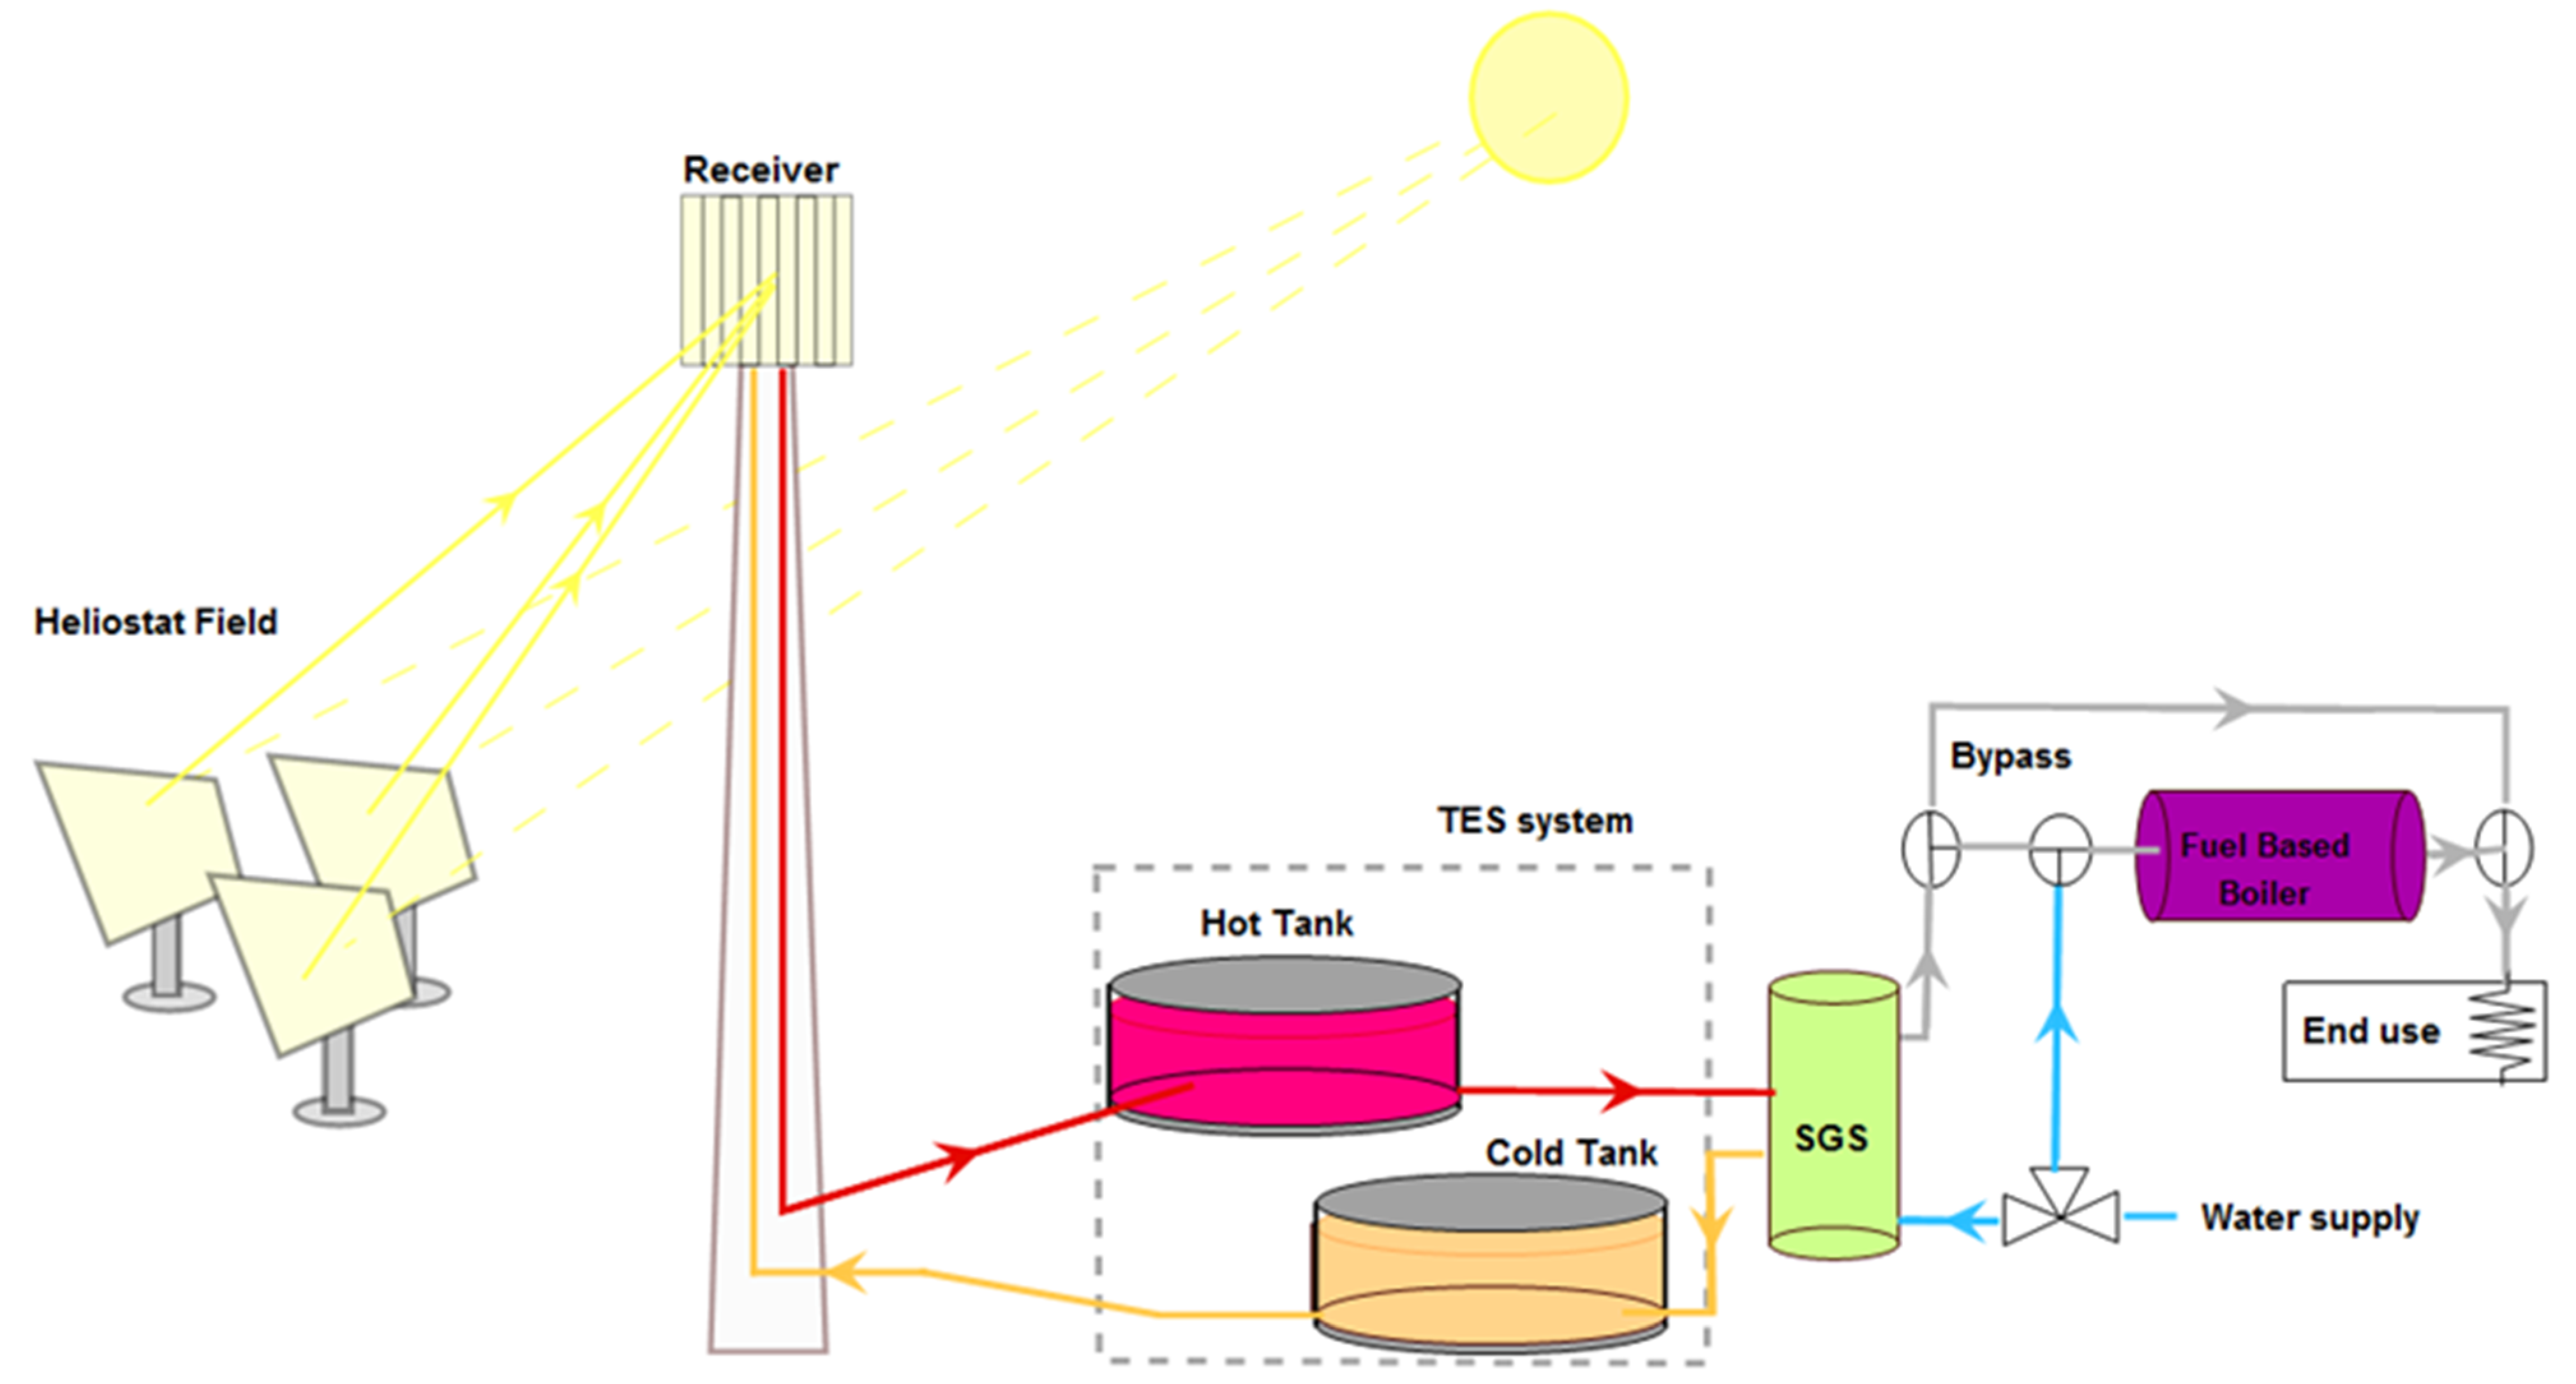
Figure 1 presents a general scheme for the CSP
th Hybrid-CT system. The figure shows the plant configuration and the major components of the system: heliostat field, tower, receiver, TES system, steam-generation system (SGS), and fuel-based boiler. Auxiliary components of the system are not considered in the analysis; therefore, the
LCOH results are not weighted by the energy parasitics, which usually accounts for about 10% of the electricity output in power generating systems [
40].
The heliostat field reflects the solar irradiation to the receiver device; as the irradiation is absorbed, the receiver’s temperature increases, this allows the receiver to transfer thermal energy to a fluid. The common heat transfer fluid is molten salt [
41]. After being heated, the molten salt is sent to the hot-tank for further dispatching to a steam generation system. The fuel-based boiler operates if there is not enough solar energy to fulfill the heat demand.
Data from McMillan and Mark [
25] suggest that alternative heat generators, such as Concentrating Solar Technologies, that can provide thermal power outputs between 10 MW
th and 200 MW
th are potentially applicable to several industries. In this sense, a design thermal power output of 50 MW
th was used for the analysis.
The analysis of the CSPth Hybrid-CT system was performed considering the following assumptions:
Just the major components of the CSPth Hybrid system were considered.
The system’s performance was evaluated throughout the year, using time steps of 1 h.
The system was considered to operate in steady-state.
The annual energy production was assumed constant for the system’s lifespan.
Pressure drops were neglected.
Electrical parasitics were not considered.
The fuel-based boiler was considered to operate with natural gas.
The fuel-based boiler’s efficiency was considered to be 85%, which corresponds to high level efficiency [
30].
The system’s lifespan was considered to be 30 years.
2.2. Layout of the CSPth Central Tower
The CSP
th Central Tower was designed using SolarPILOT. This software provides layout, characterization, optimization capabilities, and parametric simulation [
42].
Several layouts were generated to evaluate the effect of the solar multiple. The solar multiple (S.M.) is the ratio between the energy delivered by the system when it operates at design conditions and the nominal energy demand.
The general procedure to generate every layout was as follow:
Selection of a thermal power.
Selection of the design point.
Generation of the layout.
Optimization of the layout based on the system’s performance.
Two parameters define de design point (item 2): the sun position for the layout generation and the design direct normal irradiation (DNI). The layouts were generated for the noon of the spring equinox. The design DNI is a highly relevant parameter: a low design DNI value generates an oversized solar field, increasing the capital expenditure; on the contrary, a high design DNI value generates an undersized solar field, which results in poor performance most of the year. The design DNI value was selected after evaluating the performance of six layouts that were generated with different DNI values.
2.3. Energy Balance of the CSPth Hybrid-CT System
The energy that the receiver transfers to the heat transfer fluid was calculated using the following procedure (steps 1–4):
The optical efficiency of the solar field was evaluated at 146 sun positions.
For every hour of the year between the sunrise and the sunset, the efficiency value was taken from the nearest sun’s position that was evaluated in step 1.
For every hour before sunrise and after sunset, the solar field’s efficiency was fixed at zero.
The energy that the heat transfer fluid absorbs was calculated with Equation (1).
i: Hour of the year [index].
ASF: Solar field’s area [m2].
DNIi: Direct Normal Irradiation [W/m2].
ηSFi: Solar field’s efficiency [%].
QR-Loss: Receiver’s heat loss [W/m2].
For this work,
“QR-Loss” was assumed constant at a typical value of 30 kW/m
2 [
43]; as a consequence of keeping a constant “Q
R-Loss”, the product
“ηSFiDNIiASF” can be lower than “
QR-Loss” for low DNI values or low solar field´s efficiencies. In these cases,
“ESolari” was changed by zero.
The energy balance of the TES system was calculated with Equation (2).
dTESi/dt: Energy change in the TES system at time i [J/h]
hin(dmini/dt): Energy entering the system at time i [J/h]
hout(dmouti/dt): Energy entering the system at time i [J/h]
dQlossi/dt: Energy loss at the TES system [J/h]
Kolb [
43] estimates a thermal energy loss of 1 MW
th for a TES system of 5000 MWh; this represents an hourly loss of 0.02%. For this work, the energy loss at time “i” was assumed to be 1% of the stored energy at time “
i − 1”.
Equations (4)–(7) were used to calculate the charging and discharging process of the TES system.
ED: Energy demand per hour (50 MWh)
ηP: Thermal efficiency of pipelines [%]. This value was assumed to be 98%.
ηSG: Efficiency of the steam generation system [%]. This value was assumed to be 95%.
SEU-lim: Upper charging limit of the TES system [J]
SEL-lim: Lower discharging limit of the TES system [J]
The fuel consumption was calculated using Equations (8) and (9).
ηb: Efficiency of the fuel-based boiler [%]
2.4. Cost of the CSPth Hybrid-CT System
The cost of the CSP
th Hybrid-CT system was separated into direct and indirect costs (Equation (10)). The direct costs consist of the capital expenditure related to the main components of the CSP
th Hybrid-CT system (Equation (11)); the indirect costs were calculated as a percentage of the direct costs. Indirect costs include several owner’s costs: land cost, planning and contracting costs, engineering and construction management, and contingency costs [
44].
HFC: Heliostats field cost (USD)
TC: Tower cost (USD)
RC: Receiver cost (USD)
TESC: TES system cost (USD)
SGSC: Steam generation system cost (USD)
BC: Fuel-based boiler cost (USD)
Table 3 summarizes the reference data for the cost of the system´s components. The heliostat field cost was calculated by multiplying the heliostat field area by a solar field price. Although a solar field price of 150 USD/m
2 is used in the most recent reference of
Table 3, for this work a conservative value of 200 USD/m
2 was assumed for the analysis. The TES system cost was calculated by multiplying the TES capacity by 30 USD/kW
th. The tower cost was calculated with an exponential function, Equation (12) [
45]. The receiver cost, the steam generation system cost, and fuel-based boiler cost were calculated using a capacity function, Equation (13) [
45].
CX: Estimated cost of equipment of size “Sx” (USD)
CR: Reference cost of equipment of size “SR” (USD)
H: tower’s height (m)
S: scaling exponent ().
The scaling exponents were 0.0113 for the tower, 0.7 for the receiver, and 0.8 for both the steam generation system and the fuel-based boiler [
45]. The reference costs in
Table 3 were actualized for Equation (13). The actualizations were carried out using the Chemical Engineering Plant Cost Index 2019 (CEPCI 2019), Equation (14).
C: reference cost at year of reference (USD)
IL: Index of the CEPCI 2019
IO: Index of the CEPCI at the reference year.
2.5. LCOH Calculation
The levelized cost of heat (
LCOH) is analogous to the levelized cost of energy (LCOE), which is the common economic measure for electric power generation systems [
56,
57].
The
LCOH can be defined as the average cost in net present value (NPV) of a unit of heat that is produced by a system. The NPV of the costs incurred during the system’s lifespan must equal the NPV of all the annual energy production multiplied by the
LCOH in the same period (Equation (15)). The
LCOH was calculated using Equation (16).
LCOH: Levelized cost of heat (Cents USD/kWhth)
AEP: Annual energy production of the CSPth Hybrid-CT system (MWhth)
CAPEX: Capital expenditure (USD)
Costsn: Annual costs incurred at year “n” (USD)
r: Discount rate (%)
N: System´s lifespan ()
In Equation (16), the capital expenditure is not discounted since it occurs at time 0. The annual costs that are discounted comprise four concepts: operation and maintenance expenses
, insurance
, annual fuel expenses
, and a carbon price for the CO
2 emissions (see
Section 2.6). Insurance was considered for this analysis because it is an efficient mechanism to avoid the high economic risks associated with non-mature technologies.
Table 4 shows the values used for the O&M expenses, insurance, and the lifespan. A discount rate of 8% was used to calculate the
LCOH. The
LCOH was calculated at constant value (2019 dollars).
The annual fuel expenses
“FEn” were calculated considering the annual fuel consumption and the fuel price of natural gas (Equation (17)).
FPn: Fuel price of natural gas at year “n” in 2019 dollars (USD)
FCi: Fuel consumption at time “i” (J)
The price of natural gas is considerably different around the world [
63] in this sense, the
LCOH was calculated for several fuel price scenarios (FPS) (see
Table 5). To include the change in real terms of the natural gas price over time, an arithmetic gradient was applied to the initial fuel price (price in 2019). This gradient was calculated based on the price projections of the U.S. Energy Information Administration (EIA) for the natural gas spot price at Henry Hub. EIA suggests for the reference case that the natural gas spot price will be approximately 3.8 USD/MMBTU by 2050 (in 2019 dollars) [
64]. This implies an increase in real terms of approx. USD 0.04 per year considering that the natural gas price was 2.56 USD/MMBTU in 2019 [
65].
2.6. Pricing CO2 Emissions
Carbon pricing creates a financial incentive that drives technological innovation and investment in clean energy. Explicit carbon prices are introduced through taxes on fossil fuels or by putting a price on GHG emissions; additionally, emissions are regulated using carbon market systems. There are two types of carbon markets: Emission Trading Systems (ETS) and Baseline-and-Credit mechanisms [
66]. In carbon markets, the price of allowances or credits for compliances vary regarding local regulations (see
Table 6).
Today, 21.5% of the global GHG emissions are covered by carbon pricing instruments [
68]. However, nowadays, most carbon prices remain far below the range needed to help meet the limit of 1.5 °C [
69]. The High-Level Commission on Carbon Prices suggests that a carbon price consistent with the Paris Agreement’s goal should be at least 40–80 USD/tCO
2e by 2020 and 50–100 USD/tCO
2e by 2030 [
70].
One instrument that is gaining momentum is the voluntary carbon pricing. Currently, nearly half of the world’s 500 biggest companies use or plan to use this instrument [
71]. Companies use this instrument to address the risk of an increase in the price of GHG emissions. The common types of internal carbon prices are the internal fee, which produces actual financial flows, and the shadow price, which is a hypothetical cost to evaluate investments decisions. In 2020, the median internal carbon price disclosed by companies was 25 USD/tCO
2e [
71].
For this work, the LCOH (Equation (16)) was calculated considering a shadow price in line with the recommendations of the High-Level Commission on Carbon Prices. The LCOH was calculated with a price of 40 USD/tCO2e for the first 10-years period, 50 USD/tCO2e for the second 10-years period, and 60 USD/tCO2e for the last 10-years period.
2.7. Marginal Abatement Cost
Compared to fuel-based systems, CSP
th Hybrid-CT systems provide energy with low rates of CO
2 emissions. The CO
2-avoided emissions were calculated using Equation (18).
RE-CO2: Emission factor [Kg of CO2/MWh]
AEP: Annual energy production of the CSPth Hybrid-CT system [MWhth]
For natural gas,
[
72].
The marginal abatement costs are defined as the estimated cost of avoiding a ton of CO
2 emissions. This value is often used as a reference to establish the carbon price needed to trigger abatement measures. The marginal abatement cost was calculated with Equation (19). To obtain the real value of the marginal abatement costs, the
LCOH of the CSP
th Hybrid-CT system and
LCOH of the Fuel-Based system were calculated without pricing the CO
2 emissions.
LCOH: LCOH of the CSPth Hybrid-CT system
LCOHF-BS: LCOH of a Fuel-Based system
3. Technical Characteristics of the CSPth Hybrid-CT Systems Designed for the Reference Location
The reference location corresponds to Hermosillo, Sonora, Mexico (latitude 29° and longitude −110°). The solar resource data were taken from the NREL National Solar Radiation Database [
73]. The Typical Meteorological Year data (annual DNI = 2680 kWh/m
2) was used to evaluate the annual energy production.
The design DNI value was chosen after comparing the technical and economic results of six systems designed with different DNI values.
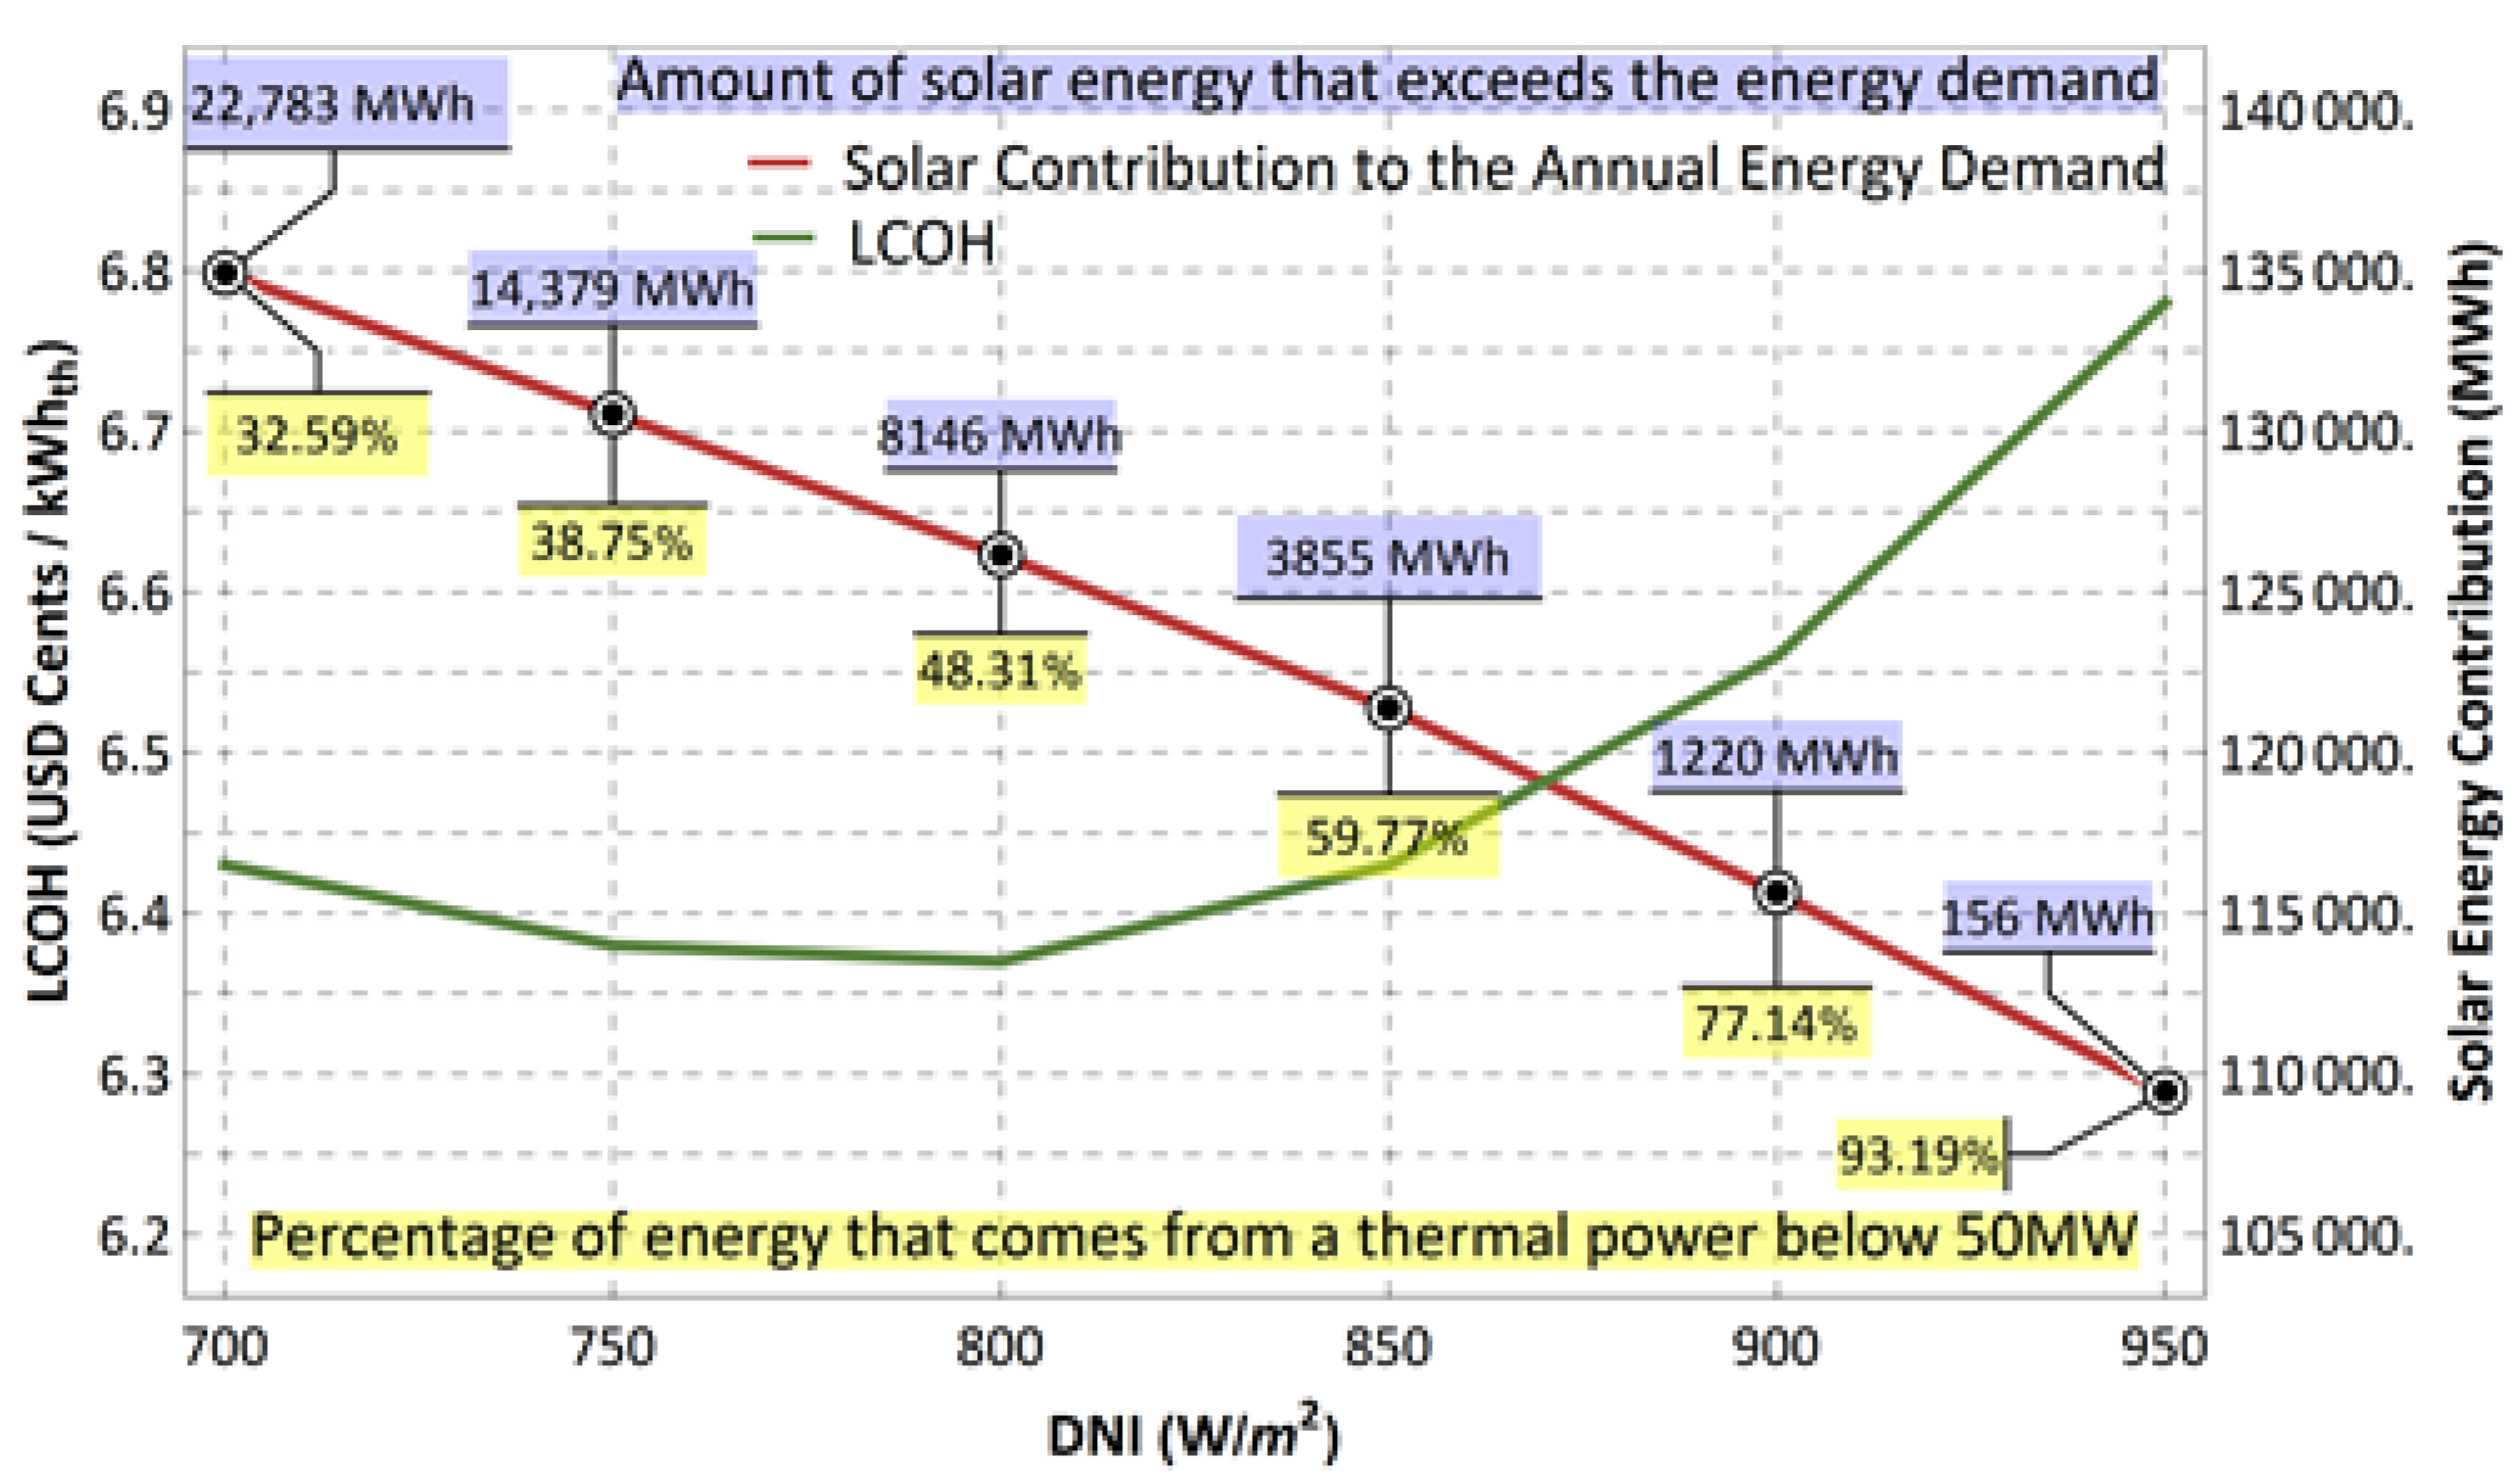
Figure 2 shows how the design DNI value affect both the
LCOH of the CSP
th Central Tower and the solar energy contribution. In general, increasing the design DNI value leads to a reduction in the solar energy contribution. The minimum
LCOH (6.37 Cents/kWh
th) corresponds to a design DNI of 800 W/m
2; this
LCOH was calculated considering just the solar energy contribution.
Figure 2 shows the excess of solar energy and the percentage of the annual energy production that is produced when the thermal power of the CSP
th Central Tower is below 50 MW
th. The excess of solar energy occurs when the CSP
th Central Tower produces more energy than the energy demand. The first parameter shows that the solar field is oversized for design DNI values below 800 W/m
2; on the contrary, the second parameter shows that the solar field is undersized for design DNI values above 800 W/m
2.
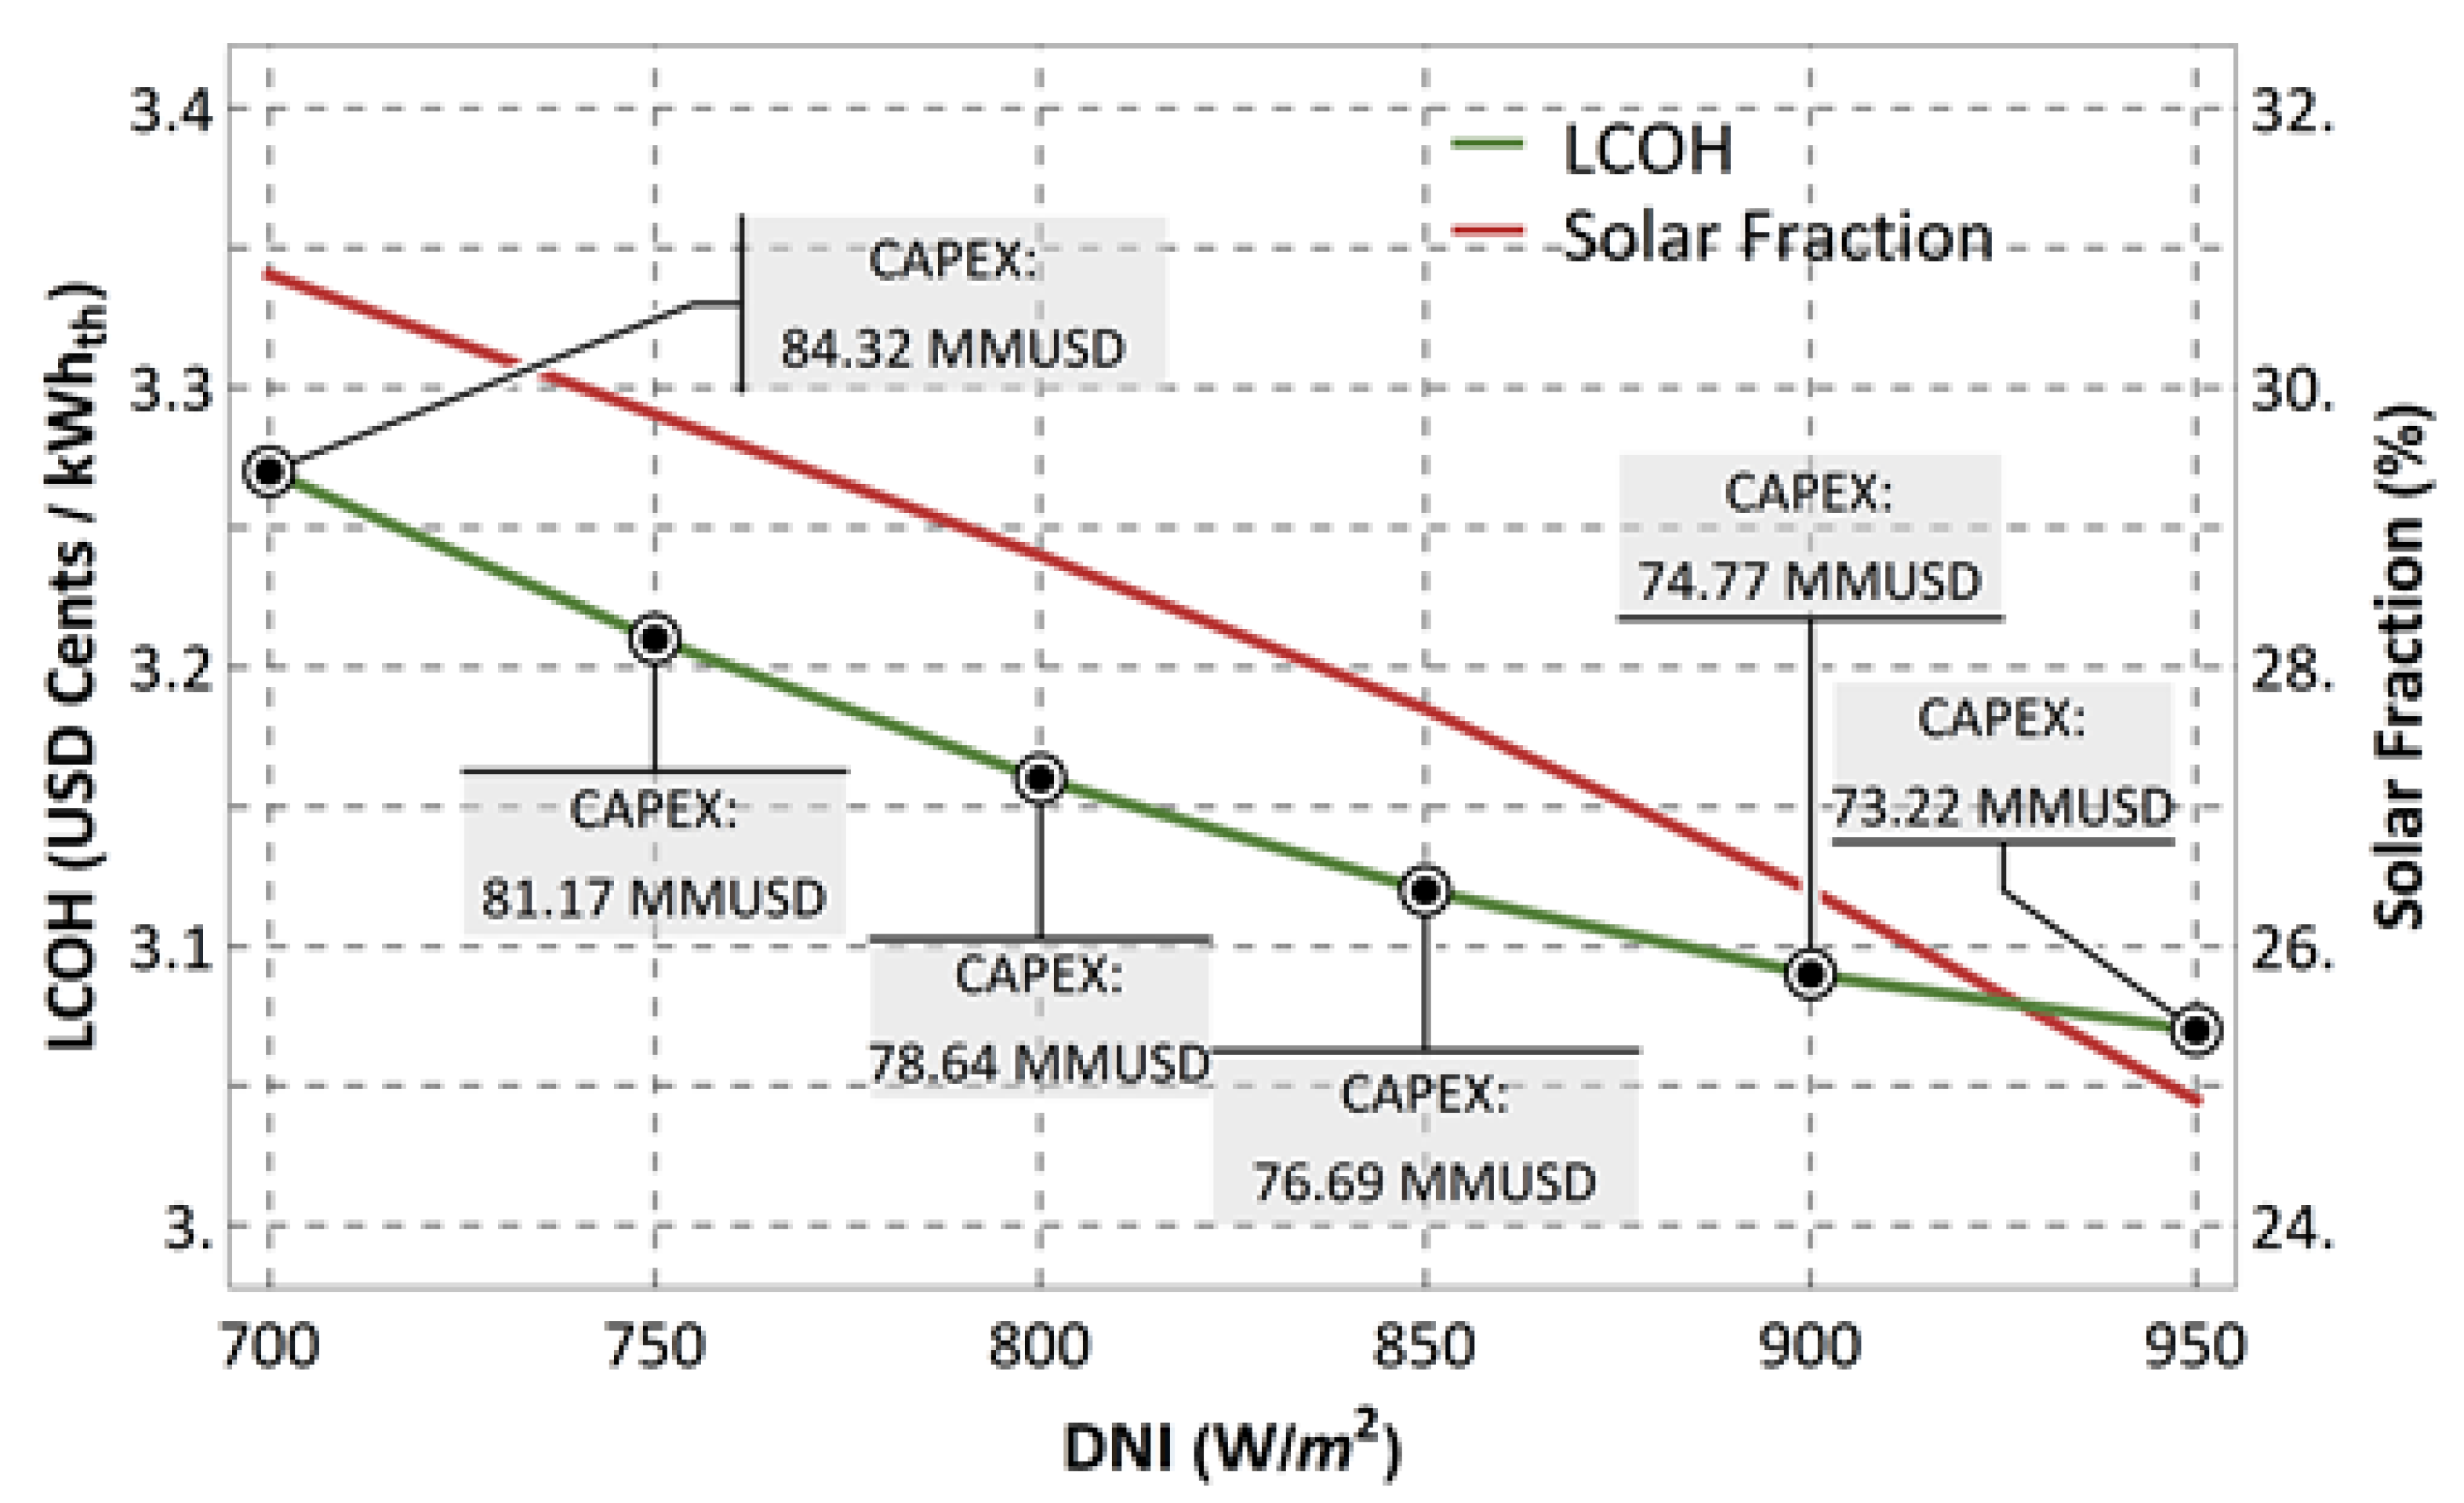
However, the
LCOH of the CSP
th Hybrid-CT system changes if considering both the solar energy contribution and the energy that is produced with fossil fuel.
Figure 3 show the effect of the design DNI value on both the solar fraction and the
LCOH. An increase in the solar fraction leads to an increase in the
LCOH; to clearly show this effect, the
LCOH values were calculated without pricing the CO
2 emissions.
Figure 3 shows the capital expenditure for the system.
Considering the results of
Figure 2 and
Figure 3, the value of 800 W/m
2 was selected to be the design DNI.
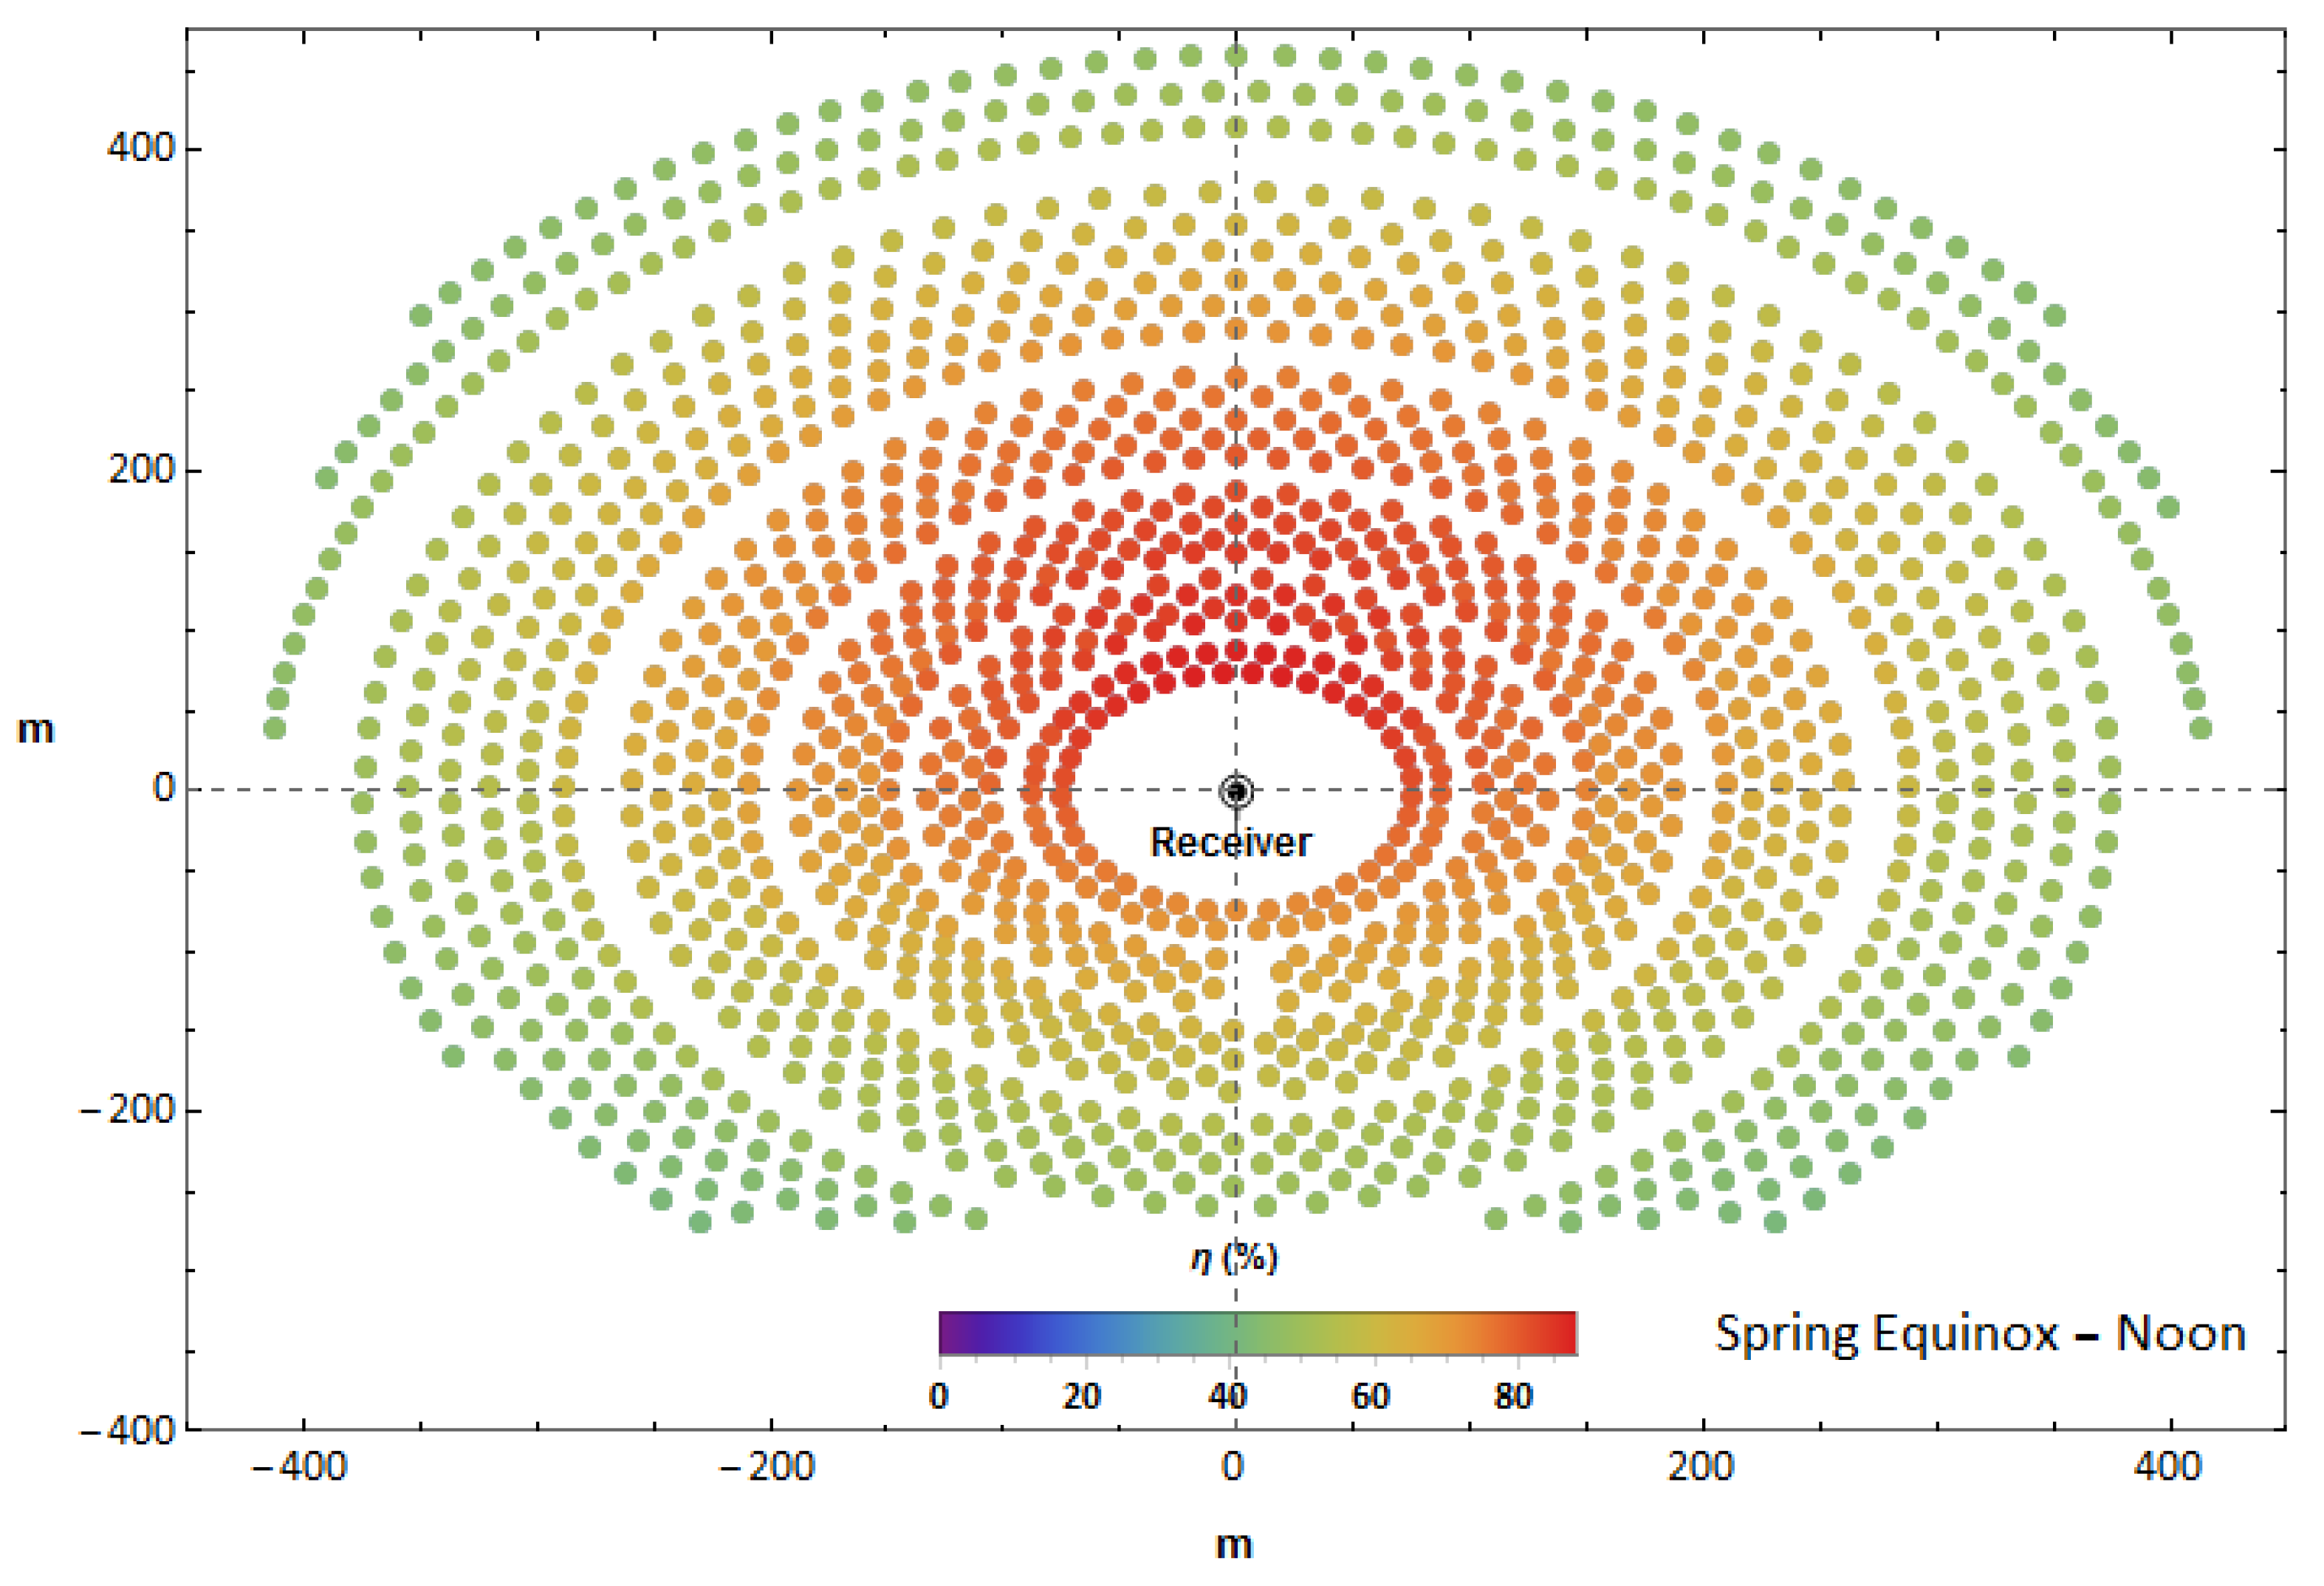
Figure 4 shows the layout of the CSP
th Central Tower; the figure shows the solar field’s arrangement and the heliostats’ efficiencies at the design point. The solar field achieves an optical efficiency of 57.41%, including the receiver’s efficiency. A typical constrain for tubular receivers is the incident flux; this parameter is usually kept below 1200 kW/m
2 in order to avoid fractures and to conserve the shape and strength of the receiver. The average incident flux and the peak incident flux are 467 kW/m
2 and 1130 kW/m
2, respectively; these values were obtained using SolTrace.
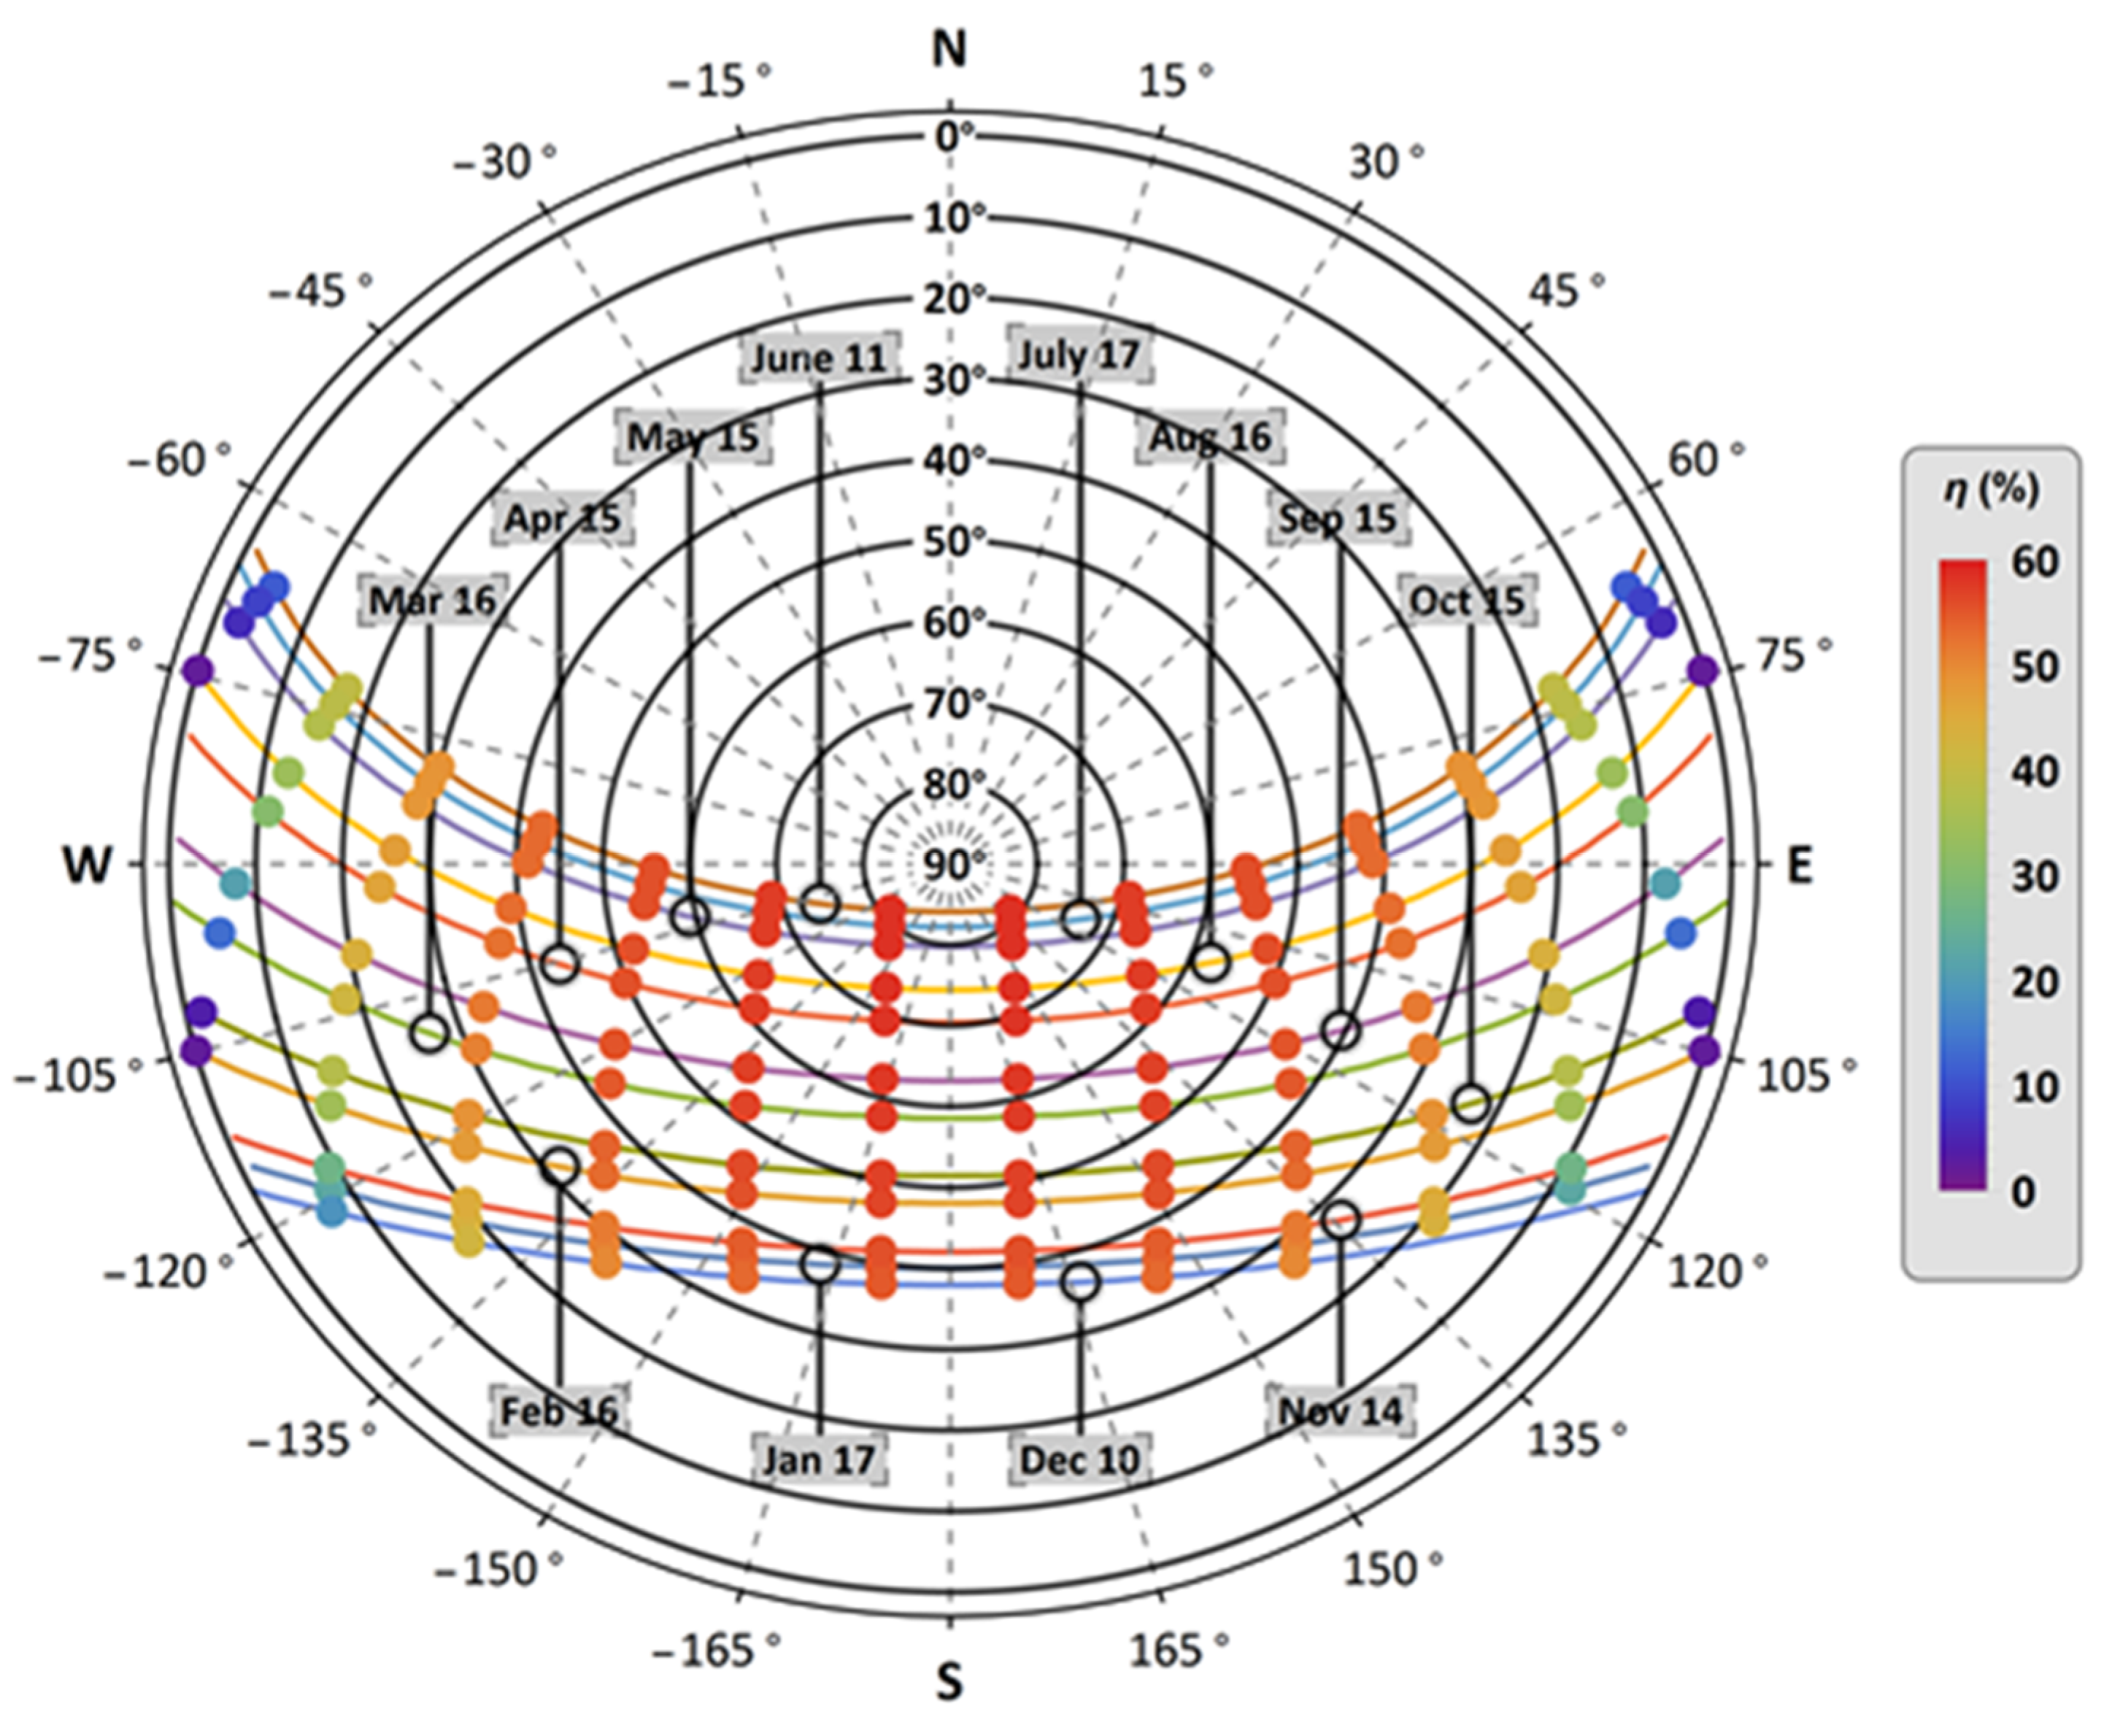
Figure 5 shows the optical efficiency of the system at 146 sun positions. Because the solar resource and the optical efficiencies vary throughout the year, the CSP
th Central Tower operates at off-design most of the time; therefore, the heat transfer fluid absorbs different rates of thermal power per hour.
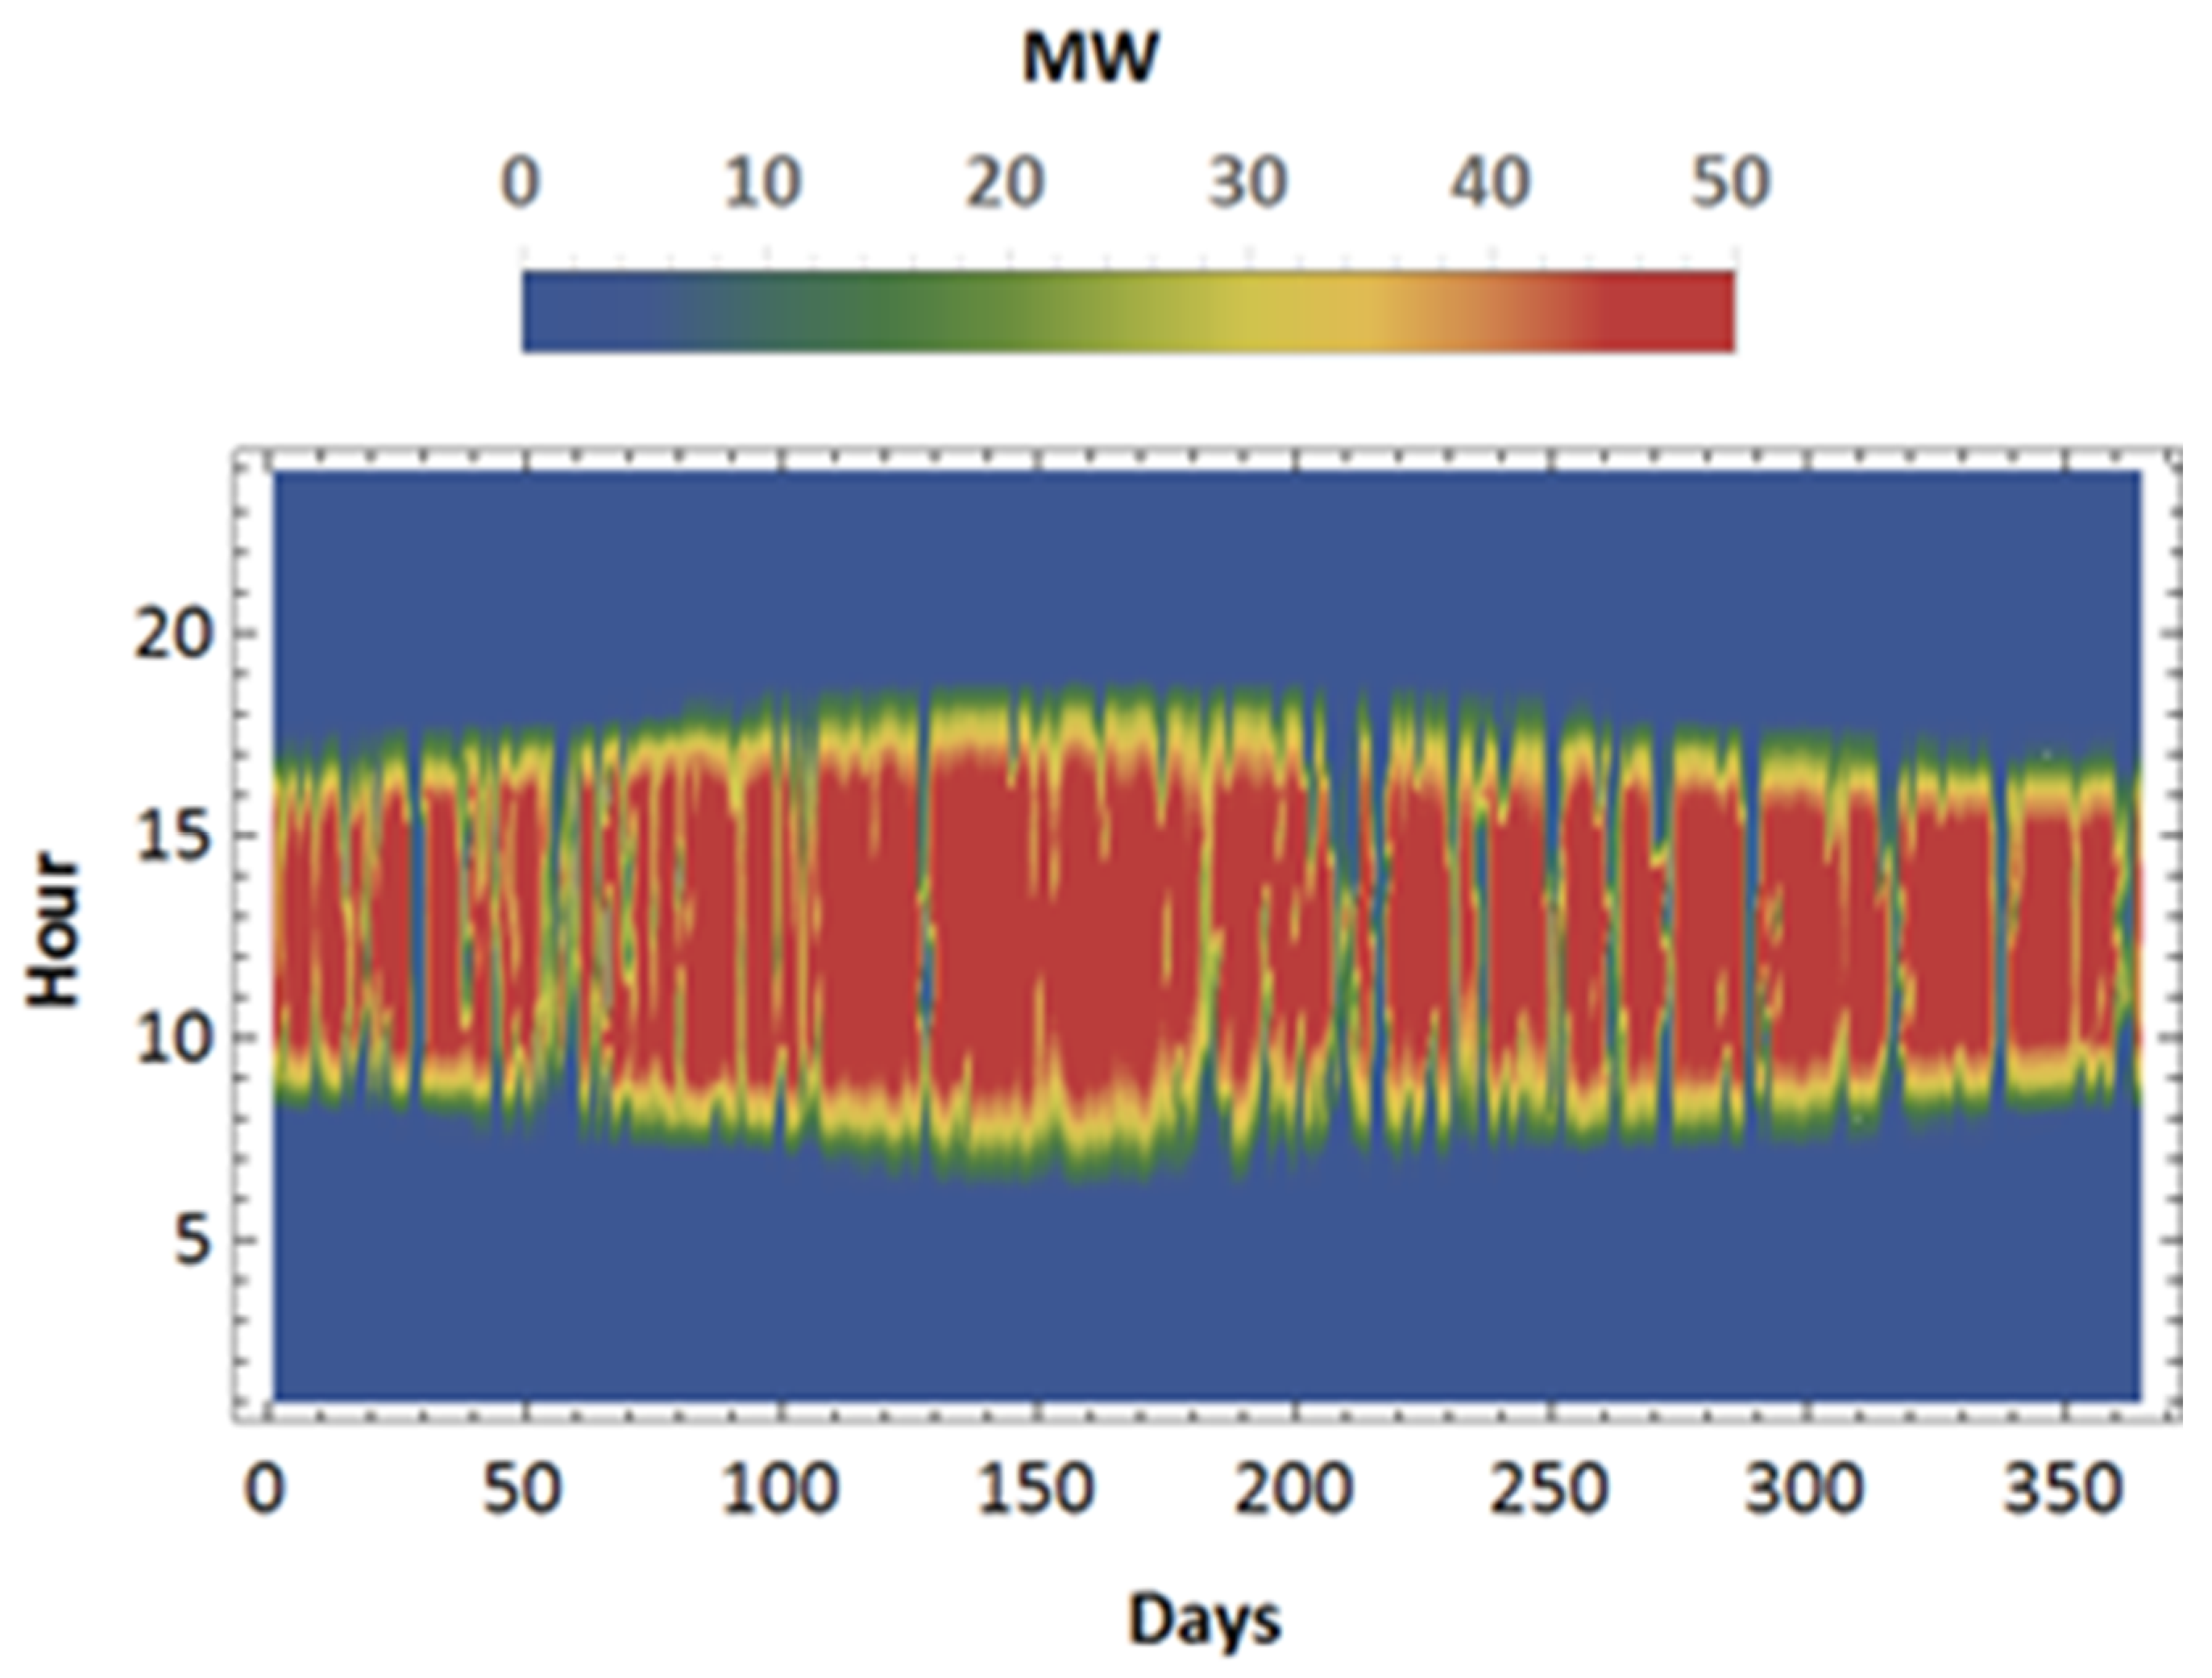
Figure 6 shows the thermal power absorbed by the heat transfer fluid. Annually, the system delivers around 128,747 MWh of solar thermal energy.
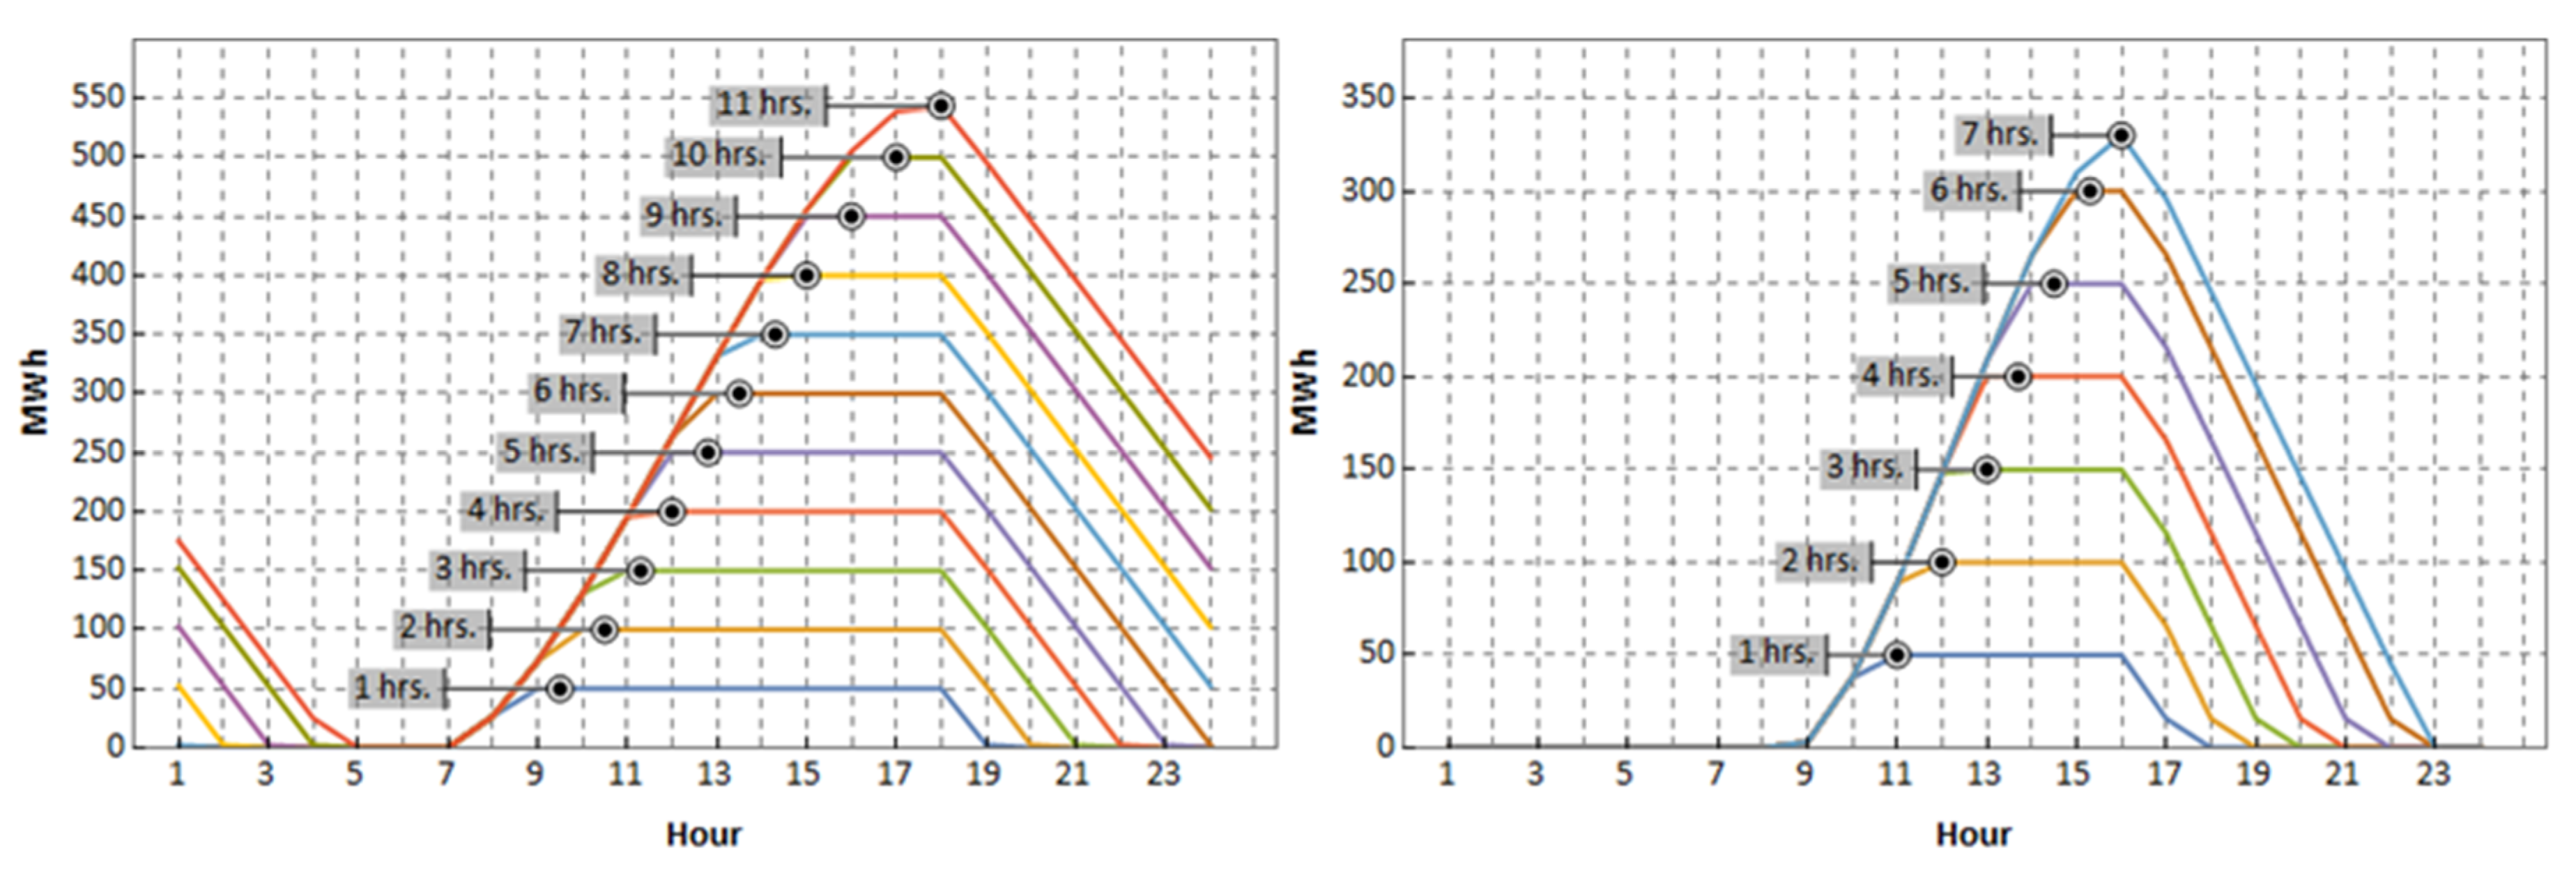
To increase the solar energy contribution, the CSP
th Central Tower was designed with solar multiples of 1.5, 2, and 2.5; a thermal energy storage system has been included in the analysis of these systems. The amount of stored energy depends strongly on the season.
Figure 7 shows how the TES capacity determines the amount of stored energy during the summer and winter solstices. At the summer solstice, the CSP
th Central Tower produces an energy surplus equivalent to 11 h of energy demand; however, at the winter solstice the energy surplus is equivalent to 6 h of energy demand.
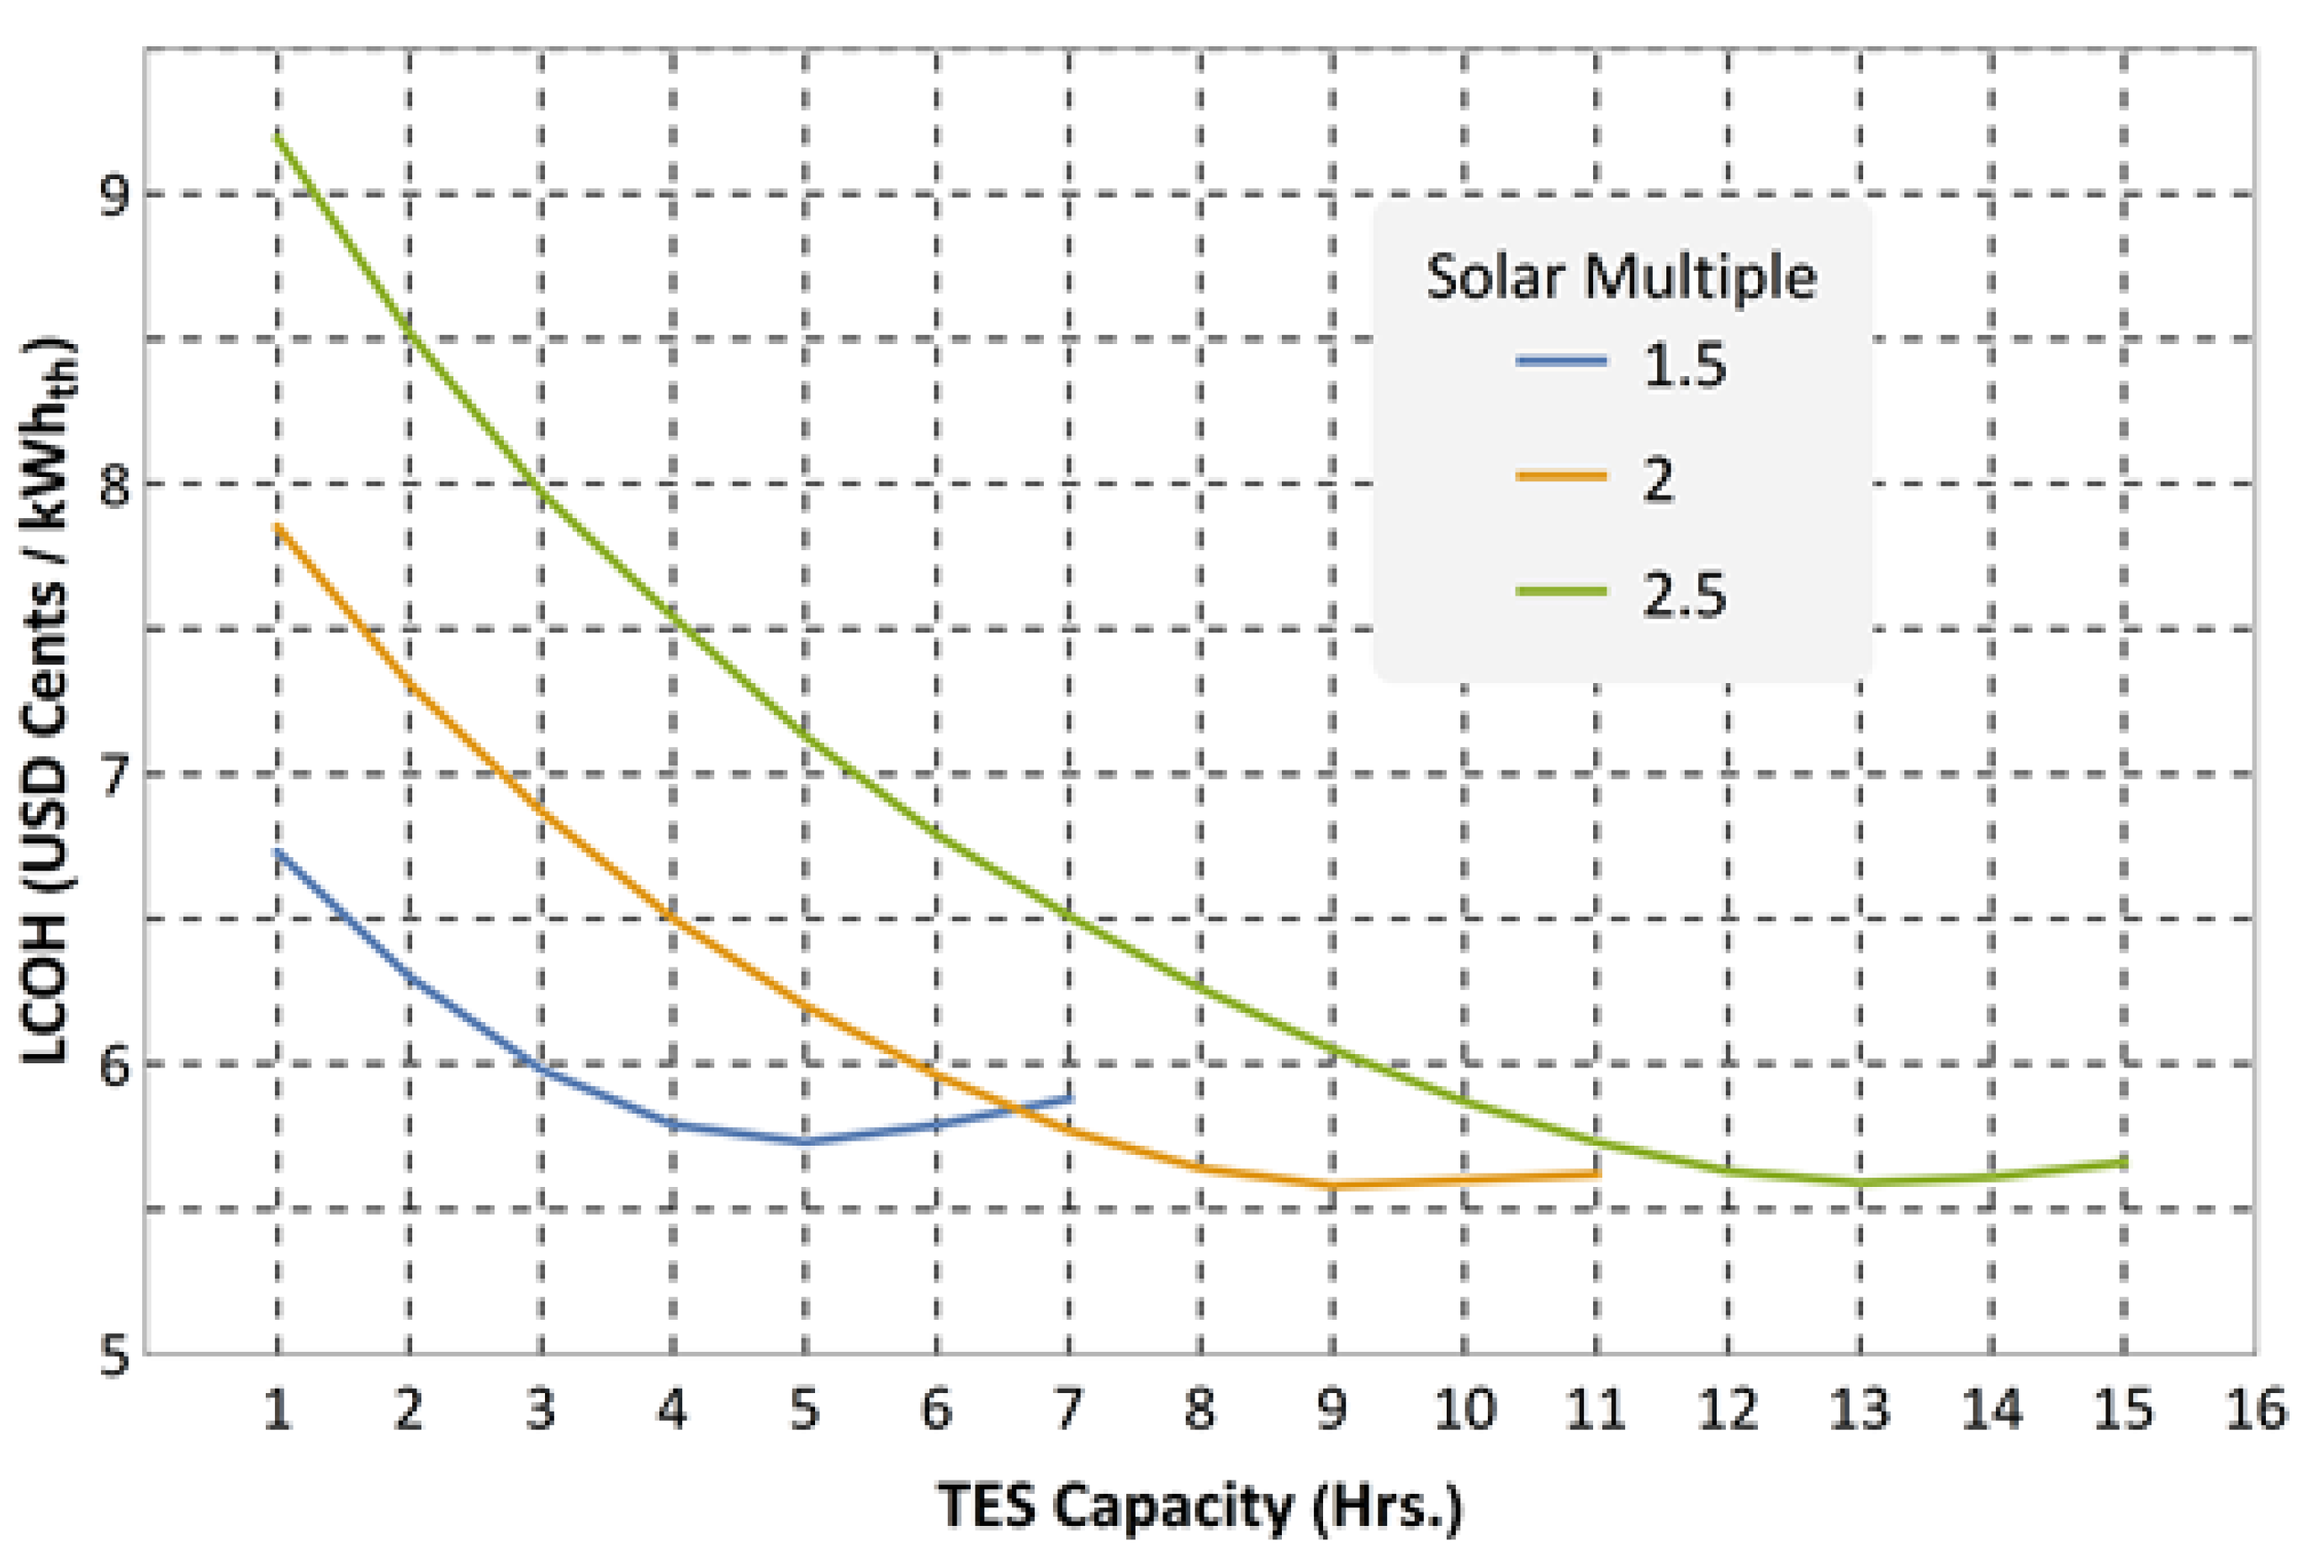
The TES capacity was chosen after calculating the
LCOH of the CSP
th Central Tower systems for different TES capacities; this
LCOH was calculated considering just the solar energy contribution.
Figure 8 shows that the minimum
LCOH for the systems designed with solar multiples of 1.5, 2, and 2.5 was achieved with TES capacities of 5, 9, and 13 h, respectively.
Table 7 presents some characteristics of the CSP
th Hybrid-CT systems that are further analyzed in
Section 5. The increase in capital expenditure between these systems results in significant increases of the solar fraction.
4. Results and Discussions
This section presents the results that were obtained using the methodology of
Section 3. First, the section shows the
LCOH of the CSP
th Hybrid-CT systems of
Table 7 (reference location) and the
LCOH of a fuel-based system. The section includes a sensitivity analysis. Then, the section presents the
LCOH of the CSP
th Hybrid-CT systems considering a 20% reduction in the CAPEX of the CSP
th Central Tower and using a discount rate of 5%. Finally, the section presents the avoided CO
2 emissions and the marginal abatement costs for this technology.
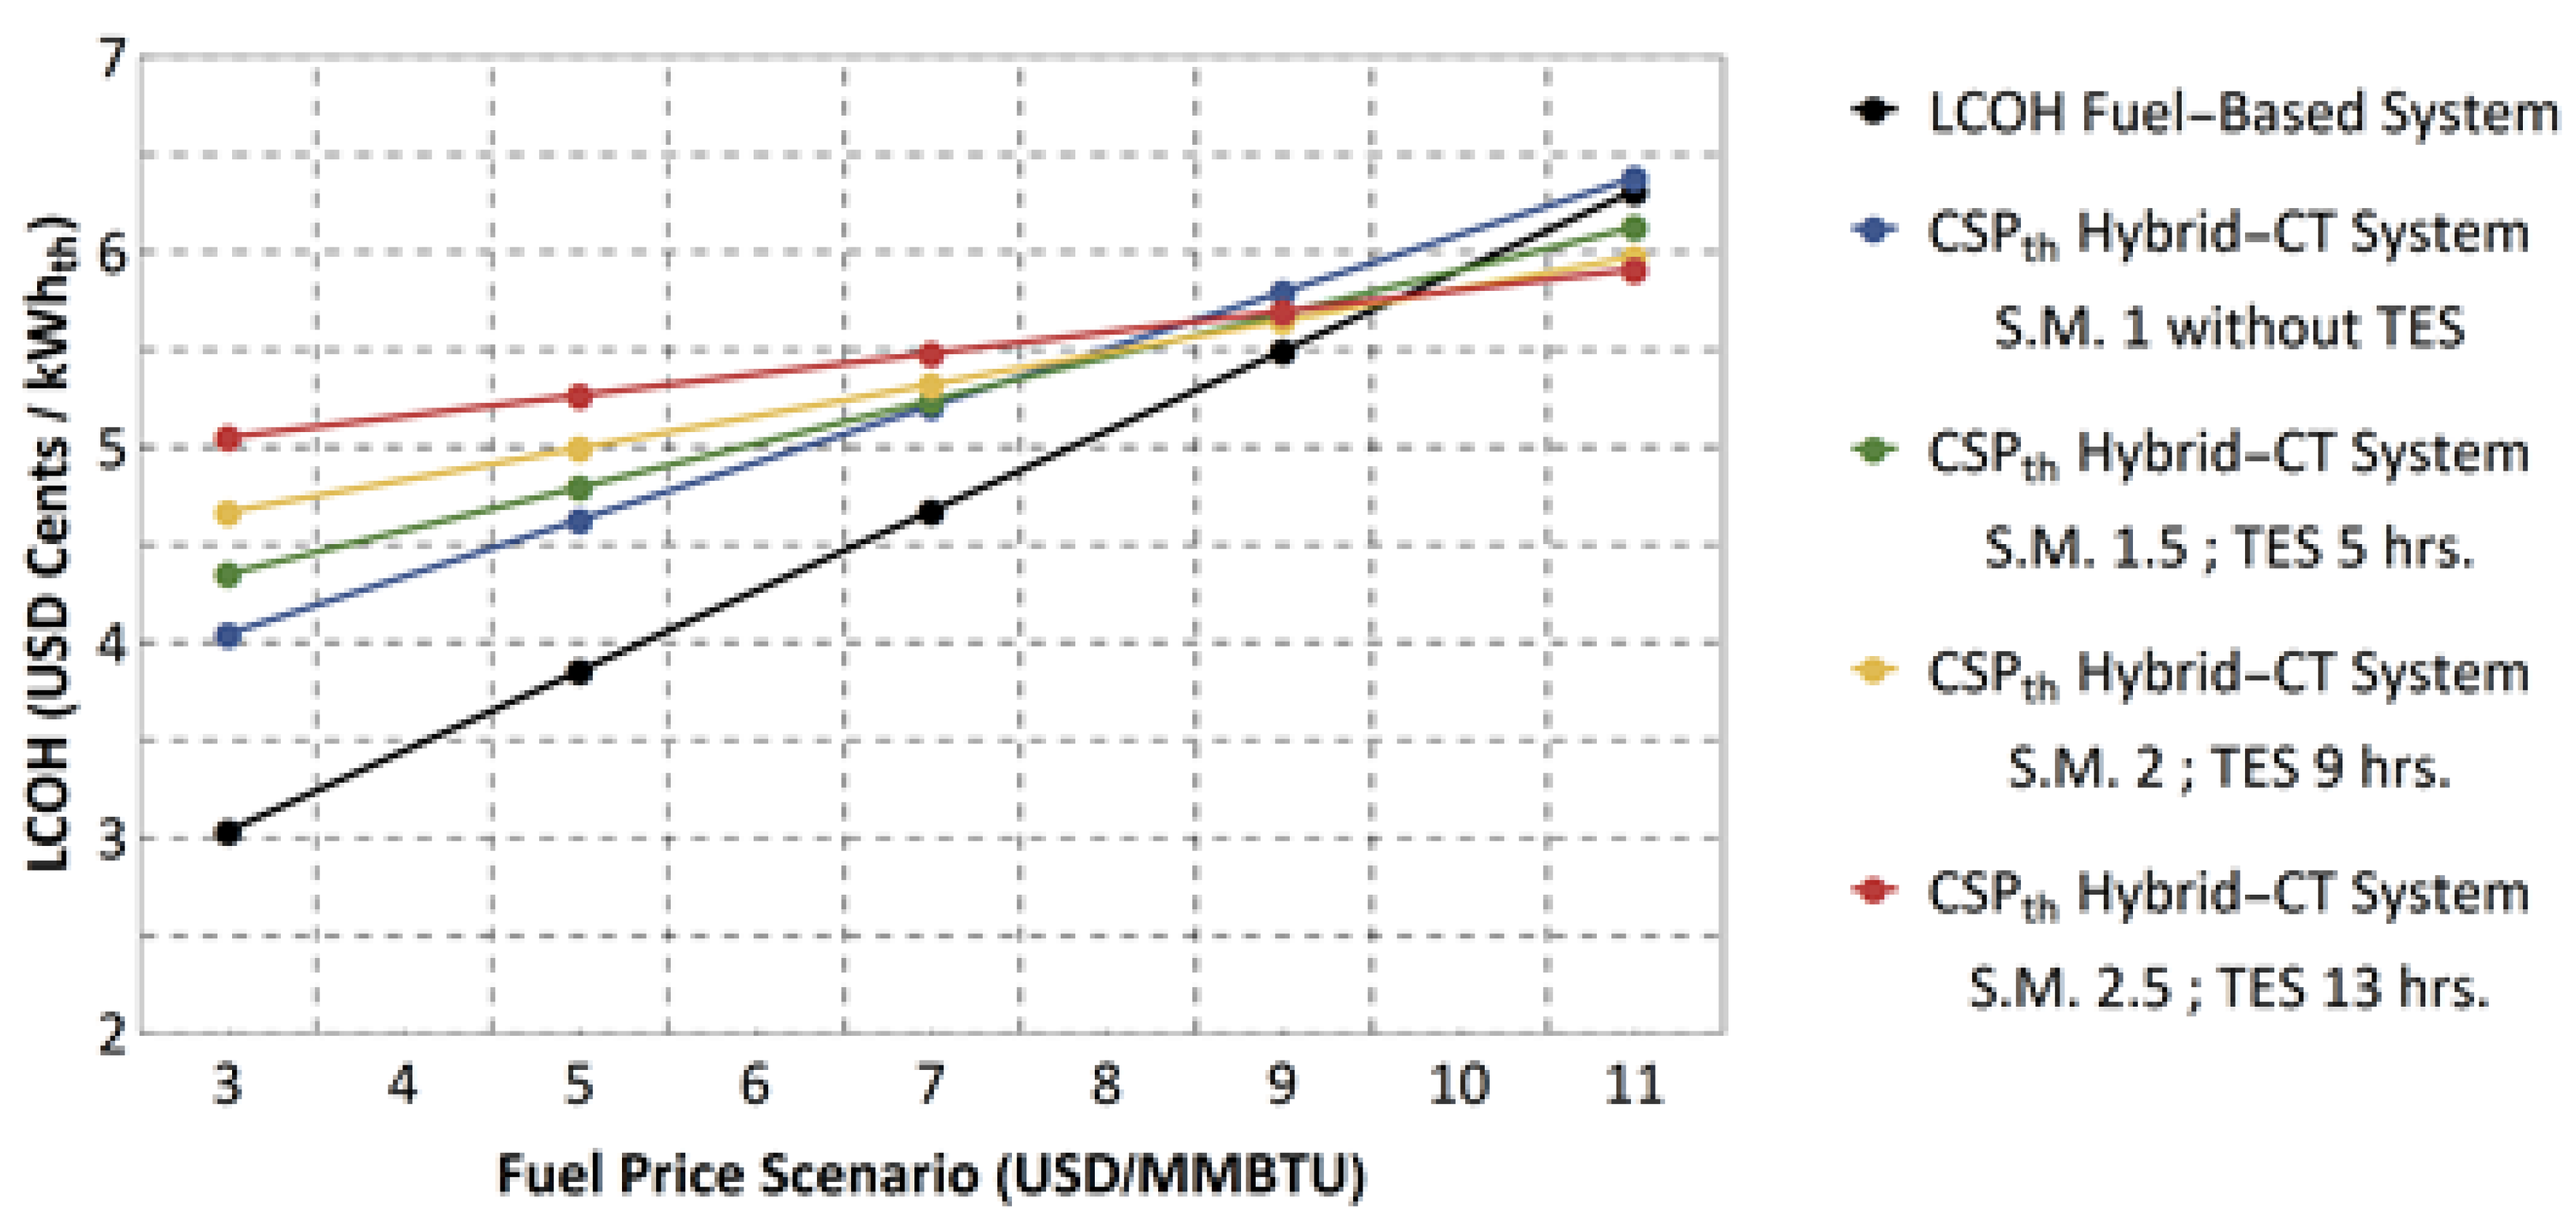
Figure 9 shows the
LCOH of the CSP
th Hybrid-CT systems and the
LCOH of a fuel-based system. For the fuel price scenario of 3 USD/MMBTU, the
LCOH of the CSP
th Hybrid-CT system (S.M. 1) is 4.04 USD Cents/kWh
th. The
LCOH increases for higher prices of fossil fuel; for example, the
LCOH is 4.63 USD Cents/kWh
th for the case of 5 USD/MMBTU. Moreover, the
LCOH increases for systems designed with solar multiples bigger than 1. For example, using the fuel price scenario of 3 USD/MMBTU, the
LCOH of the system designed with a solar multiple of 2.5 is 5.05 USD Cents/kWh
th. However, there is a point where increasing the solar fraction results positive: at 9 USD/MMBTU, the
LCOH of the CSP
th Hybrid-CT system (S.M. 2.5) is lower than the
LCOH of the CSP
th Hybrid-CT systems designed with lower solar multiples. Two reasons explain this: First, the O&M costs of the fuel-based boiler are proportional to the fossil fuel consumption; second, CSP
th Hybrid-CT systems with higher rates of fossil fuel consumption are more sensitive to fuel prices. The second fact is evident by looking at the slope of each system in
Figure 9. The breakeven point (fuel price scenario) at which the
LCOH of the CSP
th Hybrid-CT system equals the
LCOH of the fuel-based system changes regarding the solar multiple; however, this point is about 9.5 USD/MMBTU for the CSP
th Hybrid-CT system designed with a solar multiple 2.5.
The
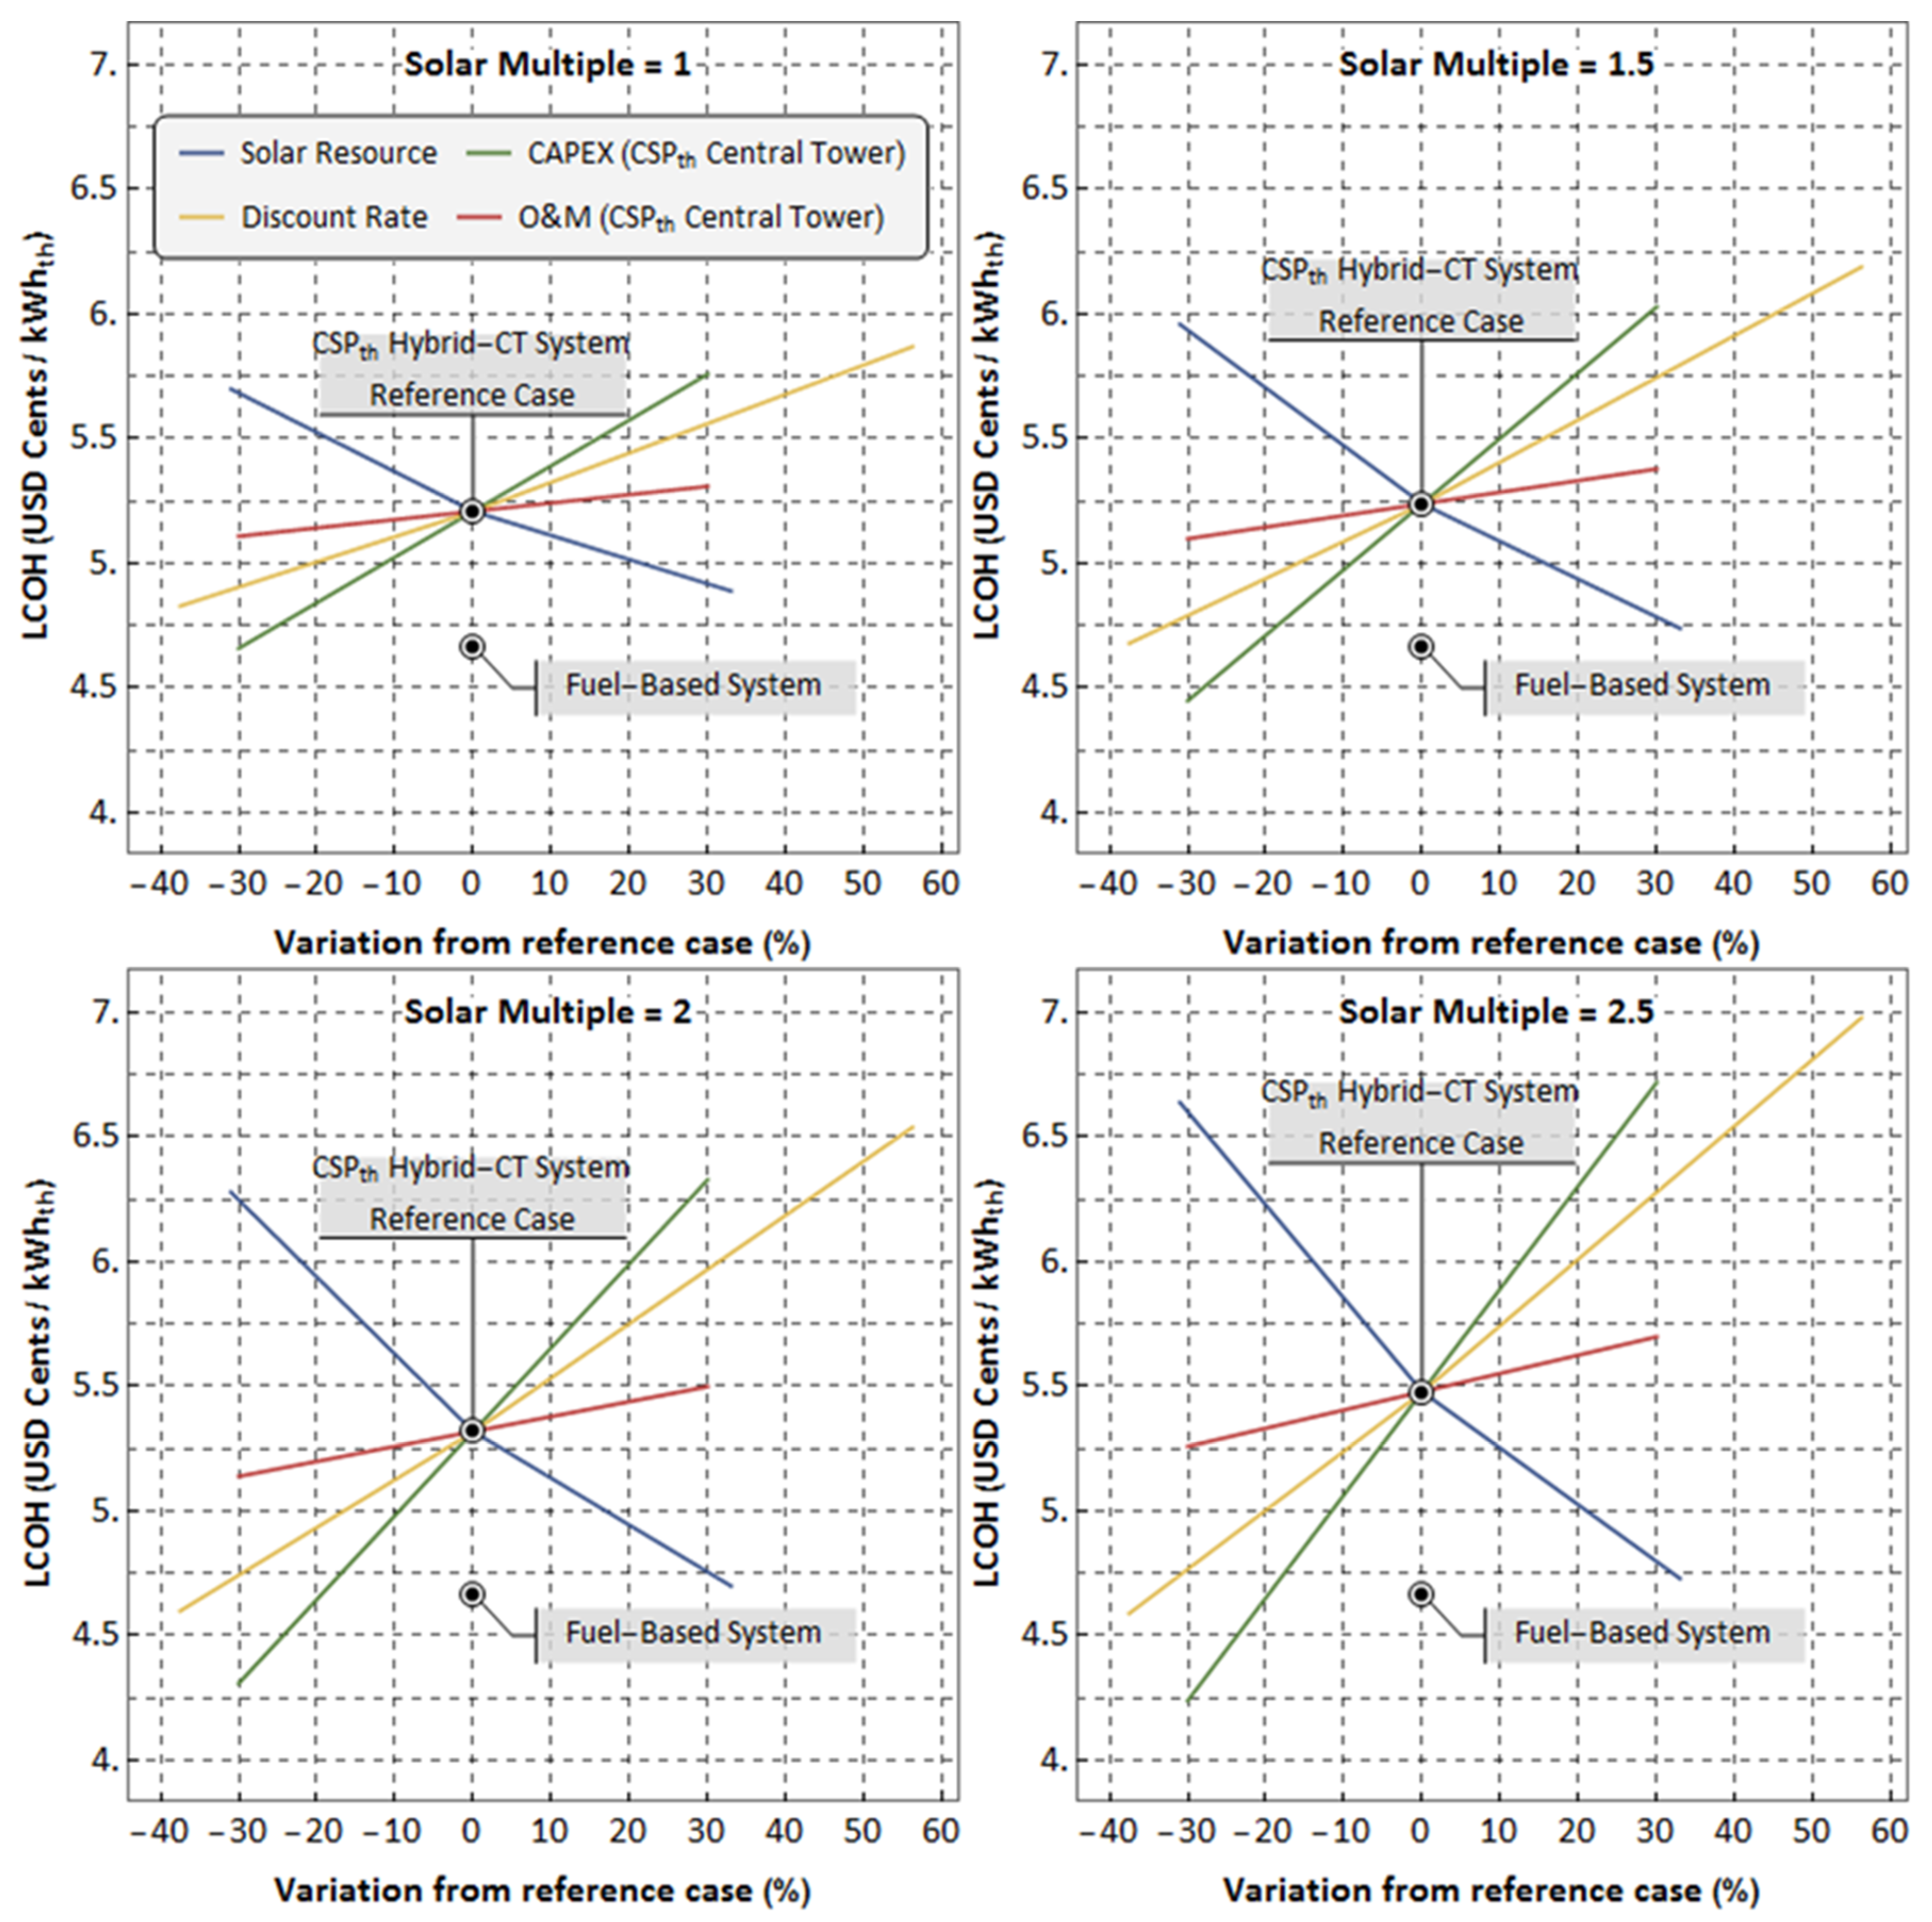
LCOH depends on four major factors: solar resource, capital expenditure, discount rate, and O&M costs.
Figure 10 shows a sensitivity analysis for the
LCOH of the CSP
th Hybrid-CT systems of
Table 7. The reference case corresponds to the
LCOH for the fuel price scenario of 7 USD/MMBTU.
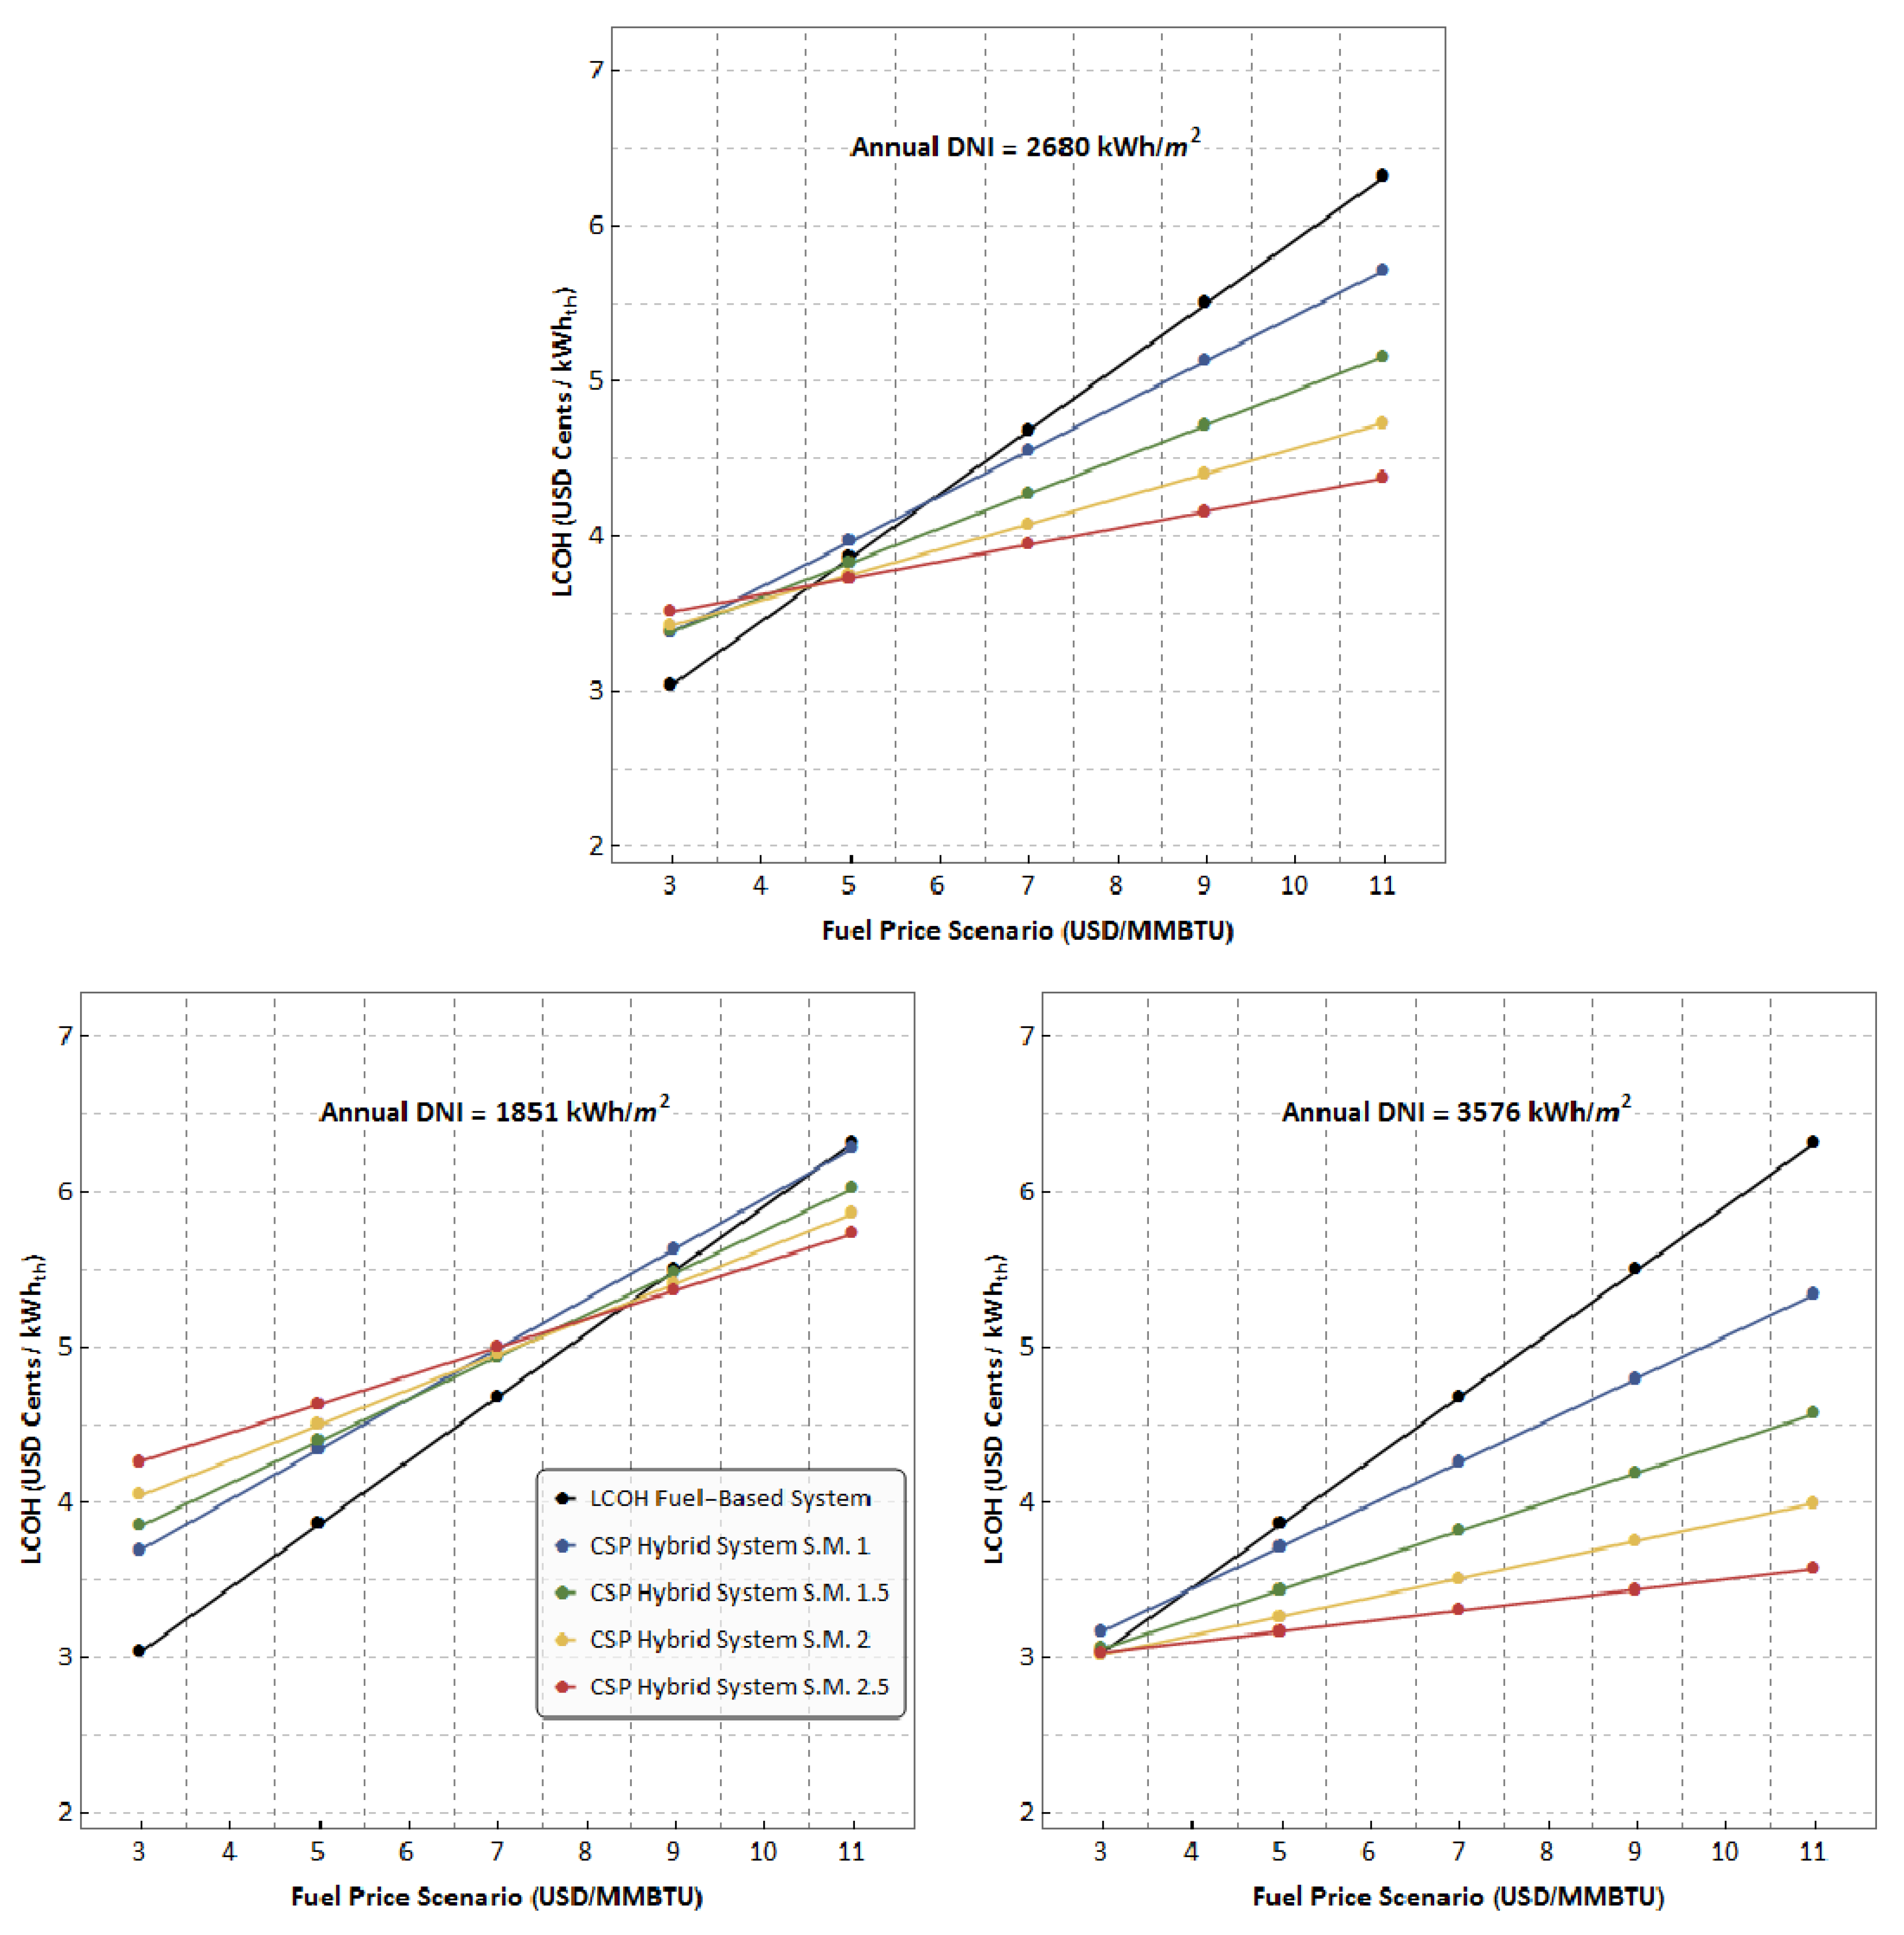
To estimate the effect of the solar resource, the CSP
th Hybrid-CT systems were designed for two different locations; the calculations described in
Section 4 were carried out for these locations. One location corresponds to the state of Tamaulipas, Mexico, which presents an annual DNI of 1851 kWh/m
2 (latitude 22.4° and longitude −97.9°); the DNI data were taken from the NREL National Solar Radiation Database [
73]. The other location corresponds to the region of Antofagasta, Chile, which presents an annual DNI of 3576 kWh/m
2 (latitude −23.7 and longitude −70.1); the DNI data were taken from the Solar Exploratory of the Ministry of Energy of Chile [
74].
To evaluate the effect of the capital expenditure, the
LCOH was calculated considering a change of ±30% in this parameter; this change was applied just to the capital expenditure that corresponds to the CSP
th Central Tower. Two scenarios were used for the discount rate: a scenario with government guarantees on low-carbon technology investment (5%), and a scenario of risk aversion toward low-carbon technology investment (12.5%) [
75]. A change of ±30% was applied to the O&M costs that correspond to the CSP
th Central Tower.
The variable with more influence on the LCOH of the CSPth Hybrid-CT system is the capital expenditure, followed by the solar resource, the discount rate, and the O&M costs. Excluding the solar resource, the variables show an apparent linear behavior. For the CSPth Hybrid-CT system (S.M. 1), the LCOH is USD 5.21 Cents/kWhth. The 30% reduction in CAPEX produces a LCOH of USD 4.66 Cents/kWhth, whereas the 30% increase in this variable produces a LCOH of USD 5.76 Cents/kWhth. If the CSPth Hybrid-CT system is designed for a solar resource of 1851 kWh/m2 (annual DNI), the LCOH of the system increases to USD 5.7 Cents/kWhth; on the contrary, if the system is designed for 3576 kWh/m2 (annual DNI), the LCOH falls to 4.89 USD Cents/kWhth. The discount rate of 5% produces a LCOH of 4.83 USD Cents/kWhth, whereas the risk-aversion scenario (12.5%) produces a LCOH of 5.87 USD Cents/kWhth. The LCOH is less sensitive to changes in the O&M costs; a reduction of 30% in this variable produces a LCOH of 5.11 USD Cents/kWhth; conversely, an increase of 30% results in USD 5.31 Cents/kWhth. Larger solar multiples extend the effect of the four variables. For example: a 30% reduction in CAPEX lowers the LCOH of the CSPth Hybrid-CT system (S.M. 1) by 10.5%; the same reduction lowers the LCOH of the CSPth Hybrid-CT system (S.M. 2.5) by 22.6%.
The sensitivity analysis shows that the capital expenditure and the discount rate remarkably affect the LCOH. There is still a high potential to reduce the capital expenditure for this technology [
48]. On the other hand, the growing concern about climate change is leading governments, multilateral development banks, and capital funds to stimulate investment in low-carbon technologies through lower costs of capital (discount rates). In this sense, the
LCOH was calculated with a 20% reduction in the capital expenditure and a discount rate of 5%. The 20% reduction in CAPEX lowers the cost of the three CSP
th Hybrid-CT systems (S.M. 2.5 and TES system of 13 h) to 153.52 MMUSD (solar resource: 3576 kWh/m
2), 165.79 MMUSD (solar resource: 2680 kWh/m
2), and 179.12 MMUSD (solar resource: 1851 kWh/m
2).
Figure 11 shows the results of this calculation for the CSP
th Hybrid-CT systems designed at the three locations.
The main goal of using a CSP
th Hybrid-CT system is to reduce both the CO
2 emissions. Considering the power demand of 50 MW
th, a fuel-based system produces 106,193 tons of CO
2 per year.
Table 8 shows the amount of CO
2 emissions that the CSP
th Hybrid-CT systems avoid.
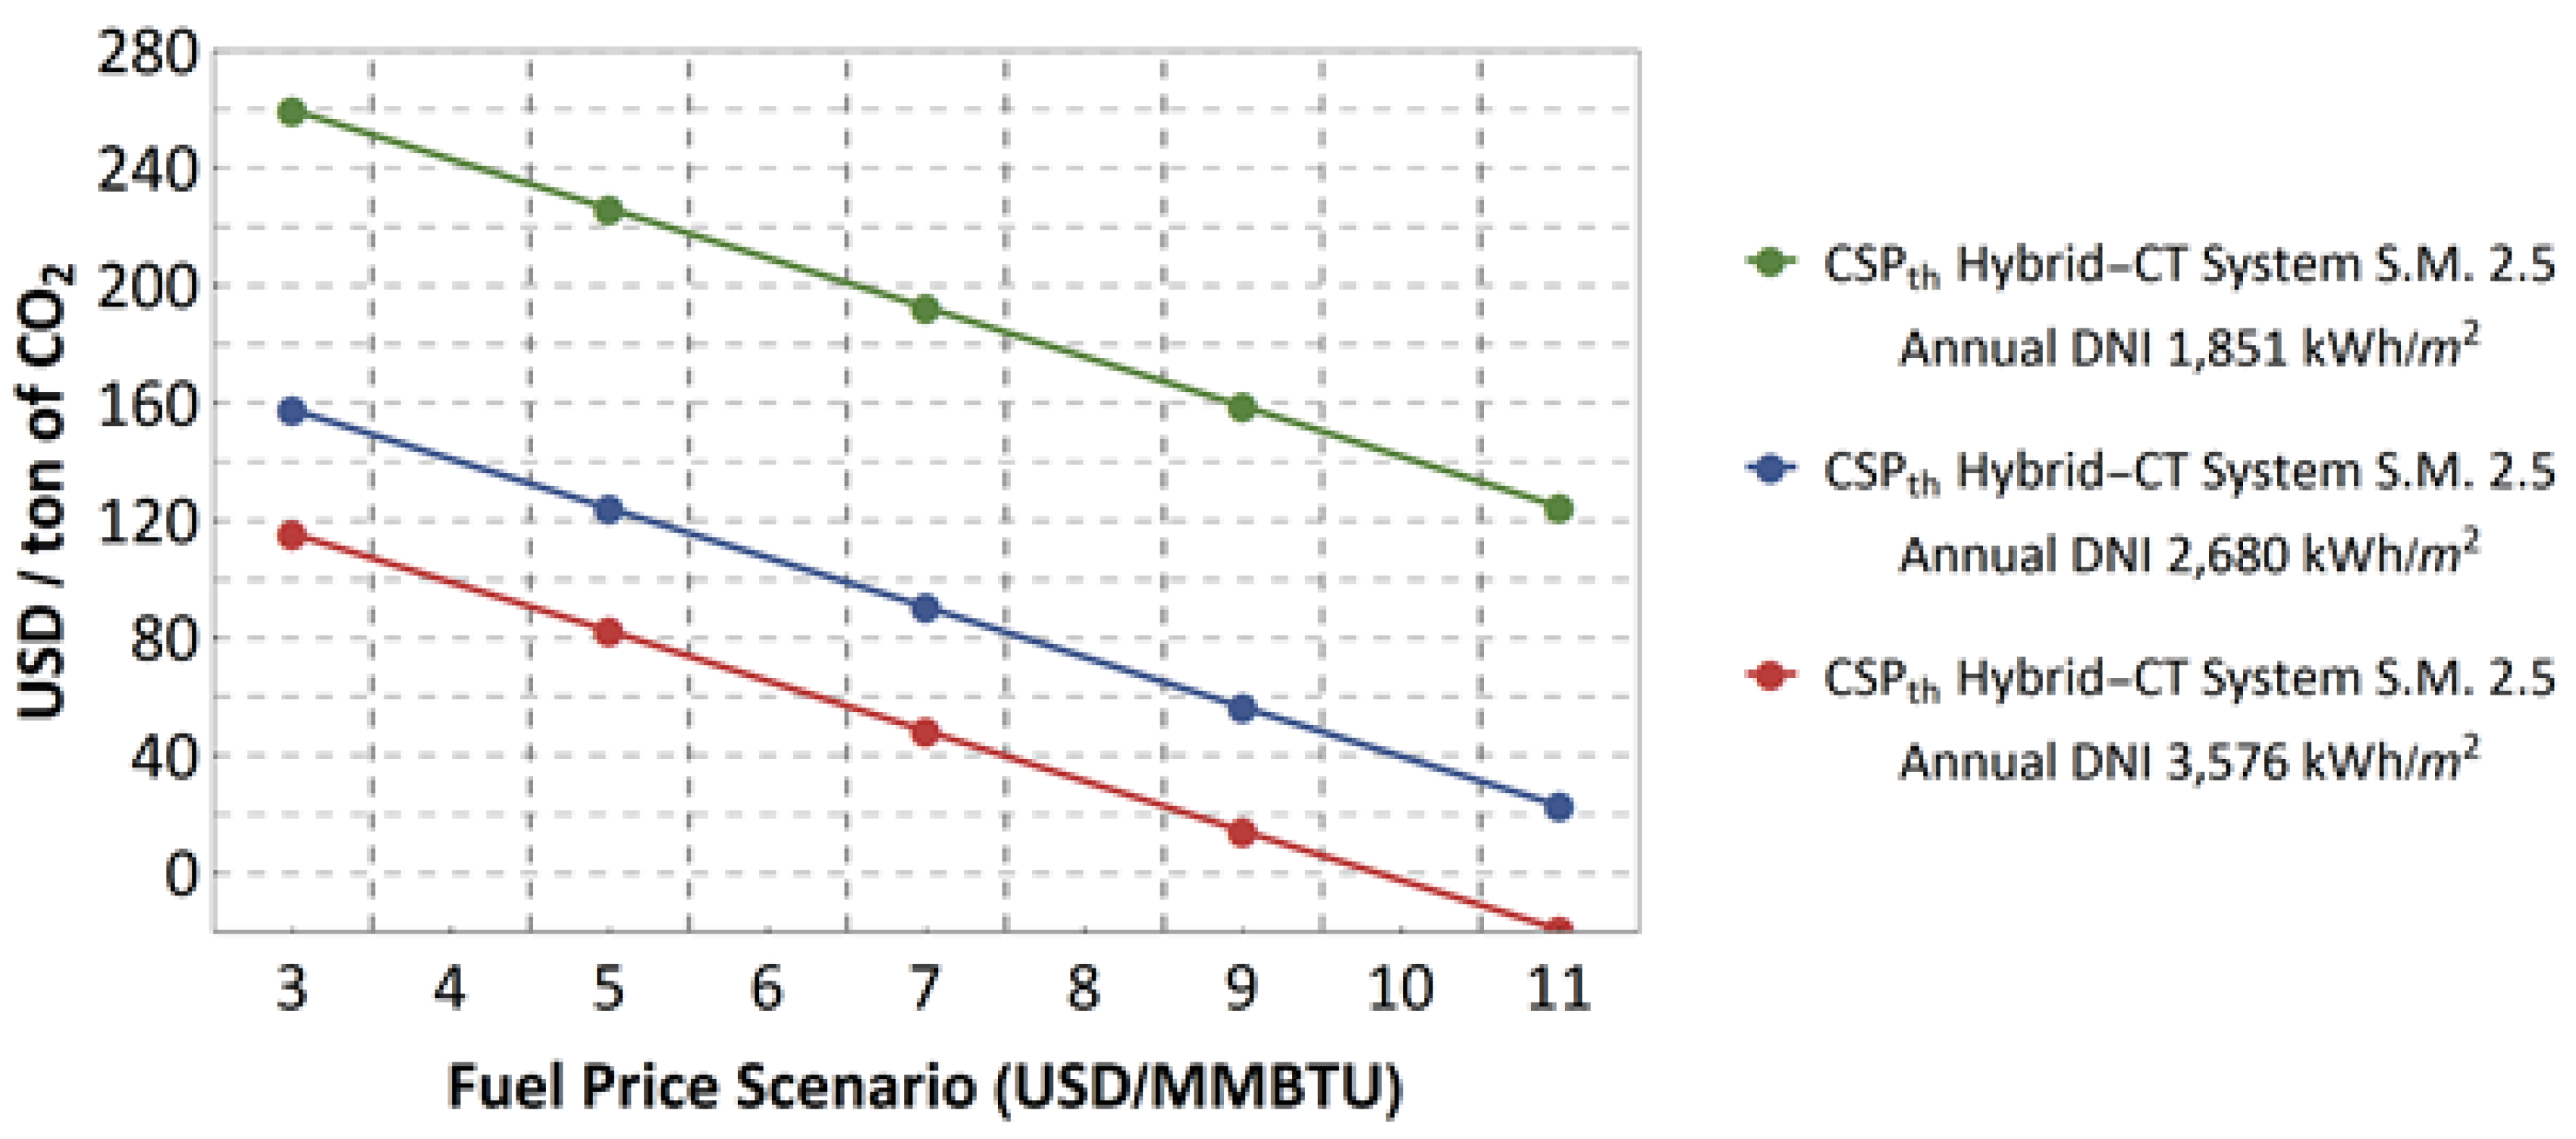
The marginal abatement costs were calculated for the three CSP
th Hybrid-CT systems designed with a solar multiple of 2.5. As mentioned in
Section 2.7, the marginal abatement costs are used as a reference to establish the carbon price needed to trigger abatement measures; for this reason, the
LCOH values of the CSP
th Hybrid-CT systems and the fuel-based system were calculated without pricing the CO
2 emissions. Moreover, the
LCOH was calculated without any reduction in capital expenditure and using a discount rate of 8%.
Figure 12 shows the marginal abatement costs of these three CSP
th Hybrid-CT systems. At the fuel price scenario of 3 USD/MMBTU, the marginal abatement costs are 259, 157, and 115 USD/ton of CO
2 for the systems designed for a solar resource of 1851 kWh/m
2, 2680 kWh/m
2, and 3576 kWh/m
2, respectively. The results show a similar slope for the three systems; the marginal abatement costs decrease 33.6 USD/ton of CO
2 per every increase of 2 USD/MMBTU in the fuel price scenario.
As shown in
Figure 12, the marginal abatement costs of the CSP
th Hybrid-CT systems are significantly high at low fuel price scenarios. A CO
2 price of this magnitude compromises the competitiveness of energy consumers [
76]; however, if a CO
2 price is not considered, the
LCOH of these systems is greater than the
LCOH of fuel-based systems. In this sense, a reasonable CO
2 price should be accompanied by a CAPEX reduction and low costs of capital in order to encourage the deployment of CSP
th Hybrid-CT systems as a measure to reduce CO
2 emissions.
5. Conclusions
The CSPth Hybrid-CT technology can produce high-temperature heat for high-temperature industrial processes; this feature makes it a promising option for intensive energy consumers. CSPth Hybrid-CT systems are a high-reliable source of energy and highly effective in avoiding CO2 emissions compared with fuel-based systems. However, the economic competitiveness of this technology against fuel-based systems depends mainly on two local conditions: the solar resource and fuel prices.
Regarding the LCOH of CSPth Hybrid-CT systems, the variables with more influence are the capital expenditure, followed by the solar resource, the discount rate, and the O&M costs. The effect that these variables have on the LCOH is extended with solar multiples bigger than 1. In this sense, the study suggests that the capital expenditure and the discount rate are key variables because they create opportunities for cost reductions, especially for large solar multiples, where the heliostat field and the TES system represent a large percentage of the capital expenditure.
In order to effectively deploy CSPth Hybrid-CT systems, CAPEX reductions and low costs of capital should be accompanied with reasonable CO2 prices. For example: the LCOH was calculated considering a 20% reduction in capital expenditure, a discount rate of 5%, and a CO2 price in line with the recommendations of the High-Level Commission on Carbon Prices. Under these assumptions, the CSPth Hybrid-CT systems show lower LCOH than fuel-based systems. For the reference location (annual DNI 2680 kWh/m2), the LCOH of the CSPth Hybrid-CT system (SM 2.5) equals the LCOH of a fuel-based system at a fuel price scenario of 4.5 USD/MMBTU; for the other two regions with annual DNIs of 1851 and 3576 kWh/m2, the breakeven points are 8.5 and 3 USD/MMBTU, respectively.
The LCOH values shown in this work result from using two extreme values of solar resource (from 1851 kWh/m2/year to 3576 kWh/m2/year) and a medium point (2680 kWh/m2/year), which was used as the reference case. This provide a valid approximation of the LCOH of CSPth Hybrid-CT systems for a significant interval of solar resources, which encompass different regions in the world. In this sense, a wide range of industries might have a notion of the economic competitiveness of this renewable technology against fuel-based systems and which conditions improve this competitiveness. However, in order to have a more accurate perspective, a more detailed study should be conducted in every specific case, including minor and auxiliary components in the analysis.


