1. Introduction
An MCHX is a type of heat exchanger that has been rapidly developed in recent years [
1,
2]. Compared to traditional heat exchangers, MCHX offers certain advantages: downsizing (consuming less space) and requiring less refrigerant in the system [
3]. These features and low-cost manufacturing techniques with material savings lead to a competitive manufacturing process compared to fin-tube heat exchangers [
4,
5,
6]. MCHXs have great potential to address the demand for small and lightweight heat exchangers that can be used in small-to-large-size HVAC systems and refrigeration applications, such as for aviation, automotive, electronic equipment, chemical, industrial, commercial, and residential systems [
7]. Compared to the conventional heat exchanger, MCHX has a small hydraulic diameter of less than 1 mm, and the reduced cross-sectional area result in a relatively high-pressure drop [
8,
9]. However, this high-pressure drop is maintained at an acceptable level by applying a common header (also called a manifold) and using parallel tubes that branched out from the header.
An MCHX with a vertical header typically functions as an evaporator in a heat pump cycle. The two-phase refrigerant flows into the evaporator with an inlet quality of about 0.1 to 0.2 and then separates into liquid and vapor phases as it enters the header. In the two-phase flow, a difference in property parameters such as density, velocity, and buoyancy of the fluid occurs for each phase, further causing a nonuniform flow distribution. As a result, dry-out occurs in some branched microchannel tubes, which leads to reduced heat transfer efficiency and affects the overall system performance [
10]. It should be noted that the dry-out inside the evaporator is not simply a matter of efficiency reduction. The absence of liquid inside the evaporator promotes oxidation owing to the rapid temperature rise and causes a local melting point [
11]. This phenomenon may appear differently depending on the working fluid, operating conditions, and shape of the heat exchanger [
12,
13,
14]; however, this ultimately causes heat exchanger failure. This problem can be solved by improving the flow distribution within the header through an optimal design of the header.
In the studies of Amador [
15], Kandlikar et al. [
16], and Cho et al. [
17], the analyses of the flow distribution inside the header were conducted by focusing on the single-phase flow. It was found that the pressure drop due to the friction inside the tube has a significant influence on the flow distribution. However, it should be noted that the two-phase flow distribution through the manifold is a complex phenomenon, and the main factors are diverse. Among various factors, it is well-known that the structural and geometrical design of the heat exchanger, operating conditions (mass velocity, inlet quality, flow pattern, and heat load), and properties of the working fluid are affected [
18,
19,
20].
Regarding the header geometry, Siddiqui and Zubair [
21] studied various design factors affecting the flow distribution of the heat exchanger. This comprehensive review demonstrates that the design of the header layout and dimensions is an essential factor for uniform flow distribution. Lee [
22] investigated the two-phase flow distribution inside the vertical header of a compact heat exchanger with parallel channels. It was confirmed that the recirculation of the two-phase upstream of the vertical header is also significant in the flow distribution.
Regarding the operating conditions, the study of Hwang et al. [
23] examined the influence of various operating conditions on the flow distribution in a heat exchanger with a horizontal header. This research confirmed that the effects of the mass flow rate and inlet vapor quality were more significant than those of the heat load. Redo et al. [
24] investigated the two-phase flow distribution according to changes in the mass flow rate and inlet quality for vertical headers with parallel microchannels. This study confirmed a relatively uniform distribution at a higher mass flow rate and a lower inlet quality. As revealed from the studies of Fei and Hrnjak [
25] and Ahmad [
26], the flow pattern can also be considered a significant factor of flow distribution, which is an essential parameter in horizontal headers rather than in vertical headers.
As in the studies described above, the two-phase flow distribution in the header has been investigated using different parameters from various viewpoints. In particular, the available works on vertical headers with horizontal microchannels, which is the subject of this study, have mainly considered compact heat exchangers with low mass flow rates and are focused on automotive air conditioning applications. These sizes and ranges are insufficient to consider the actual operating conditions of residential or commercial air conditioners. Moreover, the flow distribution in the vertical header must consider the effect of the height because the influence of gravity is relatively emphasized [
27]. The vertical header of a residential air conditioner is approximately 500 mm; under such conditions, the flow distribution imbalance could be further aggravated.
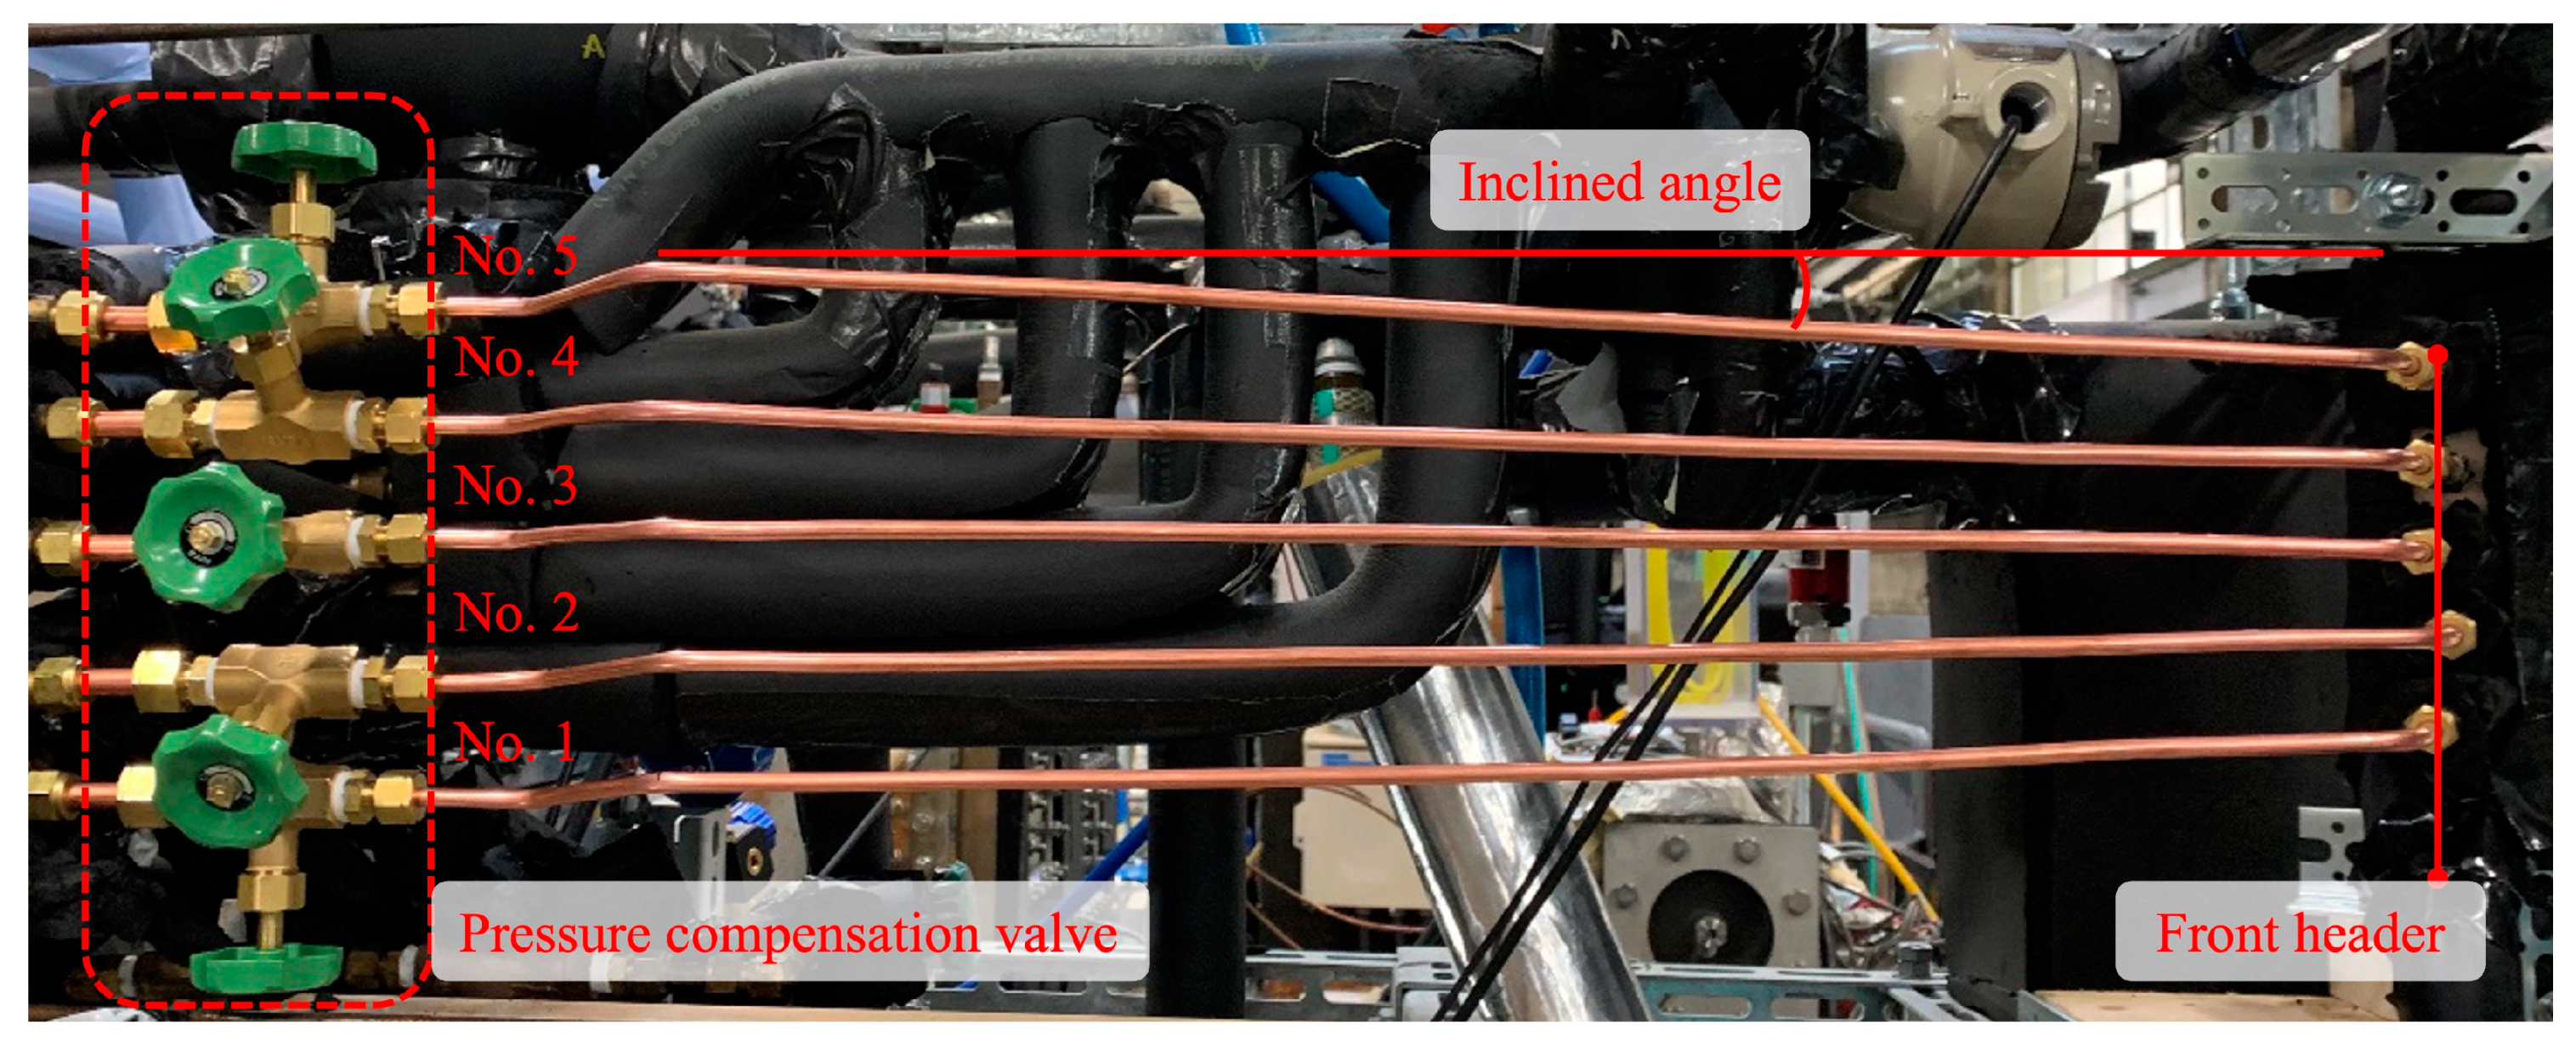
As explained above, from the viewpoint of a vertical header design, the improvement of two-phase flow distribution to prevent dry-out is very important. In this study, two types of vertical headers were considered to investigate the effect of the header heights: one with a height of 490 mm for simulating a heat pump system and another with a height of 190 mm for simulating a compact heat exchanger. To focus on the effect of the variation in header height, the parallel tubes were considered as simplified 3 mm smooth tubes with a pressure control valve. In addition, two sets of header outlet inner diameters were considered to intentionally control the distribution resistance. A small cross-sectional area of 15.30 mm2 was considered to provide a sufficient inertial force in the tall height case. The effect of the high Reynolds number on the two-phase flow distribution was compared with that of the conventional vertical header. For operating conditions, a mass flow rate of 50–150 kg h−1 (mass flux of 908–2723 kg m−2 s−1) and an inlet vapor quality of 0.1–0.2 were considered. In particular, the analysis of the two-phase flow distribution behavior according to the change in hydrodynamic parameters can be an essential indicator for suggesting the direction of the actual design. For this, an empirical correlation expressed by the Reynolds and Froude numbers has also been proposed.
3. Results and Discussion
This section compares and analyzes the flow distribution results for various inlet conditions for the four header configurations. Subsequently, a new correlation for the considered type of header has been proposed.
3.1. Flow Distribution Profile for Each Phase
Figure 4 and
Figure 5 depict the liquid and vapor flow ratios based on the system flow rate and header inlet quality for the four header sets. The liquid and vapor flow ratios in each tube are shown to present the overall experimental results briefly and comprehensively. The upper sections of
Figure 4 and
Figure 5 show the results for the 190 mm headers (header sets 1, 2), and the results for the 490 mm headers (header sets 3, 4) are depicted at the bottom. The header considered in this study has a higher Reynolds number than that considered in a previously reported study. Therefore, unlike the observations in previous studies, the liquid flow distribution is concentrated at the top, and the vapor flow distribution is mostly at the bottom.
3.1.1. Liquid-Phase Distribution
As depicted in
Figure 4, for most cases, the liquid flow ratio increases in the top tube (tube number 5) regardless of the header inlet conditions (flow rate and quality). In the case of header sets 3 and 4 at 50 kg h
−1, the relatively small inlet flow rate prevents a significant amount of liquid from reaching the top tube. As described above, an increase of the flow ratio in a specific tube means that the corresponding tube’s fluid (liquid, vapor phase) flow rate is relatively higher than that of the other tubes. This trend is exacerbated as the system flow rate increases and the header inlet quality increases. Moreover, this trend becomes more apparent in the different header outlet inner diameter sets (header sets 2 and 4). In particular, the increase in the inlet quality significantly aggravated the nonuniformity of the liquid-phase distribution. However, as the height of the header increases (from 190 mm to 490 mm), the flow distribution becomes relatively uniform.
3.1.2. Vapor-Phase Distribution
As depicted in
Figure 5, the vapor flow ratio in the lower tubes is considerably higher than that in the upper tubes, which means that the vapor flow is relatively concentrated in the lower tubes. In the case of a 190 mm header, the flow ratio at the lower tubes is less than in the case of a 490 mm header. The trend is perhaps due to the inertial force being more dominant than the gravitational force. The height of the header promotes vapor supply to the upper region in the case of a 190 mm header. Oppositely, in the case of the 420 mm header set, gravity has more influence than inertia, which leads to intensified nonuniform vapor flow distribution. For all header sets, the nonuniformity increases with the system flow rate and with the different outlet inner diameter sets (header sets 2 and 4). However, in most cases, an increase in the inlet quality reduces the nonuniformity.
3.2. Relative Standard Deviation
The flow distribution results according to the change in the inlet conditions for the four types of header sets can be shown more intuitively through the relative standard deviation (RSD) results.
Figure 6 depicts the RSD results for all the experimental conditions. Through this, it can be noted that the liquid and vapor flow ratios have opposite trends according to the header set and inlet quality, regardless of the header inlet flow rate. A low liquid flow RSD case indicates a high vapor flow RSD. The liquid flow has the minimum value of RSD (0.17) in the header set 4 (490 mm header) with different outlet inner diameter sets. Furthermore, in the case of the vapor phase, it shows the minimum RSD value (0.18) in the header set 2 (190 mm header) with different outlet inner diameter sets. However, the minimum RSD of each phase for the entire experimental case was observed at different flow rate conditions. These results show that the rational flow distribution can be derived according to the various geometrical parameters (cross-sectional area, height, and outlet inner diameter of a header) and the system’s working conditions (flow rate and inlet vapor quality). It is also expected that the flow distribution can be controlled by combining these parameters and conditions.
3.3. Effect of Different Parameters on Flow Distribution
In this section, the effect of varying the operating conditions and structural parameters on flow distribution was further explored. For the flow rate, an increase in flow generally promotes liquid inflow and decrease of vapor inflow to the upper section. This phenomenon is typical to separated two-phase flow in vertical headers, which transports maldistribution (increased RSD) of the liquid and vapor flow as the flow rate increases.
However, it is complicated to analyze the effect of parameter changes unless represented by the flow rate. Therefore, the flow distribution profiles in
Figure 4 and
Figure 5 were rearranged to produce
Figure 7,
Figure 8 and
Figure 9 to highlight the analysis of the target parameter. The figures are divided into sub-figures for an easy but comprehensive comparison of the results, with the inclusions of RSD to aid the quantitative liquid and vapor flow distribution evaluation. The structural details for each header set are summarized in
Table 2.
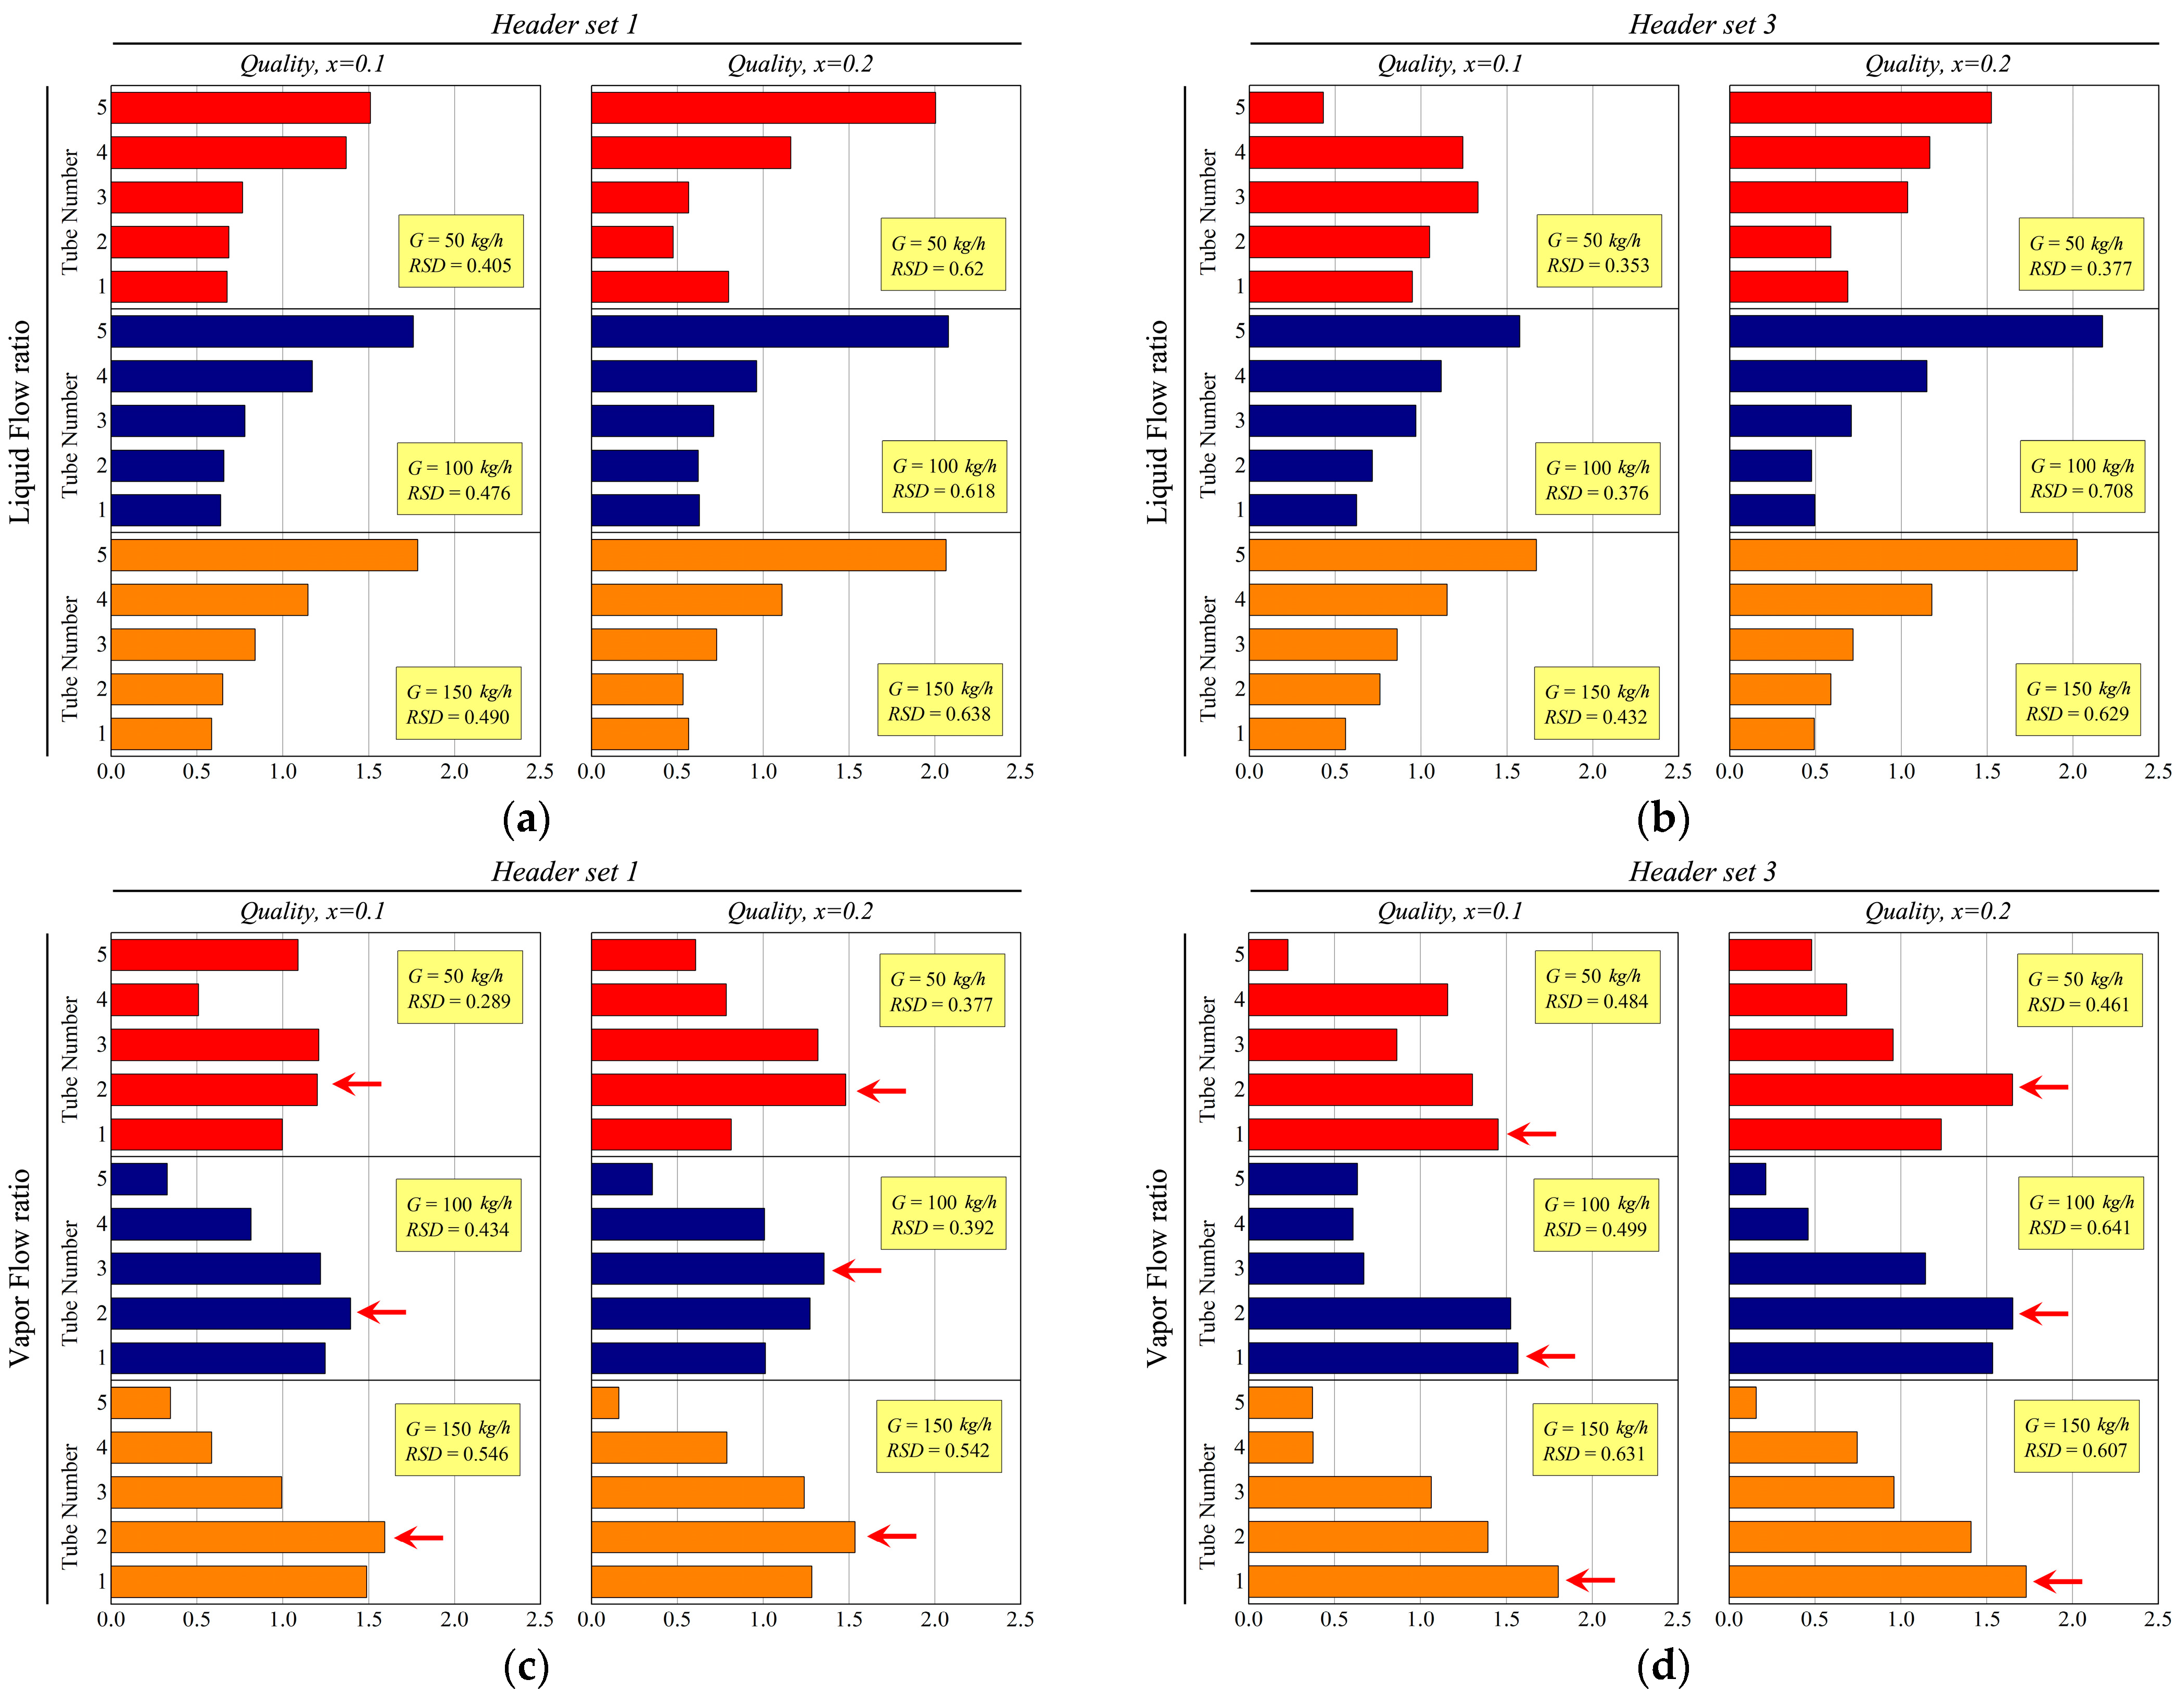
3.3.1. Effect of Inlet Vapor Quality
Figure 7 shows the flow distribution profiles according to the change in inlet vapor quality. The results of header sets 1 and 3 with the same header outlet tube diameter are presented. As the inlet quality increases, the liquid flow ratio at the upper section (tube numbers 4 and 5) generally increases. In the case of 50 kg h
−1 in the header set 3, a low liquid flow ratio was observed in tube number 5 due to the increased height of 490 mm. In the same header set, it is observed that the liquid flow ratio increases as the inlet quality increases. The increment in inlet quality induces the concentration of liquid flow to the upper section of the header, owing to the rise in inertial force and an increase in gas-phase flow rate. Therefore, the vapor flow traversing into the upper section also rises in the direction of tube number 5, which can be recognized by the rise of the vapor flow distribution’s peak position (red arrow).
However, the introduction of an additional inertial force from the increase of the gas-phase flow rate promotes the liquid inflow into the upper section, which leads to the liquid distribution degradation, indicated by the liquid flow RSD increment as the inlet quality increases.
3.3.2. Effect of Header Outlet Tube Diameter
Figure 8 shows the flow distribution profiles at
according to the variation of the header outlet tube diameter set. The headers with the same height were grouped and compared. While header sets 1 and 3 comprise of fixed outlet tube diameter, header sets 2 and 4 feature an increasing tube diameter size towards the upper section, as shown in
Figure 2. For the short headers (190 mm), the liquid flow rate that exits at the upper section is greater for header set 2 (different outlet tube diameter) than in header set 1 (same outlet tube diameter). Because the former has a larger diameter at the upper section, it is thought that the liquid flow is enhanced in this region as the resistance to the fluid is reduced. Here, the increase of liquid inflow according to the change in the outlet tube diameter is smaller than the increase of the inlet quality (represented in
Figure 7), which means that the rise in inertial force according to the change in the outlet tube diameter is relatively smaller than the effect of the inlet quality.
On the other hand, for the tall headers (490 mm), a better liquid flow distribution is obtained in header set 4 (different outlet diameter), especially at an inlet mass flow rate of 50 kg h−1 compared with that in the header set 3 (same outlet diameter). A slight inflow increase into tube numbers 3 and 4 is observed, perhaps due to a relatively small increase in inertial force, as previously mentioned. That is, if the height of the header changes, the influence of the inertial force also changes. In the vapor flow distribution, only a slight change is observed due to a relatively small increase in inertial force, which is more evident in the short header.
As described above, unlike the increase of the inlet quality, the effect of promoting liquid flow into the upper section from different outlet diameter sets is different depending on the height, so it can be confirmed that the RSD increases in the short headers, while it decreases in the tall headers.
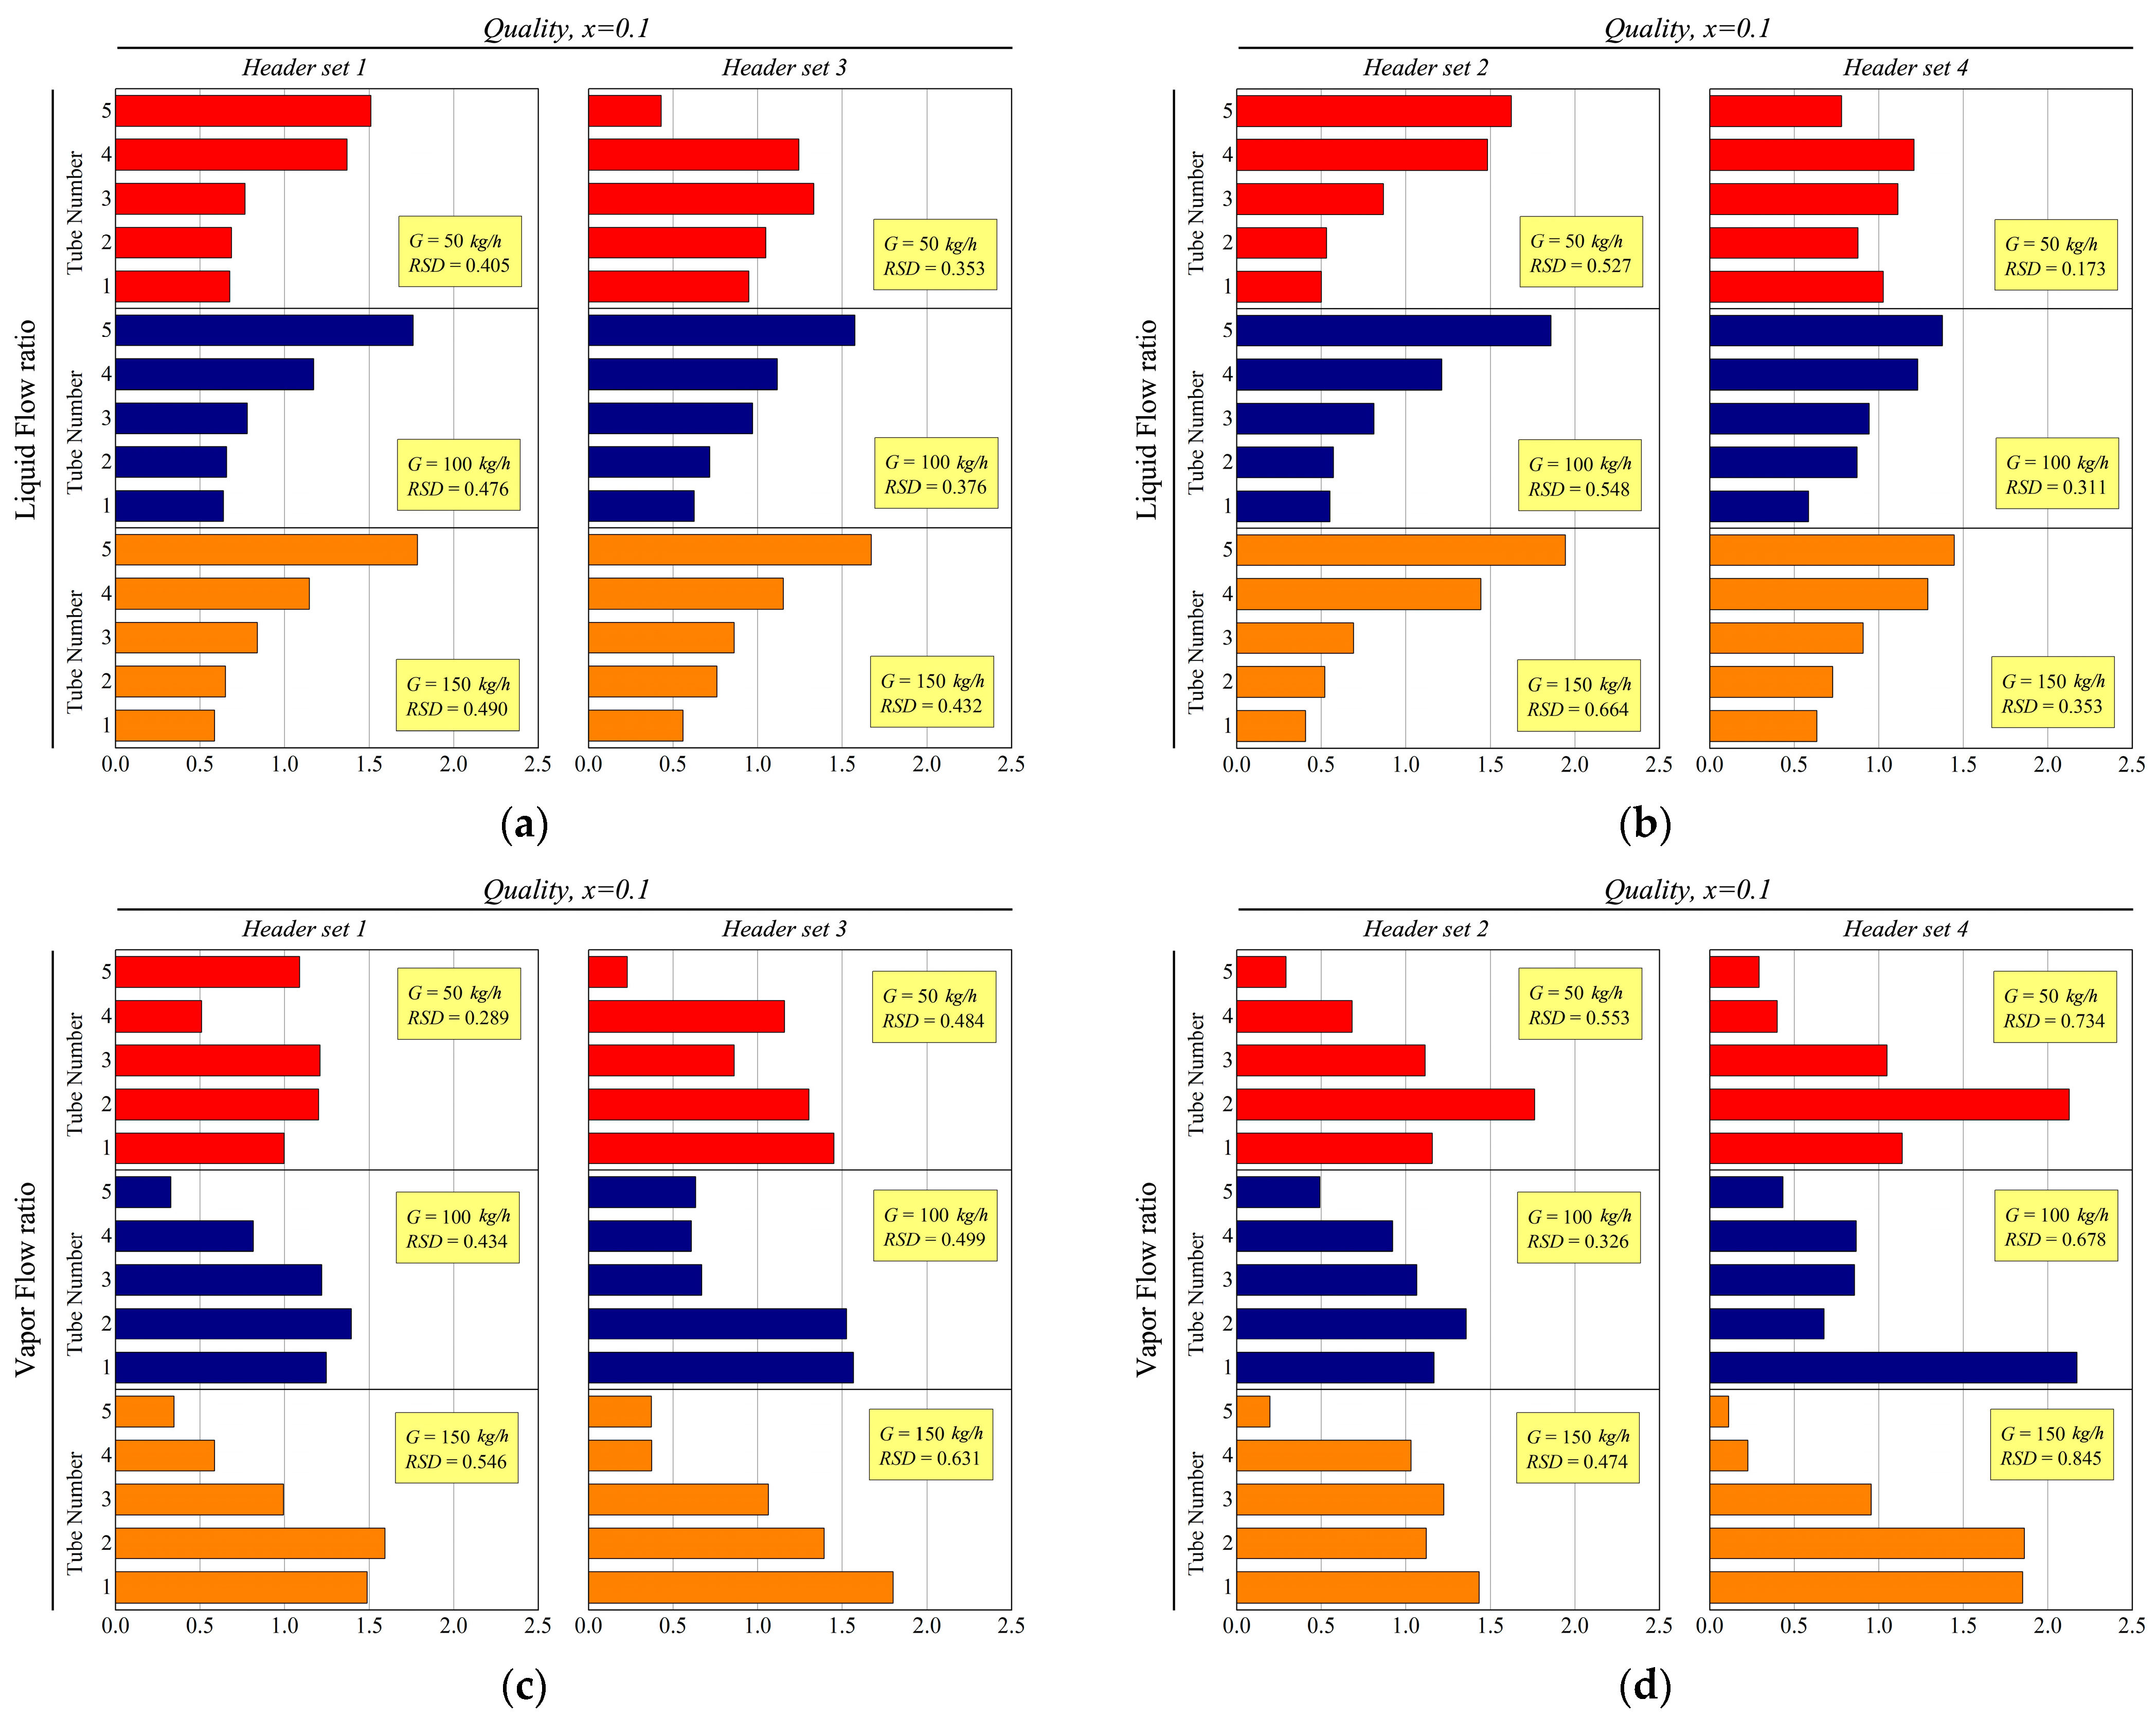
3.3.3. Effect of Header Height
Figure 9 shows the flow distribution profiles at
according to the change in header height. The header sets with the same header outlet tube diameter set were grouped and compared. It is generally observed for all the considered inlet mass flow rates that the liquid flow ratio is lower at the upper section in the tall header as compared with the short header. Moreover, the tall header exhibits a lower RSD for the liquid flows. This means that while an excessive inertial force is demonstrated in the short header (190 mm), it is relatively moderate in the tall header (490 mm). In particular, despite the lower inlet mass flow rate (50 kg h
−1), a large amount of liquid flows at the upper portion of the header set 2 due to a large outlet tube diameter in this section. However, as the height increases, the excessive liquid influx to the upper section is relieved, and a relatively well-distributed liquid flow is obtained, as in the case of header set 4.
On the other hand, for the vapor flow ratio, RSD tends to increase as the inflow to the upper section decreases when the height of the header increases. This result is due to the vapor flow decrement as the liquid flow ratio to the upper section decreases.
3.4. Dimensionless Number Analysis
As described above, the flow distribution in the vertical header is a result of various physical interactions such as inertial force, viscous force, and gravitational force. To understand the previous observation results, the Reynolds and Froude numbers of the flow inside the vertical header can be considered. The two-phase flow distribution notation in the header and each tube is defined in
Figure 10.
To comprehensively evaluate the effects of the parameters considered in this study, this section presents investigation results regarding the effects of the flow rate, inlet vapor quality, and header sets based on the dimensionless number of a two-phase mixture. The Reynolds and Froude numbers for the two-phase mixture are expressed in Equations (9) and (10), respectively.
Here, is the individual characteristic length of the Froude number, defined as the height from the inlet of the header to the inlet of each branch tube.
3.4.1. Reynolds Number
Figure 11a depicts the change in the Reynolds number according to the inlet vapor quality of the header. Regardless of the inlet flow rate, the Reynolds number increases as the inlet vapor quality increases. A rise in the inlet vapor quality indicates an increase in the vapor flow rate in the vertical header. Furthermore, increasing the inlet vapor quality causes a significant increase in the void fraction. In the case when vapor quality is equal to 0.2, the void fraction is approximately 0.5–0.7. Therefore, a slight increase in the inlet vapor quality causes a relatively high volume flux, wide cross-sectional area, and high vapor-phase speed. Moreover, the high-volume flux of the vapor phase leads to an increase in the Reynolds number (increase in inertia) of the entire two-phase mixture. As a result, the amount of liquid or vapor flow to the upper region of the header increases.
Figure 11b depicts the change in the Reynolds number when the header outlet inner diameter set changes for a header height of 190 mm. Header set 2, which has a different outlet inner diameter, has a higher Reynolds number compared with header set 1, with a fixed outlet inner diameter regardless of the inlet flow rate. As previously described, the large outlet inner diameter gradually expands from the bottom (tube number 1, 2.2 mm) to the top (tube number 5, 3.2 mm). Accordingly, the resistance of the flow distribution decreases, and the Reynolds number consequently increases. However, it can be observed that the change in the outlet inner diameter causes an effective change only at a flow rate of 150 kg h
−1, where the effect is concentrated in tube numbers 3 and 4. These observations are evident from the liquid and vapor flow ratio results depicted in
Figure 5 and
Figure 6. It can be understood that the flow distribution can be controlled by changing the outlet diameter of the vertical header.
Figure 11c illustrates the effect of the vertical header height variation on the Reynolds number. The Reynolds number is generally lower at header set 3 (490 mm height) compared with that of header set 1 (190 mm height) for all the considered flow rates. The flow is concentrated at the bottom part of the header due to lesser resistances in the taller header, which also indicates lesser inertial forces or Reynolds number. The liquid and vapor flow ratios in the upper tubes decrease along with an increase in the header height. As the gravitational force becomes more dominant, the consideration of the Froude number becomes significant.
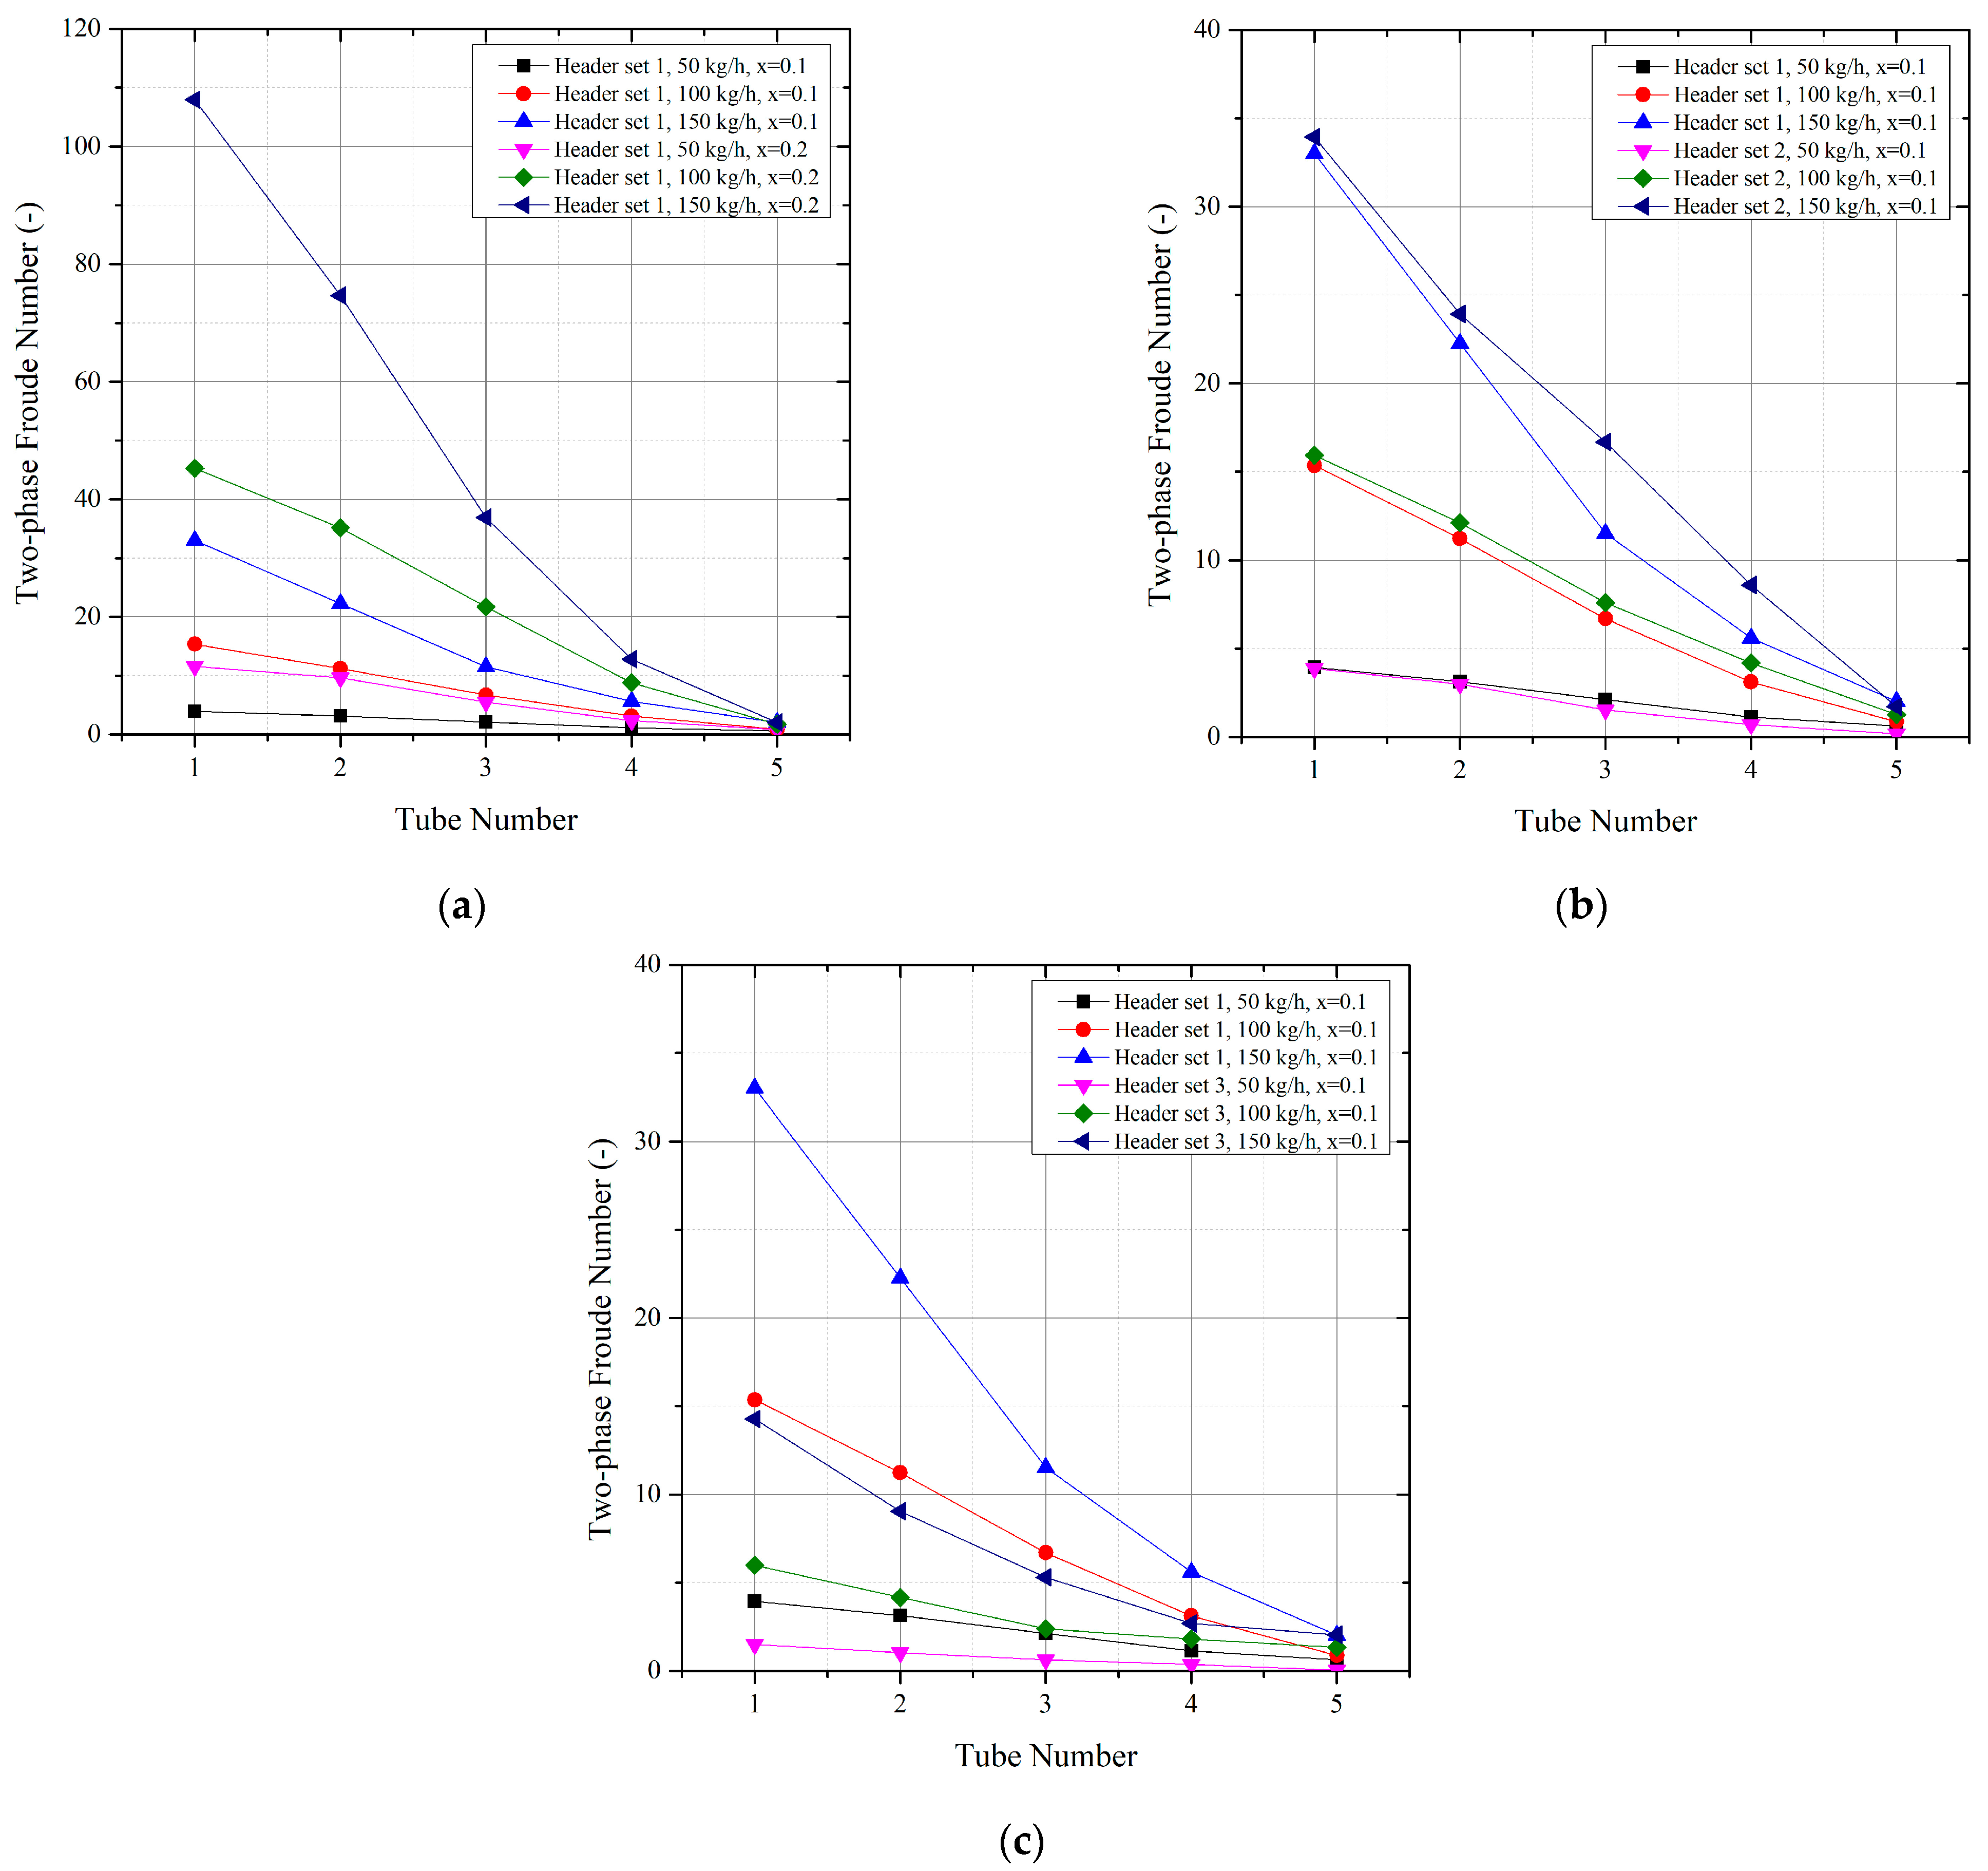
3.4.2. Froude Number
Figure 12a depicts the variation in Froude numbers inside the 190 mm vertical header according to the inlet vapor quality variation. For all the flow rates, the Froude number increases as the inlet quality increases. Similar to the trends of the Reynolds number, the inlet vapor quality leads to an increase in the inertial force of the entire two-phase mixture, and it shows an increasing Froude number. As a result, the increased inertial force compared to the height effect (gravity) increases the flow amount of the traversing liquid and vapor towards the top tubes.
Figure 12b shows the variation in the Froude number according to the large diameter in the upper tube section of the vertical header with a height of 190 mm. Regardless of the flow rate, the different outlet inner diameter set of the header (header set 2) leads to increased inertia compared to the case of the same outlet inner diameter (header set 1). That is, the Froude number is higher in the header set 2. Therefore, the liquid/vapor phase amount to the upper section (towards tube number 5) increases even with the same header inlet quality.
Figure 12c depicts the effect of the height variation on the Froude numbers inside the vertical header. As hypothesized, owing to an increase in the local gravity due to the individual height increment from the header inlet, the Froude number consequently decreases. Thus, the height adjustment can modulate the excessive liquid flow exiting at the top branch tubes in the 190 mm header observed in
Figure 4.
3.5. Flow Distribution Correlation
In this section, the flow distribution correlation that can predict the flow distribution in the vertical header is derived from measured experimental results. However, it should be noted that the flow distribution prediction described in this chapter is an empirical result of specific headers considered in this study. Hence, its application to vertical headers with different structures may exhibit limitations.
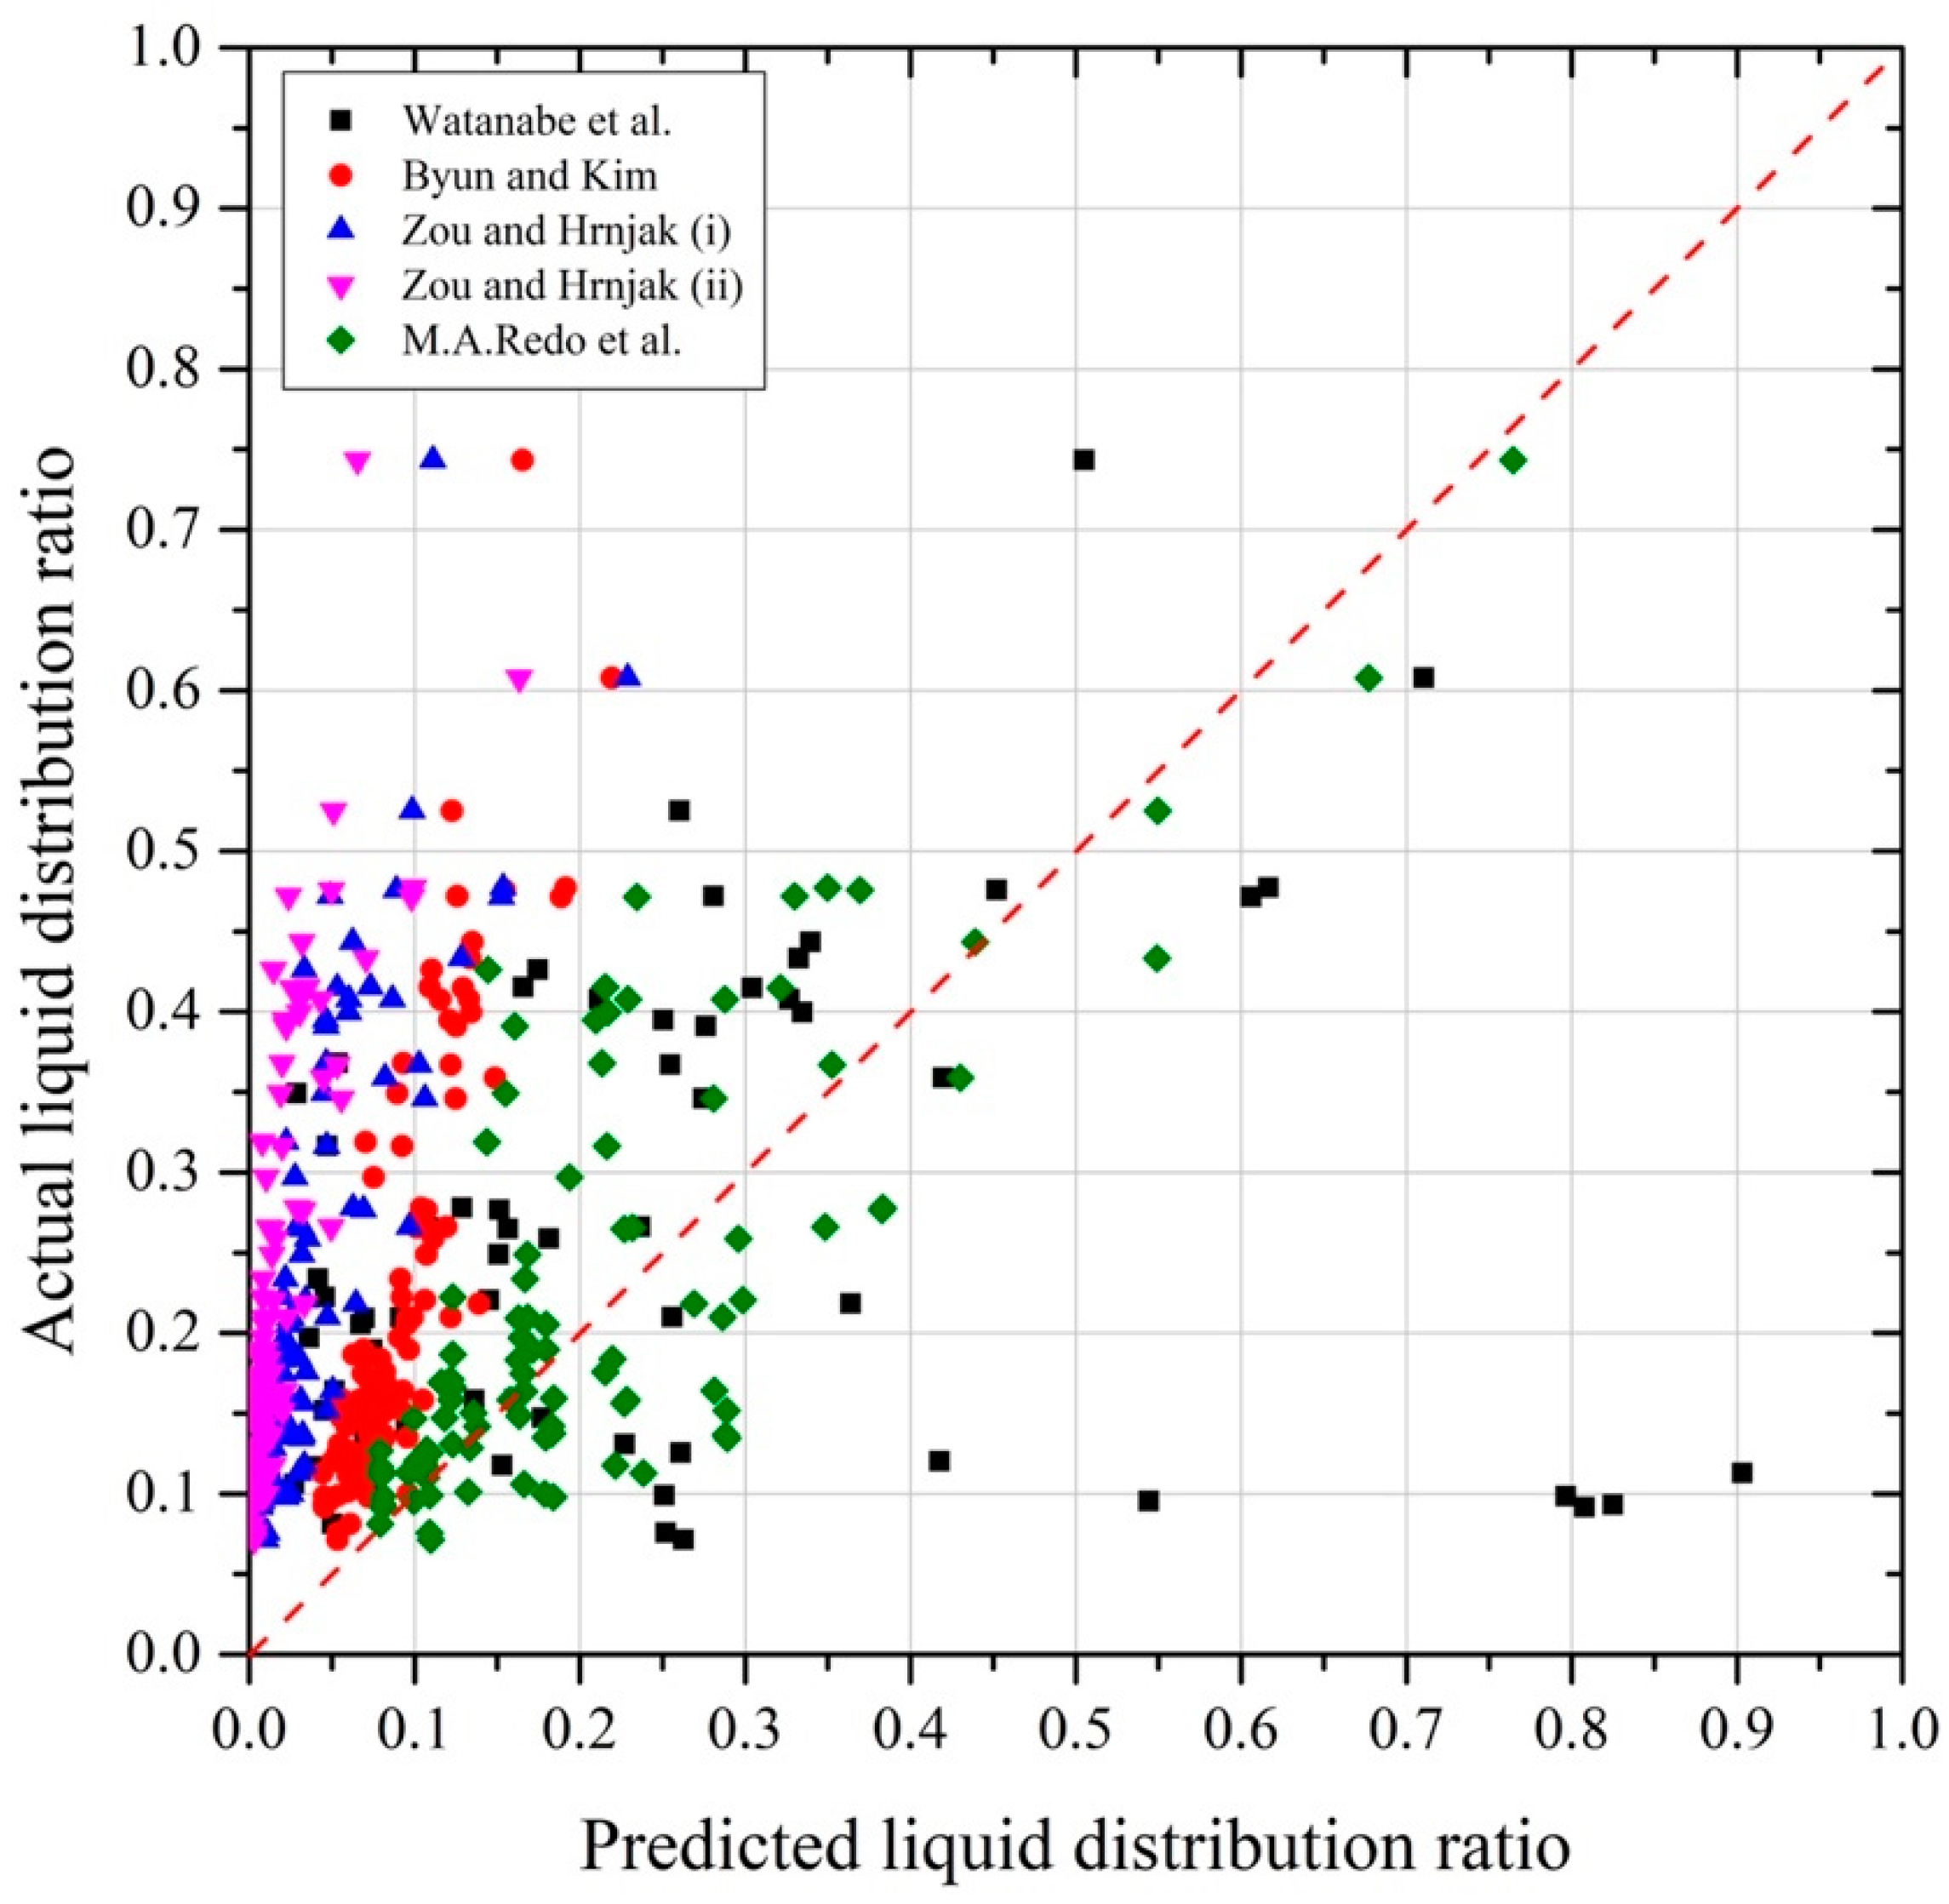
The flow distribution in the vertical header can be expressed and described using the Reynolds number, Froude number, dimensionless numbers of inertia, viscosity, and gravity, as previously shown. In particular, the prediction of the flow distribution of the liquid phase is of interest from the perspective of evaporator heat exchanger design to prevent dry-out in the branching tubes. Watanabe et al. [
31] introduced the liquid distribution ratio (
), which is the liquid taken off at the local tube to the liquid at the immediate header, and the distribution notation is shown in
Figure 7. Watanabe et al. [
31], Byun and Kim [
32], Zou and Hrnjak [
33,
34], and Redo et al. [
24] proposed various empirical correlations using the Reynolds or Froude numbers to predict the liquid distribution ratio.
Table 3 summarizes the conditions and empirical correlations suggested in the previous studies.
The above empirical correlations for the liquid distribution ratio are shown for the measurement results. All correlation equations are similar to the actual (experimental) liquid flow ratio in
Figure 13. Among them, the correlation equation of Redo et al. was found to be relatively consistent with the measurement results, while most correlation equations did not sufficiently predict the experimental results.
As described in the study of Redo et al. [
24], there are differences between the proposed correlations owing to the target experimental applications, which are related to the physical configurations of the header and the operating conditions. The present study has investigated the flow distribution considering the header height, header outlet inner diameter, inlet flow rate, and inlet vapor quality as parameters that differ from the previous studies. In particular, a mass flux of 908–2723 kg m
−2 s
−1 was considered, which is very high compared to the considerations of the existing studies [
24,
29,
30,
31,
32]. Therefore, it is necessary to establish a new empirical correlation that satisfies the corresponding conditions.
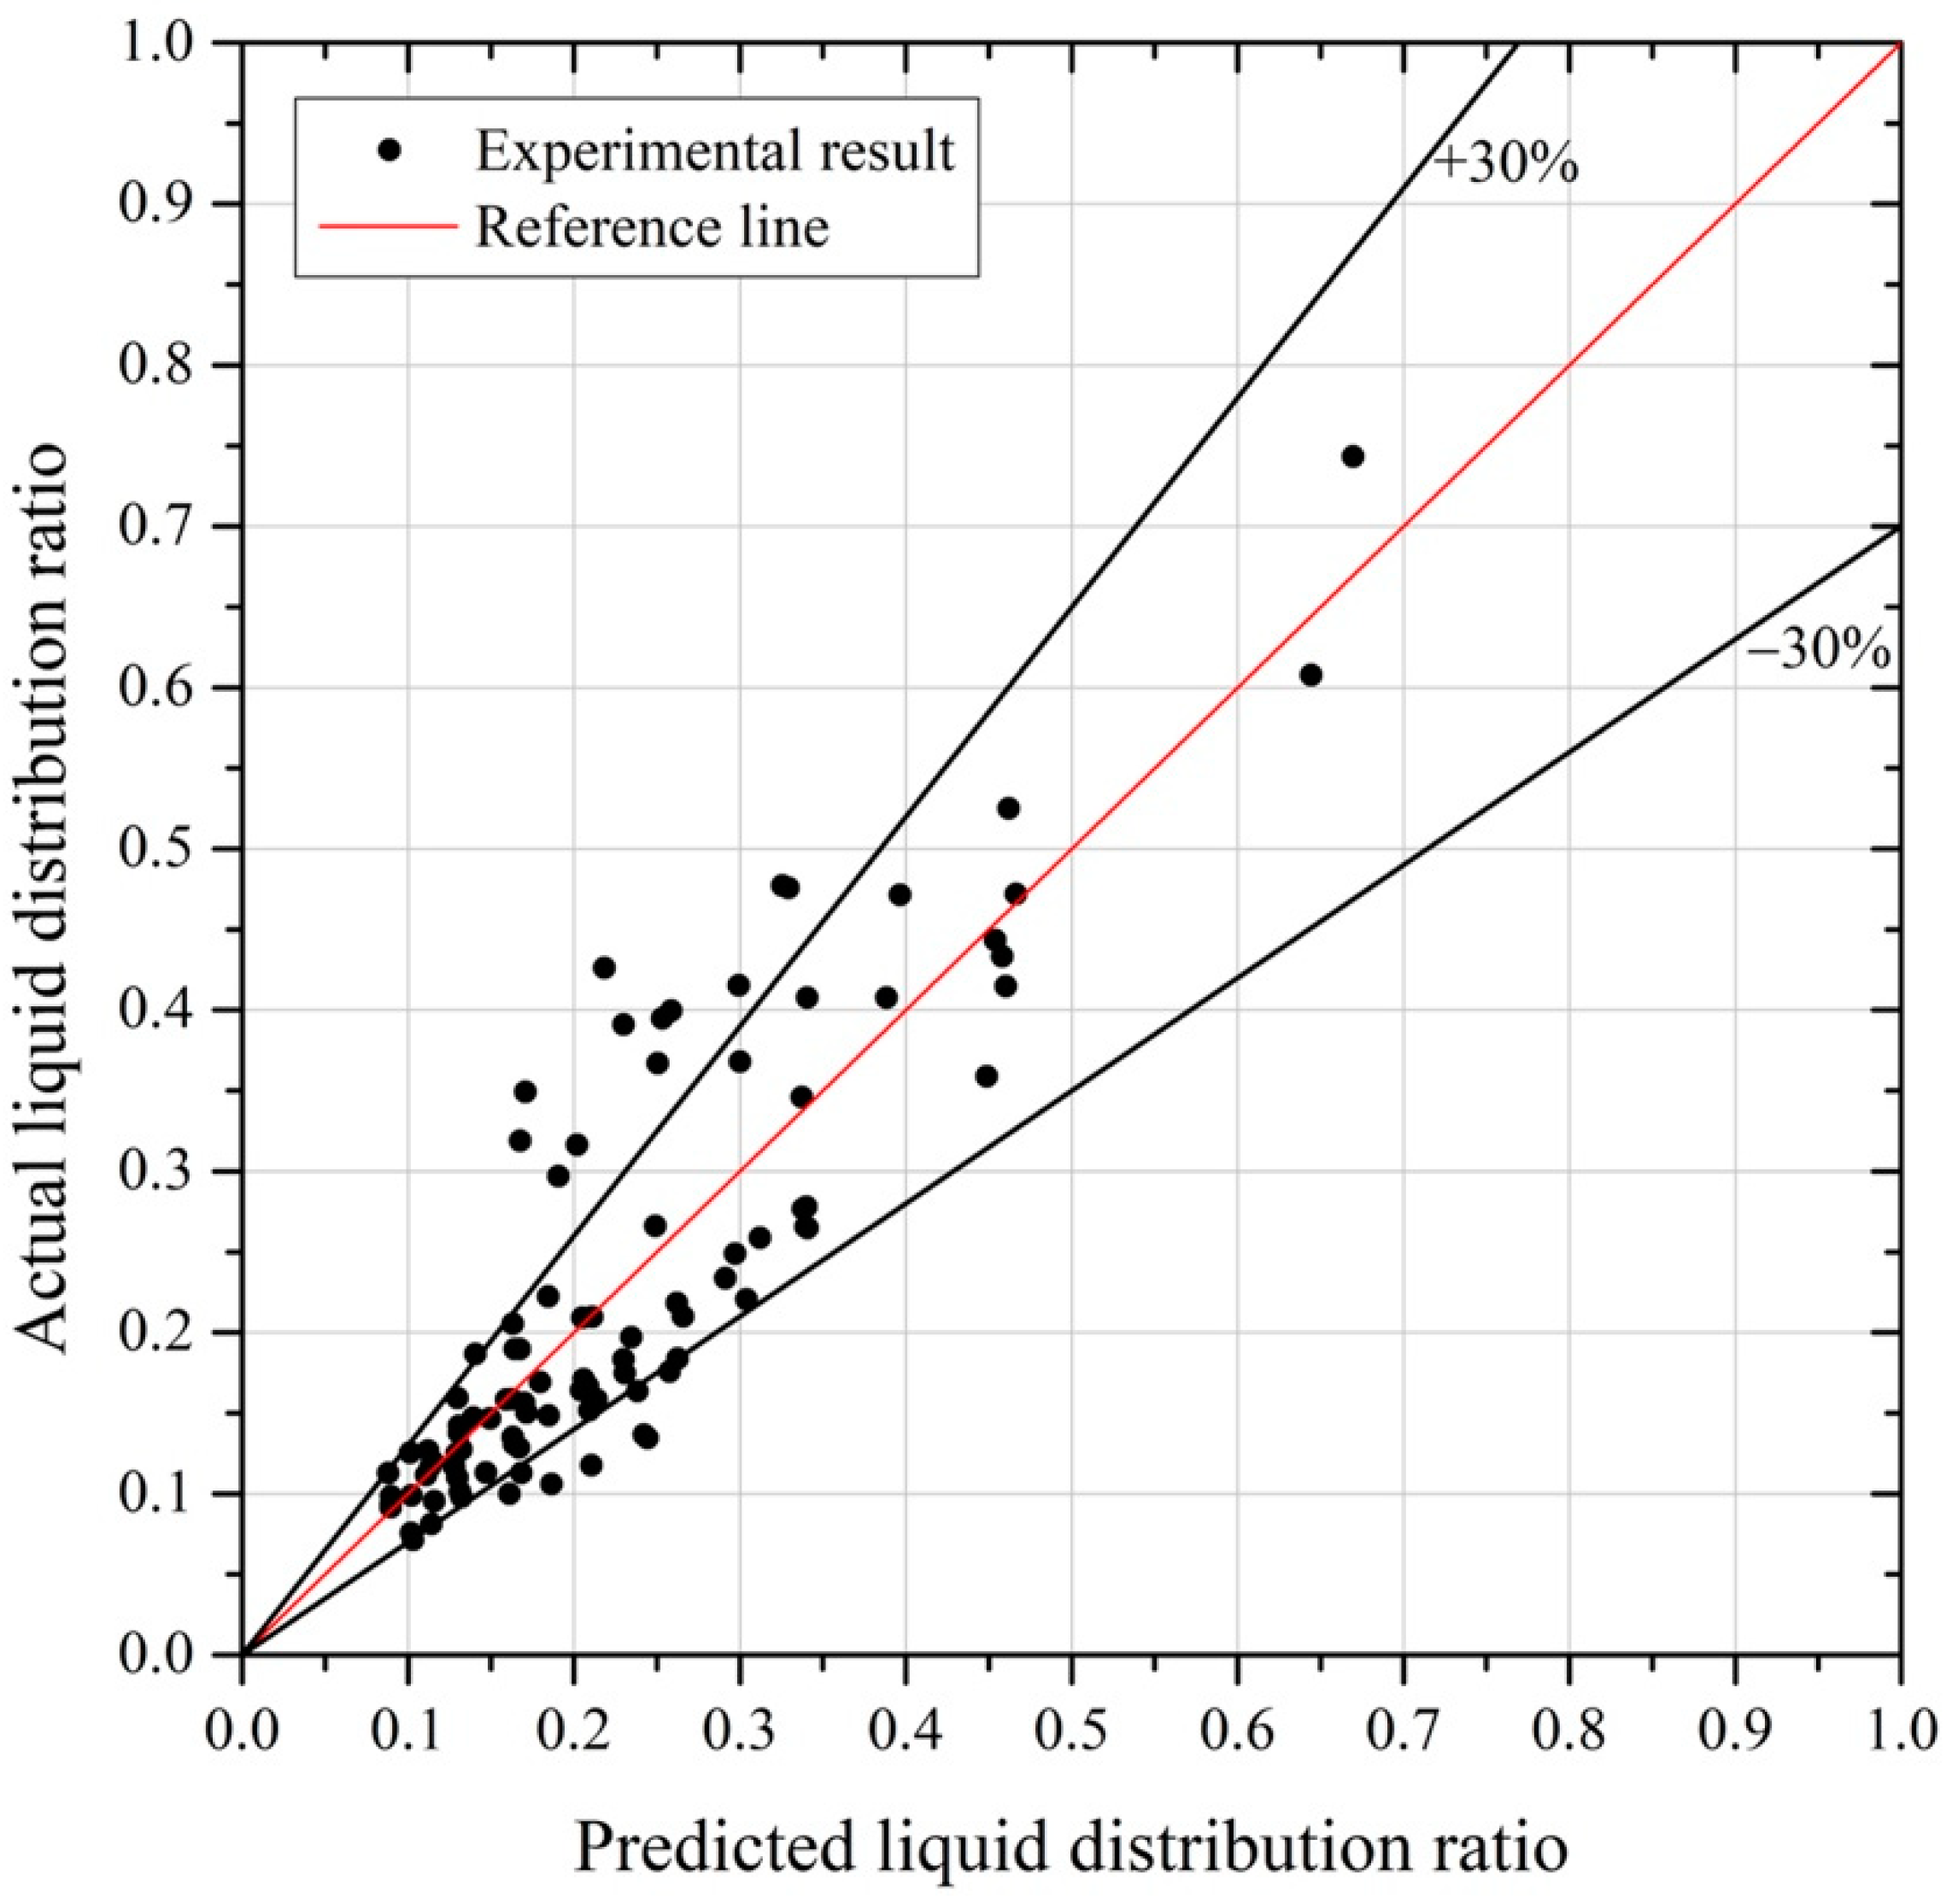
The inlet vapor quality (
), liquid-phase Reynolds number (
), and liquid-phase Froude number (
) were considered to investigate the effect of each parameter on the liquid distribution ratio in this study. Here, the Reynolds and Froude numbers of the liquid phase are expressed in Equations (11) and (12), respectively.
From this, a generalized expression is constructed as in Equation (13), and the coefficients in which the expression represents the maximum coefficient of determination (R-square) are
= 7.6 × 10
−6,
= −0.4,
= 0.89,
= −0.615.
The predicted versus actual liquid distribution ratio graph of the correlation proposed in this study is depicted in
Figure 14. The R-squared value was 0.76, predicted to be ±30% deviation in most ranges.
The proposed correlation provides a relatively accurate prediction of the two-phase flow distribution within the vertical header tested in this study. This can be applied to similar vertical headers for air-conditioning applications operating in a similar range of conditions. However, because this correlation is aimed at a practical case, there might be a limitation in applying it to a vertical header with a different structure from that of the headers being considered in this study.
4. Conclusions
This study aimed to investigate the flow distribution characteristics of a vertical header, which functions as an evaporator of a heat pump system with an R410A as the working fluid. The considered vertical headers with a reduced cross-sectional area have a high mass flux and are characterized by high Reynolds numbers compared to the previously reported vertical headers. The flow distribution was analyzed by considering the following parameters: vertical header height, branch pipe diameter, inlet flow rate, and inlet quality. Generally, it is recommended for a practical design that the average Froude number in the header be kept as small as possible, and the liquid Reynolds number at the inlet of the header be maintained as high as possible to avoid extreme flow maldistribution (dry-out). Specifically, the following conclusions are drawn:
The vertical headers considered in the study exhibit high Reynolds number, where the liquid flow is concentrated at the top and the vapor flow at the bottom sections. This characteristic causes the concentration of the liquid flow ratio to deteriorate in the upper section of the vertical header, and the concentration of the vapor flow ratio is moderated in the lower section. These trends were exhibited in most of the experimental conditions, particularly for the 190 mm header.
The flow distribution results were confirmed more intuitively using the relative standard deviation (RSD). The smaller the RSD value, the more uniform the flow distribution becomes. In the case of the liquid phase, the minimum value of RSD in the header set 4 (490 mm header, different outlet inner diameters) was 0.17. For the vapor phase, the header set 2 (190 mm header, different outlet inner diameters) had a minimum RSD value of 0.18.
The flow distribution characteristics of the vertical header were analyzed using Reynolds and Froude numbers, which are dimensionless numbers of inertia, viscosity, and gravity. To predict the liquid distribution ratio (), as the available correlations in the literature have compromised prediction accuracy, we proposed a new empirical correlation that considers the liquid-phase Reynolds and Froude numbers. The derived correlation could predict the liquid distribution ratio within ±30%.
The results of this study confirmed that the feasibility of the rational flow distribution could be derived according to the header’s physical configuration (cross-sectional area, height, outlet inner diameter) and operating conditions (flow rate, quality, and temperature). It is also expected that the flow distribution can be controlled by combining these parameters. However, the study of a vertical header, which was designed for practical cases, shows the limitations of the application and expansion of results. For this, a systematic establishment and analysis of the vertical header’s general design parameters and operating conditions are recommended. In addition, the rational flow distribution in the vertical header can be extended to consider its effect on the efficiency and capacity of vapor compression refrigeration systems in the future. For instance, an increase in the Reynolds number in the evaporator header causes a large pressure drop, which leads to a decrease in overall system performance. Such interrelationship across hydrodynamics, heat transfer, and thermodynamics will be carried out as a follow-up study.


 ,
, 


