Article

Operation of an Energy Storage System Integrated with a Photovoltaic System and an Industrial Customer under Different Real and Pseudo-Real Profiles

Department of Electrical Engineering, Wroclaw University of Science and Technology, 50-370 Wroclaw, Poland
*
Author to whom correspondence should be addressed.
Energies 2022, 15(21), 8308; https://doi.org/10.3390/en15218308
Submission received: 29 August 2022 / Revised: 20 October 2022 / Accepted: 28 October 2022 / Published: 7 November 2022

Abstract

:
This article presents an idea of the implementation of different real load profiles for energy storage system (ESS) operation. The considered approaches are based on real long-term measurements using energy meters, the adaptation of the standard profiles defined by the distribution system operator (DSO), as well as a mix of the level of contracted power and short-term measurements. All combinations are used as electricity demand to formulate an ESS operation plan that cooperates with the PV system and the electricity market. The GAMS solver is applied to obtain optimal operation tasks of the ESS to cover different real and pseudo-real load profiles of an industrial company. Obtained results are presented using a real case study of a metallurgy company with a 317 kWp photovoltaic installation and a 200 kW ESS.

1. Introduction

The increase in energy costs and the need to decarbonize the energy market prompt the search for functional and organizational alternatives and mechanisms [1,2]. Desirable solutions include the promotion of greater activation and participation of energy recipients as part of new prosumer models and autonomous civic energy communities [3], including in particular households in multifamily buildings, entrepreneurs from the small and medium enterprises (SME) sector, and local governments, and their joint participation in planning local renewable energy sources, energy storage, and infrastructure networks [4].
It is also important to increase the role of electricity storage [5], as well as gas, heat, and cold [6], for optimal use of surplus energy from renewable energy sources (RESs) that consumes the dynamic increase in installed capacity in this sector and to improve the stability of energy networks [7]. In the last decade, there has been great interest among consumers (both individual and industrial) in the use of energy storage systems for cooperation with the power grid. Their purpose is not only to reduce the cost of energy consumption, but also from the point of view of industrial customers, to ensure the security of production continuity by protecting the operation of sensitive equipment against the lack of energy supply during technological processes [8]. The importance of energy storage systems (ESSs) is also demonstrated by the interest of the scientific world [9]. Scientific works are focused on areas such as the technology of ESS implementation, issues related to planning and optimization of system operation with different load profiles, and consequently proposals of optimization tools application, as well as issues of its operation with the power system and renewable energy sources [10,11].
The application of an ESS to microgrid (MG) issues with a comprehensive review was presented in Ref. [12]. The article considers control approaches, challenges, solutions, applications, and overall management prospects. The author pointed out that MG integration may assure some benefits. There is a need for this to face many challenges and issues in its control and management, which can be effectively dealt with by incorporating ESS technologies into MGs (the block diagram representation of various applications of an ESS and the energy management system (EMS) strategies for the MG application are presented). From an economic point of view, future trends and real-time applications are also clarified, greatly contributing to the development of a cost-effective and robust longer-life ESS architecture for renewable MG applications [13].
An important aspect in deciding whether to use an ESS is meeting the economic expectations for the industrial investor. Costs are closely related to the chosen ESS technology. In Ref. [14], the authors provide a comprehensive overview of ESS technologies and consider how to accelerate the introduction of an ESS into power systems by reviewing and discussing the technical and economic requirements for an ESS.
This paper discusses, as a case study of energy storage, using batteries for energy storage. Battery energy storage systems (BESSs) currently seem to be recommendable for use in an ESS system for an industrial partner. It is crucial to integrate them with the local distribution grid. In Ref. [15], the authors propose a comprehensive view of battery energy storage system (BESS) integration in AC distribution grids. The authors pointed out that the BESSs are promising solutions to mitigate the impact of the new loads and RESs [16].
The considerations presented above on the proper and effective cooperation of an ESS with the power system are united by one main denominator: the use of appropriate load profiles, which depend on the actual variable nature of operation of the industrial consumer’s equipment. This paper discusses the performance of an integrated ESS with a PV system and an industrial consumer. The novelty is that the paper presents the concept of implementing different real load profiles into the operation of an energy storage system (ESS). It must be noted that considered approaches are based on real long-term measurements using energy meters. Cases for real and pseudo-real load profiles are discussed.

1.1. Literature State of the Art

The use of RESs due to randomness and intermittence generation usually leads to excessive system size. This phenomenon causes the increase in the system capital cost. [17] Therefore, hybrid renewable energy systems (HRESs), systems that consist of an RES and ESS together, have been proposed to address these problems. It is essential to optimize the operation of an HRES to utilize an RES in technical as well as economic aspects. Several types of research related to microgrid control have been conducted in the past years, where the short-term load forecasting (STLF) plays an increasing role. Accurate forecasting of the electrical load has become the top management objective, but the electrical load often presents nonlinear data patterns. The effective forecasting of forthcoming electricity demand is hard due to the complex effects of various factors. Thus, a rigid forecasting approach with strong capabilities for general nonlinear mapping is necessary.
A large group of short-term load forecasting methods use artificial neural networks (ANN) associated with deep learning techniques (DL). The paper [18] proposed the use of a long-term memory-based recurrent neural network (LSTM) for short-term load forecasting for individual households. It is one of the latest and popular deep learning techniques. This is a basic load forecasting approach. The proposed ANN structure was tested on residential smart meter data, and its performance was compared with various methods including state-of-the-art load forecasting. The results showed that the proposed LSTM approach outperforms other algorithms mentioned in the paper. The authors in [19] suggested a deep convolutional neural network based on residual neural network (ResNet) to forecast the building load one hour in advance. Additionally, a branch was designed to integrate the hourly temperature with the forecasting branch. To enhance the learning ability of the HRES model, an innovative feature fusion was presented. Finally, studies on point forecasting, probabilistic forecasting, fusion method, and computational performance were conducted. The results showed that the proposed model has high performance, which reflects a promising prospect in the application. The work performed in [20] studied the temporary behavior of a series over a period of a month of electricity demand in Spain, achieved by subtracting the trend from the series of consumption. A new hybrid solution was suggested that considers the periodic behavior to be predicted by means of a Fourier series, while the trend was predicted by means of a neural network. Satisfactory results were obtained, which improved those obtained when only neural networks or autoregressive integrated moving average (ARIMA) were used for the same purpose. The new method for daily load forecasting based on wavelet neural network was presented in the paper [21]. The method is based on selecting a typical daily load as the input load. Based on correlation and using wavelet decomposition and separate neural networks, the load characteristics for low-frequency and high-frequency components were selected. The high-frequency components were well predicted by considering weather conditions and the high-frequency component of the typical daily load as input data. The test results showed that this method makes accurate predictions. An interesting approach shown in [22] is the prediction of short-term residential loads using a graph-based neural network. This method used not only historical load data, but also implicit spatial dependencies of neighboring houses. By introducing similar energy consumption patterns due to common weather and social conditions, machine-learning-based forecasting methods can significantly improve the forecasting accuracy compared to basic models. The short-term load forecasting method with the empirical-mode decomposition algorithm (EMD) was proposed in [23]. The load was decomposed into frequency components varying from the low to high levels. The periodic low-frequency components were predicted by the multivariable linear regression method (MLR), while the high-frequency components were forecasted by the LSTM neural network algorithms. The load behavior was obtained by combining two methods. The proposed method was validated by experiments. The prediction of the load behavior was accurate globally along with the local details, which verified the effectiveness of the presented method.
Algorithms using support vector regression (SVR) and optimization methods such as artificial neural network (ANN), genetic algorithm (GA), or particle swarm optimization (PSO) are a separate group. The hybrid method based on the support vector regression considering meteorological factors and the price of electricity was indicated in [24]. The data used in this paper were combinations of values of individual characteristic parameters affecting electricity load, which are analyzed in hour resolution. Then, SVR was applied to analyze and develop the load forecasting model. Finally, the improved adaptive genetic algorithm was used for optimizing the combination of the ratio values of each characteristic parameter. Experimental results showed that the proposed method can obtain better prediction performance compared with other standard and state-of-the-art methods. The purpose of the paper [25] was to consider an SVR model with an immune algorithm (IA), named SVRIA, for electrical load prediction. IA was used for determination of the parameters of the SVR model. Empirical results showed that the SVRIA model gives better forecasting results than the other methods, namely support vector machine with genetic algorithm (SVMG), regression model, and ANN model. Electricity demand forecasting was indicated as a useful tool for network maintenance planning and market research of power companies. The approaches took into account weather and economic variables that significantly affect electricity demand. Economic variables usually affect the overall trend of the series, while weather provides periodic behavior due to its seasonal nature. The paper [26] proposed a new approach for accurate STLF utilizing a support vector regression (SVR) and optimization method. The SVR model was trained by the load data. For better performance of the model, a two-step optimization algorithm was proposed to determine the best parameters. In the first step, a designed grid traverse algorithm (GTA) was used to narrow the parameter searching area from a global to local space. In the second step, PSO was used to determine the best parameters. The performance of the proposed approach is compared to some classic methods of that paper. The work [27] presented a basic strategy for STLF based on the SVR. Two important improvements to the proposed SVR model were introduced: procedures for the generation of SVR model inputs and model input selection using feature selection algorithms. One of the objectives of the proposed strategy is to reduce the operator interaction in the model-building process. The proposed use of feature selection algorithms for automatic model input selection and the use of the PSO-based technique for the optimization of SVR parameters were proposed. To confirm the effectiveness of the proposed method, the model was trained and tested on well-known load forecasting data sets and compared to the state-of-the-art STLF. The article [28] presented a solution for forecasting the demand for electric energy in a month period. The solution was based on a support vector machine. The SVM approximated the association between historical and forthcoming demand patterns. It also considered energy demand time-series exhibit instability, as well as seasonal fluctuation cycles, long-term trends, and random noise. To make the forecasting problem simpler, the demand time-series in the one-month period were represented by annual cycle patterns that unify data and remove trends. The coding variables were determined using historical or forecast data using ARIMA statistical methods and exponential smoothing. In comparison to the other models the obtained outcomes assured the high performance and competitiveness of the considered model.
Very effective methods for short-term load prediction were deep learning techniques using historical measurement data and other conditions that affect the correctness and accuracy of the prediction. The work of [29] aimed to show recent breakthroughs in deep learning, while using the structure of the problem to develop effective prediction tools. The proposed method provided information about intervals and prediction density, but here it is extended to include the goal of generating prediction scenarios. The effectiveness of the proposed methodology was highlighted and compared with several other architectures in terms of statistical results and impact on the quality of decisions optimized in a dedicated stochastic optimization tool for an electricity retailer participating in short-term electricity markets. The paper [30] showed a new holographic ensemble forecasting method (HEFM). It used mutual information and a statistical model to select characteristic variables. It generated training data using bootstrap functions. A model was constructed using various artificial intelligence and machine learning algorithms. The method used the original load forecast features, which were the result of multiple heterogeneous models trained in the initial learning process, and actual load measurements from the last period before each forecast. This paper compared the results with state-of-the-art forecasting methods. In the article [31], the Bayesian deep learning technique was used to solve demand forecasting problems. Specifically, a novel multi-objective framework based on deep Bayesian learning was proposed to quantify common uncertainties between customer groups considering their differences. Furthermore, a clustering-based data fusion method was prepared to increase the diversity and volume of data. This not only solves the problem of excessive data volume but also improves predictive performance. Presented numerical results showed that the proposed method provides higher probabilistic prediction accuracy than conventional methods. The paper [32] proposed a short-term individual housing load forecasting method based on a combination of deep learning and k-means clustering, which was able to effectively extract load similarity and accurately forecast housing load at the individual level. It first makes full application of the k-means clustering to extract the similarity between housing loads, and then applies deep learning to extract the complex patterns of housing loads. The presented method was tested and validated on a real load data set, and experimental results suggest that it can achieve significantly higher prediction accuracy compared to published other methods.
The remaining group of methods are algorithms that use various statistical models for short-term load forecasting in distribution networks. Their effectiveness was confirmed in publications. The paper [33] proposed a novel and easy-to-implement approach for combining probabilistic load forecasts to improve the performance of the forecasting. The combination problem was defined as the optimization problem. It was conducted by searching the weights of each individual method. Under the assumption of Gaussian distribution for density forecasts, this problem was transformed into a linearly constrained quadratic programming problem. Density forecasts may provide additional information considering the uncertainty that can be expressed by quantiles and intervals. Case studies on the electrical load data set of lot of localizations verify the effectiveness of the proposed method. In the paper [34], a new functional time-series methodology for short-term load forecasting was introduced. The prediction was performed using weighted average of historical daily load segments, the shape of which was similar to the expected shape of the load segment to be predicted. The past load segments were identified from the available history of the observed load segments by means of their closeness to the reference segment. The better segment is selected in a manner that captures the expected qualitative and quantitative characteristics of the load segment to be predicted. As an illustration, the suggested functional time-series forecasting methodology was applied to historical daily load data. Its performance was compared with some recently proposed alternative methodologies for STLF.
As shown in selected publications in this section, describing the current state of research of short-term load prediction is mainly for a period of one day and is usually generated with a resolution of one hour. Most of the proposed methods use measured historical load data and more or less complicated mathematical algorithms. However, there is a lack of methods that estimate the efficiency of a microgrid for which measurements are not yet available, for example at the stage of grid design and dimensioning of its components such as PVs and an ESS.

1.2. Motivation, Contribution, and Organization of the Article

With the increasing number of PVs for industry applications, the number of storage applications is also increasing to meet local demands. In the majority of cases, the planning of the ESS is based on the financial investment possibilities of the companies. Thus, in many cases, there is a need to define only the correct operation for the ESS system of the companies with the PV system. However, the basic issue in operation is to ensure the real energy demands that should be covered. In the major cases, only one-month consumption is given by the energy metering system. Thus, there is a need to define additional, as close as possible to real profiles for the companies, especially in the long-term horizon, which considers both day-horizon (hours resolution) as well as session changes (months horizon).
In this article the defining long-term load profile in the case of a lack of real measurements is discussed. The applied methods are based on energy consumption level based on electric bills, standard profile, and short-term (1 week) measurements. Additionally, for the investigated company the real load profiles are available. Thus, the comparison for one-year data was possible. Then, the operation for a microgrid consisting of grid, a 317 kW PV system, and a 200 kW ESS to cover previously defined load profiles in a one-year period is presented and compared. To summarize the main contribution of the paper, it proposes different ways to obtain “as real as possible” load profiles to assure optimal operation of the ESS, in case of a lack of real profiles of which planning issues were solved before. It is worth noting that the novel approach enables to define a satisfactory long-term profile using only short-term measurements and freely accessible data, without the costly and time-consuming actions.
Section 2 introduces the methodology to define differently the load profiles of the industrial customer and ESS operations. Section 3 contains the description of the investigated company and energy cost in Poland. Section 4 presents the results of defining different profiles and the operation of an ESS under them. Section 5 concludes the paper.
2. Methods for Defining Load Profiles and ESS Operation

2.1. Introduction to Load Profile Definition

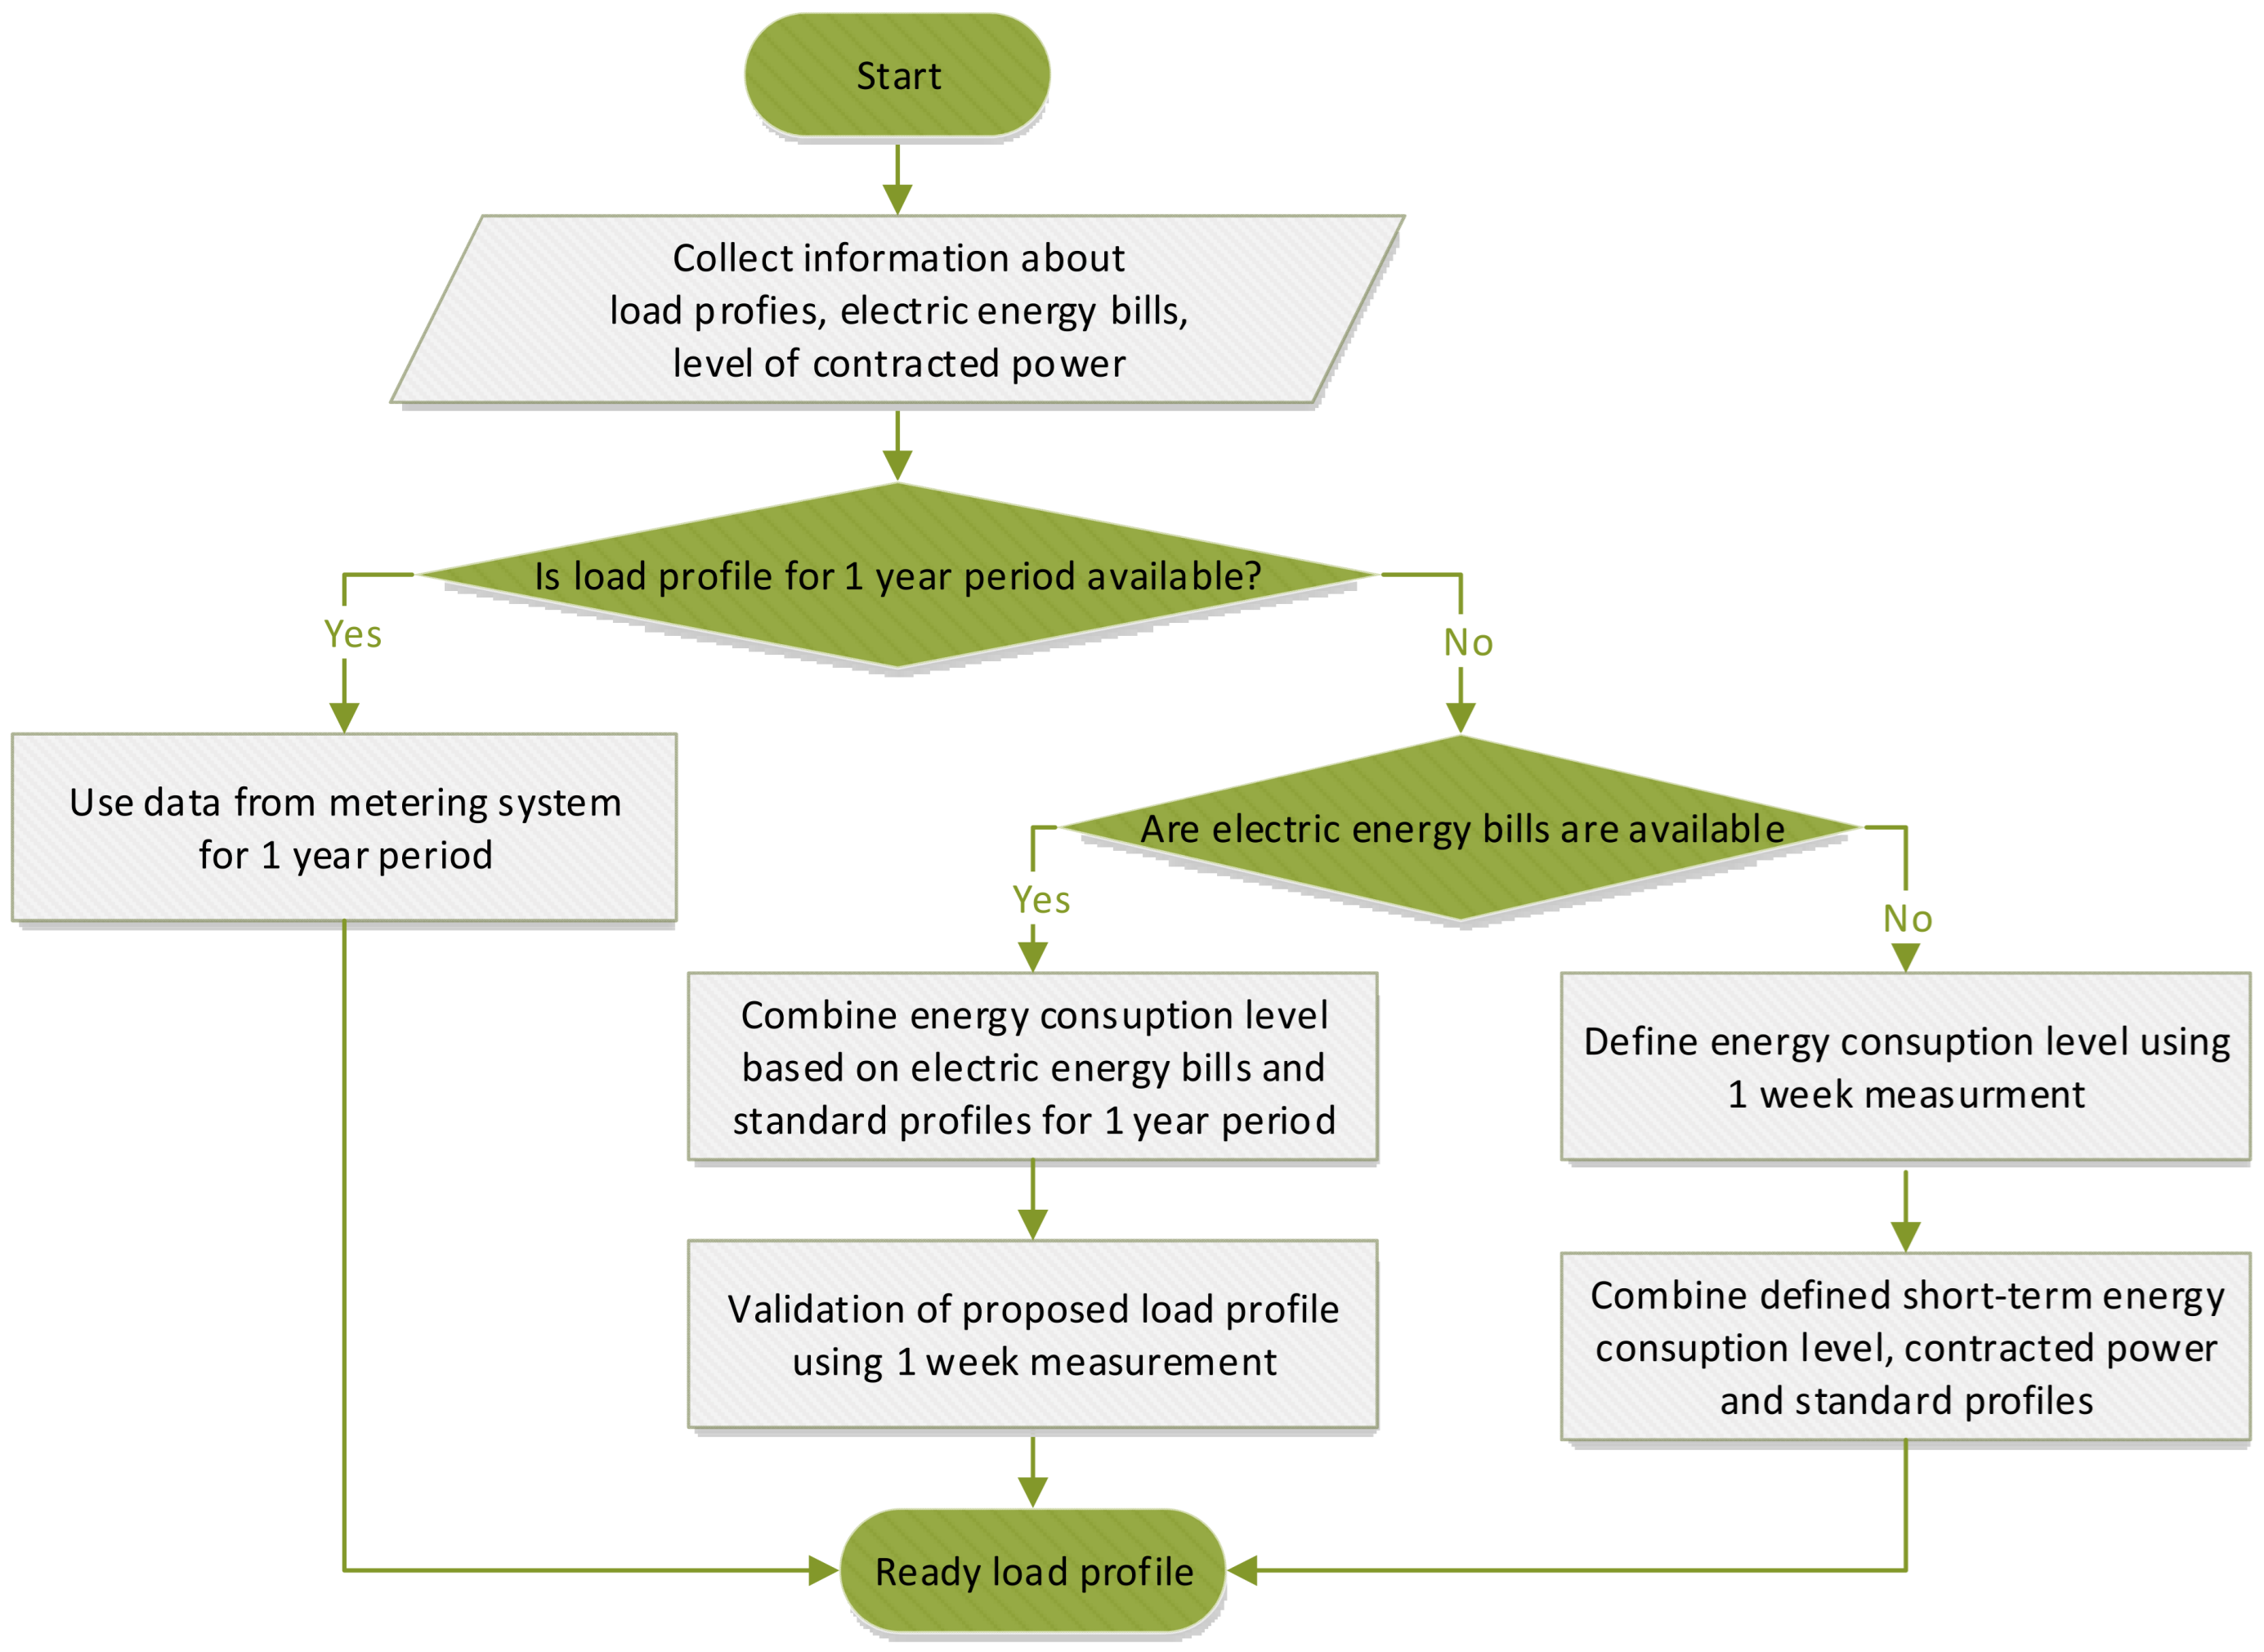
In this section, the approach to defining the long-term (1 year) load profile is proposed. The concept of this is presented in Figure 1.
In the easiest case, if the data from metering system are available the only problem is to choose the 1-year period (examples of the profile are presented in Section 4.1.1).
However, in the case when that profile is not available, additional actions are required. One of the solutions is to use the energy bills given by the DSO to define the level of consumed energy in each month. The second approach uses the information which is the combination of standard profiles that are defined by the distribution network operator and maintenance manual. The standard profiles are proposed by the distribution company and updated each year. The standard profiles are defined for different consumer types and given in 1 h resolution for different months (1-month resolution) and day type (working day, Saturday, Sunday, and holiday). Finally, to validate the changes in consumption of energy, the one-week measurements are performed to check the scale of changes and update the standard profiles (an example of such approach is presented in Section 4.1.2). The last approach is when energy bills are not available. Then, the procedure for defining the profile is to perform control measurements in a one-week period. Then, the mean value of the consumption is summed for working days, Saturdays, and Sundays (or holidays), separately. Then, based on the standard profiles that are addressed to working days and free days as well as to different season of the year the assumed consumption ratio is defined for each kind of day for the adequate month. Based on this, the profile for one month is defined. Then, another monthly consumption profile is defined using energy consumption level based on measurement multiplied by the ratio of contracted power in the measurement month and the month in which the profile is defined. The case of load profile definition in such an approach is presented in Section 4.1.3.

2.2. Introduction to Operation Issues of ESS

The economic model is based on minimizing the total operation cost within a year. This paper only investigates the operation of an ESS, and it does not discuss the planning aspects. The total cost is defined with respect to the cost of procuring electricity minus the revenue from selling electricity to the grid. The total cost includes the operation cost of the EES in Equation (1), where it should be minimized. Equation (2) indicates the operation cost which includes both buying (cost) and selling (revenue) electricity to the grid as well as the degradation cost, which arises from charging and discharging of the battery. It should be noted that the gradation cost is disregarded in this study for the sake of simplicity. Equation (3) shows the electrical balancing. It means that the demands should be supplied by PVs, the grid, and discharging the ESS. Equation (4) declares that the purchased electricity from the grid can be stored in the ESS or transferred to the output to supply the load. The purchased electricity from the grid is bounded in (5). Similarly, the PV generation can be stored in the ESS or transferred to the output based on (6). The PV generation is bounded in (7) with respect to its maximum generation. The ESS is discharged to supply the load or to sell to the grid in (8). The ESS is charged by the grid and PVs in (9). The energy balance in the ESS is obtained in (10). This means that the amount of state of charge at each hour is equal to the state of charge in the previous hour plus amount of charging, subtracting the discharging. Equation (11) bounds the state of charge. Equation (12) indicates the minimum state of charge of the ESS. The charging and discharging of ESS are restricted by (13) and (14). Equations (15)–(17) ensure that the ESS is either charged or discharged at the same time. Among the aforementioned equations, Equations (10)–(17) represent the ESS model, while the degradation cost is given in (2). The particular variables used in the equations are defined in section Nomenclature. As it can be seen from (8), the selling to the grid is conducted by discharging the ESS, which can result in reducing the total cost. In addition, the discharging can be conducted in order to supply the demands in (3), which means less electricity procurement from the grid in (4). However, these actions will result in reducing the cost if the ESS charges and discharges respecting the off-peak and peak hours.
min   T C = min   O C
O C = t = 1 8760 ( P g t b P g t s ) λ t g + λ d e g ( E t d c h + E t c h )
E L t = E t d c h , L + P t P V , L + P t g , L
P g t b = P t g , L + P t g , E S S
P g t b D e m a n d C a p
P V t = P t P V , L + P t P V , E S S
P V t P V t g e n
E t d c h = E t d c h , L + P g t s
E t c h = P t P V , E S S + P t g , E S S
S O C t = S O C t 1 + η c h E t c h ( 1 / η d c h ) E t d c h
S O C t E S S m a x
S O C t C h m i n · E S S m a x
E t d c h k · E S S m a x
E t c h k · E S S m a x
E t d c h M · I t c h
E t c h M · I t d c h
I t d c h + I t c h 1

3. Description of the Object

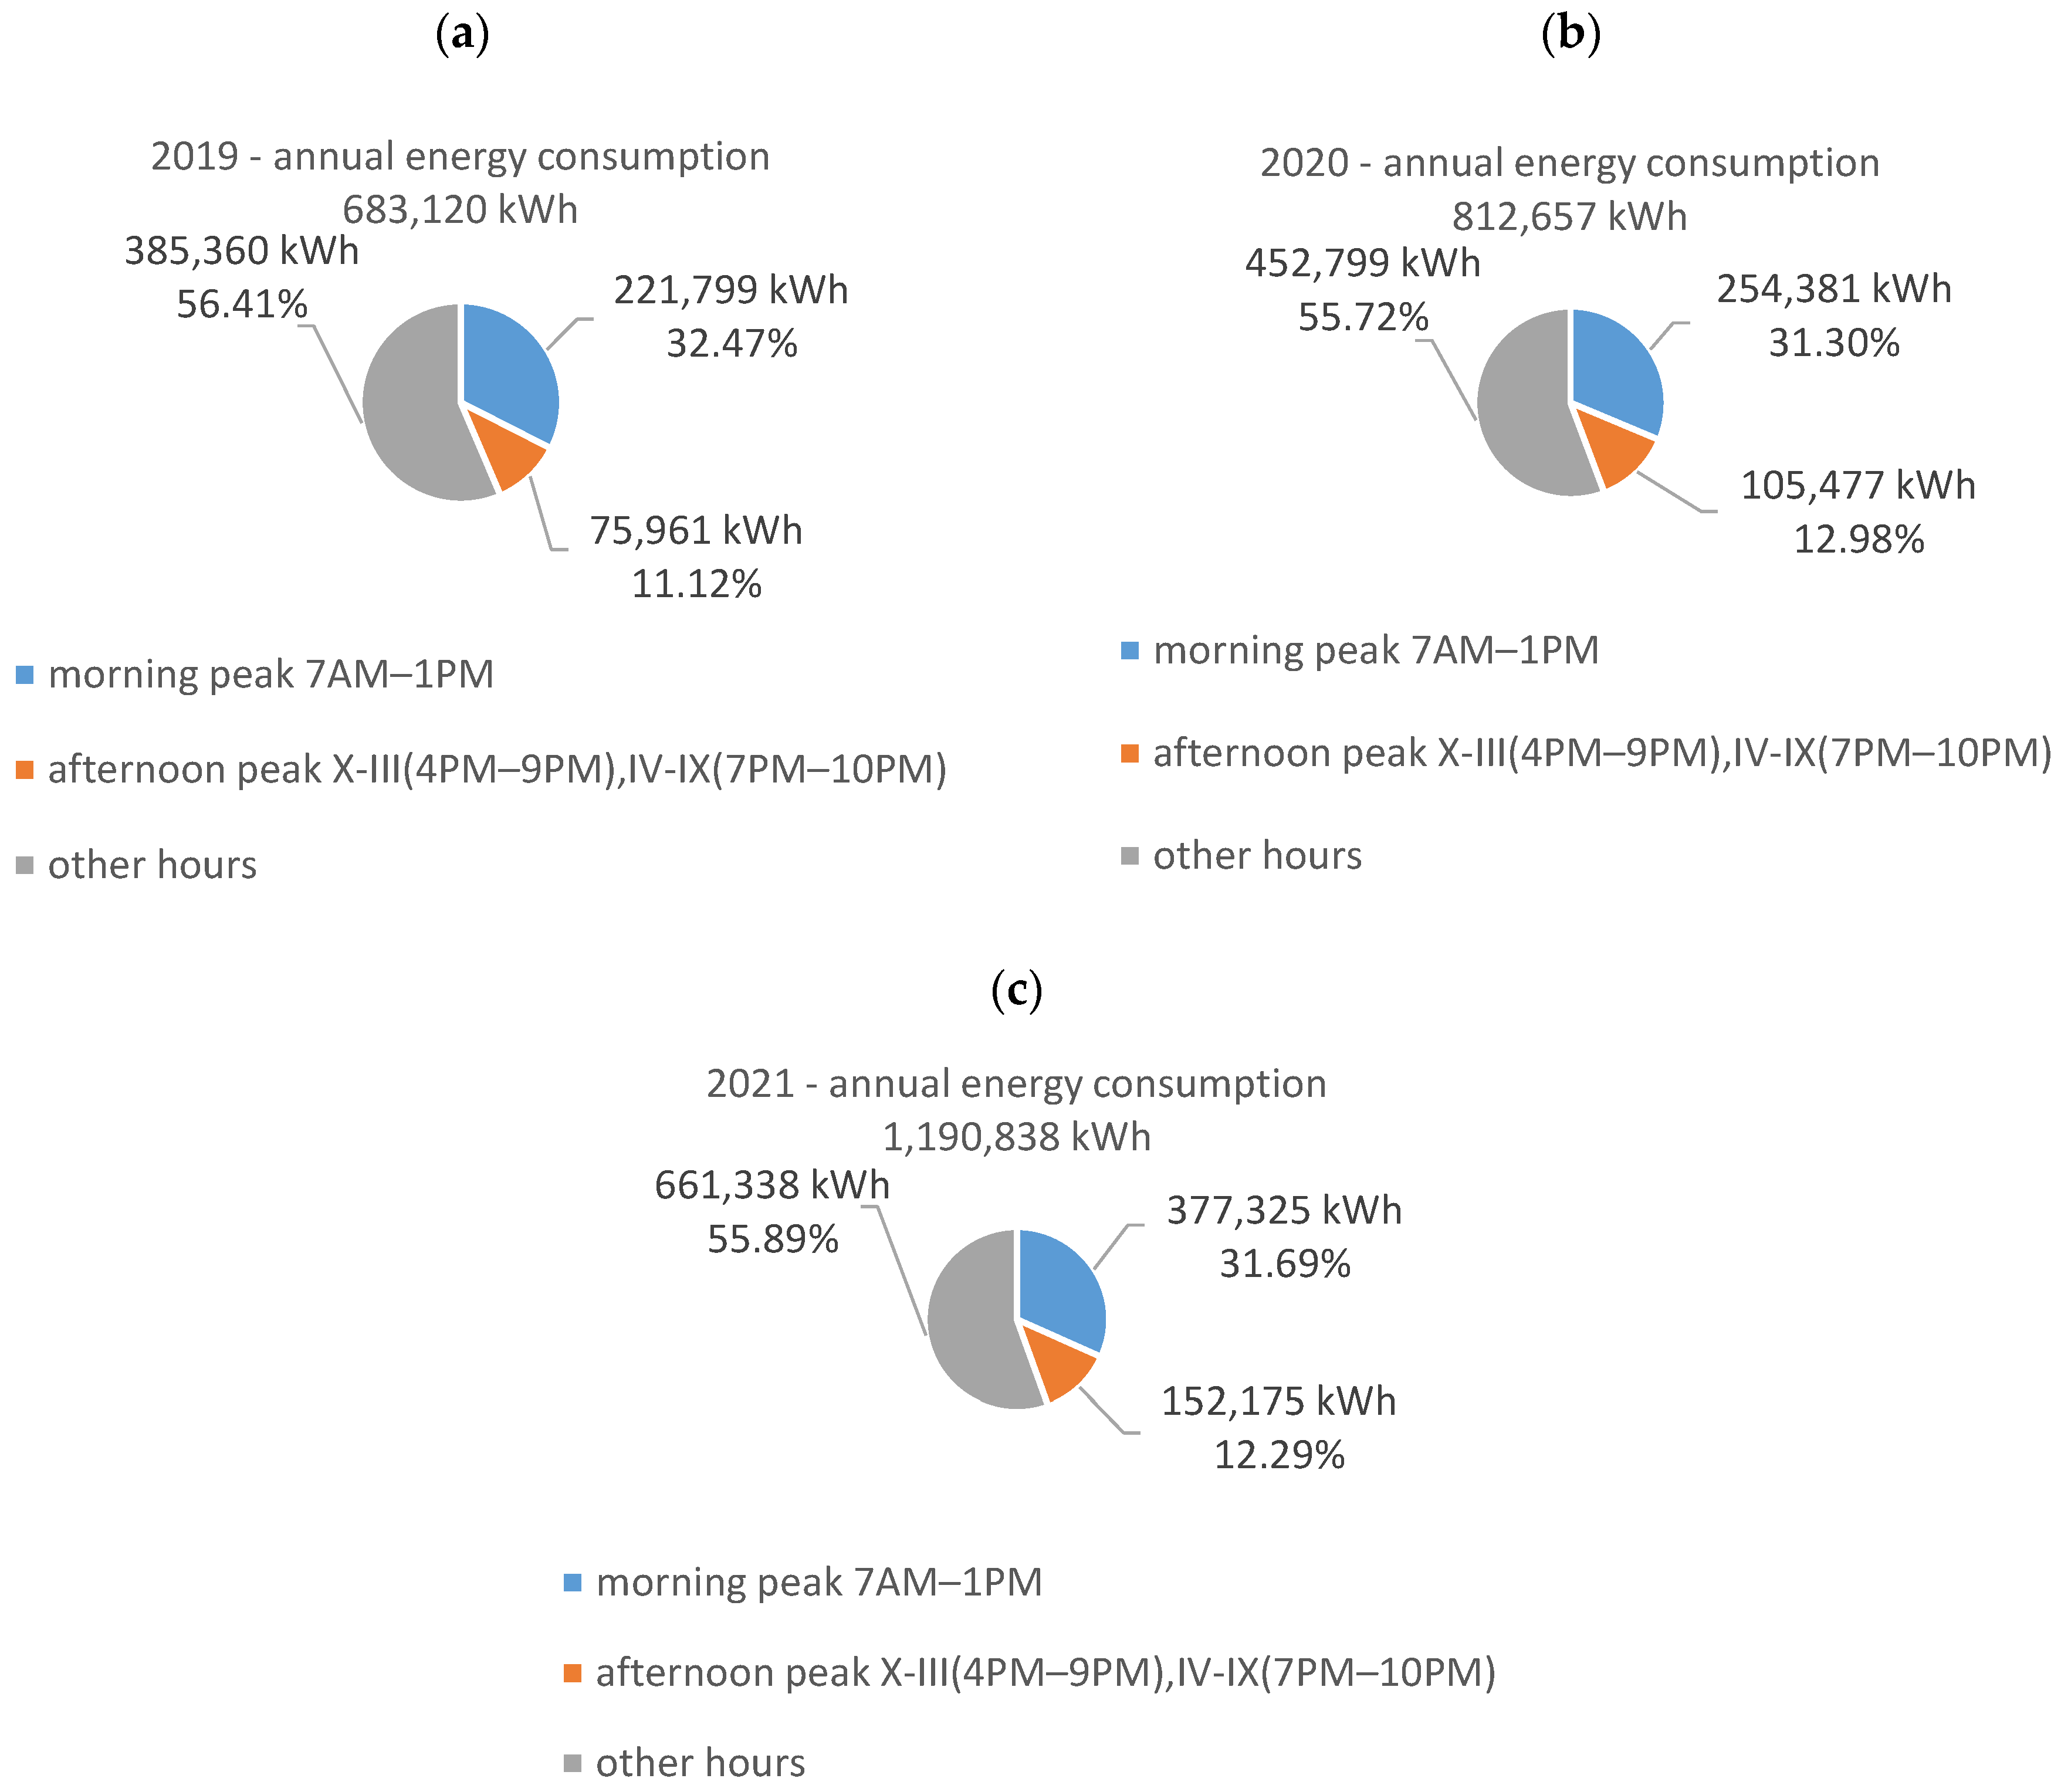
The investigation is carried out on basis of a metallurgy company that is located in Poland, in Białystok (Podlasie Voivodeship). The specialization of the company is the production of steel car accessories made of high-grade stainless steel and metal laser processing. The contracted power is 510 kW in the winter months from December to April and 330 kW in the rest of the year from May to November. The manufacturing is supplied from a 20 kV distribution network. The energy price is associated with the chosen energy tariff, which constitutes time zones for the morning and afternoon power demand peak. Annual energy consumption of the factory has been permanently increasing in recent years from 0.531 MWh in 2018 to 1.190 MWh in 2021 per year. The specification of the production is exhibited in the contribution of the energy consumption in particular daily time zones, as follows: morning peak (7 a.m.–1 p.m.)—around 31%, afternoon peak (from 1st October to the 31st of March the zone is 4 p.m.M–9 p.m. and from the 1st of April to 30th of September the zone is 7 a.m.–1 p.m.)—around 12%, other hours—around 55%. Details are presented in Figure 2.
In order to reduce energy demand, the investment in a 317 kWp photovoltaic installation was performed. The PV installation started energy production at the end of 2021. The factory became an industry partner as a demonstrator of a multi-energy storage hub system in connection with the implementation of the ERA-NET project MESH4U “https://mesh4u.energy/ (accessed on 1 September 2022)”. The aim of the present investigation is to provide a proposal for the optimal operation of the ESS in order to obtain reduction in the energy consumption from the power system grid and better use of the energy from the PV installation that results in regular steps to a zero-emission strategy.
Generally, there are three groups of tariffs in Poland that are connected with the level of voltage of the network:
  • Low voltage (LV): tariffs types G and C;
  • Medium voltage (MV): tariff type B;
  • High voltage (HV): tariff type A.
Additionally, all tariffs are described with two digits:
  • The first digit defines the level of contracted power: 1 means less than 40 kW; and 2 means more than 40 kW;
  • The second defines the number of different prices during the one-day period: 1 is constant price in a one-day period, 2 is two different tariffs in a one-day period, and 3 is three different tariffs in a one-day period.
The company studied here is an example of a consumer with tariff B23. The B23 tariff is a three-zone tariff for companies with a contracted capacity exceeding 40 kW, which divides the day into peak hours in the morning, peak hours in the afternoon, and other hours.

Energy Costs of Investigated Company

Based on the electricity bill for the investigated company, the following costs have an impact on the final electricity price:
  • Energy cost;
  • Changeable value of energy;
  • Quality cost;
  • RES cost;
  • Power cost;
  • Constant month cost connected with contracted power;
  • Cost of contracted power extensions;
  • Constant costs associated with performing services.
The costs that are not connected with the consumption of energy are the following:
  • Subscription fee: 15 Polish zloty (PLN)/month;
  • Service fee: 200 PLN/month.
  • The constant month cost connected with contracted power:
  • Network rate fixed charge: 12.4 PLN per each kW per month;
  • Transition charge: 0.19 PLN per each kW per month.
The cost of contracted power extensions:
  • Charge for excess power: 12.4 per each kW in 15 min cycle.
Some of the electricity price parts connected with consumption of the energy are constant in a one-day period and some of them are changeable during a one-day period. The constant costs in the one-day period are the following (prices given in PLN per 1 MWh):
  • Energy cost: 326 PLN;
  • Quality cost: 10.18 PLN;
  • RES cost: 2.2 PLN.
The changeable one-day-period costs contend with the following (prices given in PLN per 1 MWh):
  • Peak time:
    • Morning peak (7 a.m.–1 p.m.): 45.37 PLN;
    • Afternoon peak (4 p.m.–10 p.m.) 82.66 PLN;
    • Other hours: 14.35 PLN.
  • Power delivery cost:
    • Non-free time (7 a.m.–10 p.m.): 76.2 PLN;
    • Other hours: 0 PLN.
The additional costs of electricity are costs associated with reactive energy. In the case of both delivered and consumed reactive energy, the cost is 245.44 PLN per each MVarh.
Based on the indicated constant and non-constant cost, the 1 MWh for each hour in the one-day period in PLN and EUR (based on an exchange rate of 4.5) were calculated. Those results are presented in
The cost includes all indicated costs that are based on the energy cost, the changeable value of energy, the quality cost, the RES cost, and the power cost that were described in this section (Table 1).

4. Case Study

4.1. Presentation of the Consumption Profiles

4.1.1. Real Profile of B23-Type Consumer Based on Metering System (Profile 1)

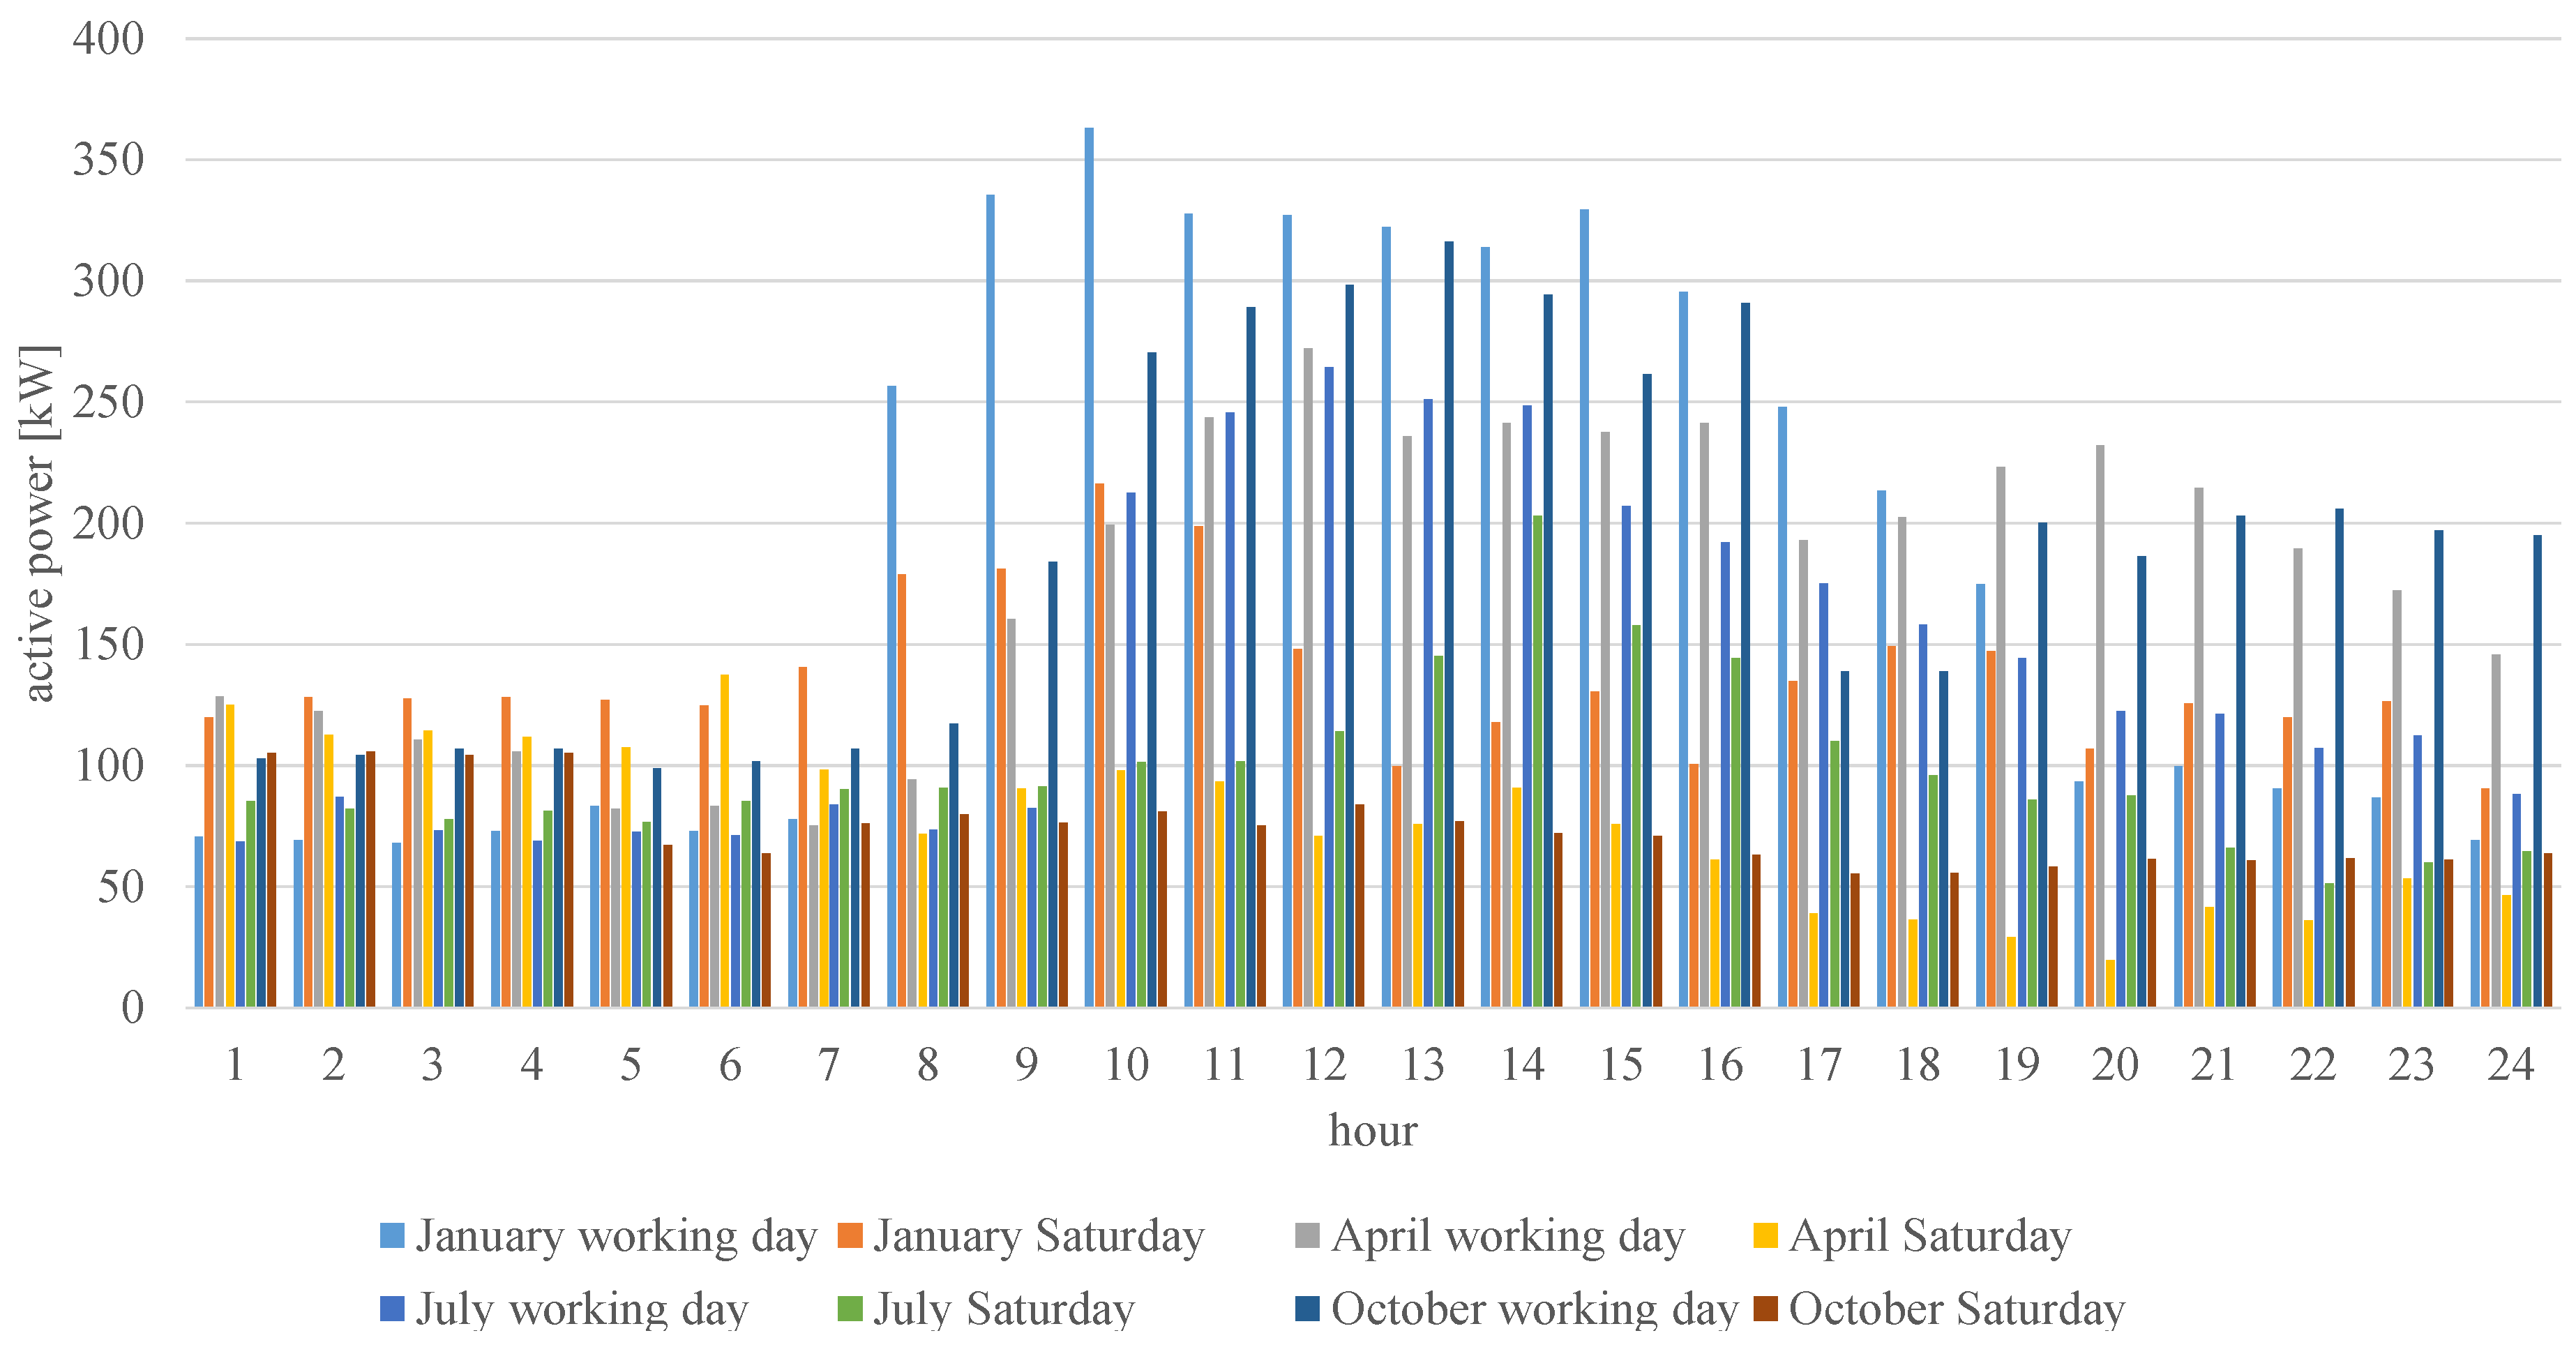
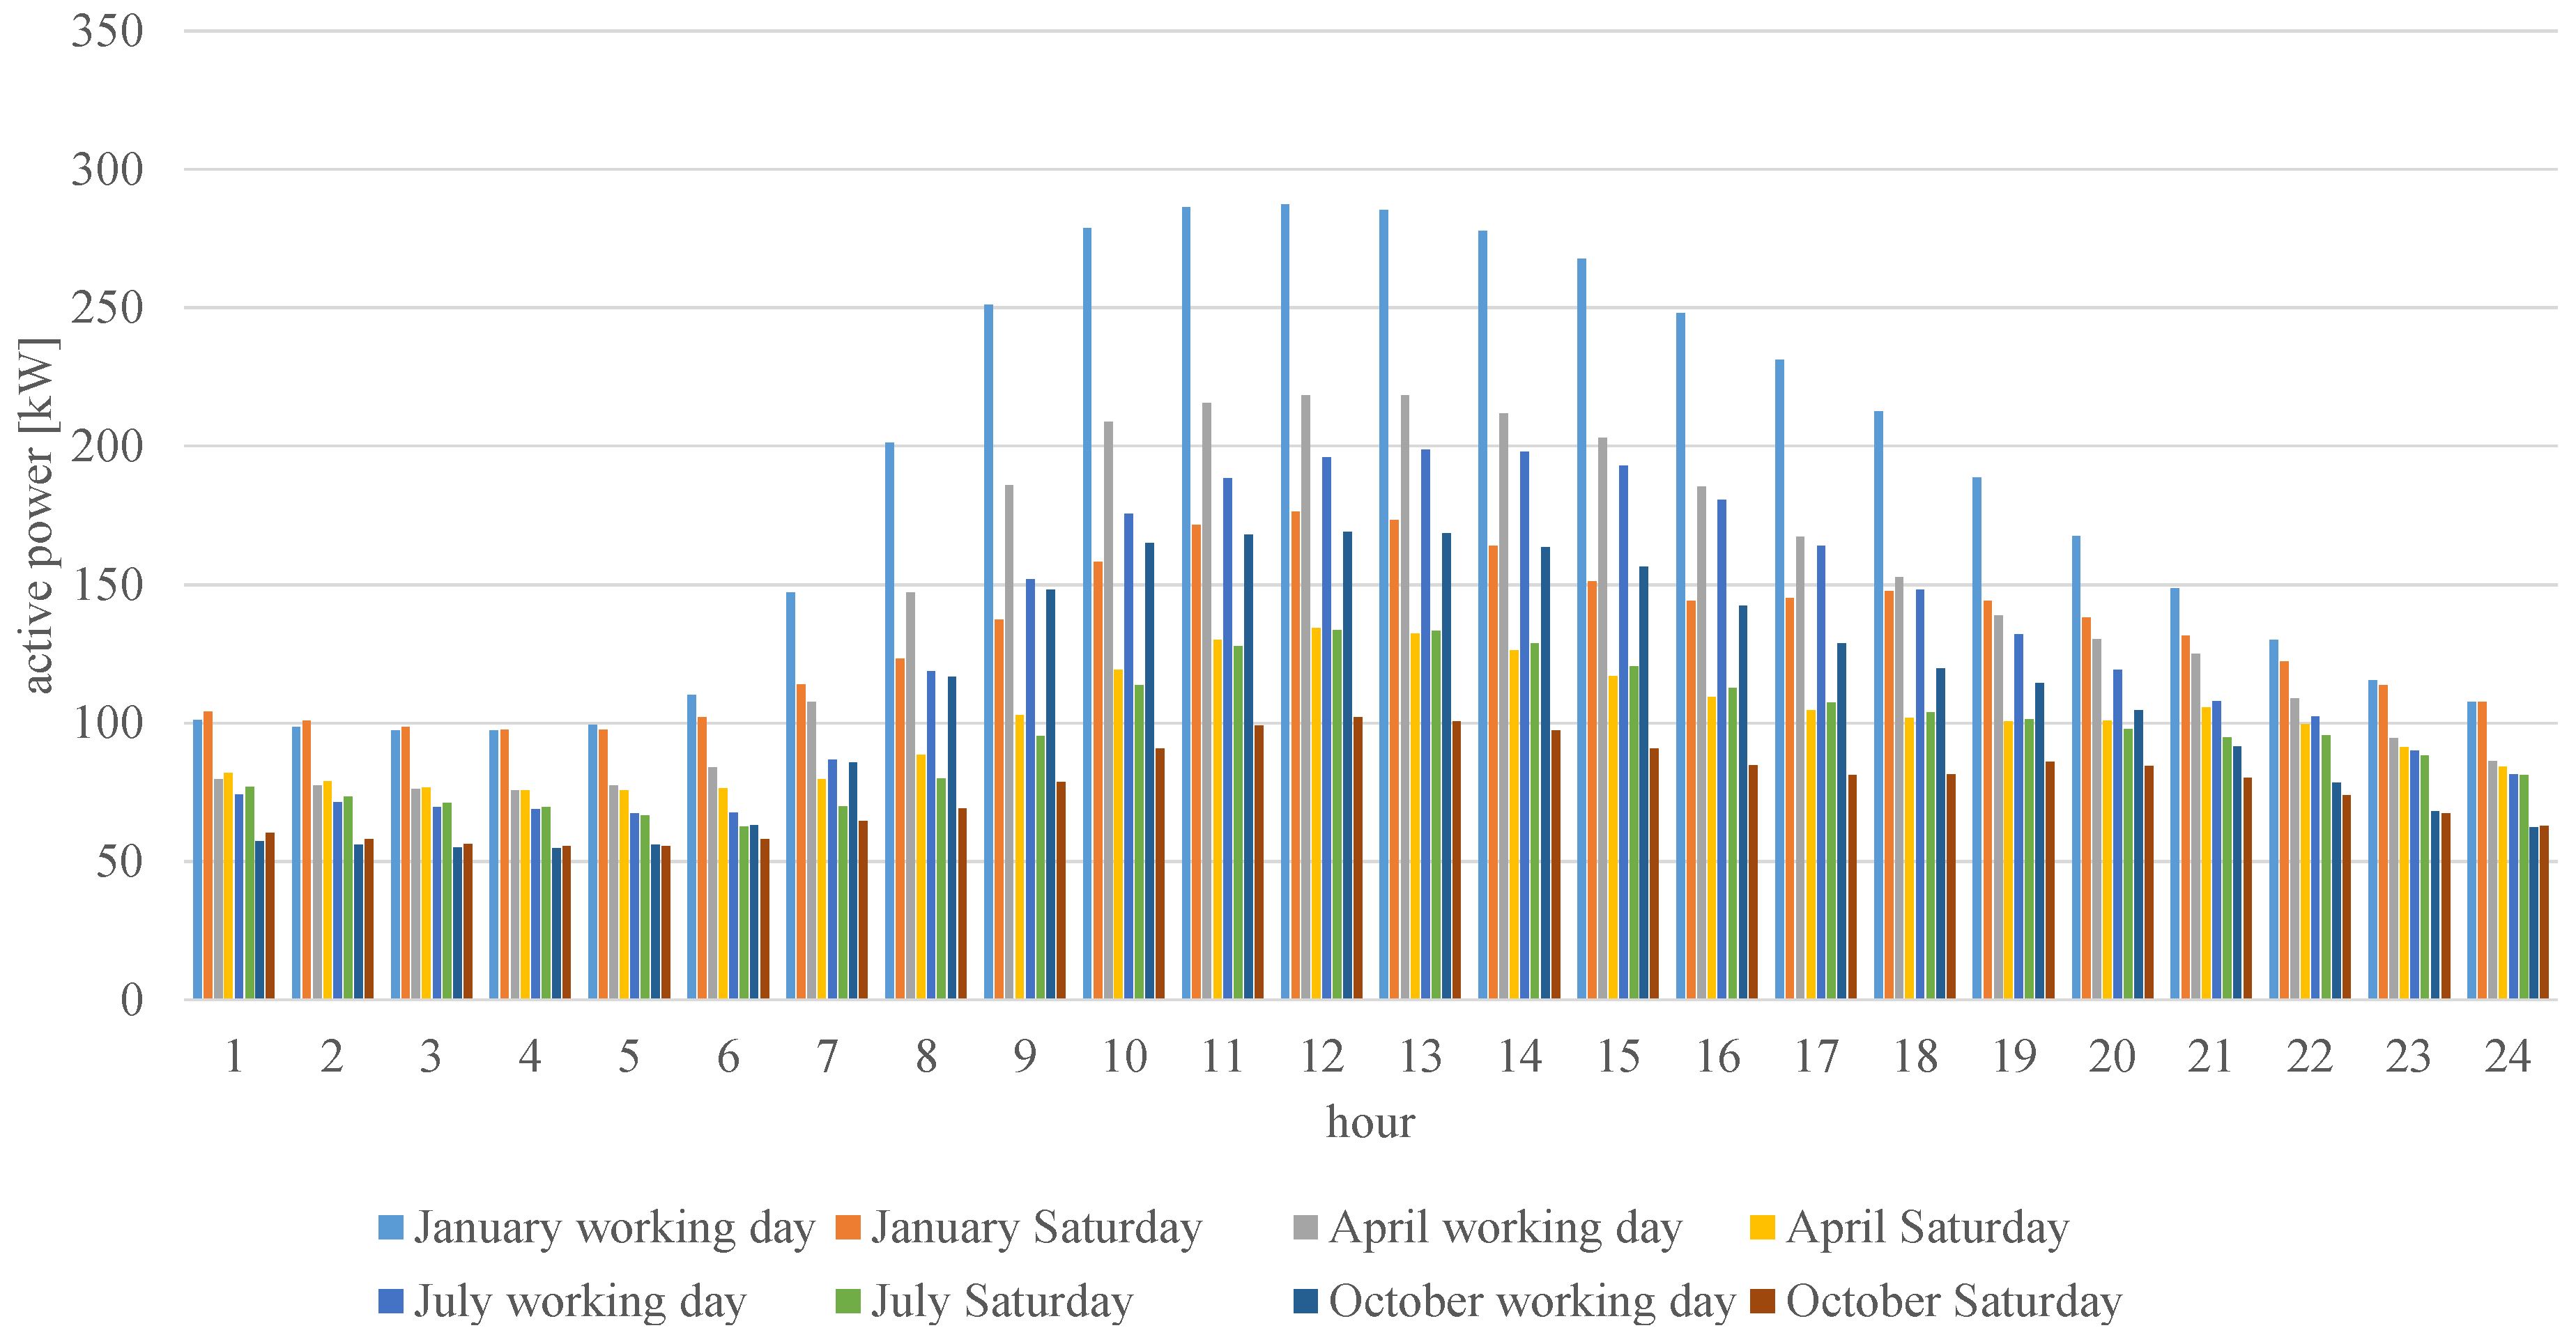
Based on the real load data from the investigated company in a 24 h period for representative months (January, April, July, and October) for working days and Saturdays, the load profile was prepared (Figure 3) As representatives, the Tuesday in the second week of months were selected, and Saturdays after the indicated Tuesdays. The available data proceed from the range of 1 November 2020 to October 2021.

4.1.2. Profile of Consumer B23 Based on Energy Bills and Standard Profiles from Distribution Network Operation and Maintenance Manual (Profile 2)

Normally, in Poland for customers from the G and C tariff that are in “x” group 1 (power less than 40 kW), the standard profiles are defined by energy supply companies. However, there are no standard profiles for B “x” group 2 (power exceeds 40 kW). Thus, in this section, the B23 was prepared based on the following assumptions:
  • There is no load profile for B23 in the distribution network operation and maintenance manual, therefore a C13 profile was used. C13 was selected because it was the profile that assumes different energy costs for three periods: morning peak, afternoon peak, and other hours. The load profile for C13 is presented in Appendix A.
  • The monthly energy use was based on the real energy consumption of the metallurgy company for the period of September 2020 to August 2021 (detailed energy consumption is presented in Table 2)—the background of this assumption was information given by the metallurgy company.
  • The sum of the consumption based on distribution network operation and maintenance manual for each month was calculated including the number of working days, Saturdays, and Sundays. Then, the ratio of the C13 profile to real consumption of the metallurgy company was defined for each month—as a division between them. Finally, based on the C13 profile, multiplication of the consumption ratio for each month with the real usage was performed. Then, the profile with 1-hour resolution was obtained (Appendix B).
As it can be noticed, the assumed profile was based on the energy consumption from September to December 2020. Thus, to assure that profile is actual for the 2021 year, the one-week measurements were suggested. These measurements were performed in October 2021.
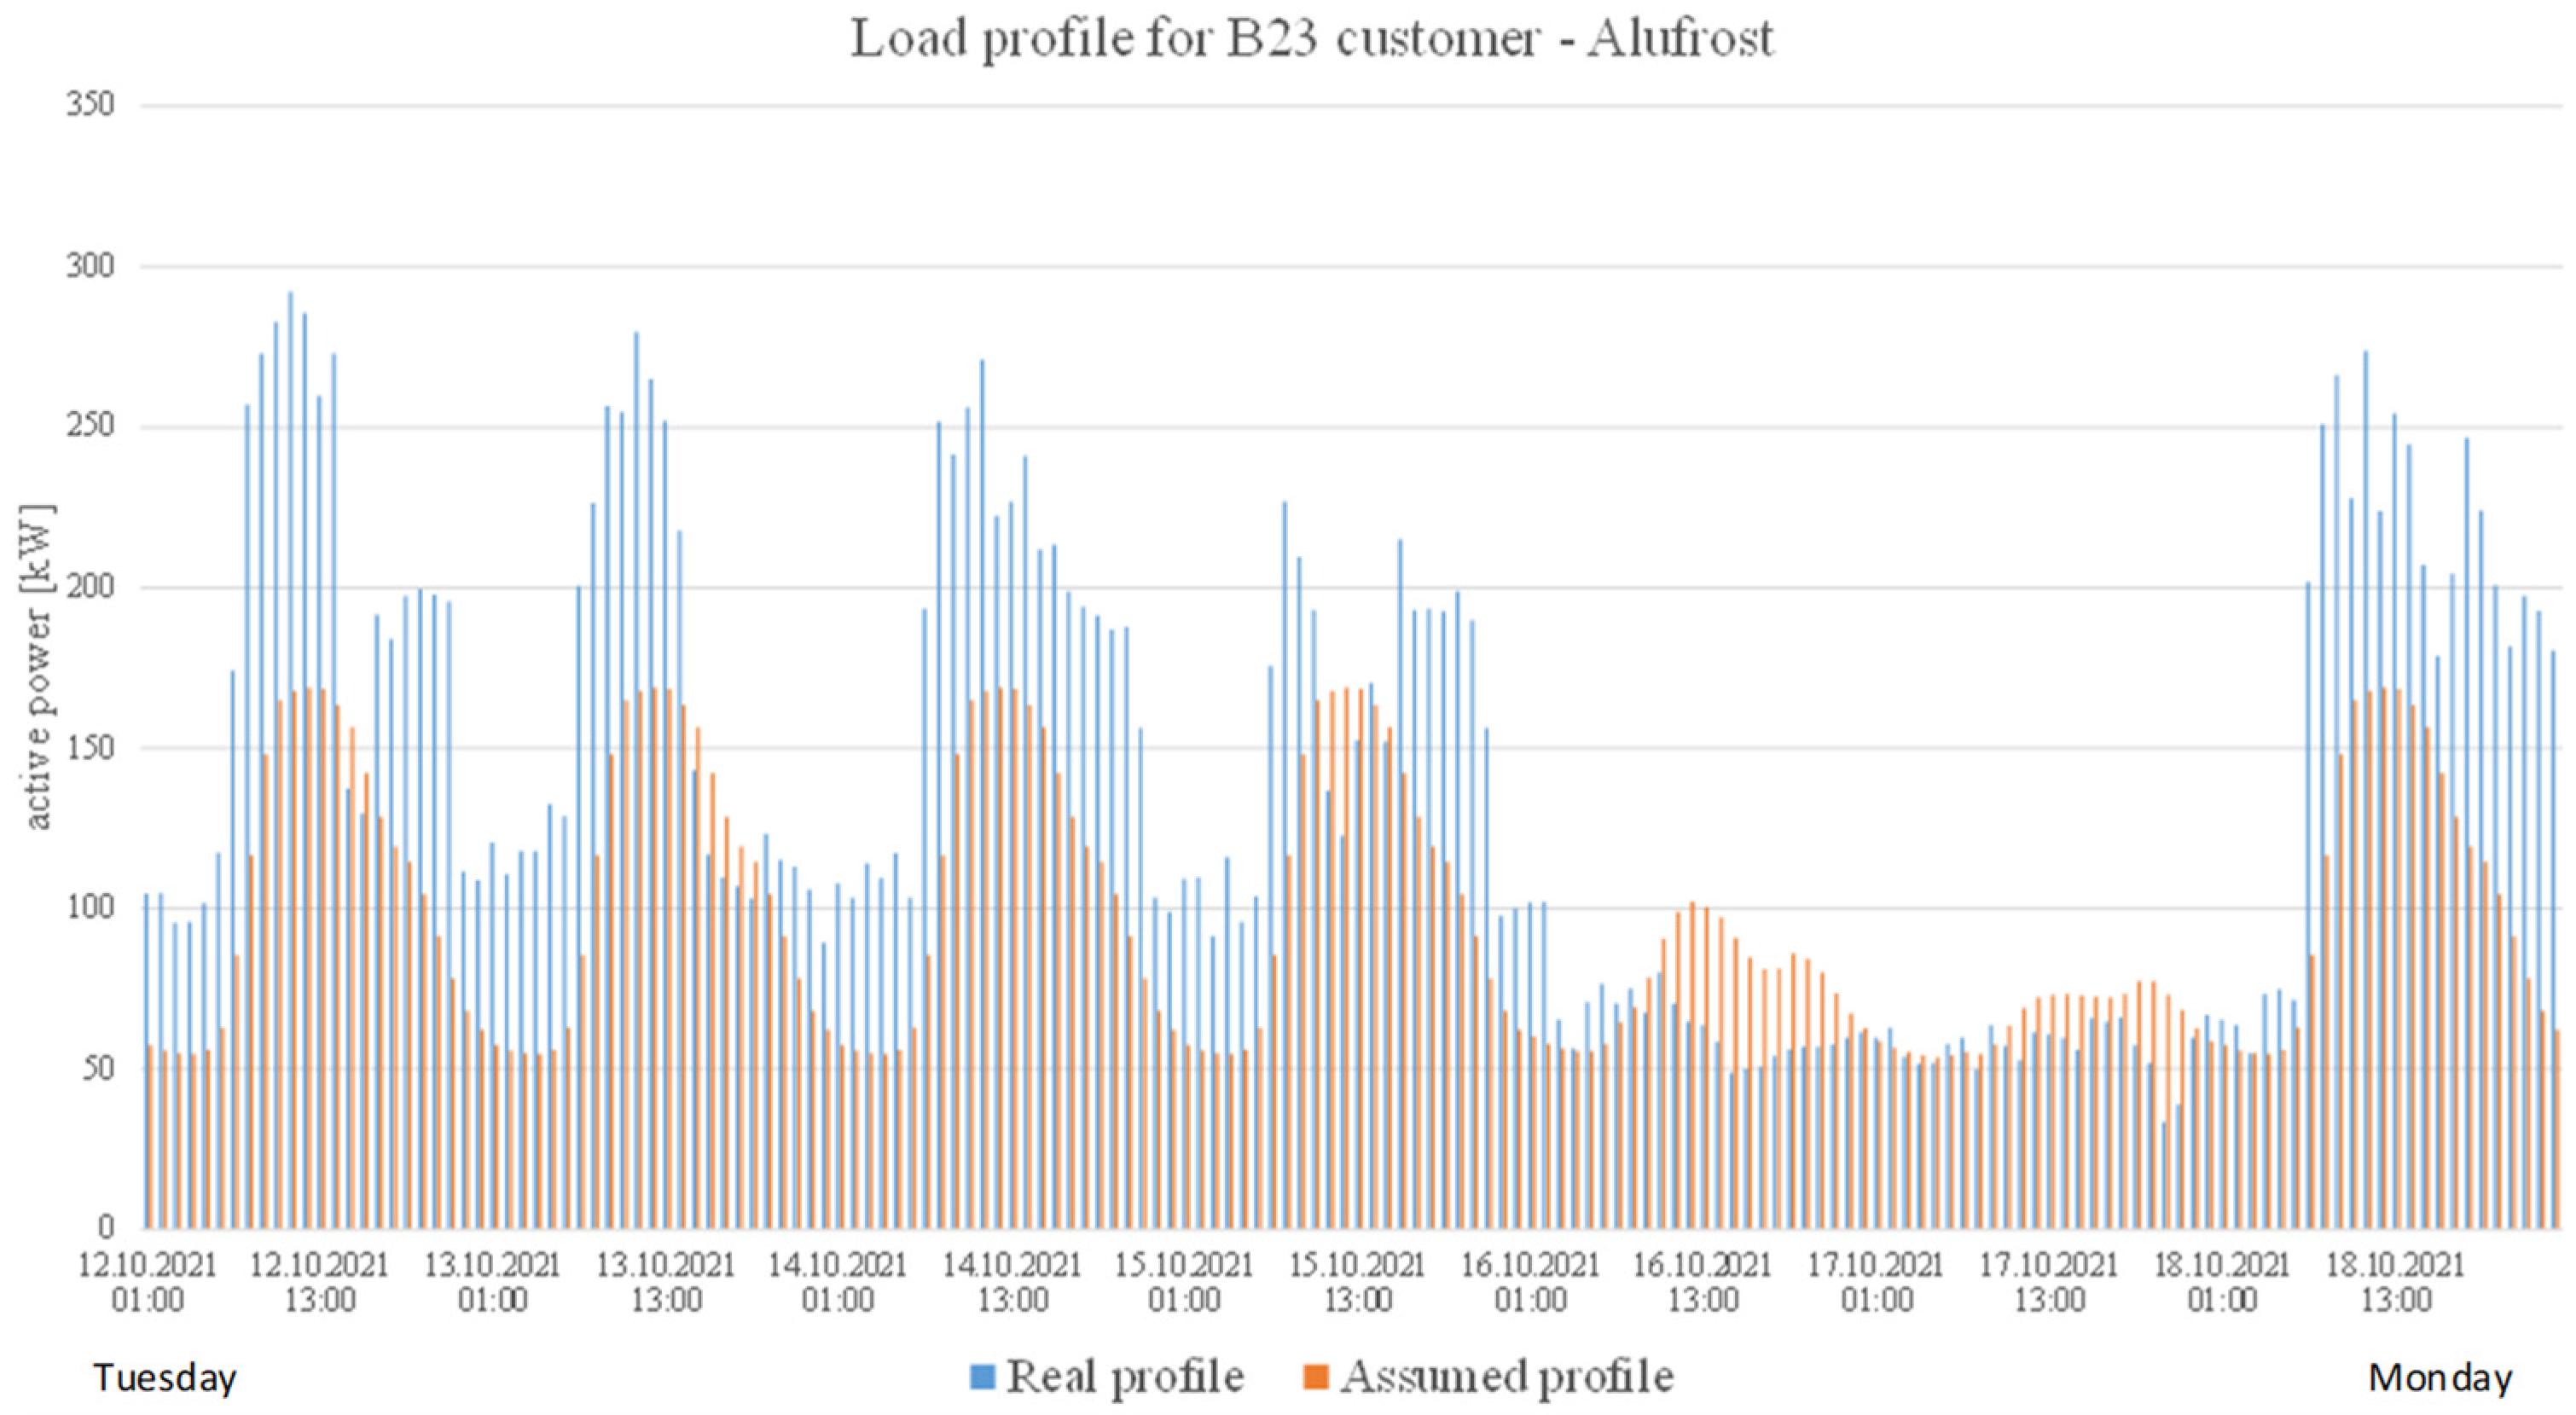
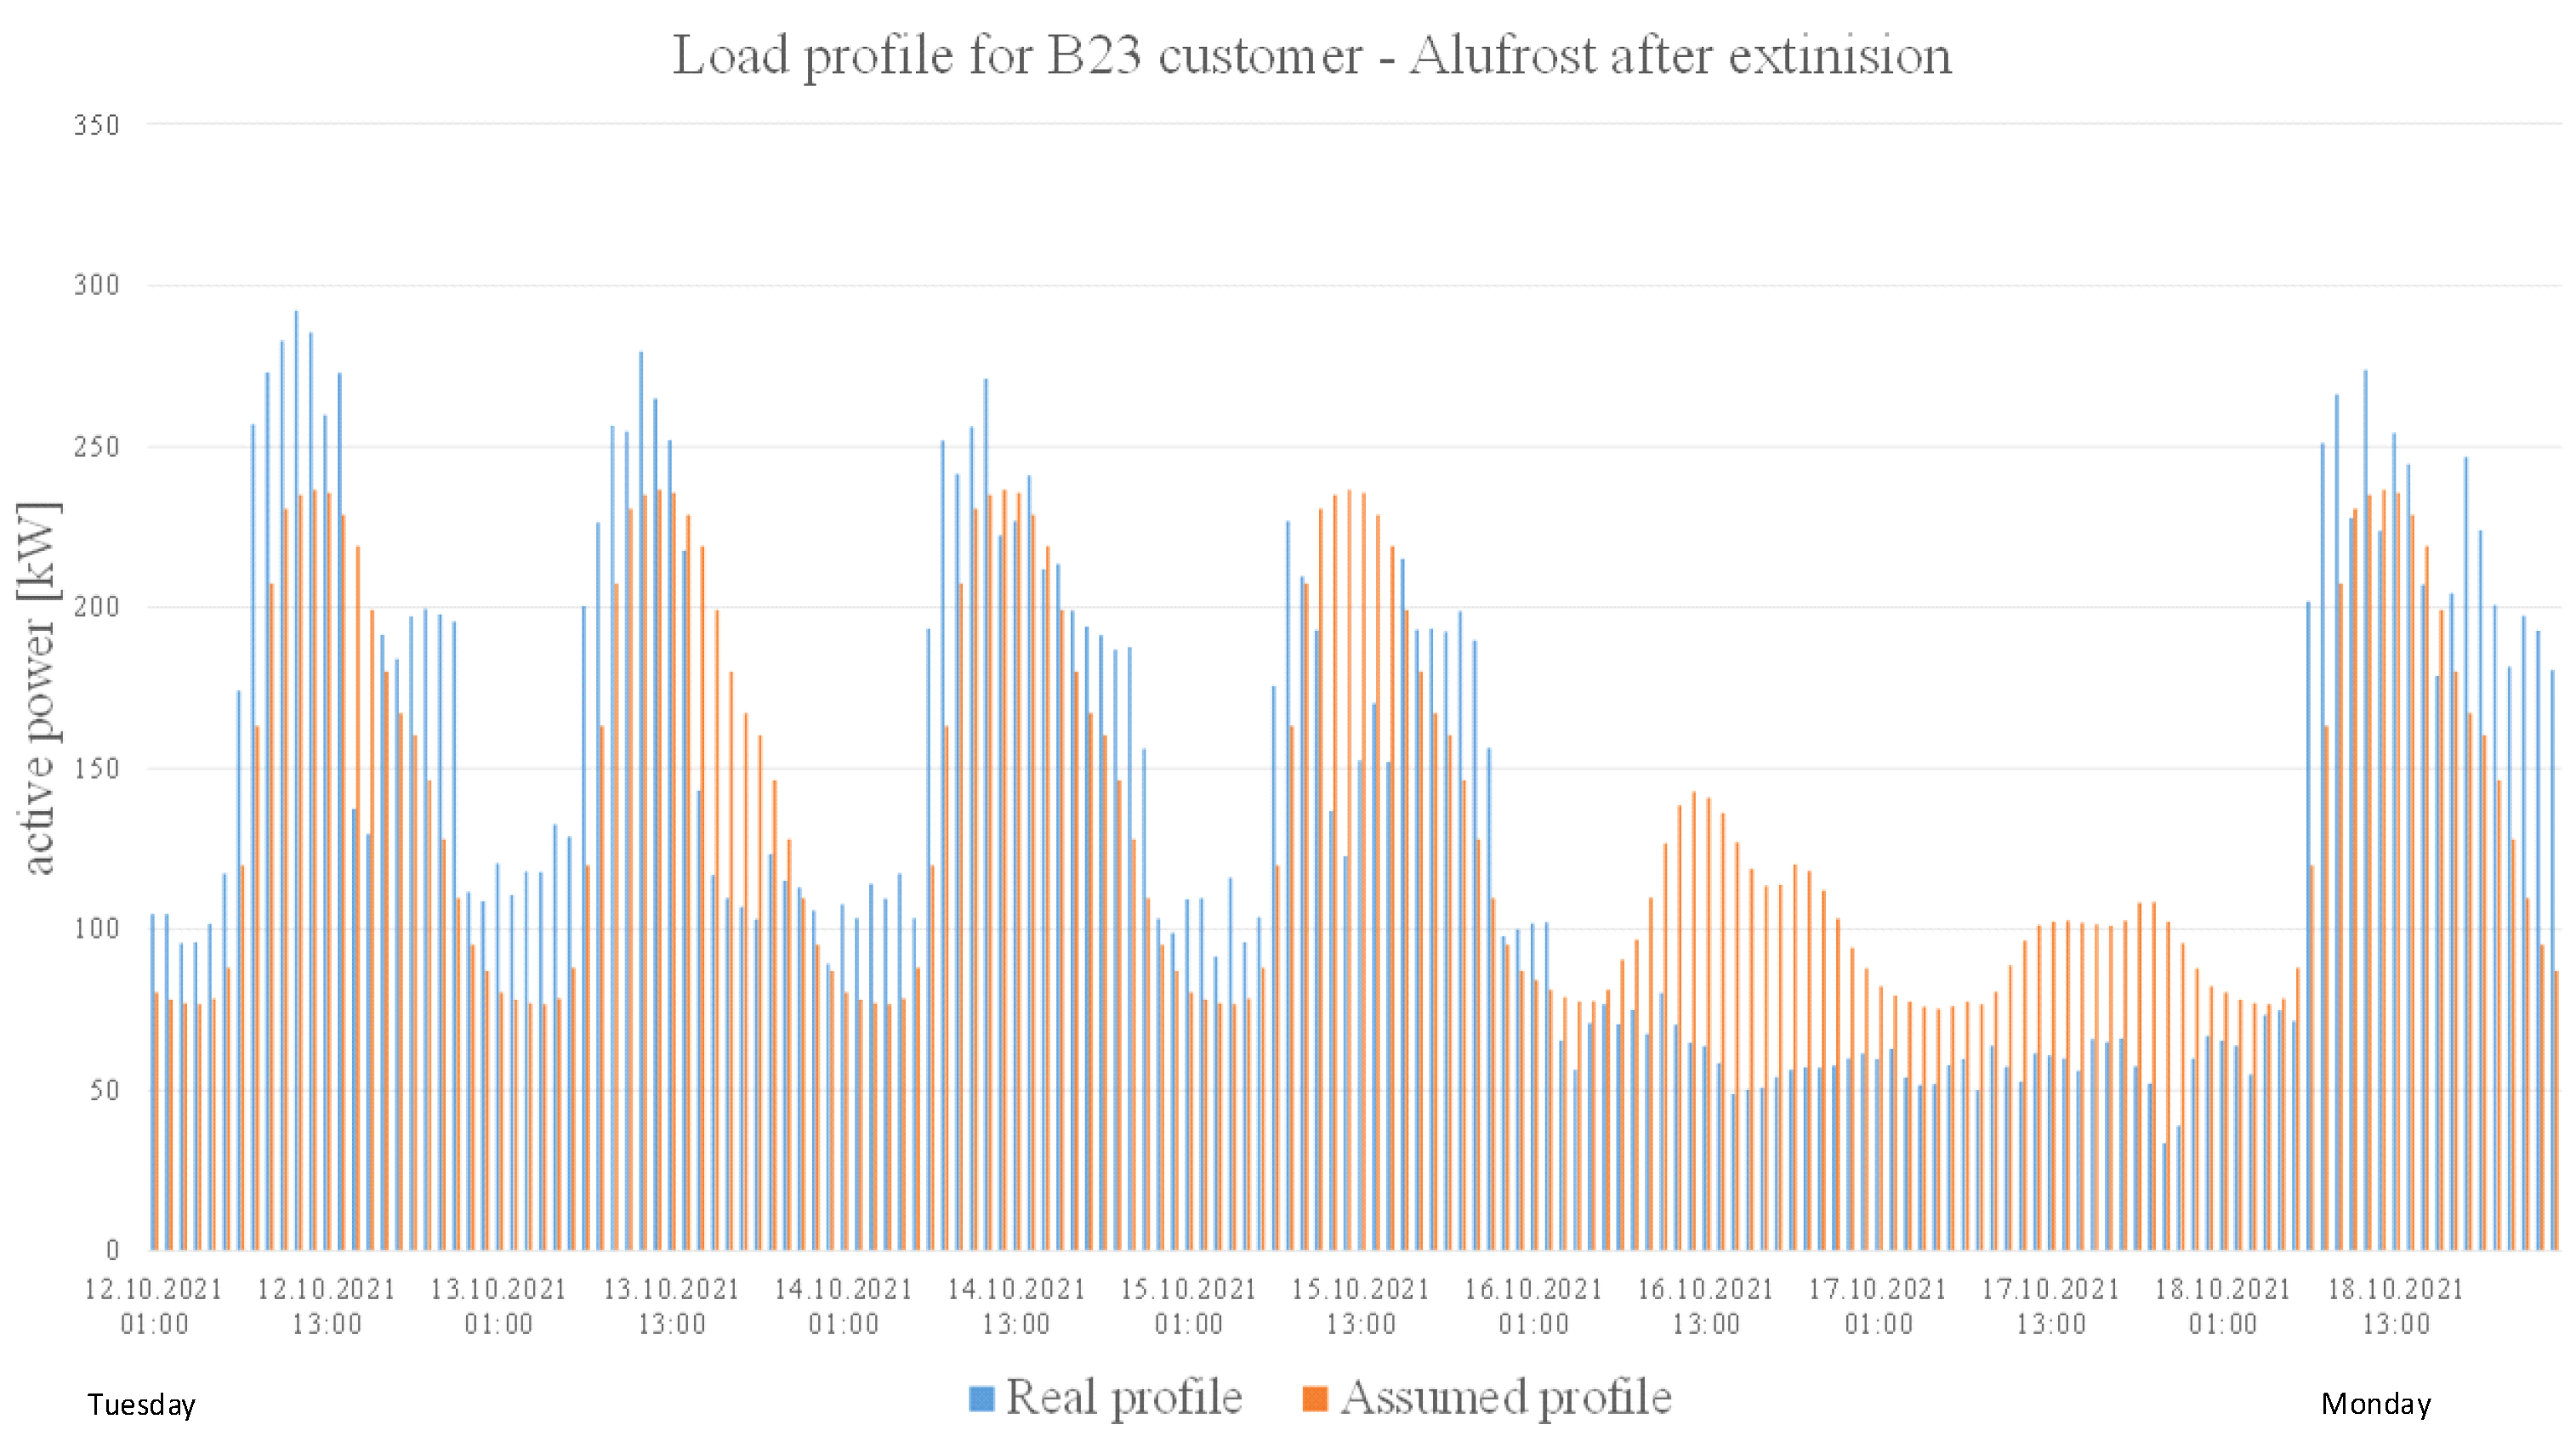
The comparison between the real data profile and that assumed on the basement of the C13 profile and energy consumption in 2020 is presented in Figure 4. However, based on the results it is easy to observe that the real profile has higher values. Thus, the energy demand comparison for October 2020 (Table 2) with demand from 2021 was compared. Based on 7 days of consumption, the extension to 31 days was conducted. Consequently, for October, the energy demand was equal to 104 MWh. For October 2020 it was 72 MWh. Thus, the profile based on distribution network operation and maintenance manual and real measurements was multiplied by 1.4 (around 104 MWh/72 MWh). The comparison was performed for the extended profile. Results are presented in Figure 5.
Based on Figure 5 it can be observed that the peaks have higher values based on real data than the profile for the majority of working days (with the exception of Friday). Additionally, it assumes a higher consumption during the weekends. Additionally, during nights the real energy consumption is higher than that assumed for working days. However, based on expert assessment, this profile is more realistic, and as the result of it for the months from September to October the 1.4 multiplication ratio was applied to prepare the final load profile. Then, the final load profile was prepared based on the defined B23 profile in a 24 h period for the representative months (January, April, July, and October) for working days and Saturdays (Figure 6).

4.1.3. Load Profile Based on the Short-Term Measurement and Standard Profiles from the Distribution Network Operation and Maintenance Manual (Profile 3)

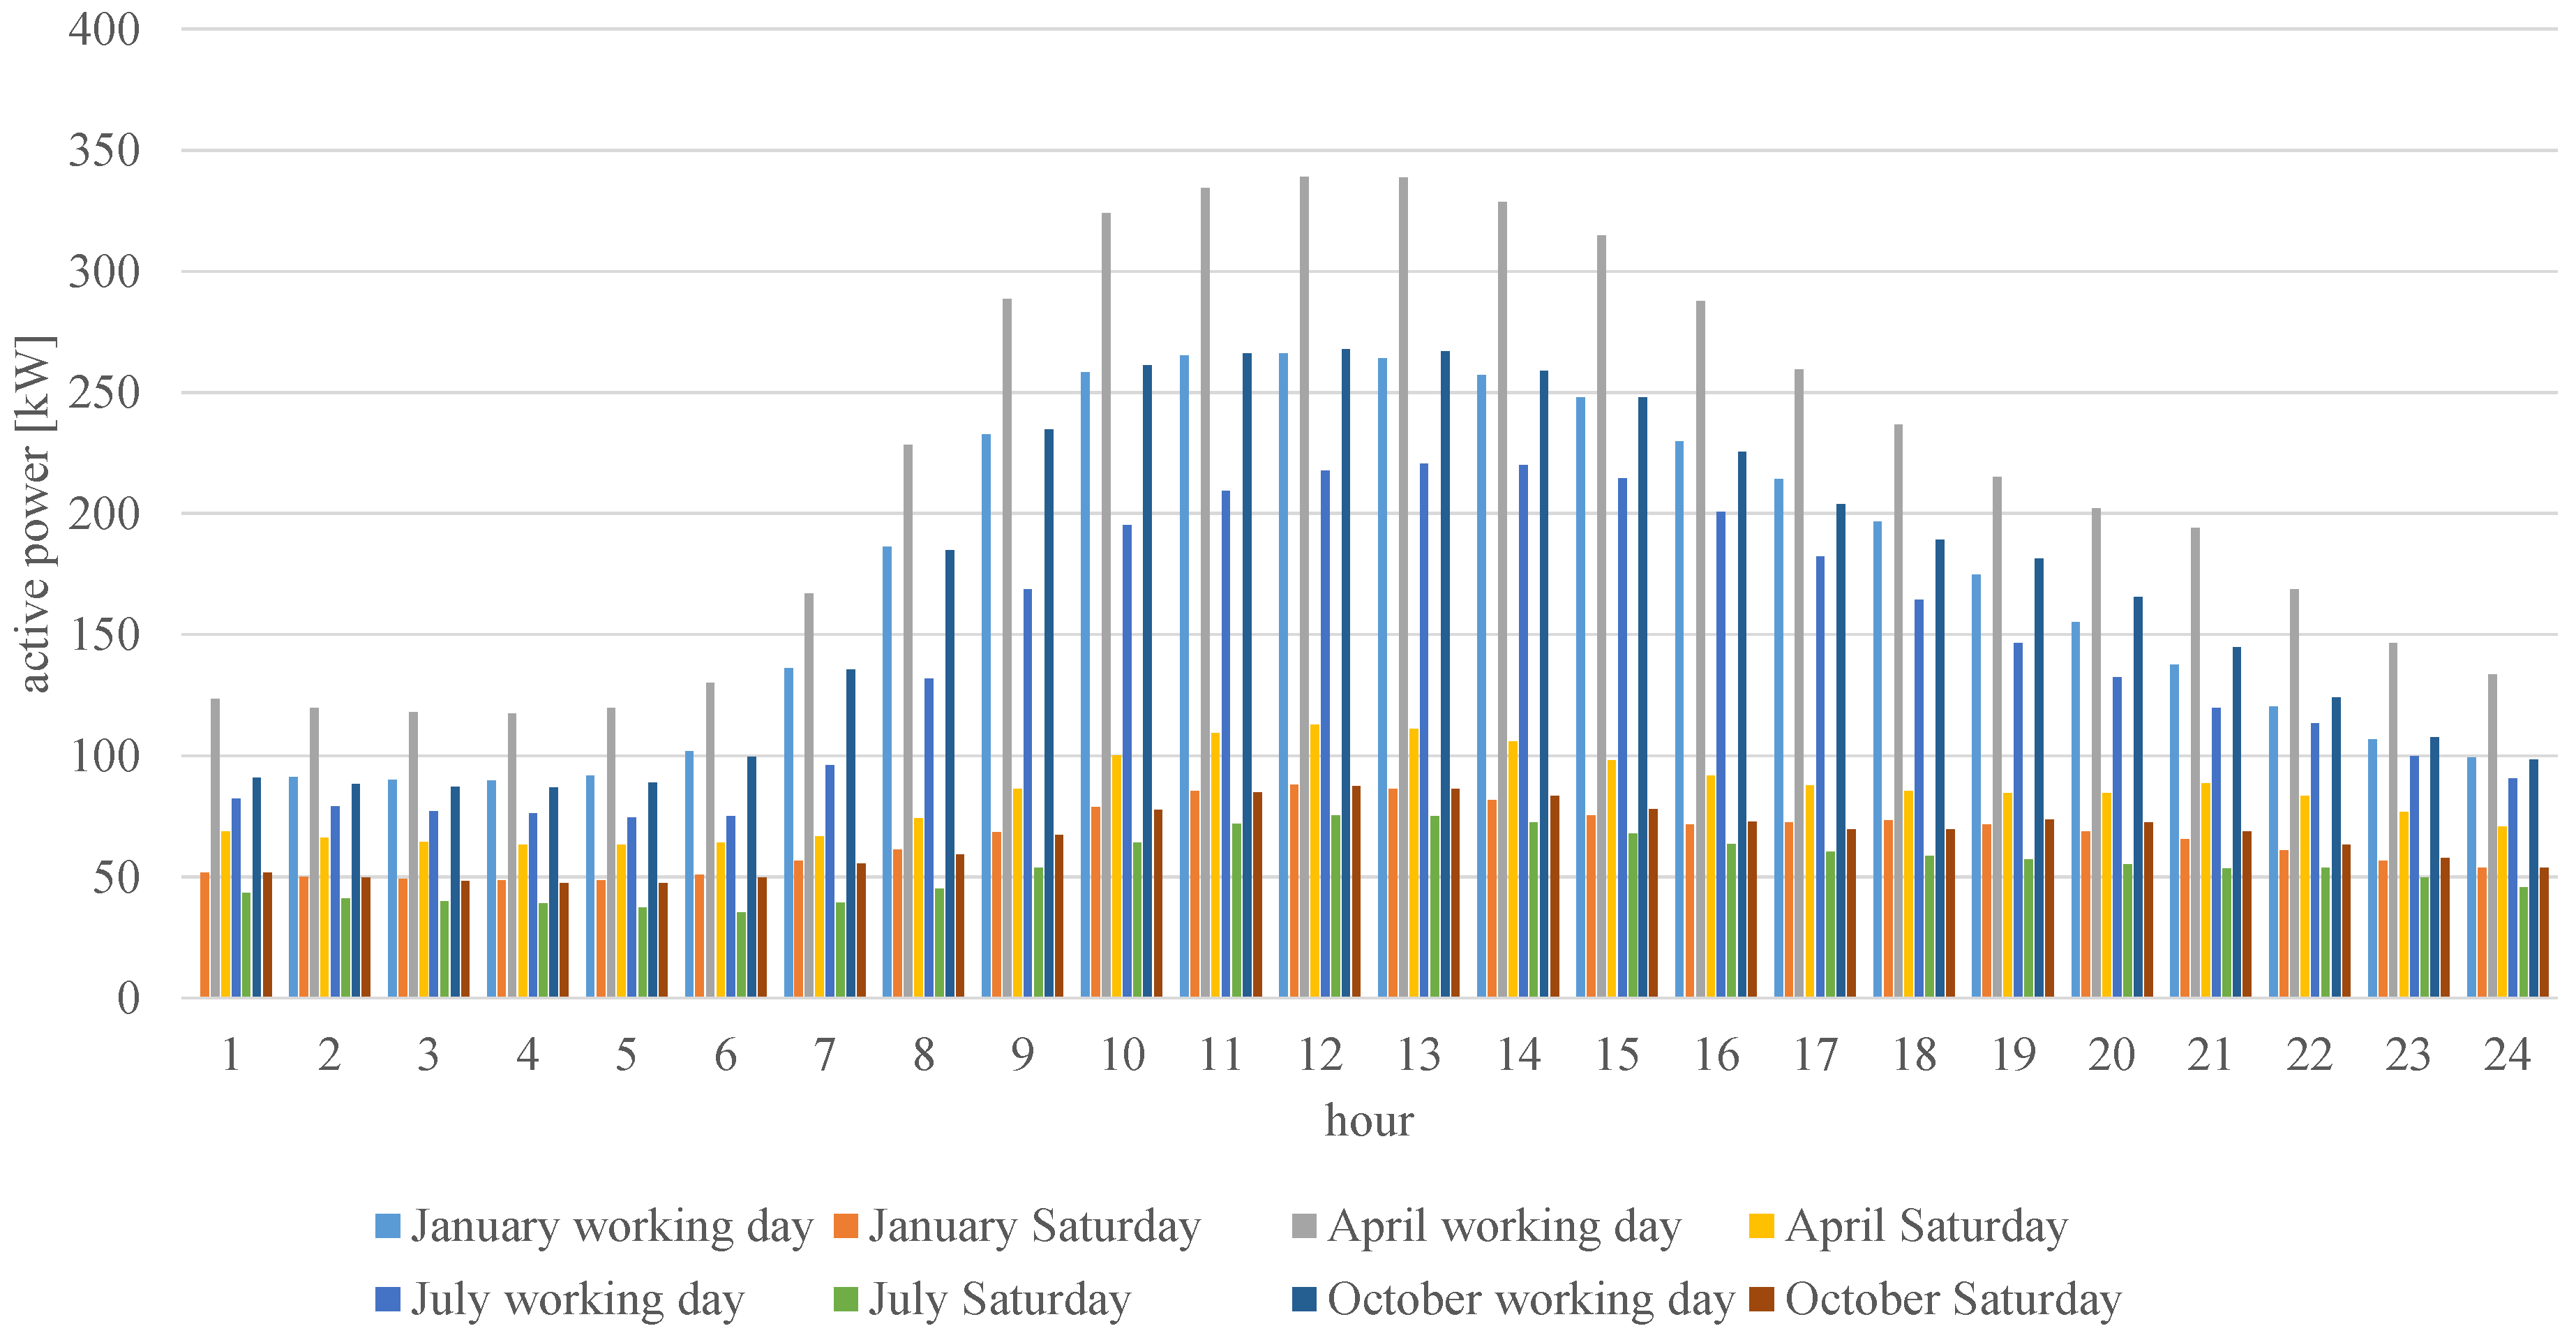
In case the real energy bills are not available, the first step to define the energy consumption profile is to perform the short-term period measurements. It is proposed that the duration of this measurement should be one week (including Saturday and Sunday). Then, it is possible to use the standard profile and defined energy consumption during a year to prepare the load profiles. After performing these measurements, the one-day mean value of energy consumption is defined for working day, Saturday, and “Sunday or holiday”. Then, the obtained energy consumption level is divided by assumed standard day construction, and the ratio of this is calculated for the month that measurements are performed. Then, for other months, the same values are taken but with the additional ratio of contracted power in the adequate month to contracted power in measurement month. Based on that procedure for the metallurgy company and standard profile C13, the energy consumption profile is defined (detailed assumptions of standard profile selection are described in Section 4.1.2). The proposed approach is presented in Figure 7 and full profile is presented in Appendix C.

4.1.4. Summary of Profile Selection

In the investigations, the different approaches to defining a profile for the company were included. These methods can be called as follows:
  • Using real smart meter data (Section 4.1.1);
  • Using energy bills, standard profiles, and measurement for validation (Section 4.1.2);
  • Using short-term measurement, standard profile, and contracted power (Section 4.1.3).
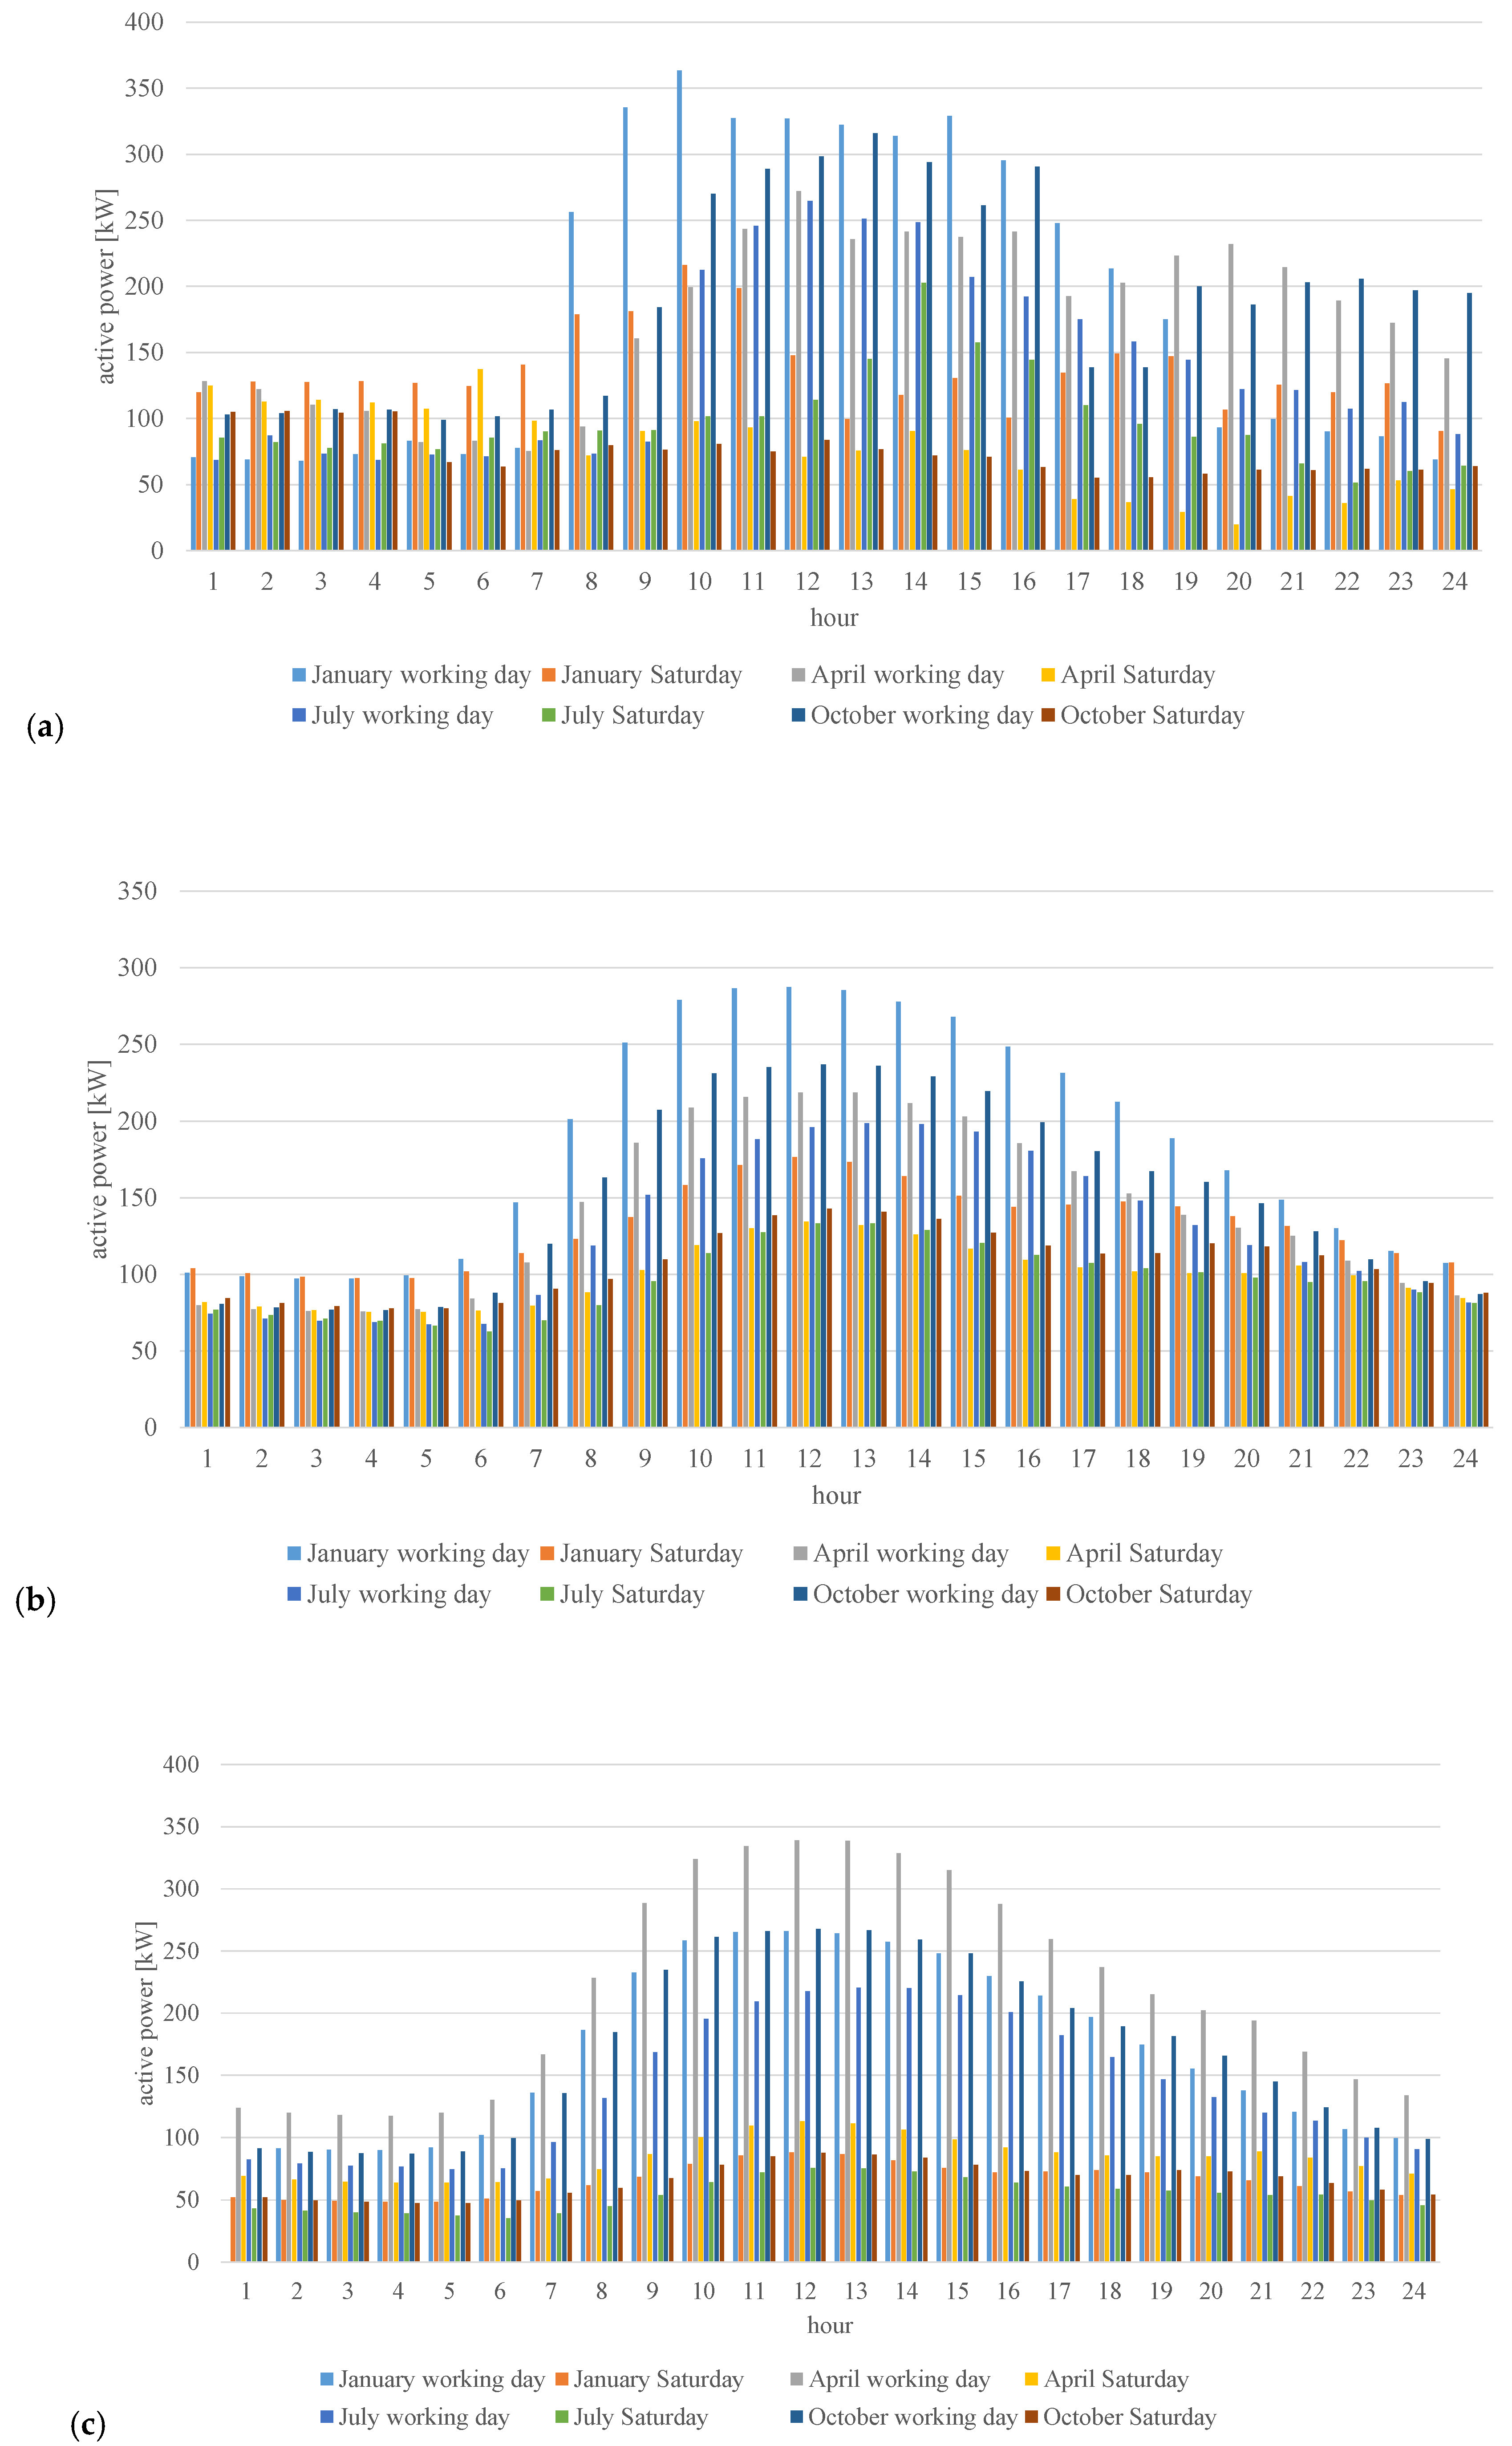
The summary of all indicated profiles is presented in Figure 8. As it can be observed, the profile based on real smart meter data has the highest peak values for working days in January (maximal around 350 kW) compared to others (less than 300 kW). In addition, the higher peak value is indicated in the profile based on short-term measurements, the standard profile, and the contracted power for April (around 350 kW) compared to others (around 250 kW). Generally, both standards based on the standard profiles are similar and differ from the real measurements for some specific points. However, such an approximation is better than assuming the constant power based on contracted power. In particular, in a one-year period the approximation generally does not exceed 50 kW, which is not more than 20% of the contracted power.

4.2. Results for the Operation of ESS

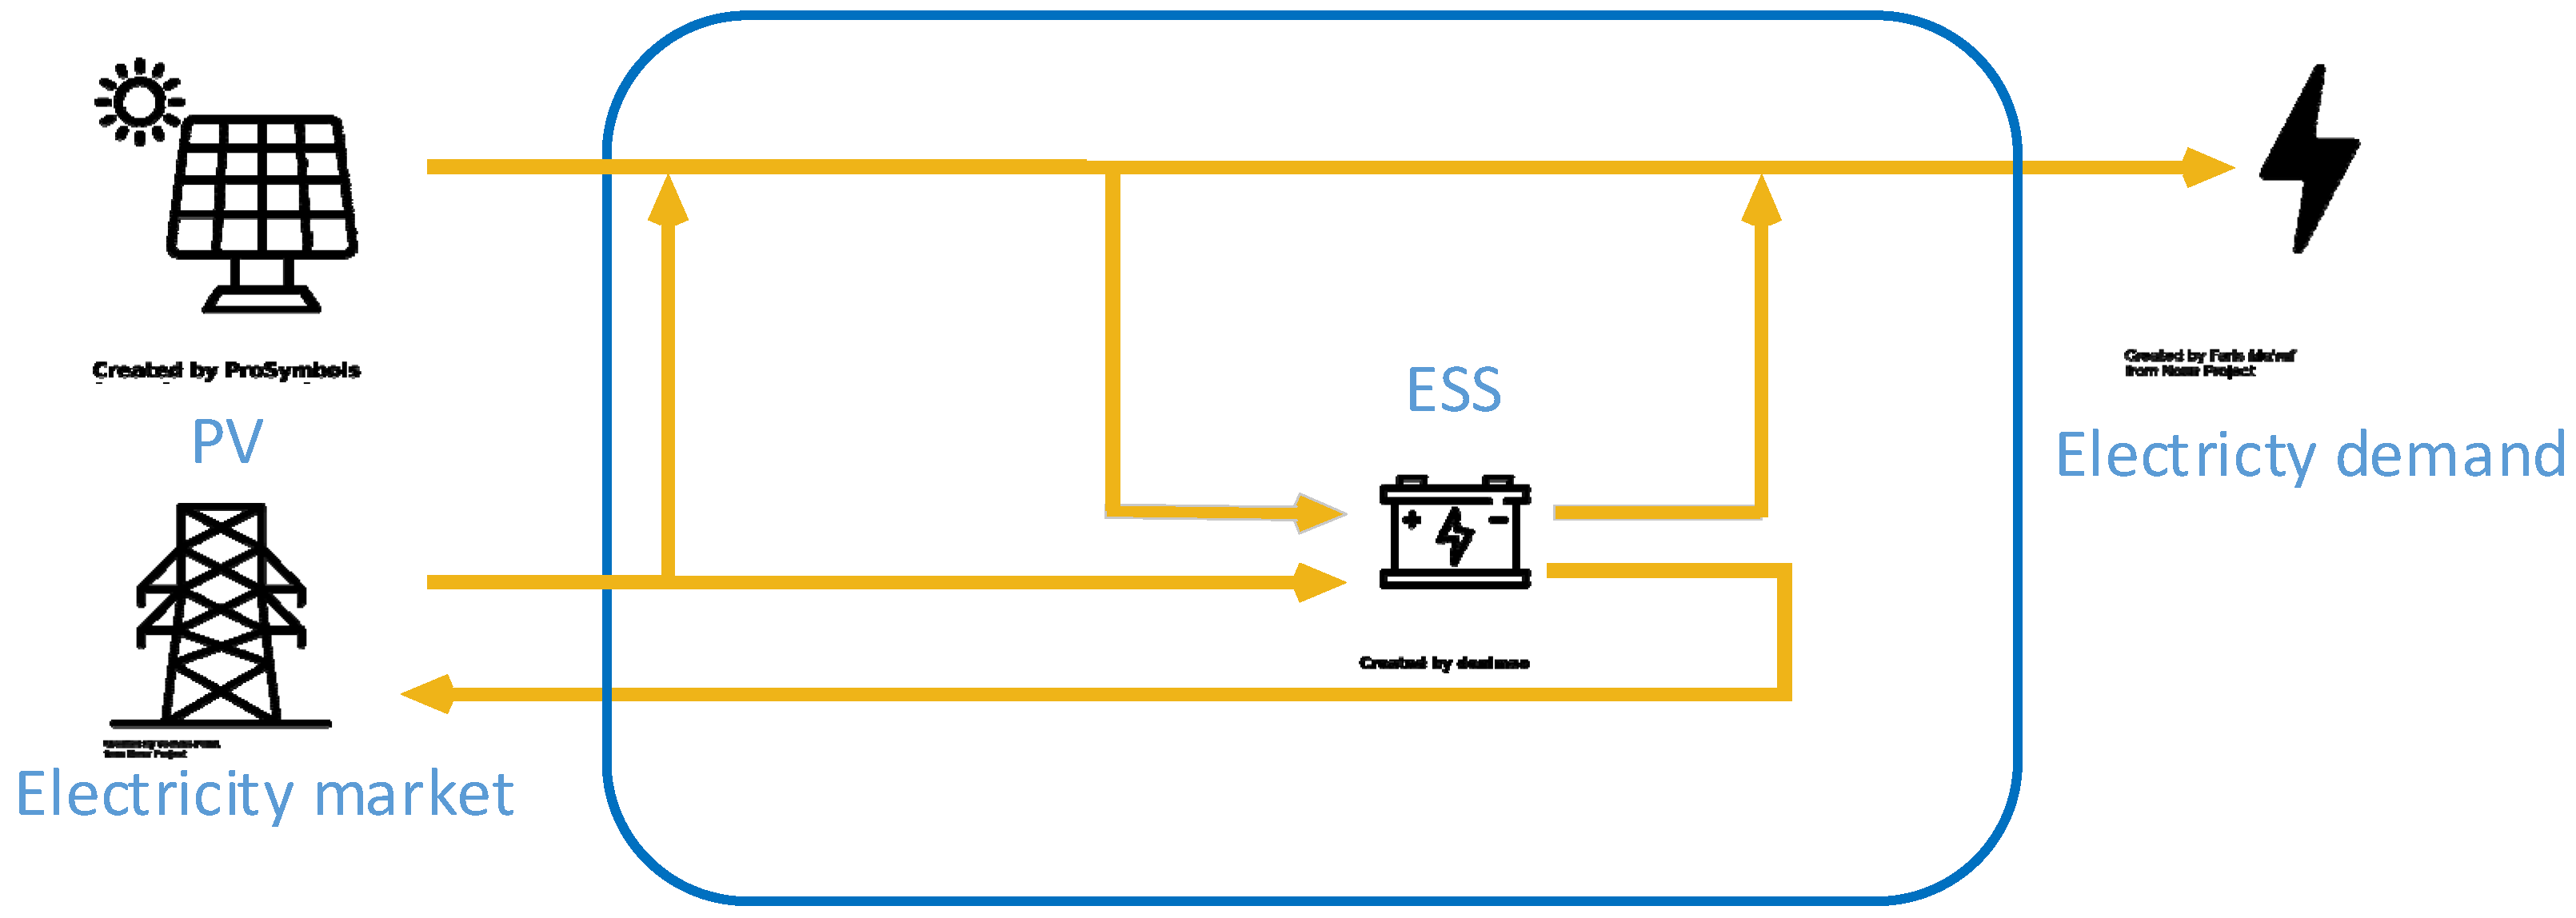
Figure 9 depicts the schematic diagram of the connection of the investigated system. The electricity can be stored in the ESS or transferred directly to the output. The ESS is charged through the main grid or using energy from the PV panels. The output of the ESS may support the demands or sell the energy to the main grid. The simulation investigates the operation of the ESS. The operation means the optimal dispatch of the ESS during the scheduling horizon to cover electricity demand. The operation of the ESS is the result of the solvation of the set of equations presented in Section 2.2 provided by Cplex solver under the GAMS programming environment. The desirable output is the 24 h scheduling for the ESS, including charging and discharging volume. The aim of the presented investigation is to highlight how the load demand profile can influence the ESS planed operation.
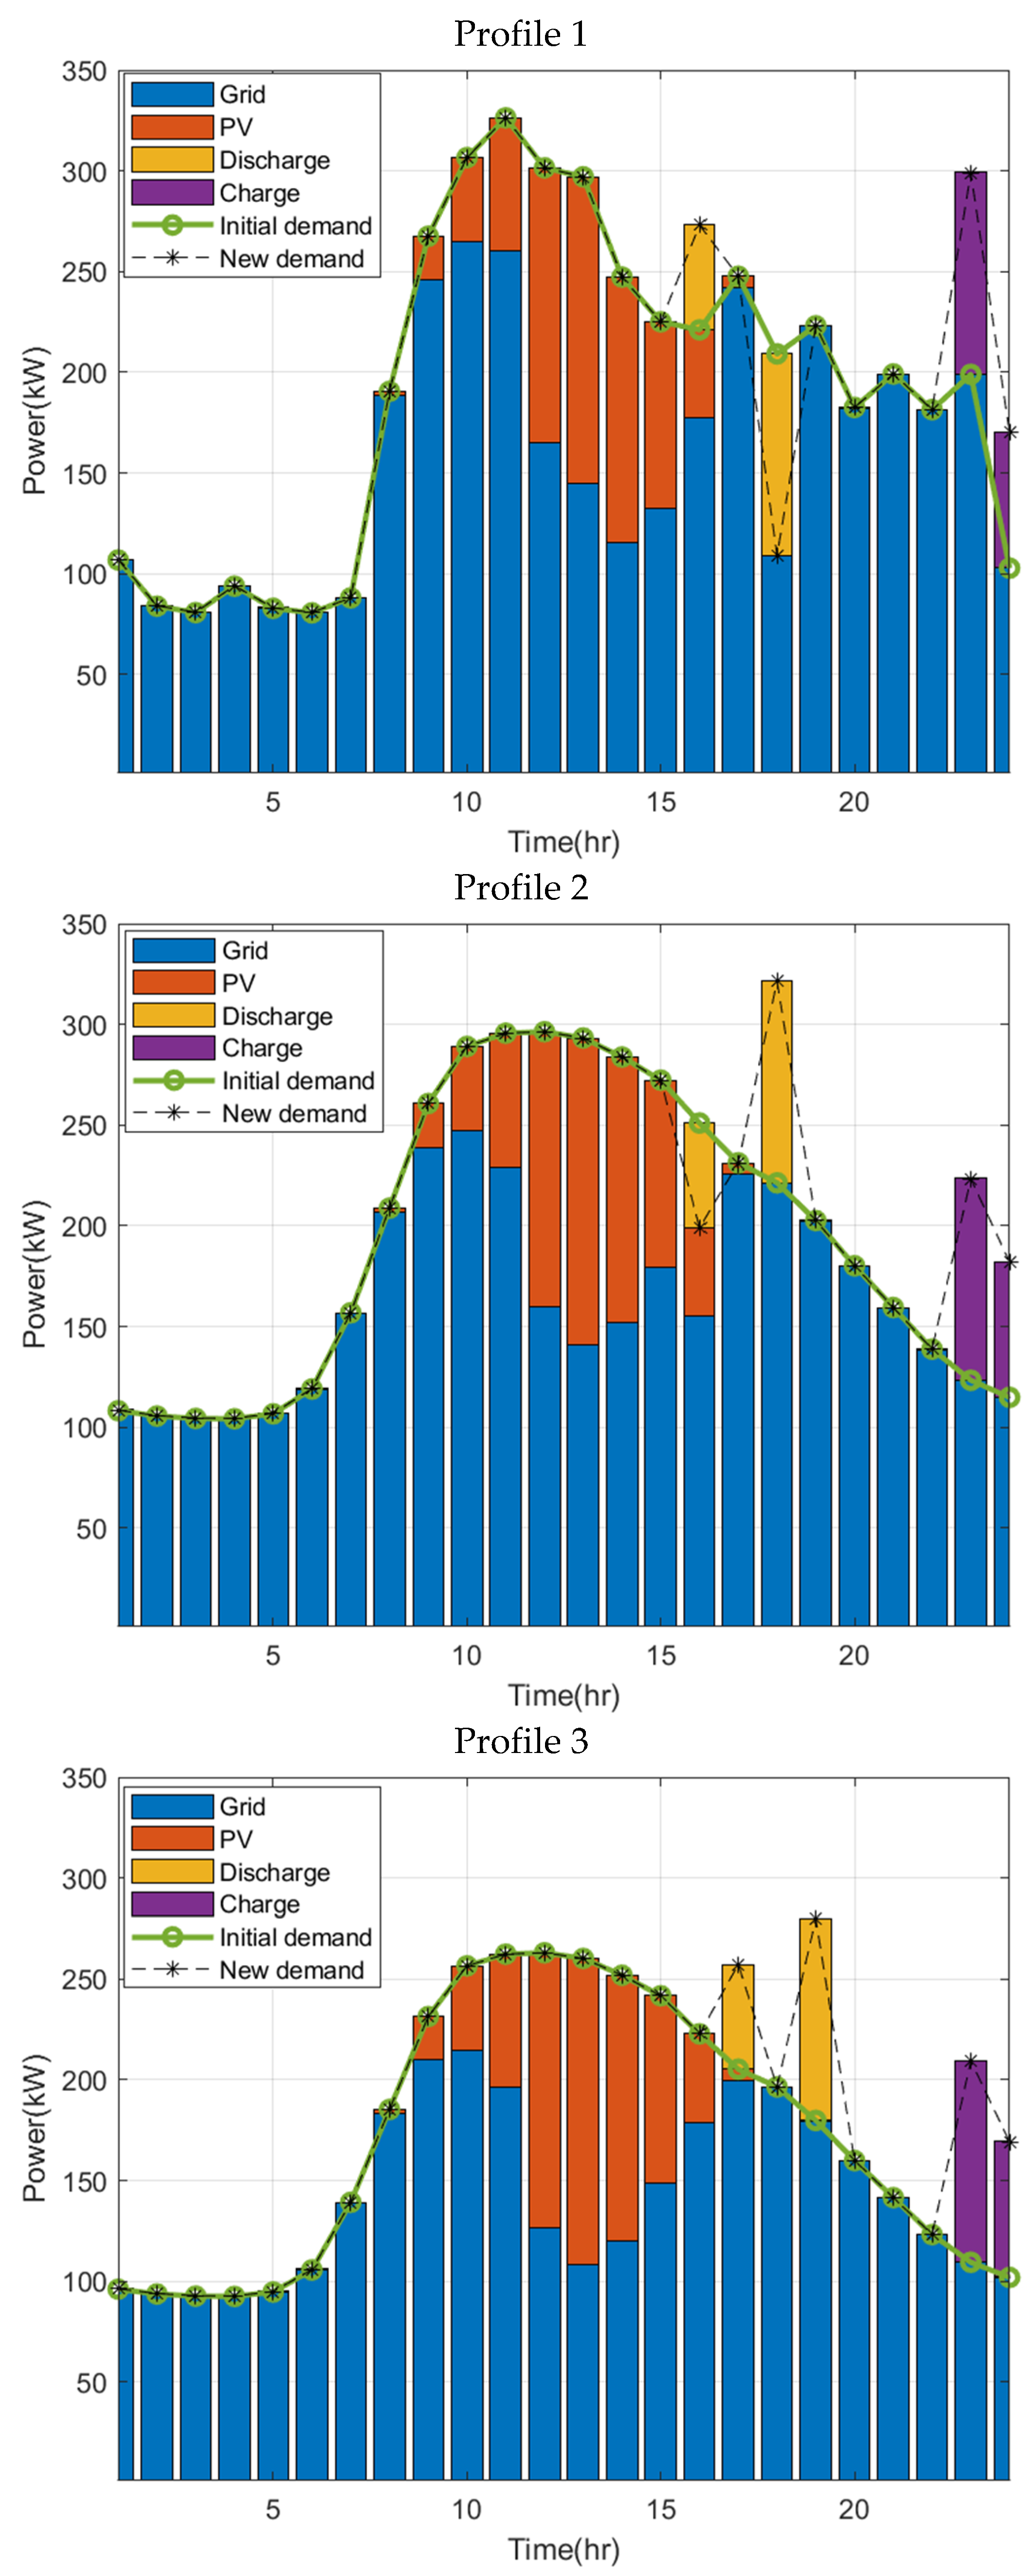
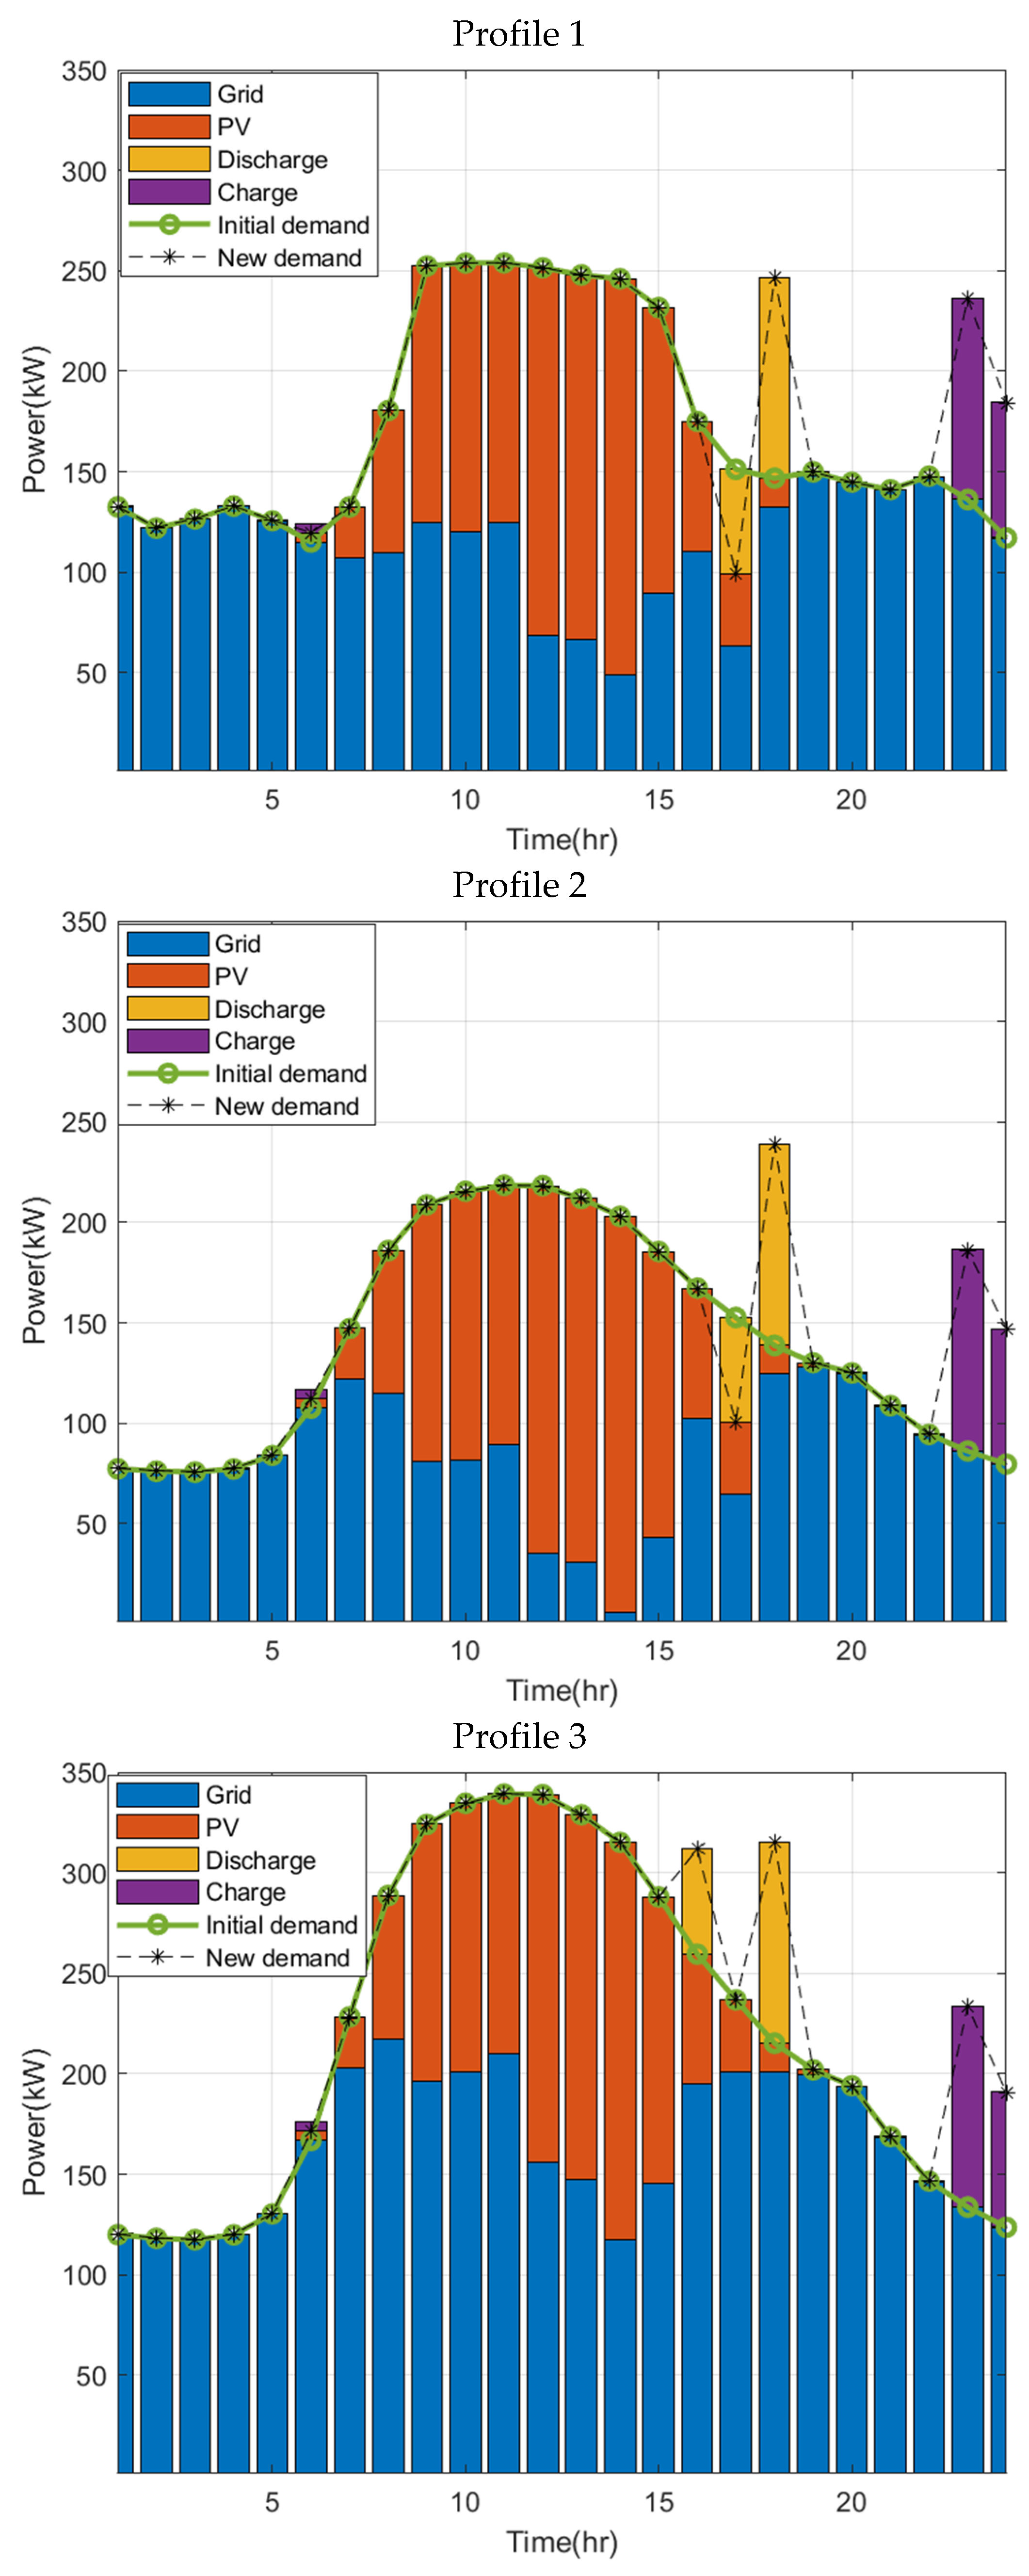
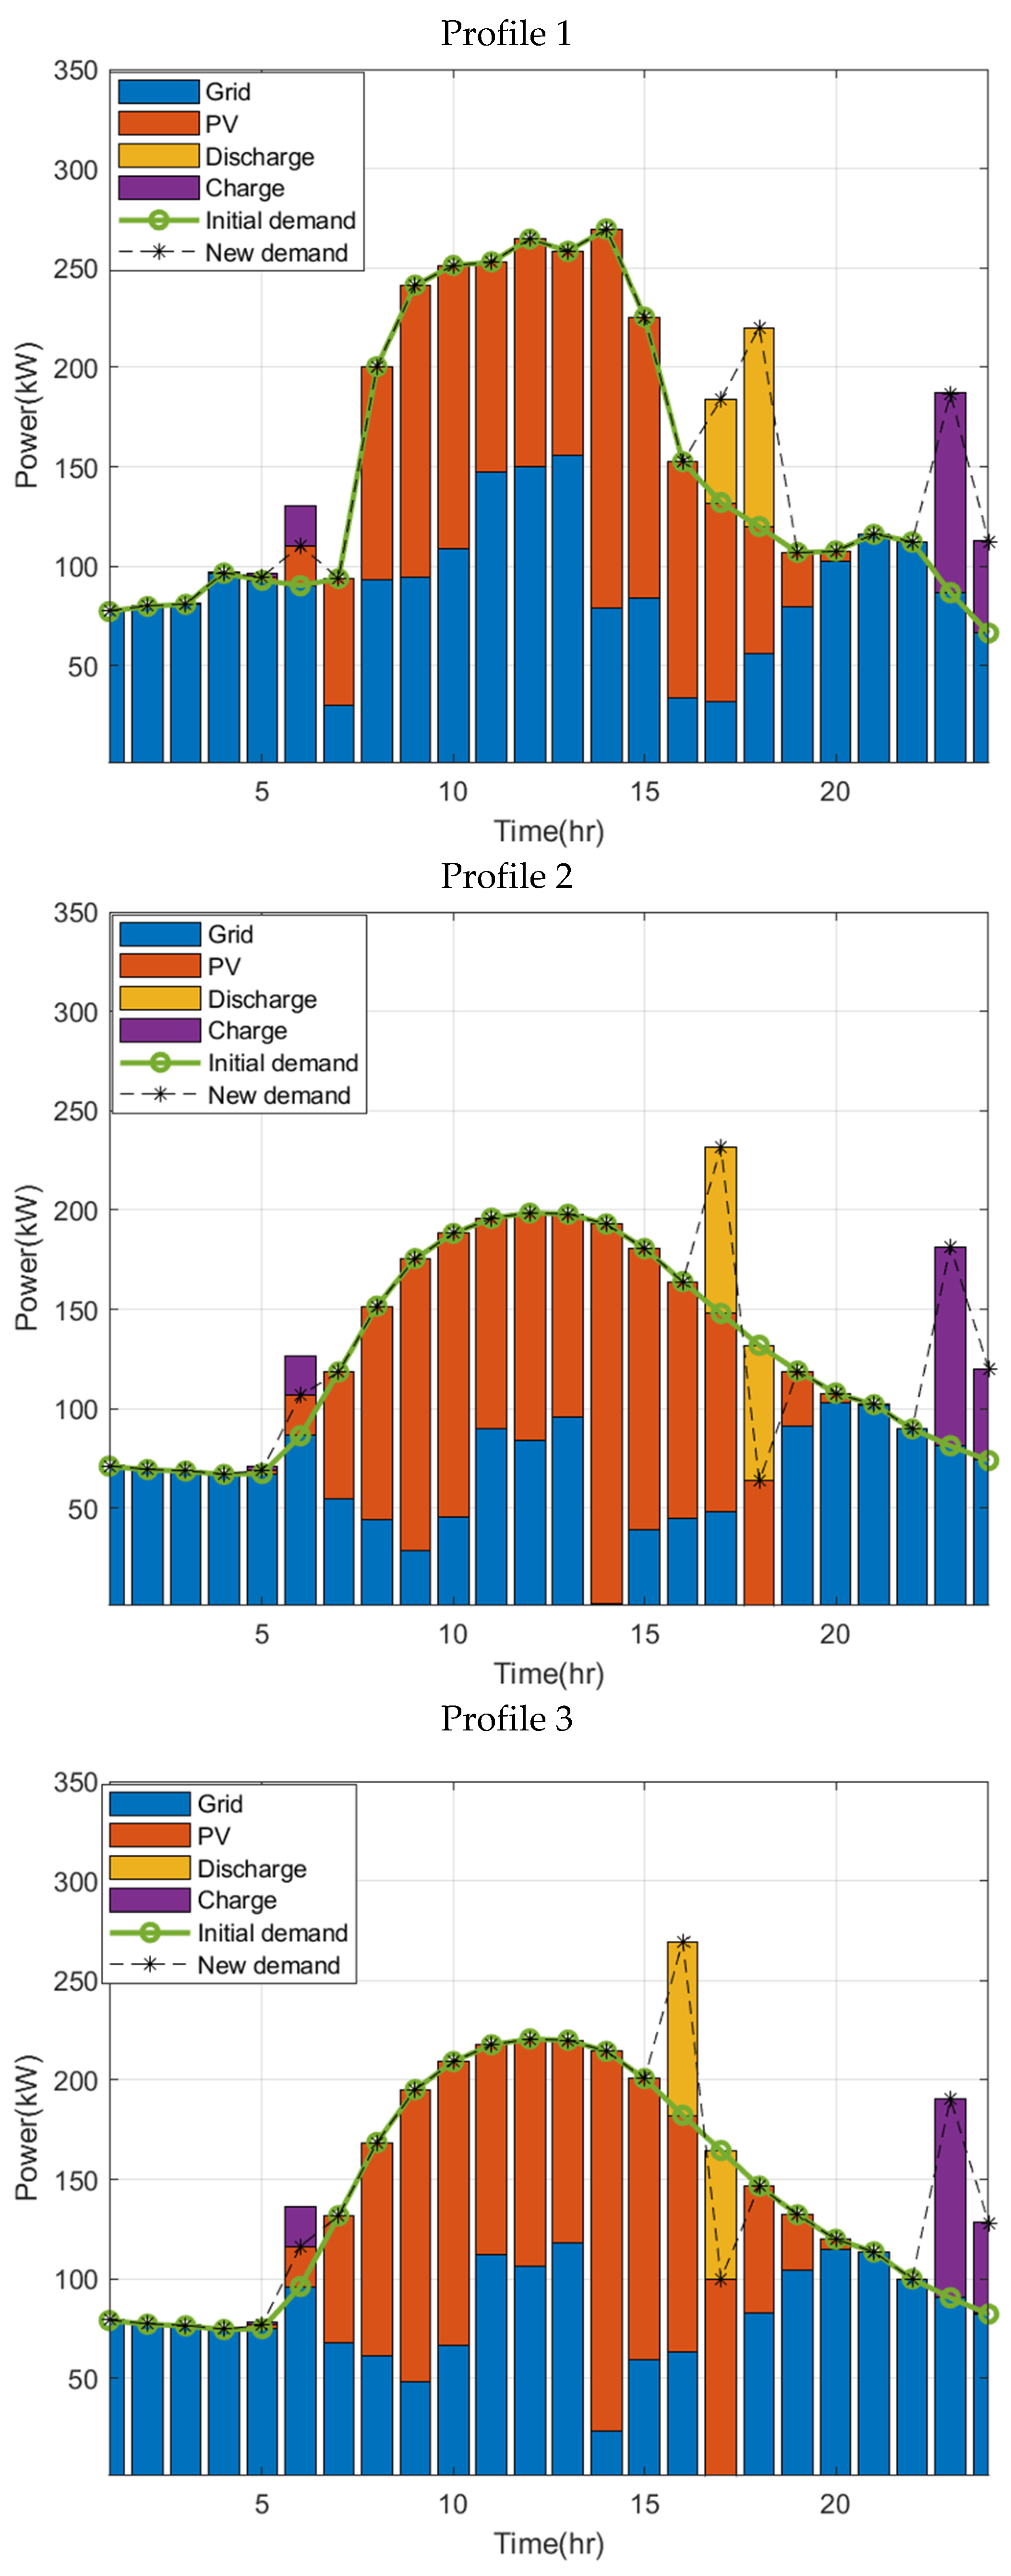
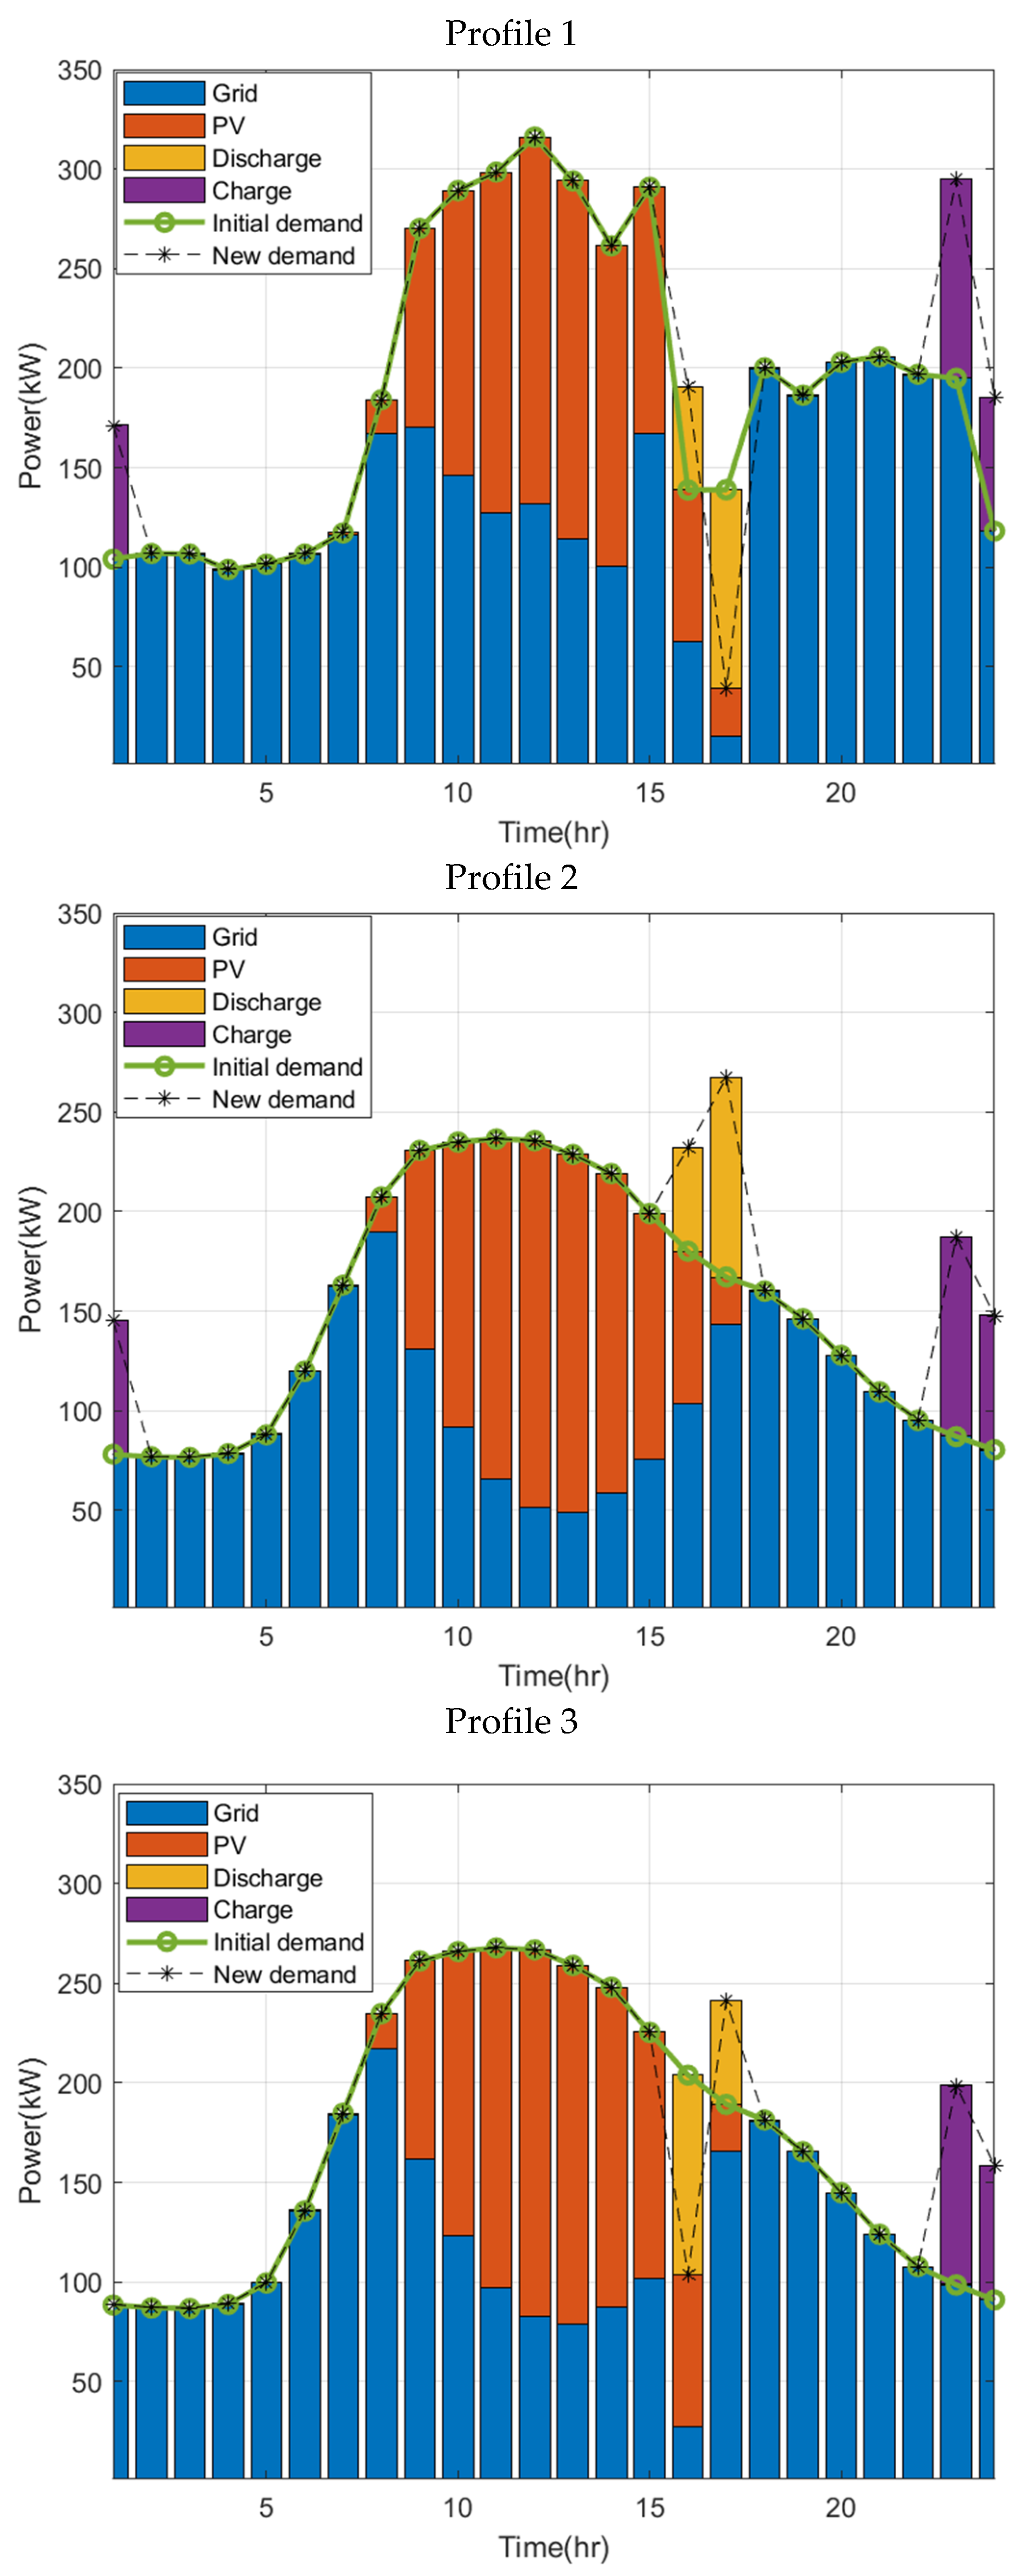
The operation of the investigated systems for different tariffs for different months is presented in Figure 10, Figure 11, Figure 12 and Figure 13. Based on the presented results, the following observations can be indicated:
  • Profile 1 in January (Figure 10) shows that the ESS discharges in hour 16 to sell to the grid and in hour 18 to supply the demand. Profiles 2 and 3 show the exact hours to discharge the ESS. However, the purpose of discharging might be different. For instance, the ESS discharges only to sell the electricity to the grid. Regarding charging action, the charging is carried out during hours 23 and 24 in the three mentioned profiles.
  • Profiles 1 and 2 in April (Figure 11) show the ESS discharges in hour 17 to supply the demand and in hour 18 to sell to the grid. For Profile 3 the ESS discharges to sell to the grid at hour 18 (like other profiles) and at hour 16. Regarding the charging action, the charging is conducted during hours 23 and 24 in the three mentioned profiles.
  • The July profile (Figure 12) shows the ESS discharges in hours 17 and 18 to sell to the grid. Profiles 2 and 3 show the exact hours to discharge the ESS. Although the purpose of discharging for hour 18 was different with respect to charging action, the charging is carried out during hours 6, 23, and 24 in the three mentioned profiles.
  • Profile 1 in January (Figure 13) shows the ESS discharges in hour 16 to sell to the grid and in hour 17 to supply the demand. Profiles 2 and 3 show the exact hours to discharge the ESS but with different purposes of discharging. Regarding charging action, the charging is conducted during hours 1, 23, and 24 in Profiles 1 and 2.
As can be observed, the operation at the point of hours of charging and discharging the ESS as well as the aim of the operation is similar for real data (Profile 1) and Profile 2. There are more differences between Profile 1 and Profile 3.
Additionally, the total operation cost for each profile was calculated and is presented in Table 3. Since the profiles are different, they result in different costs, but it can be seen that the percentage difference in total costs in relation to Profile 1 (real smart meter data) does not exceed 5%.

5. Discussion

Accurate electrical load forecasting is required in modern systems for efficient energy management. Forecasting electrical demand is difficult due to the influence of many factors. The forecasts are then used to manage energy in microgrids, using different scenarios to optimize equipment operation. Most methods proposed in the literature use measured historical data and complex mathematical forecasting algorithms. However, there is a lack of methods that estimate microgrid operation for which measurements are not yet available. This study presents a new approach to construct short-term load forecasts in the absence of accurate measured data. Methods based on hourly standard profiles published by the distribution network operator, contracted capacity information, and energy bills for a selected customer were proposed. A mechanism for correcting forecasts on the basis of current measurements is also introduced. The method takes into account the type of consumer (industrial, utility, or home) by selecting the appropriate standard profile type. The advantage of the proposed algorithms is that they do not require complex mathematical methods and large databases. The analysis results presented confirm the validity of the proposed methods. The publication also presents examples of the use of the constructed load forecasts in a model optimizing the operation of a real industrial microgrid.

6. Conclusions

This paper presents methods for defining load profiles for an industrial consumer in the situation when the real long-term data are not available. Two different methods were proposed to obtain this aim. Both were in the basement of standard profiles that are available in the distribution network operation and maintenance manual. That standard profile is given in 1-hour resolution for each month of the year and day type (working day, Saturday, and Sunday). Therefore, these standards include all changes that are observable in the one-day period as well as the one-year (season) period. However, the standard profile needs additional assumptions to be applied for the definition of customer profile.
The first proposed method used the information from energy bills that is generally available for industrial customers and defined it in a one-month period. Thus, it enables to ensure that the profile for each month in point of total consumption is generally correct. In addition to this approach, the short-term measurements are recommended to check if in a one-year period energy consumption increases, to select more correct data for future months. The second method is based on contracted power, which is predefined by the company as constant or changeable during a one-year period. Additionally, using short-term measurements it can be verified to ensure that contracted power is close to the real needs of the company.
On the basis of the investigations of the impact of load profiles on ESS operation, it was indicated that the more suitable (closer to real profile) profile is based on energy bills and short-term measurements. The same results were indicated for each season type. Thus, as the main conclusion, it can be formulated that in the case of a lack of a year of real measurement load profiles, it can be recommended to use the definition of the pseudo-real profile based on energy bills, standard profiles, and short-term measurements for validation of the ESS operation.

Author Contributions

Conceptualization, M.J., A.N. and T.S.; methodology, M.J., A.N. and T.S.; software, M.J. and A.N.; validation, A.N. and T.S.; formal analysis, M.J. and A.N.; investigation, M.J., A.N. and T.S.; resources, T.S., P.K. and J.R.; data curation, M.J., A.N., P.K. and J.R.; writing—original draft preparation, M.J., A.N., T.S., P.K. and J.R.; writing—review and editing, M.J., A.N. and T.S.; visualization M.J. and A.N.; supervision, M.J. and T.S.; project administration, T.S.; funding acquisition, T.S. All authors have read and agreed to the published version of the manuscript.

Funding

This research was funded by The National Centre for Research and Development in Poland under contract SMARTGRIDSPLUS/4/5/MESH4U/2021 related to the project “Multi Energy Storage Hub For reliable and commercial systems Utilization” (MESH4U), from the funds of ERA-NET Smart Energy System, ERA-NET Smart Grids Plus Joint Call 2019 on Energy Storage Solutions (MICall2019), and European SET-Plan Action 4 “Increase the resilience and security of the energy system”.

Data Availability Statement

The data can be shared by request to the corresponding author.

Acknowledgments

This research uses data provided by Alu-Frost company, Sowlany, Poland (Podlasie Voivodeship), the industry partner of the project, location of the project demonstrator. The collection of the data was under the supervision of the project leader Electrum Ltd. Białystok, Poland (Podlasie Voivodeship).

Conflicts of Interest

The authors declare no conflict of interest.

Nomenclature

Index
tTime index
Parameters
C R F Capital recovery factor
λ t g Grid prices
C C E S S Electrical energy storage capital cost (EUR/kWh)
D e m a n d C a p Purchased demand capacity
η c h / η d c h Charging/discharging efficiency of EES
C h m i n Minimum depth of charge of ESS
MBig numbers
kPercent of charging/discharging in an hour
irInterest rate
nyNumber of planning years
Variables
I C Investment cost
O C Operation cost
T C Total cost
P g t b Buying electricity from the grid
P g t s Selling electricity to the grid
E S S m a x Maximum obtained capacity for ESS
E t d c h , E t d c h , L Discharging electricity, discharging electricity to support the load
E t c h Charging electricity
S O C t State of charge of the ESS
P t P V , L , P t P V , E S S PV generation to support the load, and to charge the ESS
P t g , L , P t g , E S S Purchased electricity from the grid to support the load, to charge the ESS
I t c h , I t d c h Binary variables to charge and discharge of the ESS

Appendix A

Table A1. Standard load profile for C13 based on the distribution network operator and maintenance manual: M—month; D—day type; a—working day; b—Saturday; c—Sunday or holiday.
MD010203040506070809101112131415161718192021222324
Jana0.082490.0804460.0794540.0793020.0810320.0898560.1199670.1642610.2050050.2277080.2338030.2345430.2329240.2268890.2186140.202670.1888670.1735390.1541120.1368570.1213060.1060990.0941870.087726
b0.08490.0822580.0804140.0796070.0796540.0831750.0929050.1005030.1120990.1291670.1399750.1440610.1415830.133920.1234730.1175080.1185940.1204450.1177370.1126810.1073820.0998270.0928730.087866
c0.082970.0805060.0787470.0777430.0769990.077780.0811060.0822490.0825580.0894380.0962750.0996070.1005770.0998890.0992680.100240.1052720.109250.1081420.1044130.0992890.0938490.0874770.083046
Feba0.081650.0796490.0787370.0786220.080490.0897710.1183270.1574770.1966620.2180310.222980.223540.221180.2140730.2054150.1893480.1744350.1669690.1528270.1359080.120290.1046980.093020.086634
b0.08290.0805410.0790260.0783560.0784890.0822680.0906270.096170.1095640.1254620.1354070.1384460.1355870.1285190.1183390.1119420.1094730.1146320.1154990.1103950.1052740.0978790.0909650.085678
c0.08170.0792180.0774730.0764580.0757860.0765740.0784960.0778570.0804540.0867190.0935830.0974890.0978930.0970920.0961790.096280.097310.1037070.1054810.1025540.0974190.0916420.0856730.081127
Mara0.075660.0736480.0726590.0725770.0743450.0821790.1055680.1426230.180210.201170.2067140.2085780.2080230.2019670.1935910.1766820.1602410.1493410.1426770.1293870.1144920.098910.0870250.080331
b0.078330.0757280.0741560.0733170.0737490.0758950.0797260.0870490.0998050.1140970.1232670.1262870.1241830.11810.1092430.1029570.0995660.0996740.105450.1036710.099130.0920650.0852820.08019
c0.076480.0742530.0732130.0719780.0714250.0712190.0684660.0699330.073050.0789560.0846070.0879180.0881910.0881790.087840.0876260.0877840.0899480.0952830.0952980.0919070.0863540.0804080.076042
Apra0.066610.0646610.0636550.0632970.0645950.0702310.0899390.123090.1555170.1746090.1802350.1827380.1825590.1771730.1697870.1551270.1399090.1276530.1160190.1088730.1046040.0909960.0790.072045
b0.068440.0658510.064150.0631030.0631170.0637450.0665320.0738890.0859820.0995530.1087190.1122430.1105110.105450.0976840.0914810.0873350.0851540.0840660.0841890.088270.0831440.0762530.070443
c0.06690.0646540.0629660.061820.0612010.0590170.0562180.0584060.0625570.06850.074210.0779630.0787480.0787190.0784240.0777280.0768770.0760960.0756340.0769940.0813380.0776210.0712730.066575
Maya0.065290.0629230.0617070.0611570.0603360.0619910.0838240.1171340.1510010.1723720.179620.1839760.1854150.1812930.1744220.1589670.1428620.1295990.1164380.1055580.0976560.0903980.0784450.070992
b0.066930.064130.0621890.0611950.0593890.0564540.0621380.0705480.083310.0970790.1072550.1117260.1108390.1067860.099890.093950.0898530.0875840.086180.0839350.0841670.0836430.076640.070654
c0.065910.0631970.0612550.0600770.0577410.052590.0536590.0574540.0629020.070070.0770890.0815950.0828680.0829250.0823360.0818870.0807580.0796910.0787340.0774530.0769630.0782220.071770.066507
Juna0.064450.0618040.0602970.0595070.0565980.0585710.0796510.1113720.1436070.1657960.175010.1804980.1832720.1806330.1750360.1612790.1458580.1322170.117630.1058290.0947430.0883170.0784670.07062
b0.067660.0644930.0622750.0607450.056630.0544570.0615150.0705290.0841560.0993770.1107930.1157840.11550.1116260.1043290.0977370.0928310.0896770.0874280.0846560.0822440.0820840.0771820.070927
c0.066430.0633960.0614530.0597580.0550980.0507140.0520740.0556430.0609930.0685210.0763080.0812250.0831320.0837840.0840860.0833340.0828990.0810620.0792780.0774380.0744190.0760250.0713340.065883
Jula0.063470.0609710.0595210.0588790.0574550.0578160.074150.1015970.1299790.1504780.1613190.1678750.1701090.1696410.1653360.1547770.1405270.1268670.113070.1019750.0924740.0875550.0770860.06975
b0.065770.0627330.0608730.0595970.0568690.0536160.0597410.068390.0815930.0973550.1092960.1143010.1142050.1102980.103180.0963820.0918870.0889890.0866820.0837250.081230.0816870.0755790.069532
c0.064870.0619780.0601350.0586330.0553830.0500990.0507040.0538510.0585880.0663760.0742190.0792440.0811860.0815660.0818520.0816440.0806840.079370.0780180.0765480.0735950.0761220.0711140.06561
Auga0.064730.0621860.0607790.0600560.060580.0623740.0765250.1037960.1332370.1549980.1671580.1748180.1773370.1765310.1720380.1608230.1459880.1319880.1177470.1070560.1015640.0911270.0783040.07096
b0.068350.0653940.0634170.062040.0614620.0603310.0640510.0720940.0850940.1000510.1117270.1167740.1159260.1119230.1047340.0987650.0943570.0912710.0888570.0869610.0887610.085280.0770140.070876
c0.066180.0634350.0615470.0602240.0591750.0551640.0530430.0555370.0602290.0674950.0748040.0795940.0815830.0826290.082830.0822510.0810550.079920.0787760.0774390.0795270.0774410.0703560.064834
Sepa0.062590.0605390.0593410.0589960.0601360.0666220.086560.1184350.1519240.1722460.1781570.1817320.1830.1787180.1716150.1556380.1396920.1265850.1163160.1125580.1016130.0867420.0748650.067923
b0.065240.0626950.0609520.0598790.0598950.061780.0654250.0714480.0837960.0973560.1064740.1108540.1095920.1056410.0986890.0928320.0886920.0863020.0863240.0899460.0882060.0810630.073850.06857
c0.064170.0616780.0598440.0586020.0578510.0576830.0553470.0553860.0591020.0653170.0716480.0759640.0774180.0778830.0778860.0776080.076990.0763310.0774030.0823660.0803160.074610.0682380.063744
Octa0.066260.064410.0633770.0631420.0646510.0724940.0987290.1344180.1707920.1900620.1935250.1948410.1941510.188410.1804360.1640180.1483640.1377050.1319480.1204570.1053510.0902550.0784490.071754
b0.069320.0668130.0650630.0639140.0639620.0668340.0745140.0796540.0904220.1043620.11410.1176320.1159240.1121290.1045960.0977340.0934980.0937380.0990250.0972520.0923140.0850320.0776240.072331
c0.067740.0653280.0637640.0625470.0619610.0626220.0638170.0631790.0663570.0731940.0795530.0834230.0842820.0845090.0840280.0835560.0832970.0845170.0891890.0893180.0843520.0788710.0723750.067797
Nova0.071890.0698970.0688710.0686040.0703860.0792270.1071540.1448090.1854810.2071440.2126790.2141470.213610.2088780.2034480.190060.1797850.1640740.1456680.1286190.1121850.0962820.0841960.077678
b0.072950.0704890.0688090.0680730.0680550.0716990.0789280.0844380.0977660.1118010.1214560.12480.1235410.1181860.1103960.1058040.1084840.1082870.1050440.1007810.0955340.0886680.0817870.076321
c0.072140.0697550.0680510.0669660.06630.0672050.0685840.0671980.0706430.0768460.0835430.0877780.0894030.0897190.0894980.0908240.0974630.0987340.0964940.0940320.0886450.0829790.0763780.071749
Deca0.077750.0756340.0743720.0742470.0759550.0848960.1139340.1559430.1971260.2204340.2269990.2293730.2279980.2228580.2158060.2020830.1900940.1716880.1525620.1346120.118220.1031630.0906230.083503
b0.079720.0769710.0749830.0738860.0738610.077650.0868130.0945280.1064420.1226390.1343110.1379890.1367490.1309560.1219320.1181270.1192990.1166570.11310.1076420.1021470.0951140.0874440.081393
c0.078460.0757680.0741360.0726460.0721430.0732030.0767650.0785970.0793070.0868820.0948390.0985630.0996410.0996940.0998860.1028780.1086190.107870.1058970.1022190.0965120.0904210.0835920.078721

Appendix B

Table A2. Assumed profile in a one-year period with 1-hour resolution, as representative of a B23 consumer: M—month; D—day type; a—working day; b—Saturday; c—Sunday or holiday.
MD010203040506070809101112131415161718192021222324
Jana101.0198.5097.2997.1099.22110.03146.90201.14251.03278.83286.29287.19285.21277.82267.69248.17231.26212.50188.71167.58148.54129.92115.33107.42
b103.96100.7298.4797.4897.54101.85113.76123.06137.26158.16171.40176.40173.37163.98151.19143.89145.22147.48144.17137.98131.49122.24113.72107.59
c101.6098.5896.4295.2094.2895.2499.31100.71101.09109.52117.89121.97123.16122.31121.55122.74128.90133.78132.42127.85121.58114.92107.11101.69
Feba108.25105.60104.39104.24106.71119.02156.88208.79260.74289.07295.63296.37293.24283.82272.34251.04231.27221.37202.62180.19159.48138.81123.33114.86
b109.91106.78104.77103.89104.06109.07120.15127.50145.26166.34179.52183.55179.76170.39156.90148.41145.14151.98153.13146.36139.57129.77120.60113.59
c108.32105.03102.71101.37100.48101.52104.07103.22106.67114.97124.07129.25129.79128.73127.52127.65129.01137.50139.85135.97129.16121.50113.59107.56
Mara97.6095.0093.7393.6295.90106.01136.18183.98232.47259.51266.66269.06268.35260.53249.73227.92206.71192.65184.05166.91147.69127.59112.26103.63
b101.0497.6995.6694.5895.1397.90102.85112.29128.75147.18159.01162.91160.19152.35140.92132.81128.44128.58136.03133.73127.88118.76110.01103.44
c98.6695.7894.4492.8592.1491.8788.3290.2194.23101.85109.14113.41113.76113.75113.31113.04113.24116.03122.91122.93118.56111.40103.7298.09
Apra79.6277.2976.0975.6677.2183.95107.51147.13185.90208.72215.44218.43218.22211.78202.95185.43167.24152.59138.68130.14125.04108.7794.4386.12
b81.8178.7176.6875.4375.4576.2079.5388.32102.78119.00129.96134.17132.10126.05116.77109.35104.39101.79100.49100.63105.5199.3991.1584.20
c79.9777.2875.2773.9073.1670.5567.2069.8274.7881.8888.7193.1994.1394.1093.7492.9191.8990.9690.4192.0397.2392.7885.2079.58
Maya66.9964.5663.3162.7561.9163.6086.00120.18154.93176.86184.29188.76190.24186.01178.96163.10146.58132.97119.47108.30100.2092.7580.4972.84
b68.6765.8063.8162.7960.9357.9263.7572.3885.4899.60110.04114.63113.72109.56102.4996.3992.1989.8688.4286.1286.3685.8278.6372.49
c67.6264.8462.8561.6459.2453.9655.0558.9564.5471.8979.0983.7285.0285.0884.4884.0282.8681.7680.7879.4778.9680.2673.6468.24
Juna51.0448.9447.7547.1344.8246.3863.0888.20113.73131.30138.59142.94145.14143.05138.62127.72115.51104.7193.1583.8175.0369.9462.1455.93
b53.5851.0749.3248.1144.8543.1348.7255.8566.6578.7087.7491.6991.4788.4082.6277.4073.5271.0269.2467.0465.1365.0061.1256.17
c52.6150.2048.6747.3243.6340.1641.2444.0748.3054.2660.4364.3265.8366.3566.5965.9965.6564.2062.7861.3358.9360.2156.4952.17
Jula74.0771.1569.4668.7167.0567.4786.53118.56151.68175.60188.25195.91198.51197.97192.94180.62163.99148.05131.95119.00107.91102.1789.9681.40
b76.7573.2171.0469.5566.3662.5769.7279.8195.22113.61127.55133.39133.27128.71120.41112.47107.23103.85101.1697.7094.7995.3388.2081.14
c75.7072.3370.1868.4264.6358.4659.1762.8468.3777.4686.6192.4894.7495.1995.5295.2894.1692.6291.0489.3385.8888.8382.9976.56
Auga77.1074.0772.3971.5372.1574.2991.15123.63158.69184.61199.10208.22211.22210.26204.91191.55173.88157.21140.24127.51120.97108.5493.2784.52
b81.4177.8975.5373.8973.2171.8676.2985.87101.35119.17133.07139.09138.08133.31124.74117.64112.39108.71105.83103.58105.72101.5791.7384.42
c78.8275.5673.3171.7370.4865.7063.1866.1571.7480.3989.1094.8097.1798.4298.6697.9796.5495.1993.8392.2394.7292.2483.8077.22
Sepa47.4345.8844.9744.7145.5750.4965.6089.75115.13130.53135.01137.72138.68135.44130.06117.95105.8695.9388.1585.3077.0165.7456.7451.47
b49.4447.5146.1945.3845.3946.8249.5854.1563.5073.7880.6984.0183.0580.0674.7970.3567.2165.4065.4268.1666.8561.4355.9751.96
c48.6346.7445.3544.4143.8443.7141.9441.9744.7949.5054.3057.5758.6759.0259.0258.8158.3557.8558.6662.4260.8756.5451.7148.31
Octa57.4755.8754.9754.7756.0762.8885.63116.59148.13164.85167.85168.99168.39163.42156.50142.26128.68119.44114.44104.4891.3878.2868.0462.24
b60.1257.9556.4355.4455.4857.9764.6369.0978.4390.5298.96102.03100.5597.2590.7284.7781.0981.3085.8984.3580.0773.7567.3362.74
c58.7556.6655.3154.2553.7454.3155.3554.8057.5563.4869.0072.3673.1073.3072.8872.4772.2573.3077.3677.4773.1668.4162.7758.80
Nova77.3175.1774.0673.7775.6985.20115.23155.72199.46222.76228.71230.29229.71224.62218.78204.39193.34176.44156.65138.31120.64103.5490.5483.53
b78.4575.8074.0073.2073.1877.1084.8890.80105.13120.23130.61134.21132.85127.09118.72113.78116.66116.45112.96108.38102.7395.3587.9582.07
c77.5875.0173.1872.0171.3072.2773.7572.2675.9782.6489.8494.3996.1496.4896.2497.67104.81106.18103.77101.1295.3389.2382.1377.16
Deca77.1775.0673.8173.6975.3884.26113.08154.77195.64218.78225.29227.65226.28221.18214.18200.56188.66170.40151.41133.60117.33102.3989.9482.87
b79.1276.3974.4273.3373.3177.0786.1693.82105.64121.72133.30136.95135.72129.97121.01117.24118.40115.78112.25106.83101.3894.4086.7980.78
c77.8775.2073.5872.1071.6072.6576.1978.0178.7186.2394.1397.8298.8998.9499.13102.10107.80107.06105.10101.4595.7989.7482.9678.13

Appendix C

Table A3. Assumed profile in one-year period with 1-hour resolution, as representative of a B23 consumer: M—month; D—day type; a—working day; b—Saturday; c—Sunday or holiday.
MD010203040506070809101112131415161718192021222324
Jana93.5791.2590.1289.9591.91101.92136.08186.32232.53258.29265.20266.04264.20257.36247.97229.89214.23196.84174.81155.24137.60120.35106.8499.51
b51.8450.2349.1048.6148.6450.7956.7361.3768.4578.8785.4787.9786.4581.7775.4071.7572.4273.5571.8968.8165.5760.9656.7153.65
c51.5249.9948.9048.2747.8148.3050.3651.0751.2655.5459.7861.8562.4562.0261.6462.2465.3767.8467.1564.8361.6558.2754.3251.57
Feba96.0993.7392.6692.5294.72105.65139.25185.32231.44256.59262.41263.07260.29251.93241.74222.83205.28196.49179.85159.94141.56123.21109.47101.95
b52.2650.7849.8249.4049.4851.8657.1360.6369.0779.1085.3787.2885.4881.0274.6170.5769.0272.2772.8169.6066.3761.7157.3554.01
c52.2250.6349.5248.8748.4448.9450.1749.7651.4255.4259.8162.3162.5762.0561.4761.5462.1966.2867.4265.5462.2658.5754.7651.85
Mara122.36119.11117.51117.38120.24132.91170.73230.66291.45325.35334.31337.33336.43326.64313.09285.74259.15241.53230.75209.25185.16159.96140.74129.92
b68.4566.1864.8064.0764.4566.3269.6776.0787.2299.70107.72110.36108.52103.2095.4689.9787.0187.1092.1590.5986.6380.4574.5270.07
c67.9966.0165.0863.9863.4963.3160.8662.1764.9470.1975.2178.1578.4078.3978.0977.8978.0479.9684.7084.7181.7076.7671.4867.60
Apra123.59119.97118.11117.44119.85130.31166.87228.38288.55323.97334.41339.06338.72328.73315.03287.83259.59236.85215.26202.00194.08168.84146.58133.67
b68.8366.2364.5163.4663.4864.1166.9174.3186.47100.12109.34112.88111.14106.0598.2492.0087.8385.6484.5484.6788.7783.6276.6970.84
c68.8366.5264.7863.6062.9660.7257.8460.0964.3670.4776.3580.2181.0180.9980.6879.9779.0978.2977.8179.2183.6879.8673.3268.49
Maya79.2176.3474.8774.2073.2075.21101.70142.11183.20209.13217.93223.21224.96219.96211.62192.87173.33157.24141.27128.07118.48109.6895.1786.13
b44.0642.2140.9440.2839.0937.1640.9046.4454.8463.9070.6073.5472.9670.2965.7561.8459.1557.6556.7355.2555.4055.0650.4546.51
c43.5341.7440.4639.6838.1434.7435.4437.9541.5546.2850.9253.9054.7454.7754.3854.0953.3452.6452.0151.1650.8451.6747.4143.93
Juna79.4076.1474.2873.3169.7272.1698.12137.20176.91204.25215.60222.36225.78222.53215.63198.68179.69162.88144.91130.37116.72108.8096.6787.00
b43.9141.8640.4239.4236.7535.3439.9245.7754.6264.5071.9175.1474.9672.4567.7163.4360.2558.2056.7454.9453.3853.2750.0946.03
c44.1242.1140.8239.6936.5933.6834.5936.9640.5145.5150.6853.9555.2155.6555.8555.3555.0653.8452.6551.4349.4350.4947.3843.76
Jula82.3379.0977.2176.3874.5375.0096.19131.79168.61195.20209.26217.76220.66220.05214.47200.77182.29164.57146.67132.28119.95113.5799.9990.48
b43.3641.3640.1339.2937.4935.3539.3845.0953.7964.1872.0575.3575.2972.7168.0263.5460.5858.6757.1455.2053.5553.8549.8345.84
c43.9441.9840.7339.7137.5133.9334.3436.4739.6844.9650.2753.6754.9955.2555.4455.3054.6553.7652.8451.8549.8551.5648.1744.44
Auga80.8777.6975.9375.0375.6977.9395.61129.68166.46193.65208.84218.41221.56220.55214.93200.92182.39164.90147.11133.75126.89113.8597.8388.65
b43.4741.5940.3439.4639.0938.3740.7445.8554.1263.6471.0674.2773.7371.1966.6162.8260.0158.0556.5255.3156.4654.2448.9845.08
c43.9342.1140.8639.9839.2836.6235.2136.8739.9844.8149.6652.8454.1654.8554.9954.6053.8153.0652.3051.4152.8051.4146.7143.04
Sepa76.5174.0072.5472.1273.5181.44105.81144.77185.71210.55217.78222.15223.70218.46209.78190.25170.76154.73142.18137.59124.21106.0391.5183.03
b42.9741.2940.1439.4439.4540.6943.0947.0555.1964.1270.1273.0172.1869.5764.9961.1458.4156.8456.8559.2458.0953.3948.6445.16
c43.6741.9840.7339.8839.3739.2637.6737.7040.2344.4548.7651.7052.6953.0153.0152.8252.4051.9552.6856.0654.6650.7846.4443.38
Octa91.1088.5587.1386.8188.8899.67135.74184.80234.81261.30266.06267.87266.93259.03248.07225.50203.98189.32181.41165.61144.84124.09107.8598.65
b51.6249.7548.4547.5947.6349.7755.4959.3167.3377.7184.9687.5986.3283.5077.8972.7869.6269.8073.7472.4268.7463.3257.8053.86
c51.3449.5248.3347.4146.9647.4648.3747.8950.3055.4860.3063.2363.8864.0563.6963.3363.1464.0667.6067.7063.9459.7854.8651.39
Nova89.3686.8985.6185.2887.4998.48133.20180.00230.56257.49264.37266.20265.53259.65252.90236.25223.48203.95181.07159.88139.45119.68104.6696.56
b50.8649.1447.9747.4647.4449.9855.0258.8768.1677.9484.6787.0086.1382.3976.9673.7675.6375.4973.2370.2666.6061.8157.0253.21
c50.9649.2748.0747.3046.8347.4748.4547.4749.9054.2859.0162.0163.1563.3863.2264.1668.8569.7568.1666.4262.6258.6253.9550.68
Deca90.7488.2786.8086.6588.6599.08132.97182.00230.06257.27264.93267.70266.09260.09251.86235.85221.86200.37178.05157.10137.97120.40105.7697.46
b50.8949.1447.8747.1747.1549.5755.4260.3467.9578.2985.7488.0987.3083.6077.8475.4176.1674.4772.2068.7265.2160.7255.8251.96
c50.0748.3647.3146.3646.0446.7248.9950.1650.6155.4560.5362.9063.5963.6263.7565.6669.3268.8467.5865.2461.5957.7153.3550.24

References

  1. Hrnčić, B.; Pfeifer, A.; Jurić, F.; Duić, N.; Ivanović, V.; Vušanović, I. Different investment dynamics in energy transition towards a 100% renewable energy system. Energy 2021, 237, 121526. [Google Scholar] [CrossRef]
  2. Sánchez, A.; Zhang, Q.; Martín, M.; Vega, P. Towards a new renewable power system using energy storage: An economic and social analysis. Energy Convers. Manag. 2022, 252, 115056. [Google Scholar] [CrossRef]
  3. Burgio, A.; Cimmino, D.; Jasinski, M.; Leonowicz, Z.; Siano, P. A Heuristic Method to Calculate the Capacity of Residential PV-BESS in Providing Upward Flexibility Services in Energy Communities. IEEE Access 2022, 10, 2908–2928. [Google Scholar] [CrossRef]
  4. Moayedi, H.; Mosavi, A. Double-Target Based Neural Networks in Predicting Energy Consumption in Residential Buildings. Energies 2021, 14, 1331. [Google Scholar] [CrossRef]
  5. Jasinski, M.; Martirano, L.; Najafi, A.; Homaee, O.; Leonowicz, Z.; Kermani, M. Microgrid Working Conditions Identification Based on Cluster Analysis—A Case Study From Lambda Microgrid. IEEE Access 2022, 10, 70971–70979. [Google Scholar] [CrossRef]
  6. Najafi, A.; Pourakbari-Kasmaei, M.; Jasinski, M.; Lehtonen, M.; Leonowicz, Z. A max–min–max robust optimization model for multi-carrier energy systems integrated with power to gas storage system. J. Energy Storage 2022, 48, 103933. [Google Scholar] [CrossRef]
  7. Ahmed, N.; Sheikh, A.A.; Mahboob, F.; Ali, M.S.E.; Jasińska, E.; Jasiński, M.; Leonowicz, Z.; Burgio, A. Energy Diversification: A Friend or Foe to Economic Growth in Nordic Countries? A Novel Energy Diversification Approach. Energies 2022, 15, 5422. [Google Scholar] [CrossRef]
  8. Wei, X.; Xiang, Y.; Li, J.; Liu, J. Wind power bidding coordinated with energy storage system operation in real-time electricity market: A maximum entropy deep reinforcement learning approach. Energy Rep. 2022, 8, 770–775. [Google Scholar] [CrossRef]
  9. Kumar, P.P.; Suresh, V.; Jasinski, M.; Leonowicz, Z. Off-Grid Rural Electrification in India Using Renewable Energy Resources and Different Battery Technologies with a Dynamic Differential Annealed Optimization. Energies 2021, 14, 5866. [Google Scholar] [CrossRef]
  10. Li, B.; Li, J. Sizing and operation of a pure renewable energy based electric system through hydrogen. Energy Rep. 2022, 8, 1391–1403. [Google Scholar] [CrossRef]
  11. Radmehr, R.; Shayanmehr, S.; Ali, E.B.; Ofori, E.K.; Jasińska, E.; Jasiński, M. Exploring the Nexus of Renewable Energy, Ecological Footprint, and Economic Growth through Globalization and Human Capital in G7 Economics. Sustainability 2022, 14, 12227. [Google Scholar] [CrossRef]
  12. Choudhury, S. Review of energy storage system technologies integration to microgrid: Types, control strategies, issues, and future prospects. J. Energy Storage 2022, 48, 103966. [Google Scholar] [CrossRef]
  13. Kraiem, H.; Flah, A.; Mohamed, N.; Messaoud, M.H.B.; Al-Ammar, E.A.; Althobaiti, A.; Alotaibi, A.A.; Jasiński, M.; Suresh, V.; Leonowicz, Z.; et al. Decreasing the Battery Recharge Time if Using a Fuzzy Based Power Management Loop for an Isolated Micro-Grid Farm. Sustainability 2022, 14, 2870. [Google Scholar] [CrossRef]
  14. He, W.; King, M.; Luo, X.; Dooner, M.; Li, D.; Wang, J. Technologies and economics of electric energy storages in power systems: Review and perspective. Adv. Appl. Energy 2021, 4, 100060. [Google Scholar] [CrossRef]
  15. Stecca, M.; Ramirez Elizondo, L.; Batista Soeiro, T.; Bauer, P.; Palensky, P. A Comprehensive Review of the Integration of Battery Energy Storage Systems into Distribution Networks. IEEE Open J. Ind. Electron. Soc. 2020, 1, 46–65. [Google Scholar] [CrossRef]
  16. Najafi, A.; Pourakbari-Kasmaei, M.; Jasinski, M.; Lehtonen, M.; Leonowicz, Z. A medium-term hybrid IGDT-Robust optimization model for optimal self scheduling of multi-carrier energy systems. Energy 2022, 238, 121661. [Google Scholar] [CrossRef]
  17. Anoune, K.; Bouya, M.; Astito, A.; Abdellah, A. Ben Sizing methods and optimization techniques for PV-wind based hybrid renewable energy system: A review. Renew. Sustain. Energy Rev. 2018, 93, 652–673. [Google Scholar] [CrossRef]
  18. Kong, W.; Dong, Z.Y.; Jia, Y.; Hill, D.J.; Xu, Y.; Zhang, Y. Short-Term Residential Load Forecasting Based on LSTM Recurrent Neural Network. IEEE Trans. Smart Grid 2019, 10, 841–851. [Google Scholar] [CrossRef]
  19. Wang, J.; Chen, X.; Zhang, F.; Chen, F.; Xin, Y. Building Load Forecasting Using Deep Neural Network with Efficient Feature Fusion. J. Mod. Power Syst. Clean Energy 2021, 9, 160–169. [Google Scholar] [CrossRef]
  20. González-Romera, E.; Jaramillo-Morán, M.A.; Carmona-Fernández, D. Monthly electric energy demand forecasting with neural networks and Fourier series. Energy Convers. Manag. 2008, 49, 3135–3142. [Google Scholar] [CrossRef]
  21. Chen, Y.; Luh, P.B.; Guan, C.; Zhao, Y.; Michel, L.D.; Coolbeth, M.A.; Friedland, P.B.; Rourke, S.J. Short-Term Load Forecasting: Similar Day-Based Wavelet Neural Networks. IEEE Trans. Power Syst. 2010, 25, 322–330. [Google Scholar] [CrossRef]
  22. Lin, W.; Wu, D.; Boulet, B. Spatial-Temporal Residential Short-Term Load Forecasting via Graph Neural Networks. IEEE Trans. Smart Grid 2021, 12, 5373–5384. [Google Scholar] [CrossRef]
  23. Li, J.; Deng, D.; Zhao, J.; Cai, D.; Hu, W.; Zhang, M.; Huang, Q. A Novel Hybrid Short-Term Load Forecasting Method of Smart Grid Using MLR and LSTM Neural Network. IEEE Trans. Ind. Inform. 2021, 17, 2443–2452. [Google Scholar] [CrossRef]
  24. Zhang, G.; Guo, J. A Novel Method for Hourly Electricity Demand Forecasting. IEEE Trans. Power Syst. 2020, 35, 1351–1363. [Google Scholar] [CrossRef]
  25. Hong, W.-C. Electric load forecasting by support vector model. Appl. Math. Model. 2009, 33, 2444–2454. [Google Scholar] [CrossRef]
  26. Jiang, H.; Zhang, Y.; Muljadi, E.; Zhang, J.J.; Gao, D.W. A Short-Term and High-Resolution Distribution System Load Forecasting Approach Using Support Vector Regression With Hybrid Parameters Optimization. IEEE Trans. Smart Grid 2018, 9, 3341–3350. [Google Scholar] [CrossRef]
  27. Ceperic, E.; Ceperic, V.; Baric, A. A Strategy for Short-Term Load Forecasting by Support Vector Regression Machines. IEEE Trans. Power Syst. 2013, 28, 4356–4364. [Google Scholar] [CrossRef]
  28. Pelka, P. Pattern-based Forecasting of Monthly Electricity Demand using Support Vector Machine. In Proceedings of the 2021 International Joint Conference on Neural Networks (IJCNN), Shenzhen, China, 18–22 July 2021; pp. 1–8. [Google Scholar]
  29. Toubeau, J.-F.; Bottieau, J.; Vallee, F.; De Greve, Z. Deep Learning-Based Multivariate Probabilistic Forecasting for Short-Term Scheduling in Power Markets. IEEE Trans. Power Syst. 2019, 34, 1203–1215. [Google Scholar] [CrossRef]
  30. Zhou, M.; Jin, M. Holographic Ensemble Forecasting Method for Short-Term Power Load. IEEE Trans. Smart Grid 2019, 10, 425–434. [Google Scholar] [CrossRef]
  31. Yang, Y.; Li, W.; Gulliver, T.A.; Li, S. Bayesian Deep Learning-Based Probabilistic Load Forecasting in Smart Grids. IEEE Trans. Ind. Inform. 2020, 16, 4703–4713. [Google Scholar] [CrossRef]
  32. Han, F.; Pu, T.; Li, M.; Taylor, G. A short-term individual residential load forecasting method based on deep learning and k-means clustering. CSEE J. Power Energy Syst. 2020, 7, 261–269. [Google Scholar] [CrossRef]
  33. Li, T.; Wang, Y.; Zhang, N. Combining Probability Density Forecasts for Power Electrical Loads. IEEE Trans. Smart Grid 2020, 11, 1679–1690. [Google Scholar] [CrossRef]
  34. Paparoditis, E.; Sapatinas, T. Short-Term Load Forecasting: The Similar Shape Functional Time-Series Predictor. IEEE Trans. Power Syst. 2013, 28, 3818–3825. [Google Scholar] [CrossRef] [Green Version]
Figure 1. Proposed approach to obtain load profile.
Energies 15 08308 g001
Figure 2. Annual energy consumption of the investigated factory in years: (a) 2019, (b) 2020, (c) 2021.
Energies 15 08308 g002
Figure 3. Load profile based on real data.
Energies 15 08308 g003
Figure 4. Comparison between the assumed B23 profile for the metallurgy company and real measurements.
Energies 15 08308 g004
Figure 5. Comparison between the assumed B23 profile for the metallurgy company after the multiplication of 1.4 and real measurement.
Energies 15 08308 g005
Figure 6. The assumed B23 profile based on energy bills and standard profiles from distribution network operator and maintenance manual.
Energies 15 08308 g006
Figure 7. The assumed B23 profile based on the measurement and standard profiles from the distribution network operator and maintenance manual and contracted power.
Energies 15 08308 g007
Figure 8. The assumed B23 profile based on (a) real smart meter data; (b) energy bills, standard profiles, and measurement for validation; and (c) short-term measurement, standard profile, and contracted power.
Energies 15 08308 g008
Figure 9. Schematic of ESS connections.
Energies 15 08308 g009
Figure 10. Operation of ESS in January. Profile 1—Using real smart meter data (Section 4.1.1); Profile 2—Using energy bills, standard profiles, and measurement for validation (Section 4.1.2); Profile 3—Using short-term measurement, standard profile, and contracted power (Section 4.1.3).
Energies 15 08308 g010
Figure 11. Operation of ESS in April. Profile 1—Using real smart meter data (Section 4.1.1); Profile 2—Using energy bills, standard profiles, and measurement for validation (Section 4.1.2); Profile 3—Using short-term measurement, standard profile. and contracted power (Section 4.1.3).
Energies 15 08308 g011
Figure 12. Operation of ESS in July. Profile 1—Using real smart meter data (Section 4.1.1); Profile 2—Using energy bills, standard profiles, and measurement for validation (Section 4.1.2); Profile 3—Using short-term measurement, standard profile, and contracted power (Section 4.1.3).
Energies 15 08308 g012
Figure 13. Operation of ESS in October. Profile 1—Using real smart meter data (Section 4.1.1); Profile 2—Using energy bills, standard profiles, and measurement for validation (Section 4.1.2); Profile 3—Using short-term measurement, standard profile, and contracted power (Section 4.1.3).
Energies 15 08308 g013
Table 1. Energy cost in one-day period based on energy invoice for the investigated company—consumer tariff B23.
HourPrice Per 1 MWh (PLN)Price Per 1 MWh (EUR)
1424.6794.37
2424.6794.37
3424.6794.37
4424.6794.37
5424.6794.37
6424.6794.37
7560.79124.62
8560.79124.62
9560.79124.62
10560.79124.62
11560.79124.62
12560.79124.62
13560.79124.62
14522.63116.14
15522.63116.14
16606.65134.81
17606.65134.81
18606.65134.81
19606.65134.81
20606.65134.81
21606.65134.81
22606.65134.81
23424.6794.37
24424.6794.37
Table 2. Energy consumption of metallurgy company in month resolution for each month in kWh.
Jan 2021Feb 2021Mar 2021Apr 2021May 2021Jun 2021Jul 2021Aug 2021Sep 2020Oct 2020Nov 2020Dec 2020
113,047117,145118,05590,52477,66859,05690,22490,92257,22572,44391,19096,937
Table 3. Total operation cost for different profiles.
ProfileProfile 1Profile 2Profile 3
Total operation cost [USD]98,64295,303102,827
Publisher’s Note: MDPI stays neutral with regard to jurisdictional claims in published maps and institutional affiliations.