Article

Improved Locating Method for Local Defects in XLPE Cable Based on Broadband Impedance Spectrum

1
State Grid Hebei Electric Power Research Institute, Shijiazhuang 050021, China
2
National Industry-Education Platform of Energy Storage, Tianjin University, Tianjin 300072, China
*
Author to whom correspondence should be addressed.
Energies 2022, 15(21), 8295; https://doi.org/10.3390/en15218295
Submission received: 12 October 2022 / Revised: 30 October 2022 / Accepted: 3 November 2022 / Published: 6 November 2022

Abstract

:
The crosslinked polyethylene (XLPE) cable safety is affected by environmental factors and artificial defects during operation. This work proposes an improved locating method based on broadband impedance spectrum (BIS) to locate local defects in XLPE cables. The calculation process of the algorithm has been analyzed. The selection of the incident Gaussian signal and the peak recognition method have been discussed, where the pulse width of the Gaussian signal was found to be determined primarily by the upper limit frequency of the traveling wave transmitting in the cable. The centroid and function fitting methods were established to reduce the peak recognition error caused by the test sampling rate. This work verified the accuracy of the algorithm through experiments. A vector network analyzer (VNA) was used to test the BIS of the cable. A 20 m-long cable containing abrasion and an inserted nail with different depths was measured in the BIS test. It was found that the abrasion and the nail could be located. The locating deviation of abrasion was within ±1%, and the centroid and function fitting methods could effectively reduce the locating deviation. The locating deviation was within ±1% when the depth of the nail inserted into the cable accounted for less than 50% of the insulation thickness. When the depth exceeded 75% of the insulation thickness, the deviation of each method was more significant, and the maximum absolute value of the deviation was 4%.

1. Introduction

Crosslinked polyethylene (XLPE) cable is widely used in urban distribution networks due to its high performance [1,2]. The safety of cable operation is of great significance to the stability of power systems [3,4]. With the development of cities, XLPE insulation is affected by multiple environmental factors, including artificial defects during construction [5,6]. Therefore, a new effective method to locate local defects before cable failure needs to be studied to ensure the reliability of the power supply.
The traveling wave methods to diagnose local defects in cables have been widely studied. When a high-frequency signal transmits in the line, signal refraction and reflection will occur where the cable wave impedance mismatches [7,8]. This method uses the traveling wave to locate defects by analyzing the time difference between the reflected and incident signals. Time domain reflectometry (TDR) is the most common method utilizing this principle. TDR can accurately locate degradation, such as the cable’s local moisture and thermal aging [9,10]. A narrow pulse-width Gaussian signal is used as the incident signal in the TDR test. However, the bandwidth of the Gaussian signal is limited, and electromagnetic interference easily occurs during its transmission process. To solve this problem, the sequential time domain reflectometry method (STDR) and spread spectral time domain reflectometry (SSTDR) have been used to change the waveform of incident signals. The PN code is used as the incident signal of the STDR method, and the cross-correlation coefficient of the incident signal and the reflected signal is calculated to locate defects [11,12,13]. The calculation method of SSTDR is similar to that of STDR, but the signal used in SSTDR is a modulated signal of PN code and sinusoidal signal [14,15,16]. Compared with TDR, STDR and SSTDR have the advantages of higher resolution and anti-interference ability [17]. Although the above methods can detect local defects effectively, the signal’s frequency band must be selected before the test because the cable’s size will affect the signal’s transmission characteristics. The test signal will have different attenuation and dispersion when transmitted in other cables. When the cable information is unknown, the signal must be repeatedly attempted, increasing the test’s difficulty [18].
Some scholars have recently proposed the broadband impedance spectrum (BIS) method. The test signal used by BIS is a swept signal with an amplitude of 5 V. The power of the swept signal in each frequency band is equal, so the signal does not need to be attempted repeatedly due to attenuation [19]. The single-ended impedance obtained from the BIS test is converted into the location spectrum of the cable through a mathematical algorithm. The inverse fast Fourier transform (IFFT) method has been used to transform the impedance in the frequency domain into the time domain. It has been found that the location of local moisture and irradiation in long cables can be identified by IFFT. However, the input swept signal has significant energy in the high-frequency band, and the Gibbs phenomenon will occur in the time–frequency domain transformation, which will seriously affect the resolution of the test results [20]. Some scholars have tried to deconstruct the signal into real and imaginary parts. The effect of spectral leakage is found to be reduced by transforming the imaginary part by IFFT [21]. It has also been found that interpolating and windowing the signal will inhibit the Gibbs phenomenon [22]. Although the above research has confirmed that the improved algorithm can increase the locating accuracy, the algorithmic principles of the window function and the time–frequency domain transformation process are still unclear. Therefore, it is necessary to study the principle and identification ability of the algorithm further. At the same time, there are few algorithms for identifying the peaks of reflected signals. The method of locating the maximum amplitude value of the peak in the BIS signal is based mainly on the judgment of the maximum value. However, the top point depends on the sampling frequency of the BIS and the reflected signal frequency, which is easily affected by noise. In order to avoid the misjudgment of the defect location, a new peak identification method needs to be applied in the locating algorithm.
This work proposes an improved locating method to detect local defects in long cables. The process of time–frequency domain transformation was analyzed, and different peak identification methods were discussed. Then, location spectra of 20 m-long cables containing local mechanical abrasion and nail insertion were tested. The locating accuracy of varying identification methods was analyzed, and the influencing factors were discussed.

2. BIS Algorithm

2.1. Transmission Line Model

The test signal of BIS is the swept signal in the range of kHz to MHz. When the signal wavelength is much greater than the cable length, the signal oscillates multiple times during transmission in the cable. Therefore, the lumped parameter model is no longer applicable. The transmission line model of micro-element parameters to analyze the wave transmission process is shown in Figure 1 [23]. A cable can be equivalent to a series of Δl-length transmission line element circuits. R0, L0, G0, and C0 are the cable’s distribution parameters, representing the cable’s resistance, inductance, conductance, and capacitance per unit length, respectively.
The differential equation can be established and solved through the transmission line model. The calculation process of the single-ended broadband impedance spectrum has been deduced in many research works [24,25]. BIS at the measurement port can be obtained by (1):
Z B I S = Z c 1 + e 2 j k l 1 e 2 j k l
where Zc represents the cable’s characteristic impedance, k represents the propagation constant of the cable, and l represents the length of the cable. k and Zc can be calculated by the distribution parameters:
j k = ( R 0 + j w L 0 ) ( G 0 + j w C 0 ) = α + j β
Z c = R 0 + j w L 0 G 0 + j w C 0
where w represents the angular frequency of the test signal. The BIS of the cable is related only to the distribution parameters of the cable. The distribution parameter at the defect location will change when local defects occur in the cable. Therefore, BIS can reflect the insulation condition of the cable.

2.2. BIS Algorithm

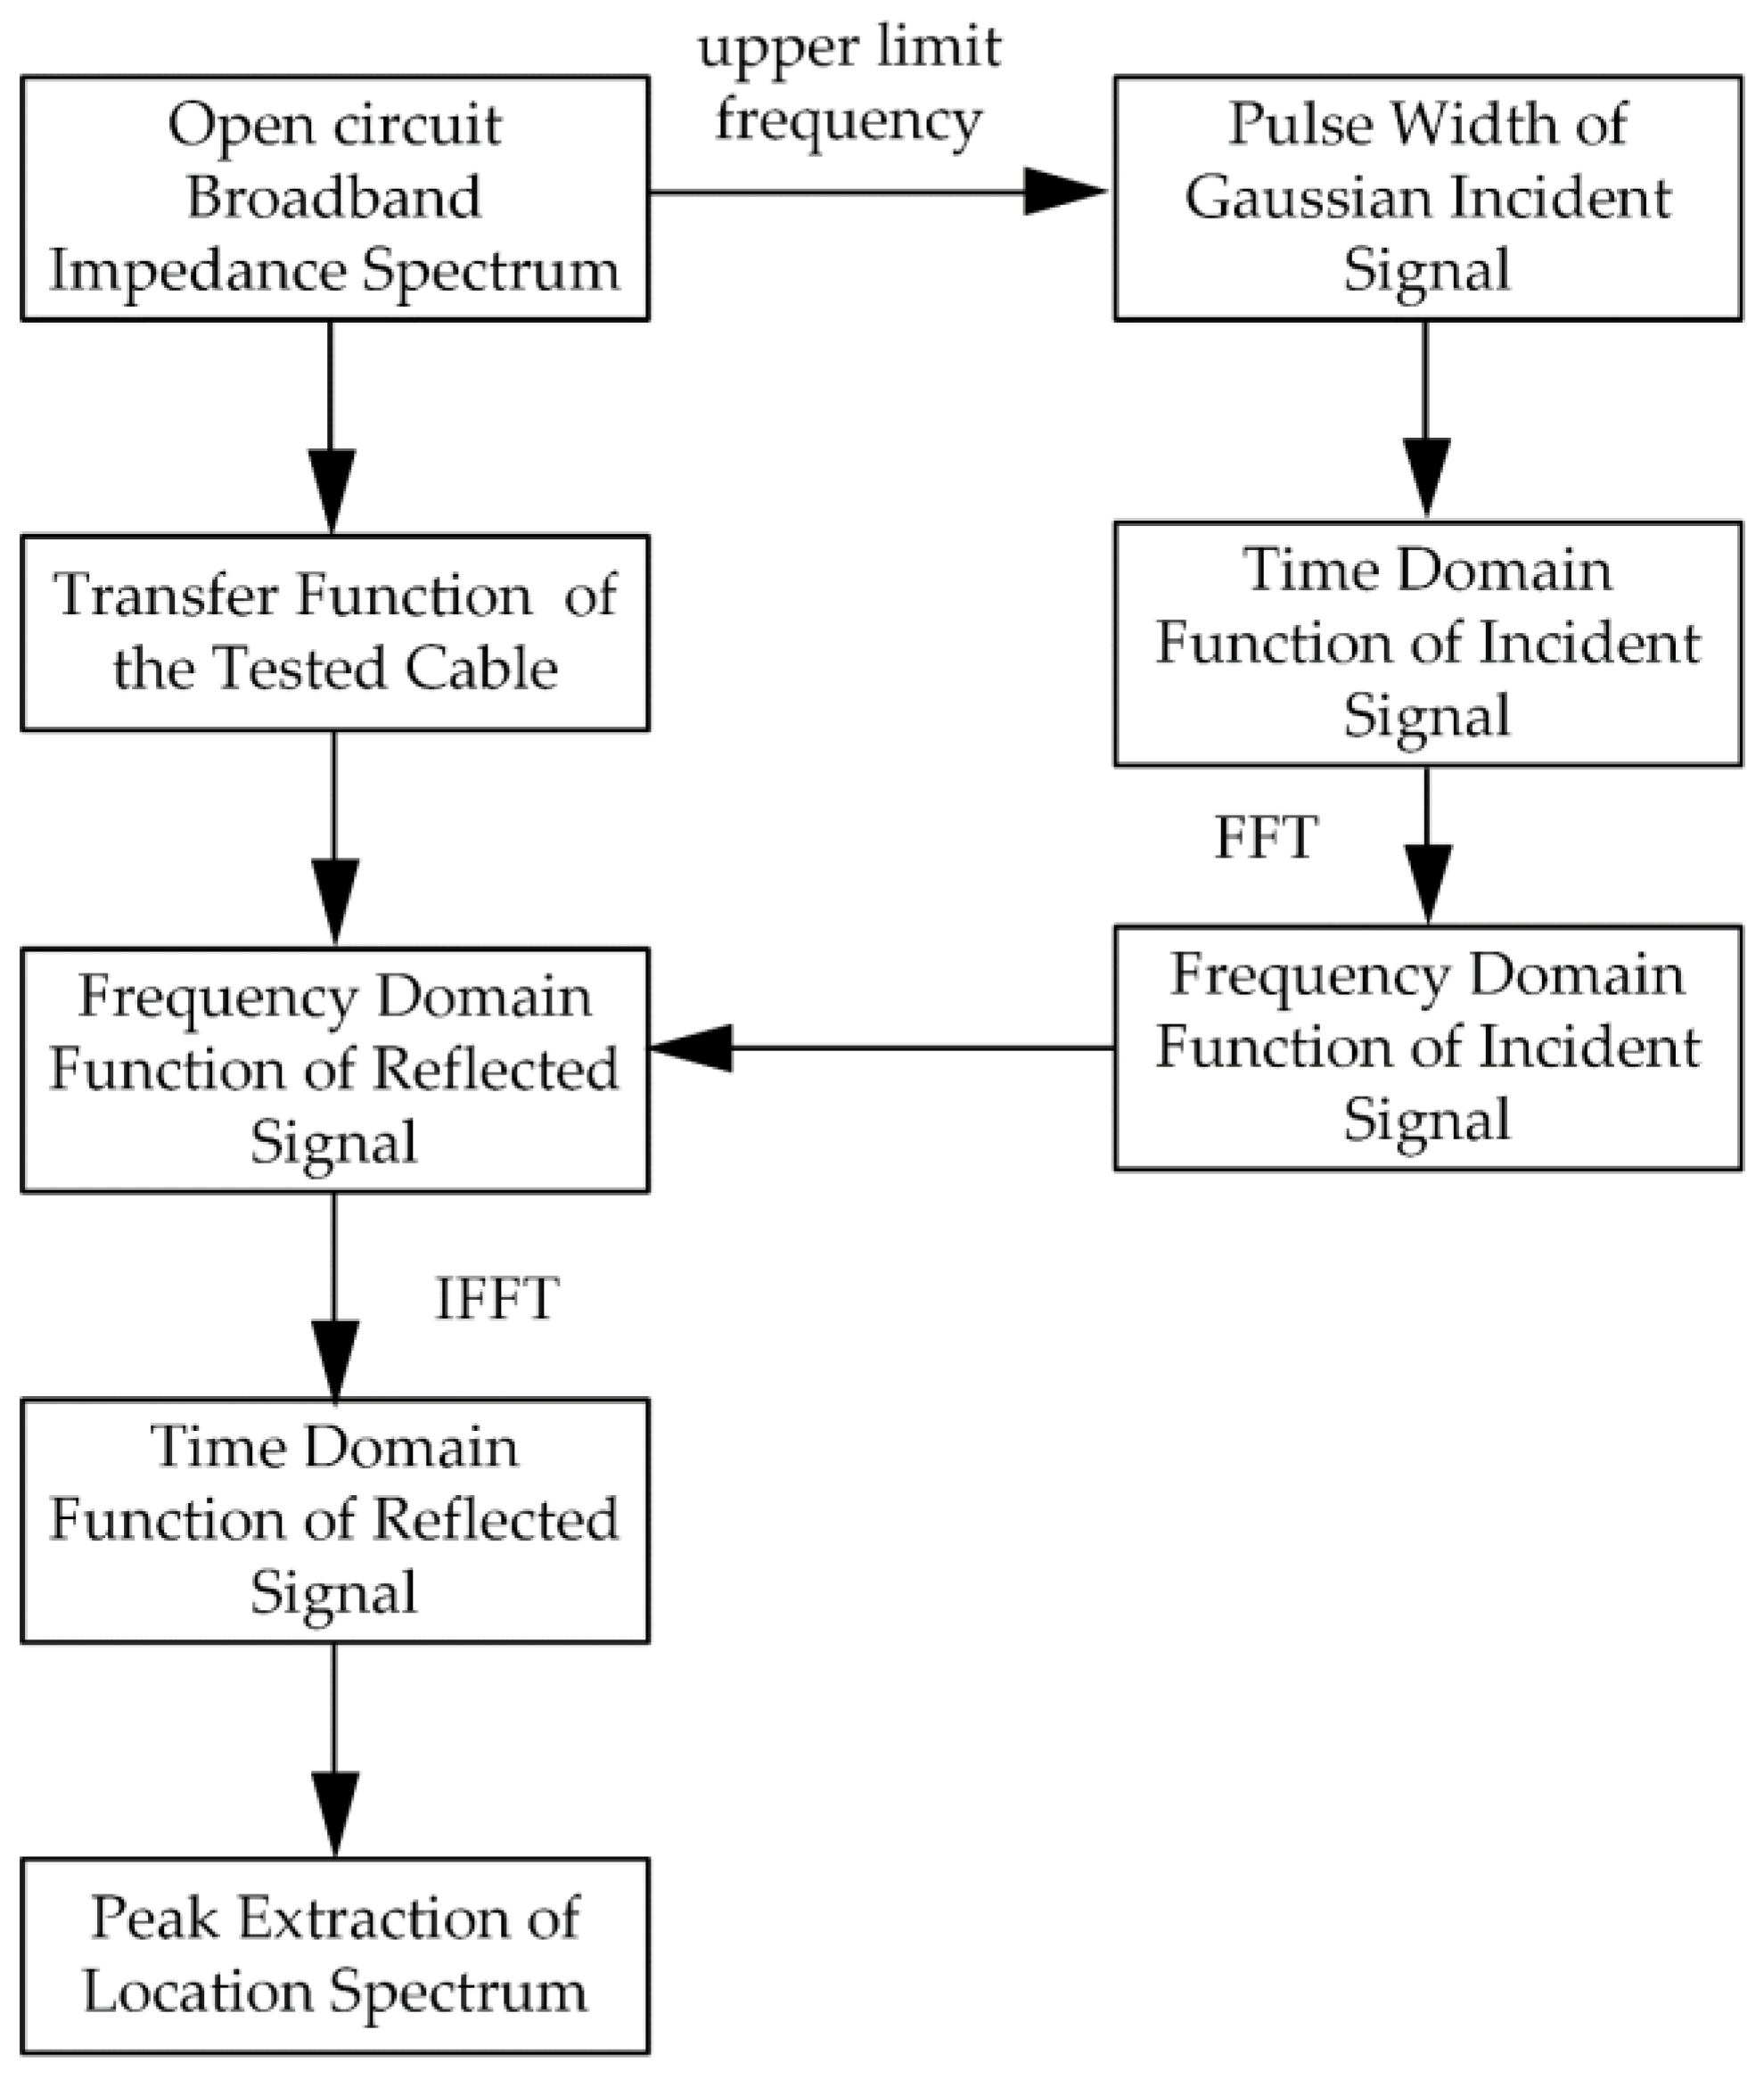
Currently, the locating method is based mainly on the time–frequency transform of the BIS directly. However, the IFFT method will cause serious spectral leakage, affecting locating accuracy and resolution. This work uses the transfer function method to weaken the influence of spectral leakage. The algorithm process is shown in Figure 2. The BIS of the cable is measured by a vector network analyzer (VNA). Then, the transfer function of the cable can be calculated by (4) and (5) [26]:
G ( w ) = Z BIS Z i Z BIS Z i
Z i = μ 0 ε 0 ε r ln ( r s / r c ) 2 π
where Zi represents the wave impedance of the cable, which is constant and depends on the cable parameters; μ0 represents the permeability of a vacuum; ε0 represents the dielectric constant of a vacuum; εr represents the relative permittivity of XLPE; rs represents the shield’s radius; and rc represents the radius of the core.

2.3. The selection of Gaussian Signal

A Gaussian signal is selected as the simulated input signal in the algorithm. Its frequency domain spectrum is a single-lobe waveform, and the amplitude decreases as the frequency increases. The mathematical expression of the Gaussian signal is shown in (6) and (7):
S i ( t ) = a e ( t b ) 2 2 c 2
S i ( f ) = 2 π a c f s a m p l e e 2 π 2 c 2 f 2
where a represents the maximum amplitude value of the Gaussian signal, b represents the time shift of the signal, c represents the pulse width of the signal, and fsample represents the sampling frequency of the time domain signal. a and b do not affect the frequency domain waveform of the Gaussian signal, so a= 1, b= 1 × 10⁻⁶ are fixed in this work. However, c affects mainly the amplitude–frequency characteristics of the signal. In the algorithm, it is necessary to select the appropriate c to ensure that the signal’s frequency band is within the cable’s transmission range as far as possible. c is chosen as follows:
c = ln p 2 π 2 f m 2
where p represents the ratio of the amplitude of the signal at the maximum frequency to the amplitude at 0 Hz. p < 1 can be obtained by (7). p = 0.01 is fixed to ensure that the energy will not be attenuated too much in the high-frequency band. fm represents the cable’s upper limit transmission frequency of the traveling wave.
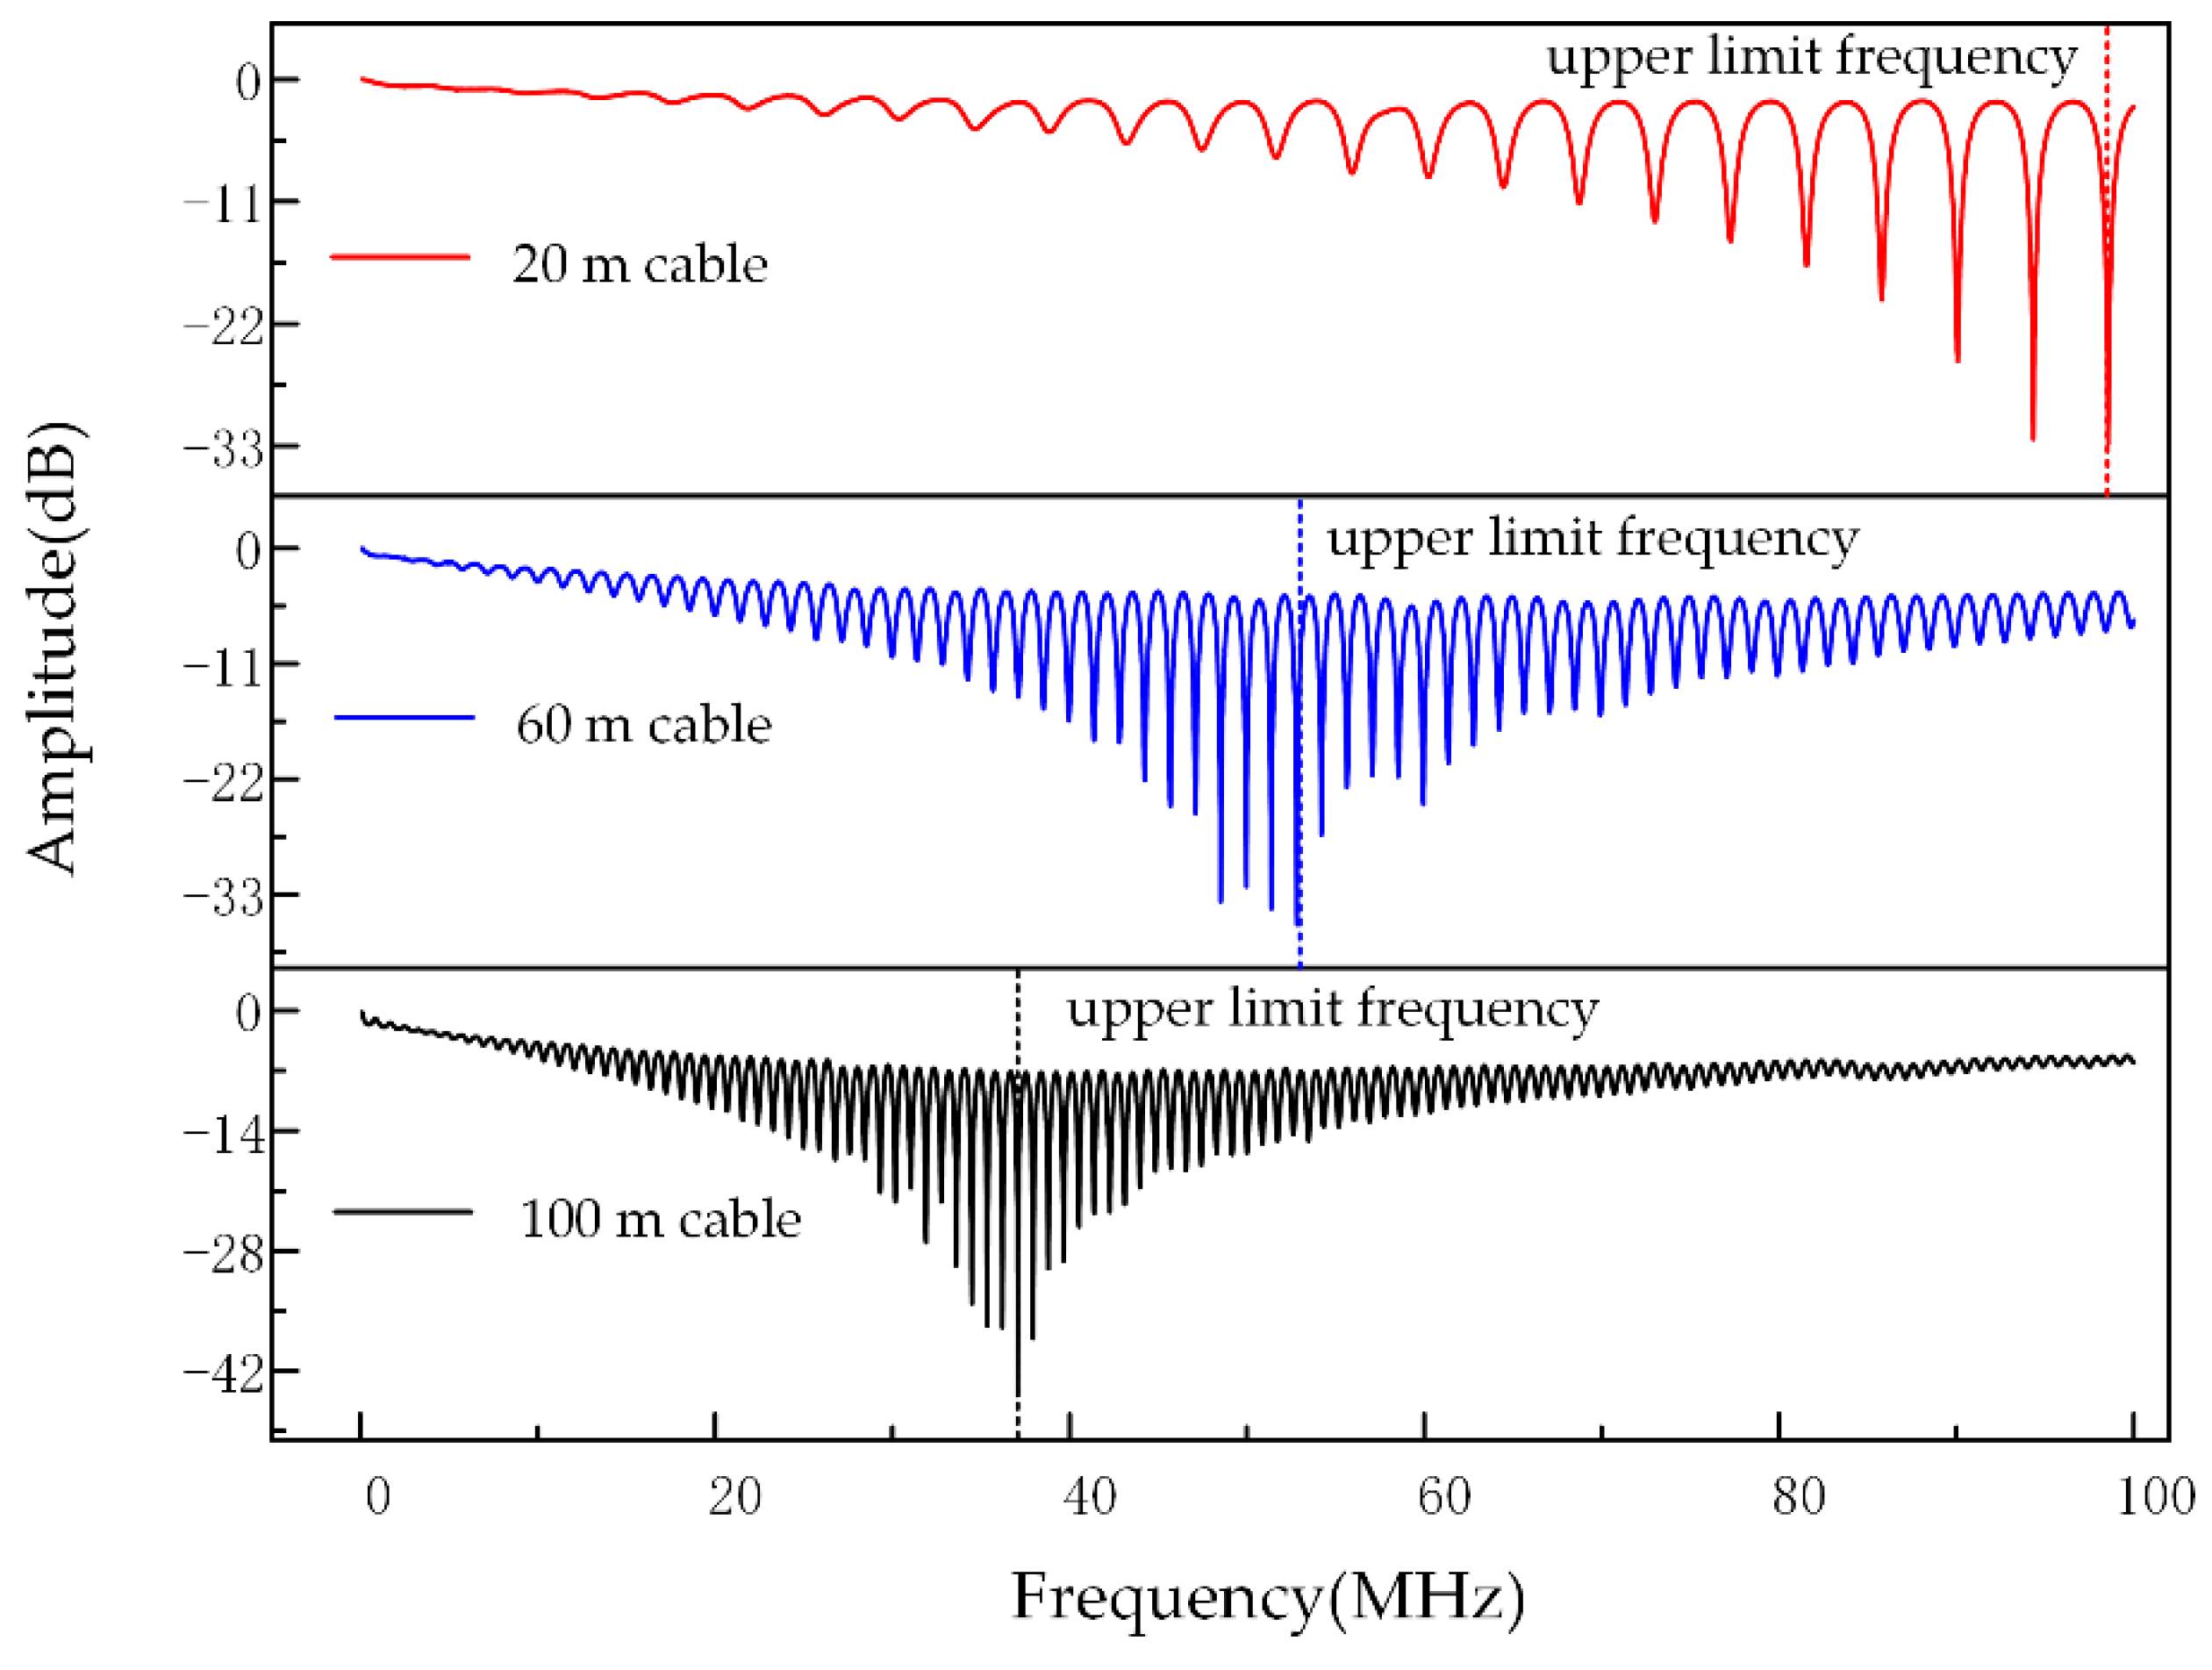
The accuracy of the location spectrum is affected by the selection of c. As c becomes smaller, the pulse width of the reflected peak becomes smaller, and the accuracy of the location spectrum becomes higher. The selection of c is determined mainly by the cable’s upper limit transmission frequency of the traveling wave. Therefore, it is necessary to analyze the transmission characteristics of traveling waves in cables with different lengths. Figure 3 shows the BIS amplitude–frequency characteristic of cables with different lengths, which was measured by VNA. The amplitude of BIS shows a trend of oscillation attenuation with frequency. The upper limit test frequency is defined as the frequency of the lowest amplitude in the curve. Three cables with the lengths of 20, 60, and 100 m are used here to show the limit frequency selection. As shown in Figure 3, the upper limit frequency of traveling waves in the 20 m cable is 98 MHz, while it is 52 MHz in the 60 m cable and 37 MHz in the 100 m cable.
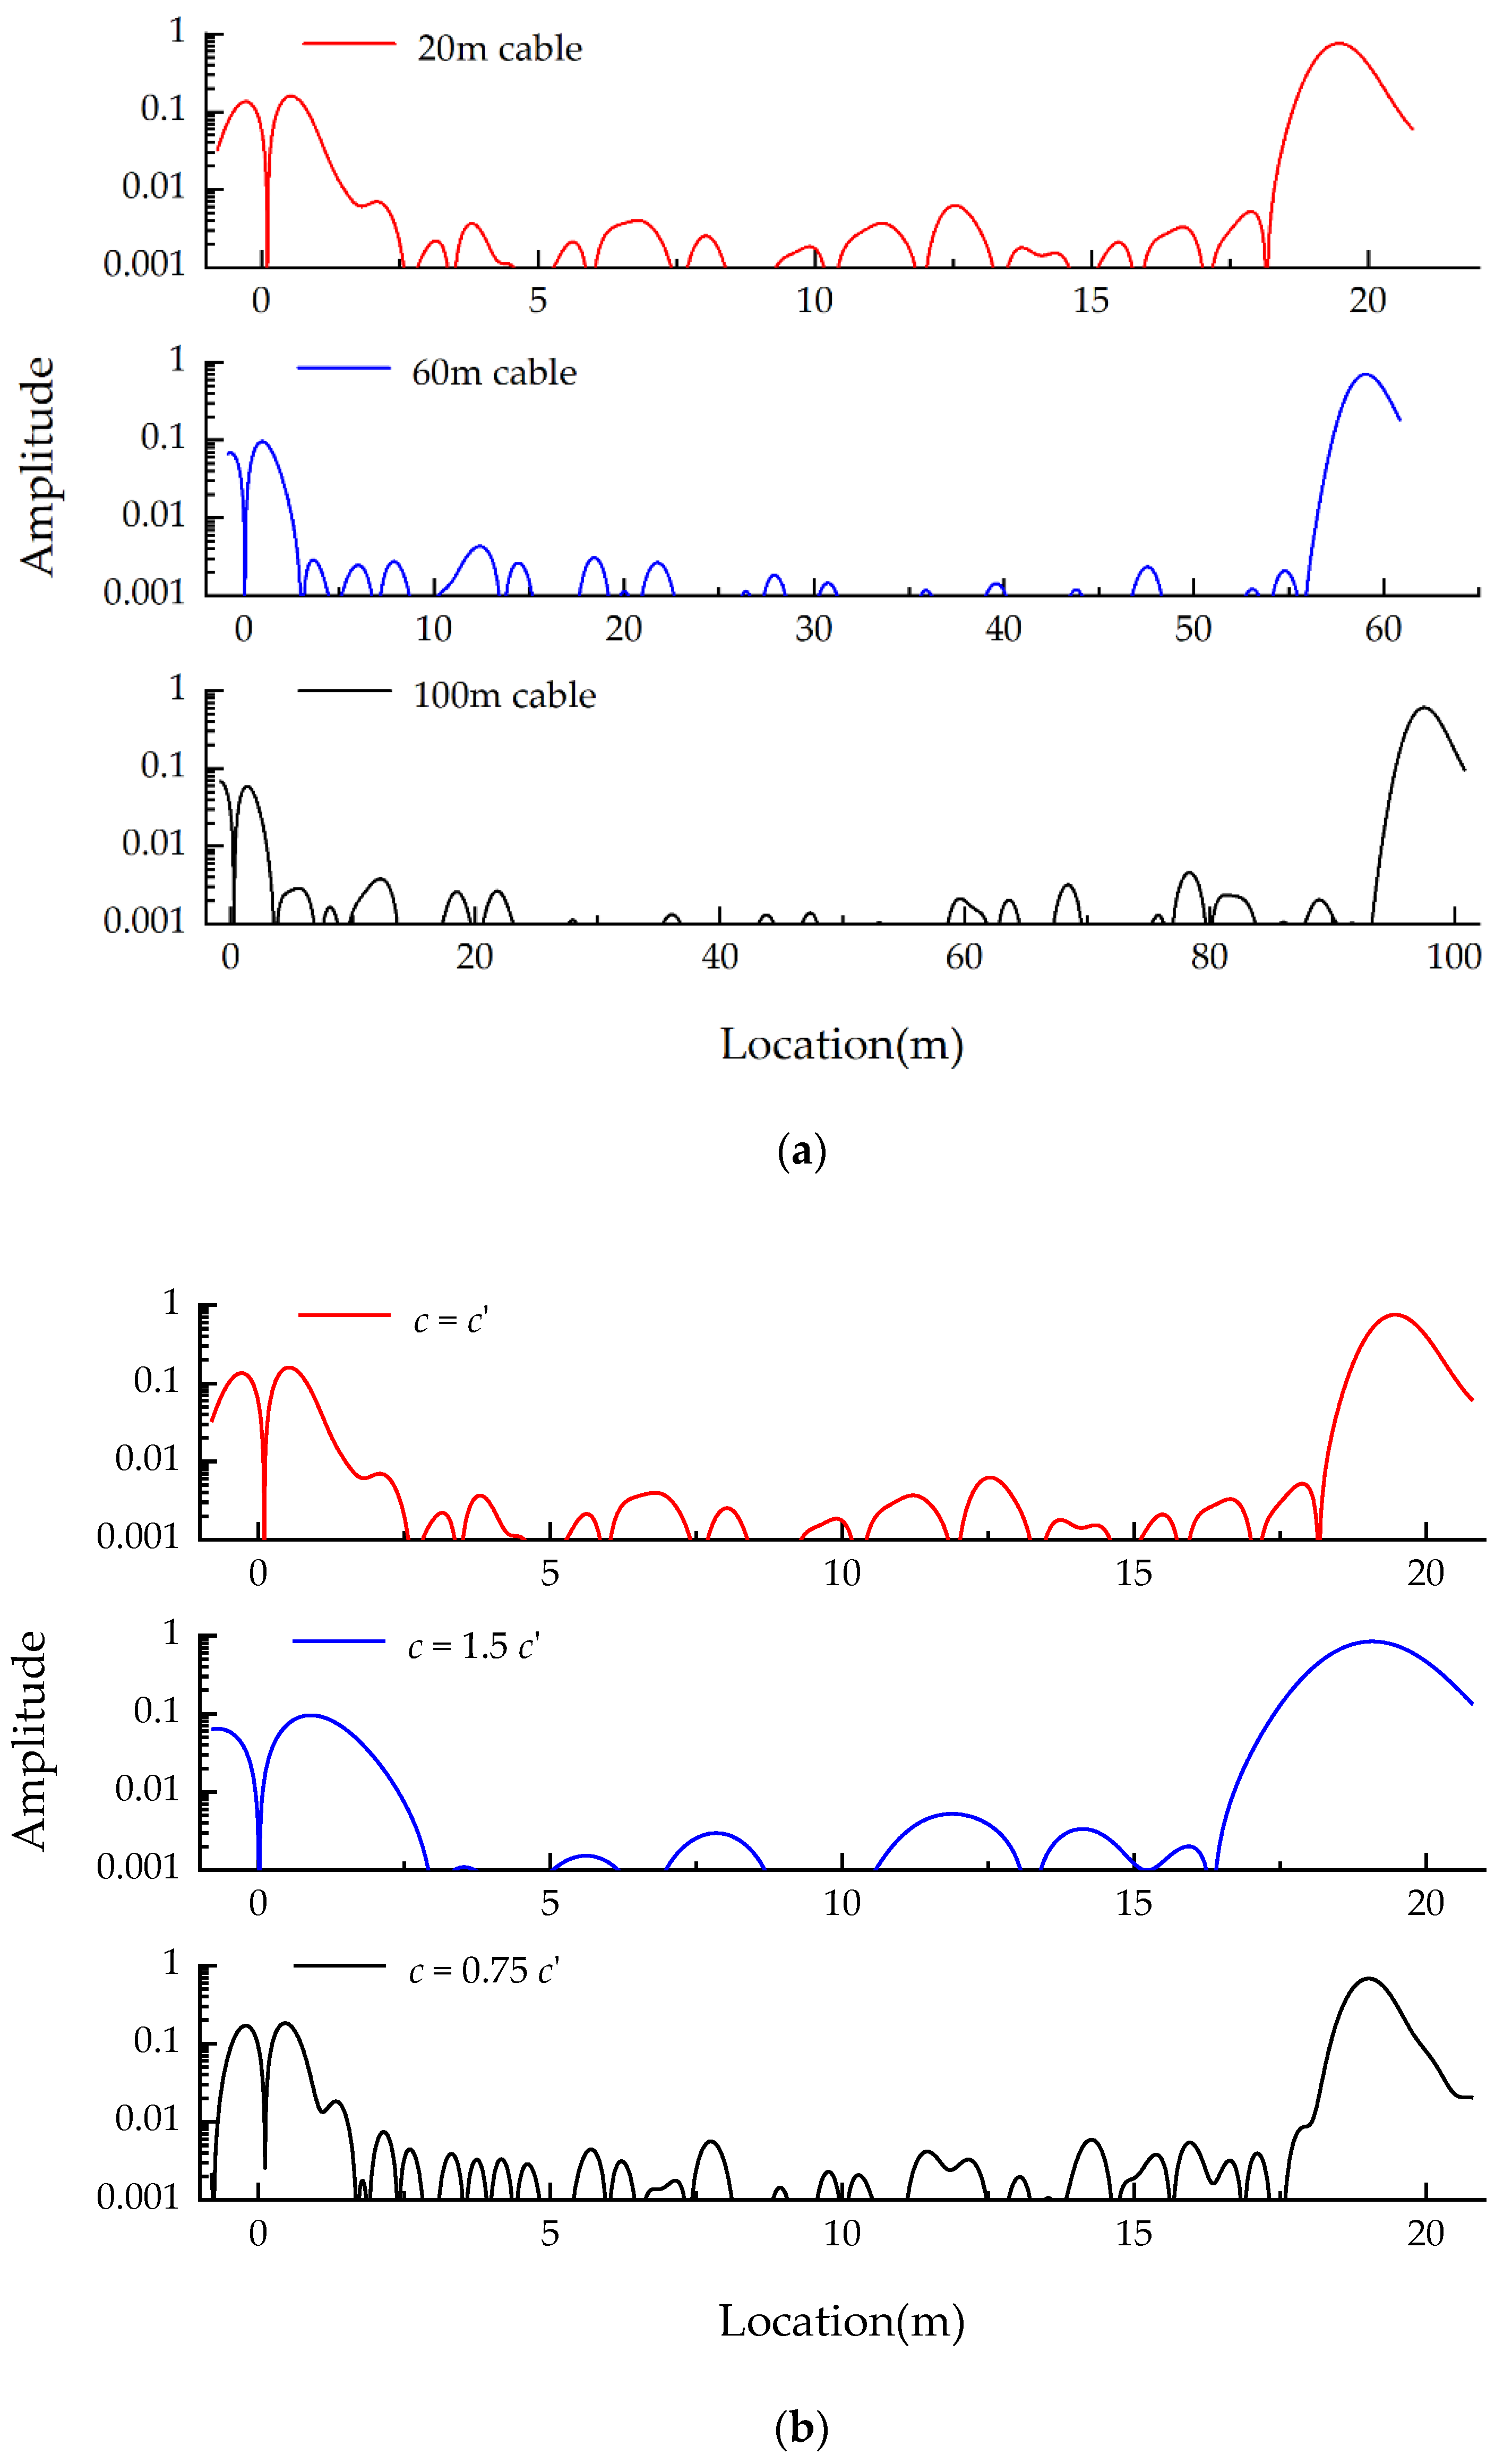
Figure 4a shows the location spectra of intact cables with different lengths. The incident signal is selected according to (6)–(8), and the location spectrum is calculated by BIS. The area covered by the incident peak and reflected peak at the ends of the cable is defined as the test blind zone. The blind zone of the 20 m cable is approximately 3 m, that of the 60 m cable is approximately 4 m, and that of the 100 m cable is approximately 6 m. The width of the blind zone is proportional to the width of the reflected peak, so as the length increases, the width of the reflected peak increases, and the resolution of the location spectrum decreases.
Figure 4b shows the location spectra of intact cables with different values of c. The cable length is 20 m. c’ is the calculated according to (6)–(8). It can be found from Figure 4b that when c = 1.5c’, the width of the blind zone is larger. When c = 0.75c’, the amplitude of noise is greater in the location spectrum due to spectral leakage. This proves that the selection of c will affect the recognition of the reflected peak. As a result, c is selected using (8) in the following work.

2.4. The Process of Time–Frequency Transformation

The time domain function of the Gaussian signal is transformed to a frequency domain function by fast Fourier transform method (FFT). Then, the frequency domain function is multiplied by the transfer function to calculate the frequency domain function of the reflected signal. Finally, the time domain signal is obtained by IFFT. The calculation process is shown in (9):
s r ( t ) = abs [ IFFT ( S i ( f ) G ( f ) * ) ]
where G(f)* represents the frequency domain continuation of G(f), and its value in the negative frequency domain is the conjugate of that in the related positive frequency domain. By multiplying the time domain function of the reflected signal with the propagation velocity of the electromagnetic wave in the XLPE, the location spectrum of the cable can be obtained. In this paper, the propagation speed of electromagnetic waves in XLPE is approximately 1.70 × 10⁸ m/s [27].

2.5. Location of Reflected Peaks

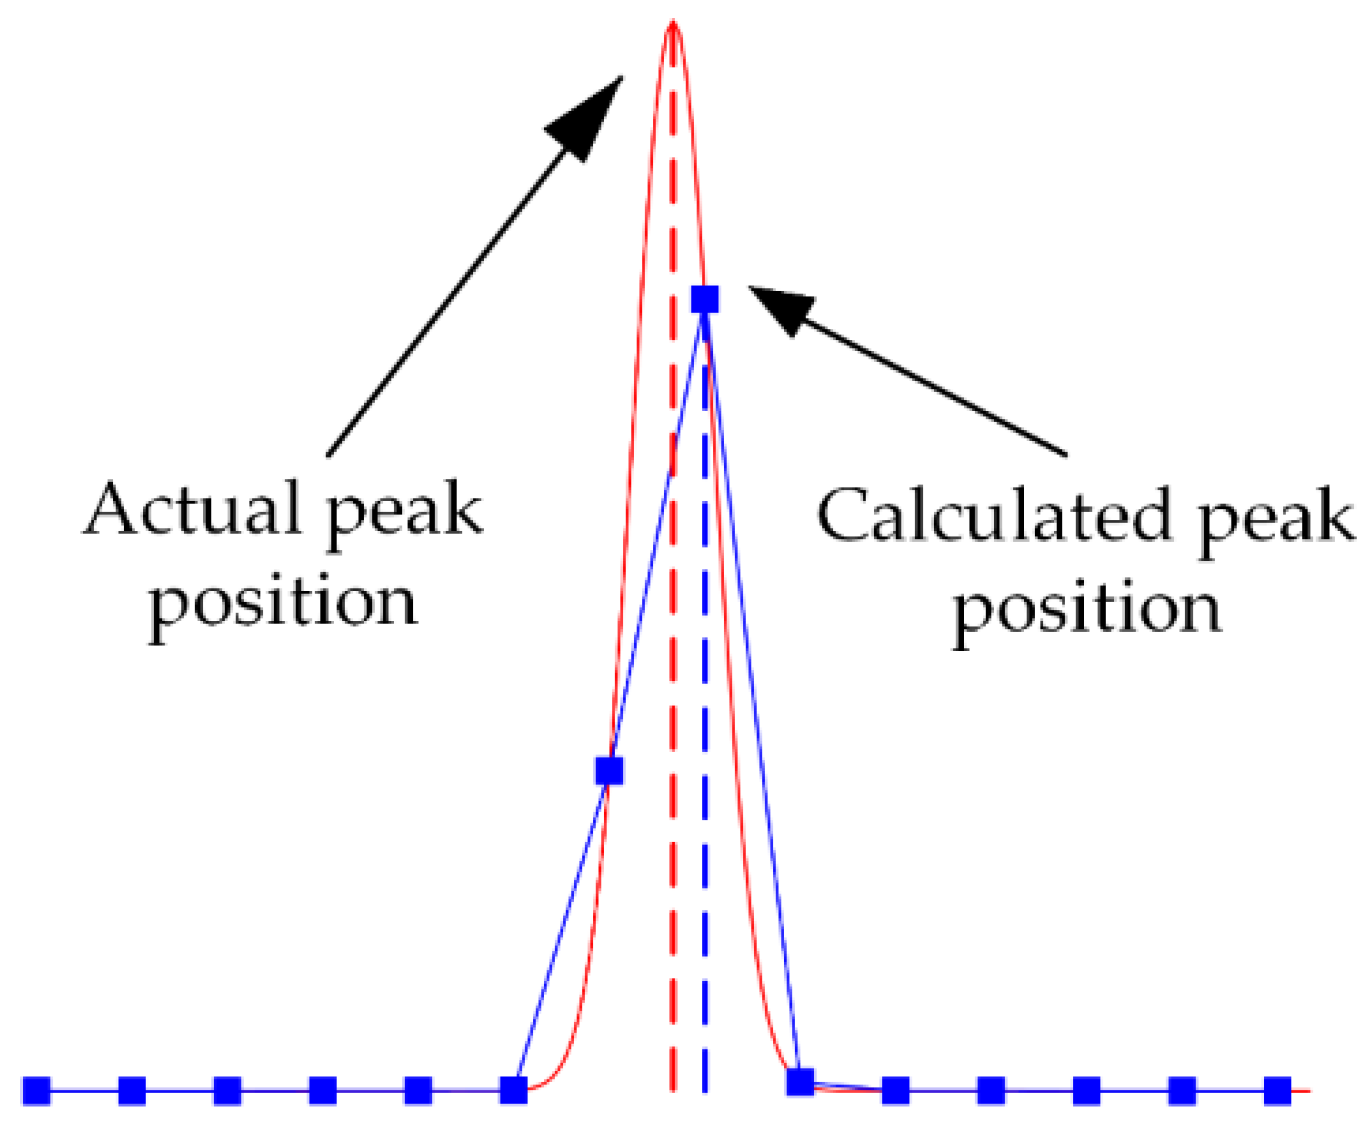
Since the signals analyzed in this work are discrete, a distortion phenomenon may occur when the reflected signal is recovered by IFFT, as shown in Figure 5. The maximum value of the reflection peak is unable to locate the defect accurately. To improve the identification of the reflected peak, this work uses the centroid and function fitting methods to find the peak position.
The centroid method takes the centroid position of the peak waveform as the peak position. The principle of the centroid method is to compare the amplitude of the signal at different times with the mass of the object at different positions. The centroid is defined as the ratio of the sum of moments at different positions to the total mass. Therefore, the centroid of the peak signal can be calculated as follows:
z ˜ = i = 1 m x i s r ( x i ) i = 1 m s r ( x i )
where xi represents the coordinate of each sampling point in the reflected peak, sr(xi) represents the amplitude of each sampling point in the reflected peak, and m represents the number of coordinate points in the reflected peak.
The function fitting method is used to fit the reflected peak of the signal waveform. Attenuation and dispersion will occur when the signal is transmitted in the cable, but it does not affect the waveform characteristics of the function. Therefore, the reflected signal has the characteristics of a Gaussian signal. The expression of the reflected Gaussian signal is obtained by fitting, and then the fitted signal’s peak position can be calculated. Due to the sampling frequency being limited in the test, the sampling point in the location spectrum is discrete, as shown by the blue point in Figure 5. If the amplitude of the sampling point has no error, its fitting function is the same as the original reflected signal, and the locating accuracy is the highest.

3. Results and Discussion

3.1. Experimental Setup

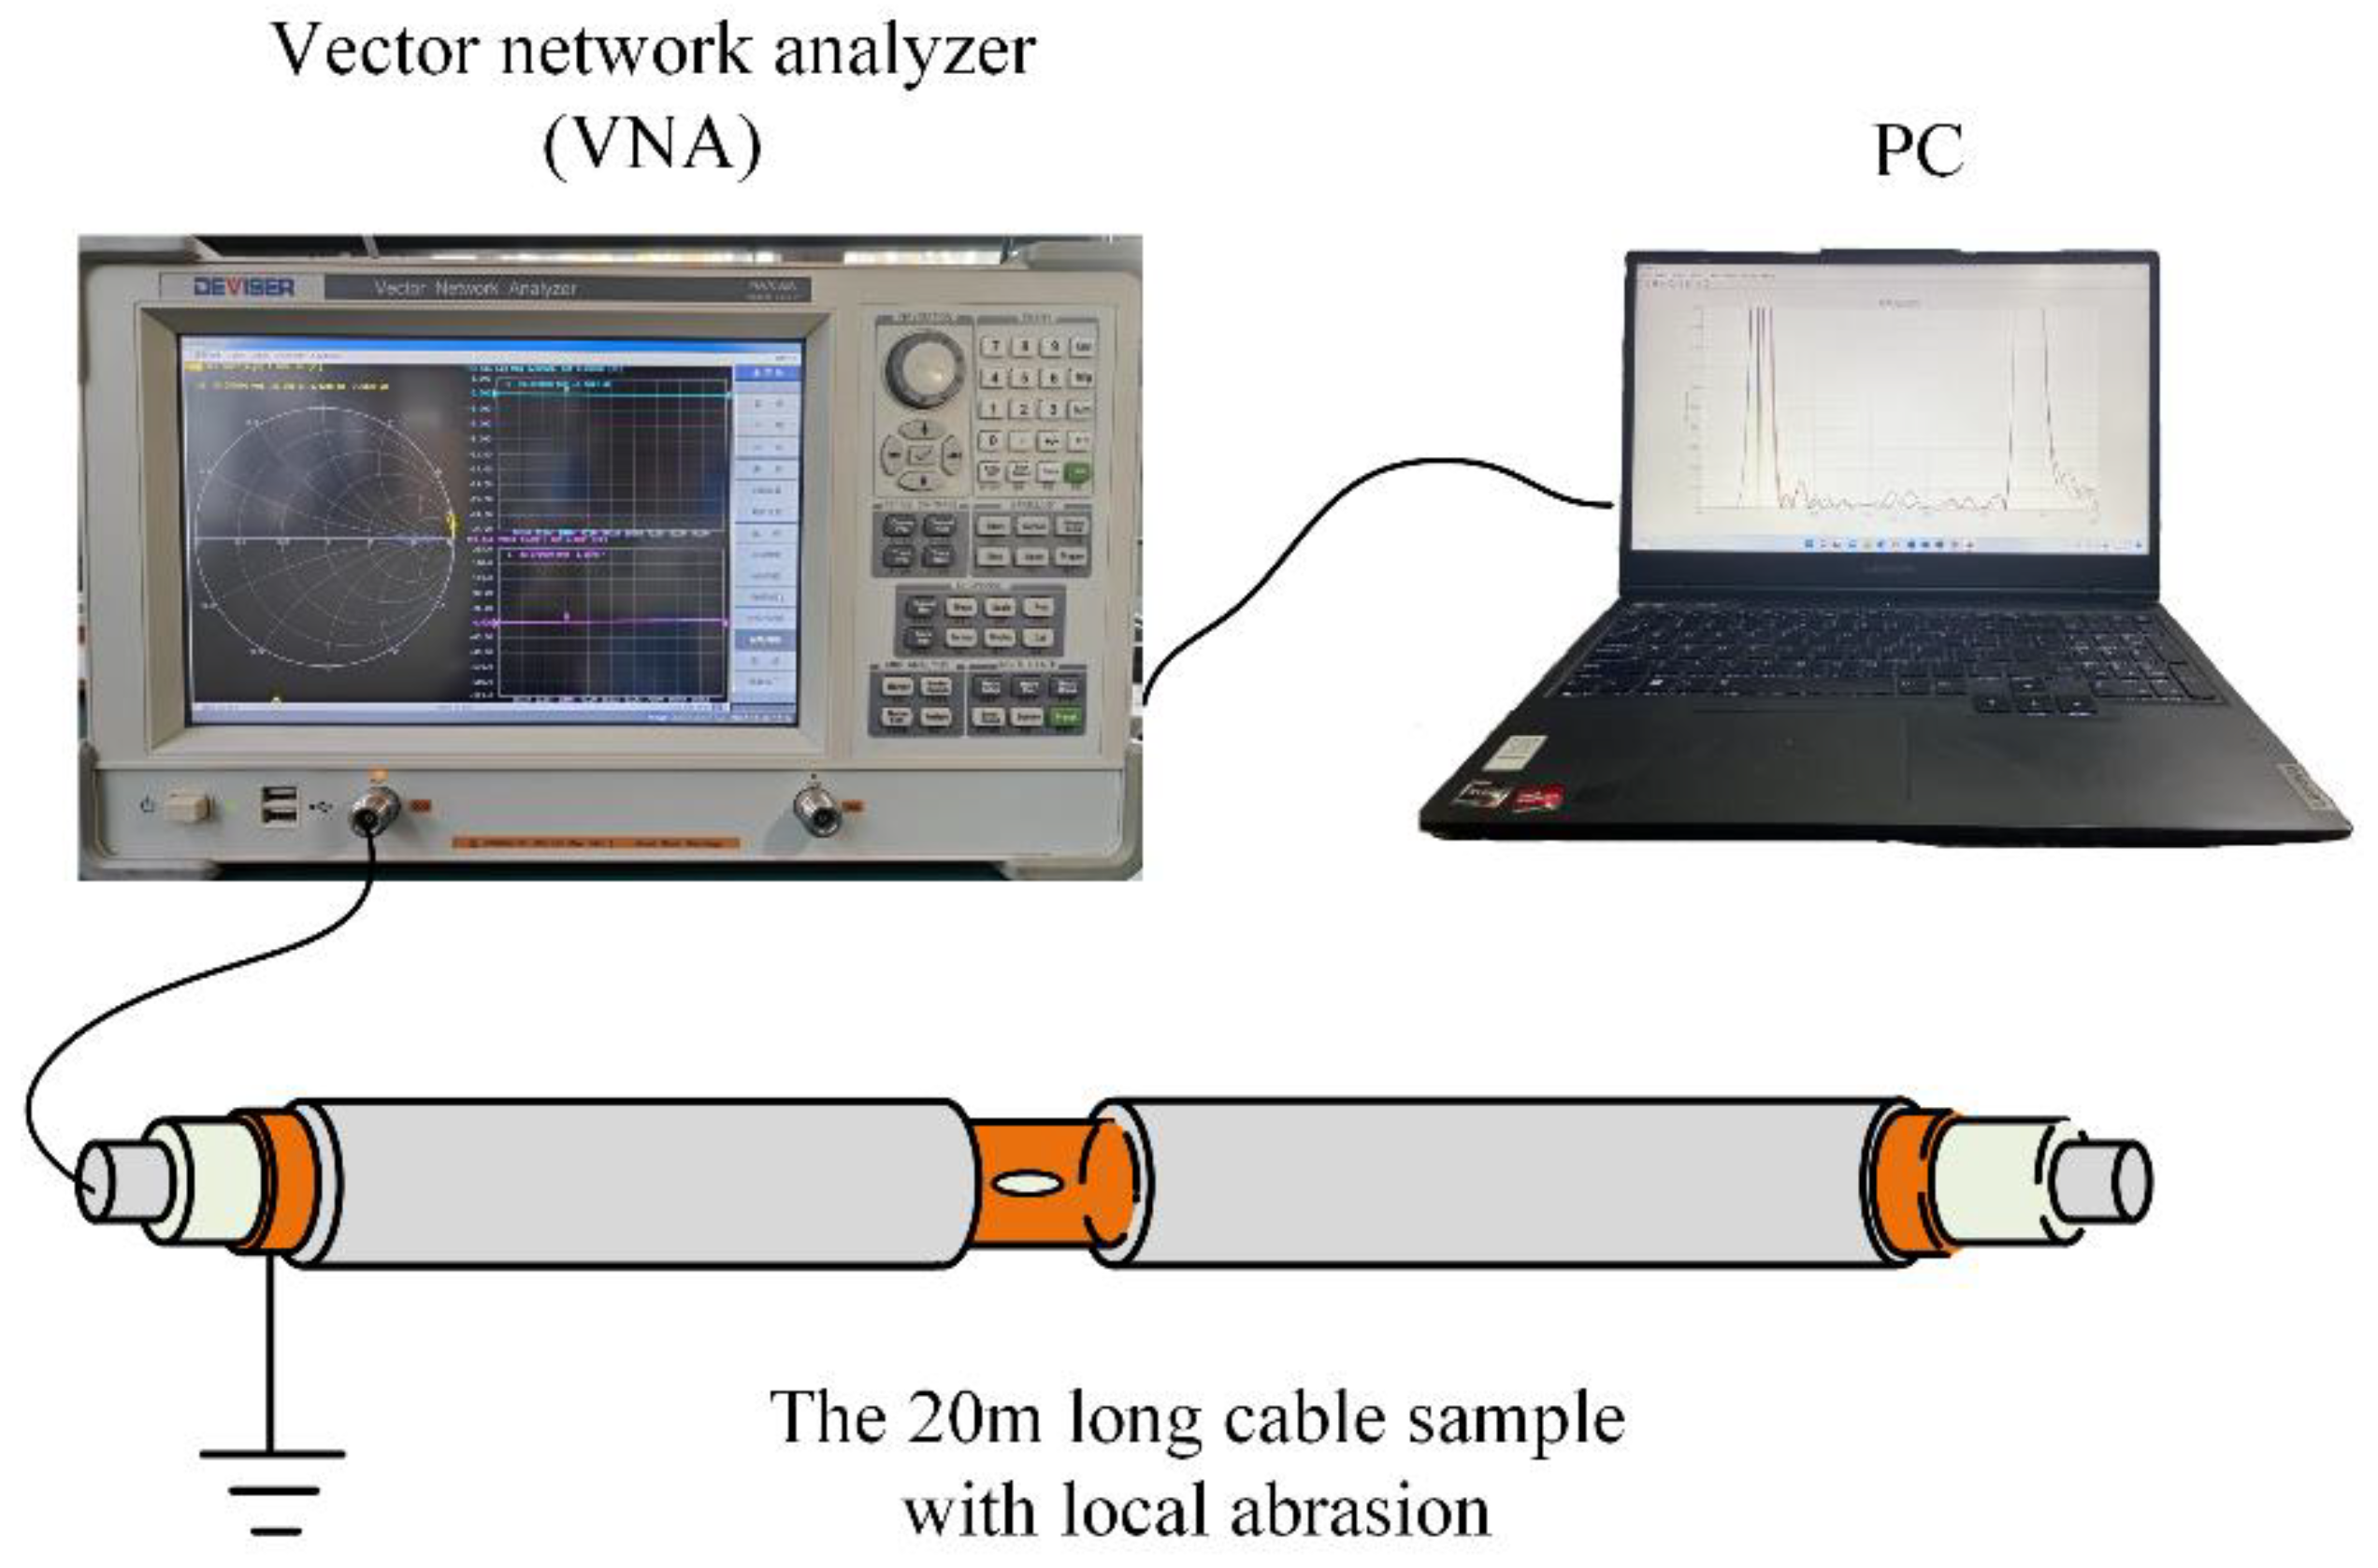
The experimental platform used in this work is shown in Figure 6. A PC was used to record and analyze the BIS of the tested cable, which was measured by VNA. The test frequency band of the VNA was set to 100 kHz–100 MHz. The frequency interval of the swept signal was set to 10 kHz. The VNA and cable were connected through alligator clips. The copper shield was grounded during the experiment.
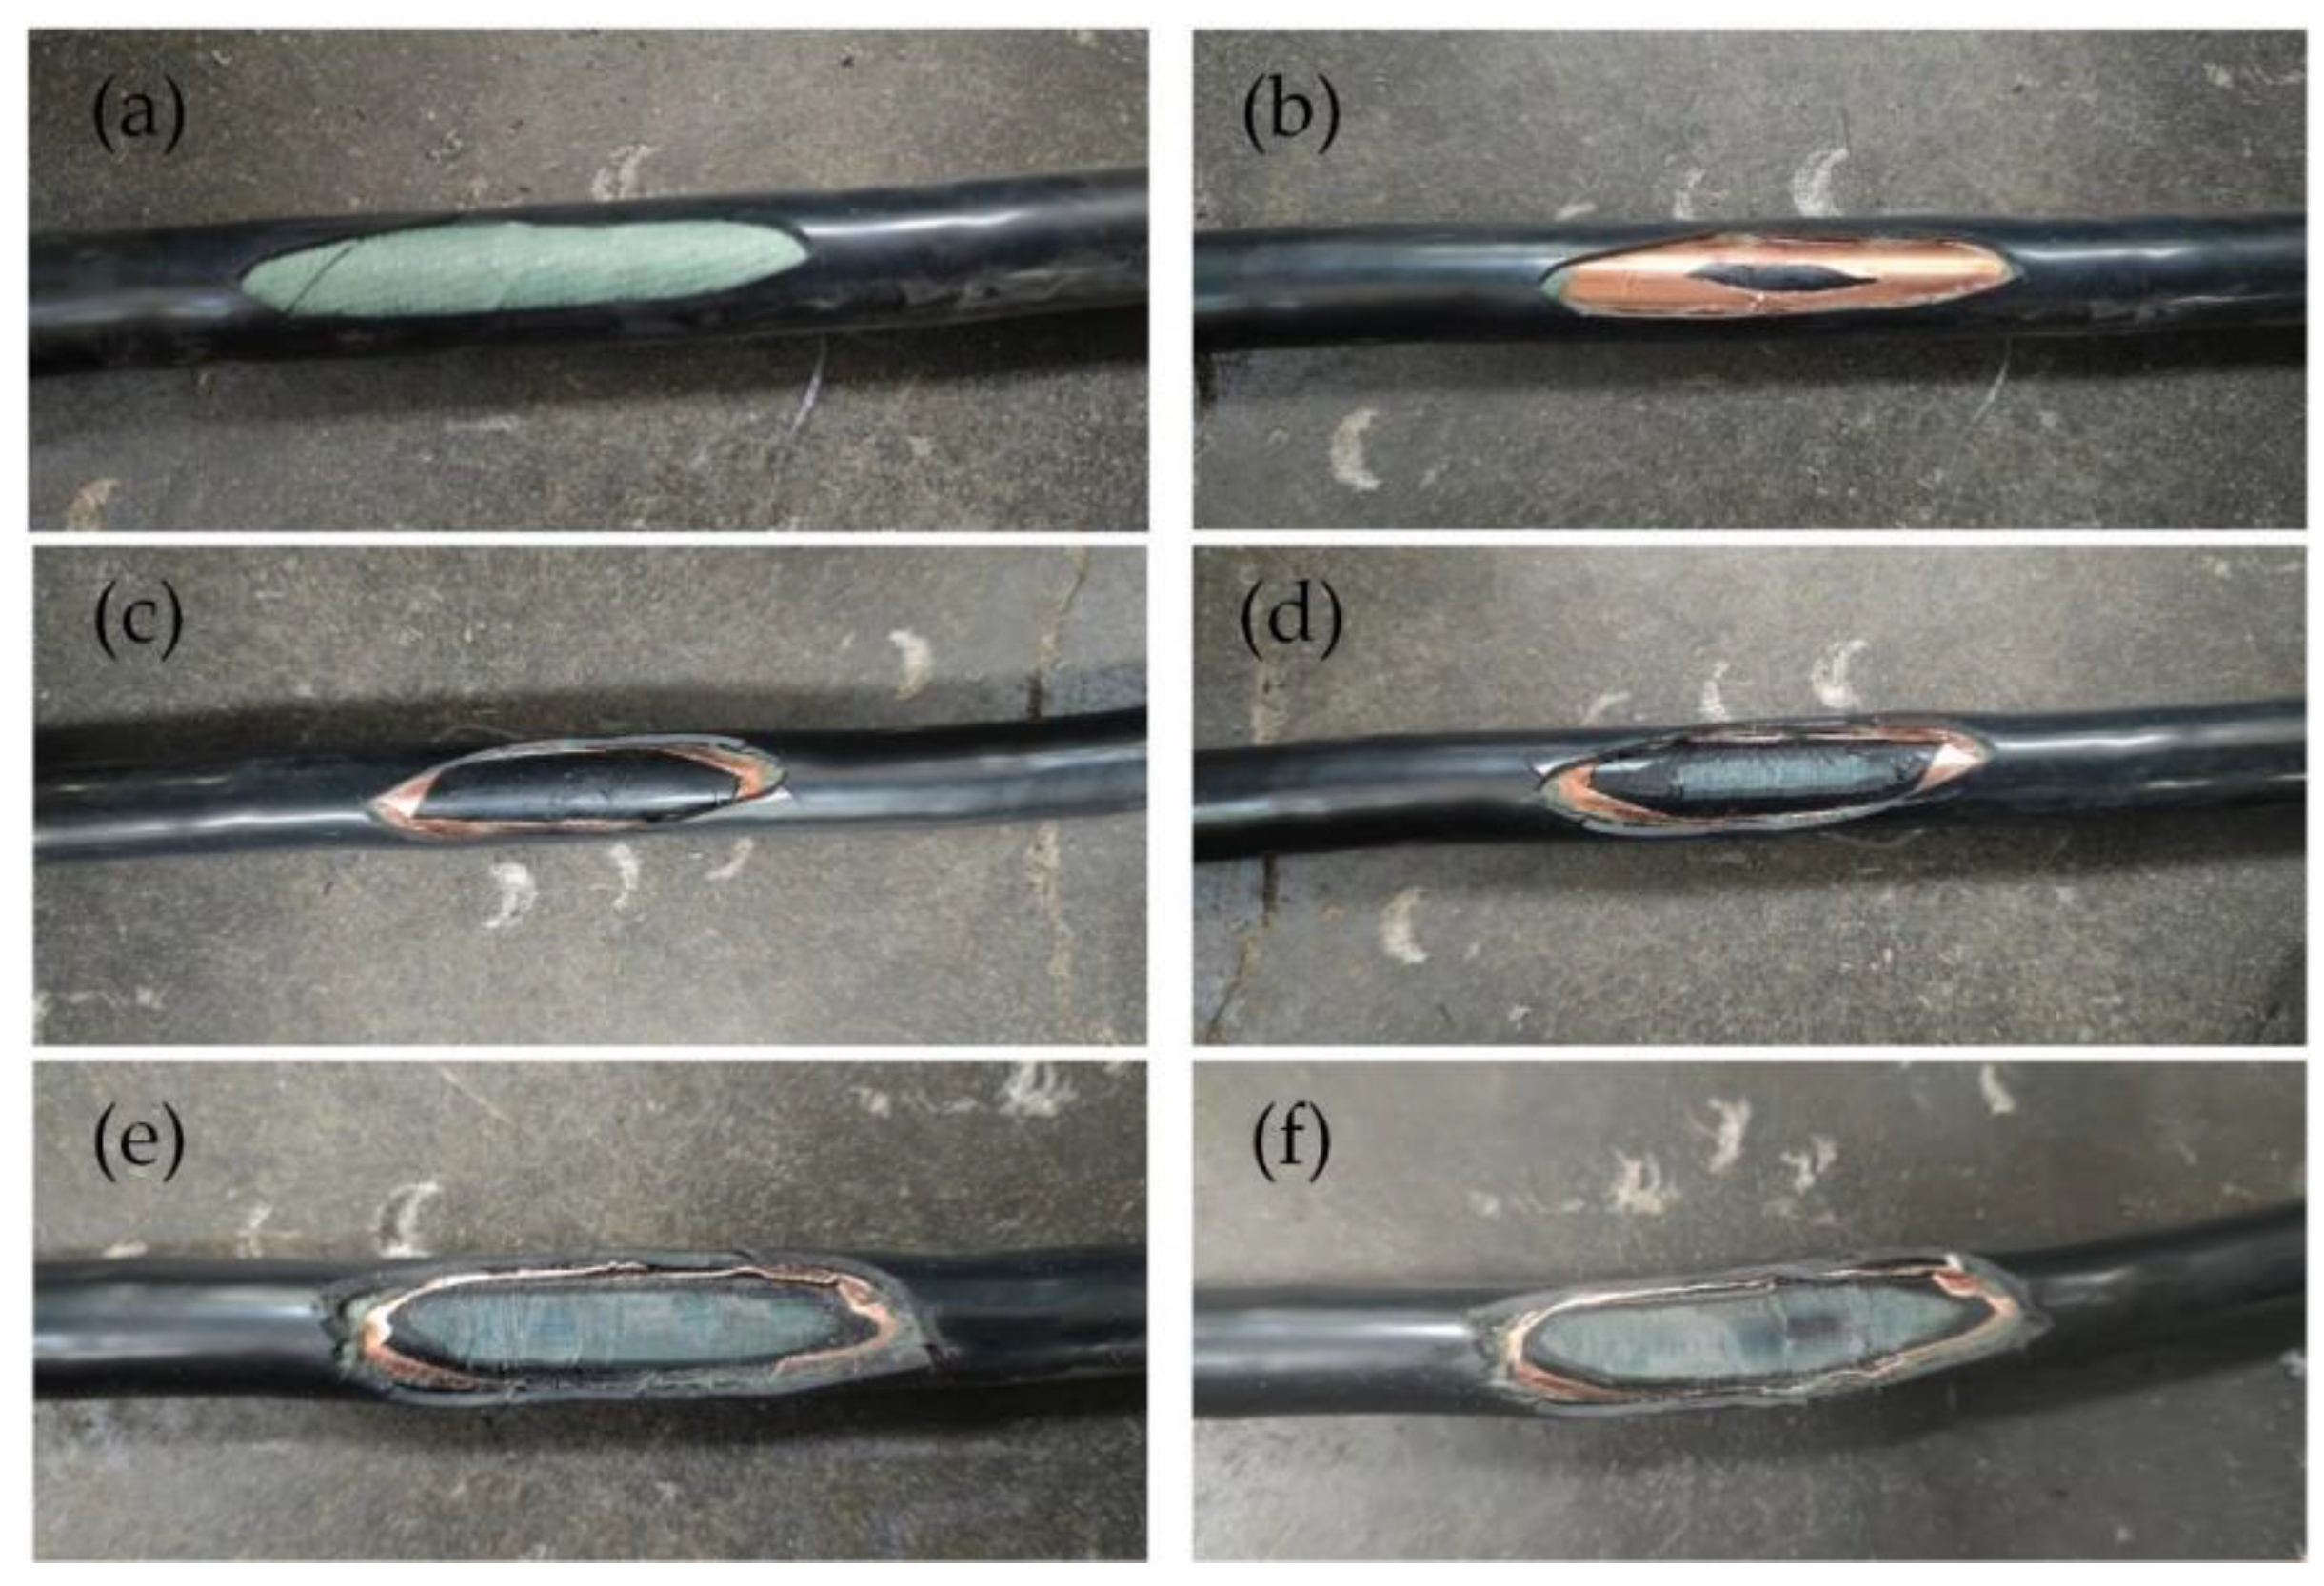
In this work, the location spectra of cables with different abrasion conditions were measured, as shown in Figure 7. The tested cable was YJLV-1 × 35 − 8.7/15 kV XLPE insulated cable and the length of the cable was 20 m. The thickness of XLPE insulation was 4.5 mm. The length of the abrasion was set to 5 cm. The location of the abrasion was 9 m away from the cable measurement port. The sheath of the cable was partly removed, and the copper shields were not damaged in sample a (shown in Figure 7a). The copper shields of samples b and c were worn down, and the difference between b and c was the size of defect area. Sample d could be characterized as abrasion on the semiconducting layer, and the cable insulation was not worn. Samples e and f could be characterized as insulation abrasion defects. Sample e was less worn, and the sample f was more worn. The inner semiconducting layer of the cable could be seen through the insulation in sample f.
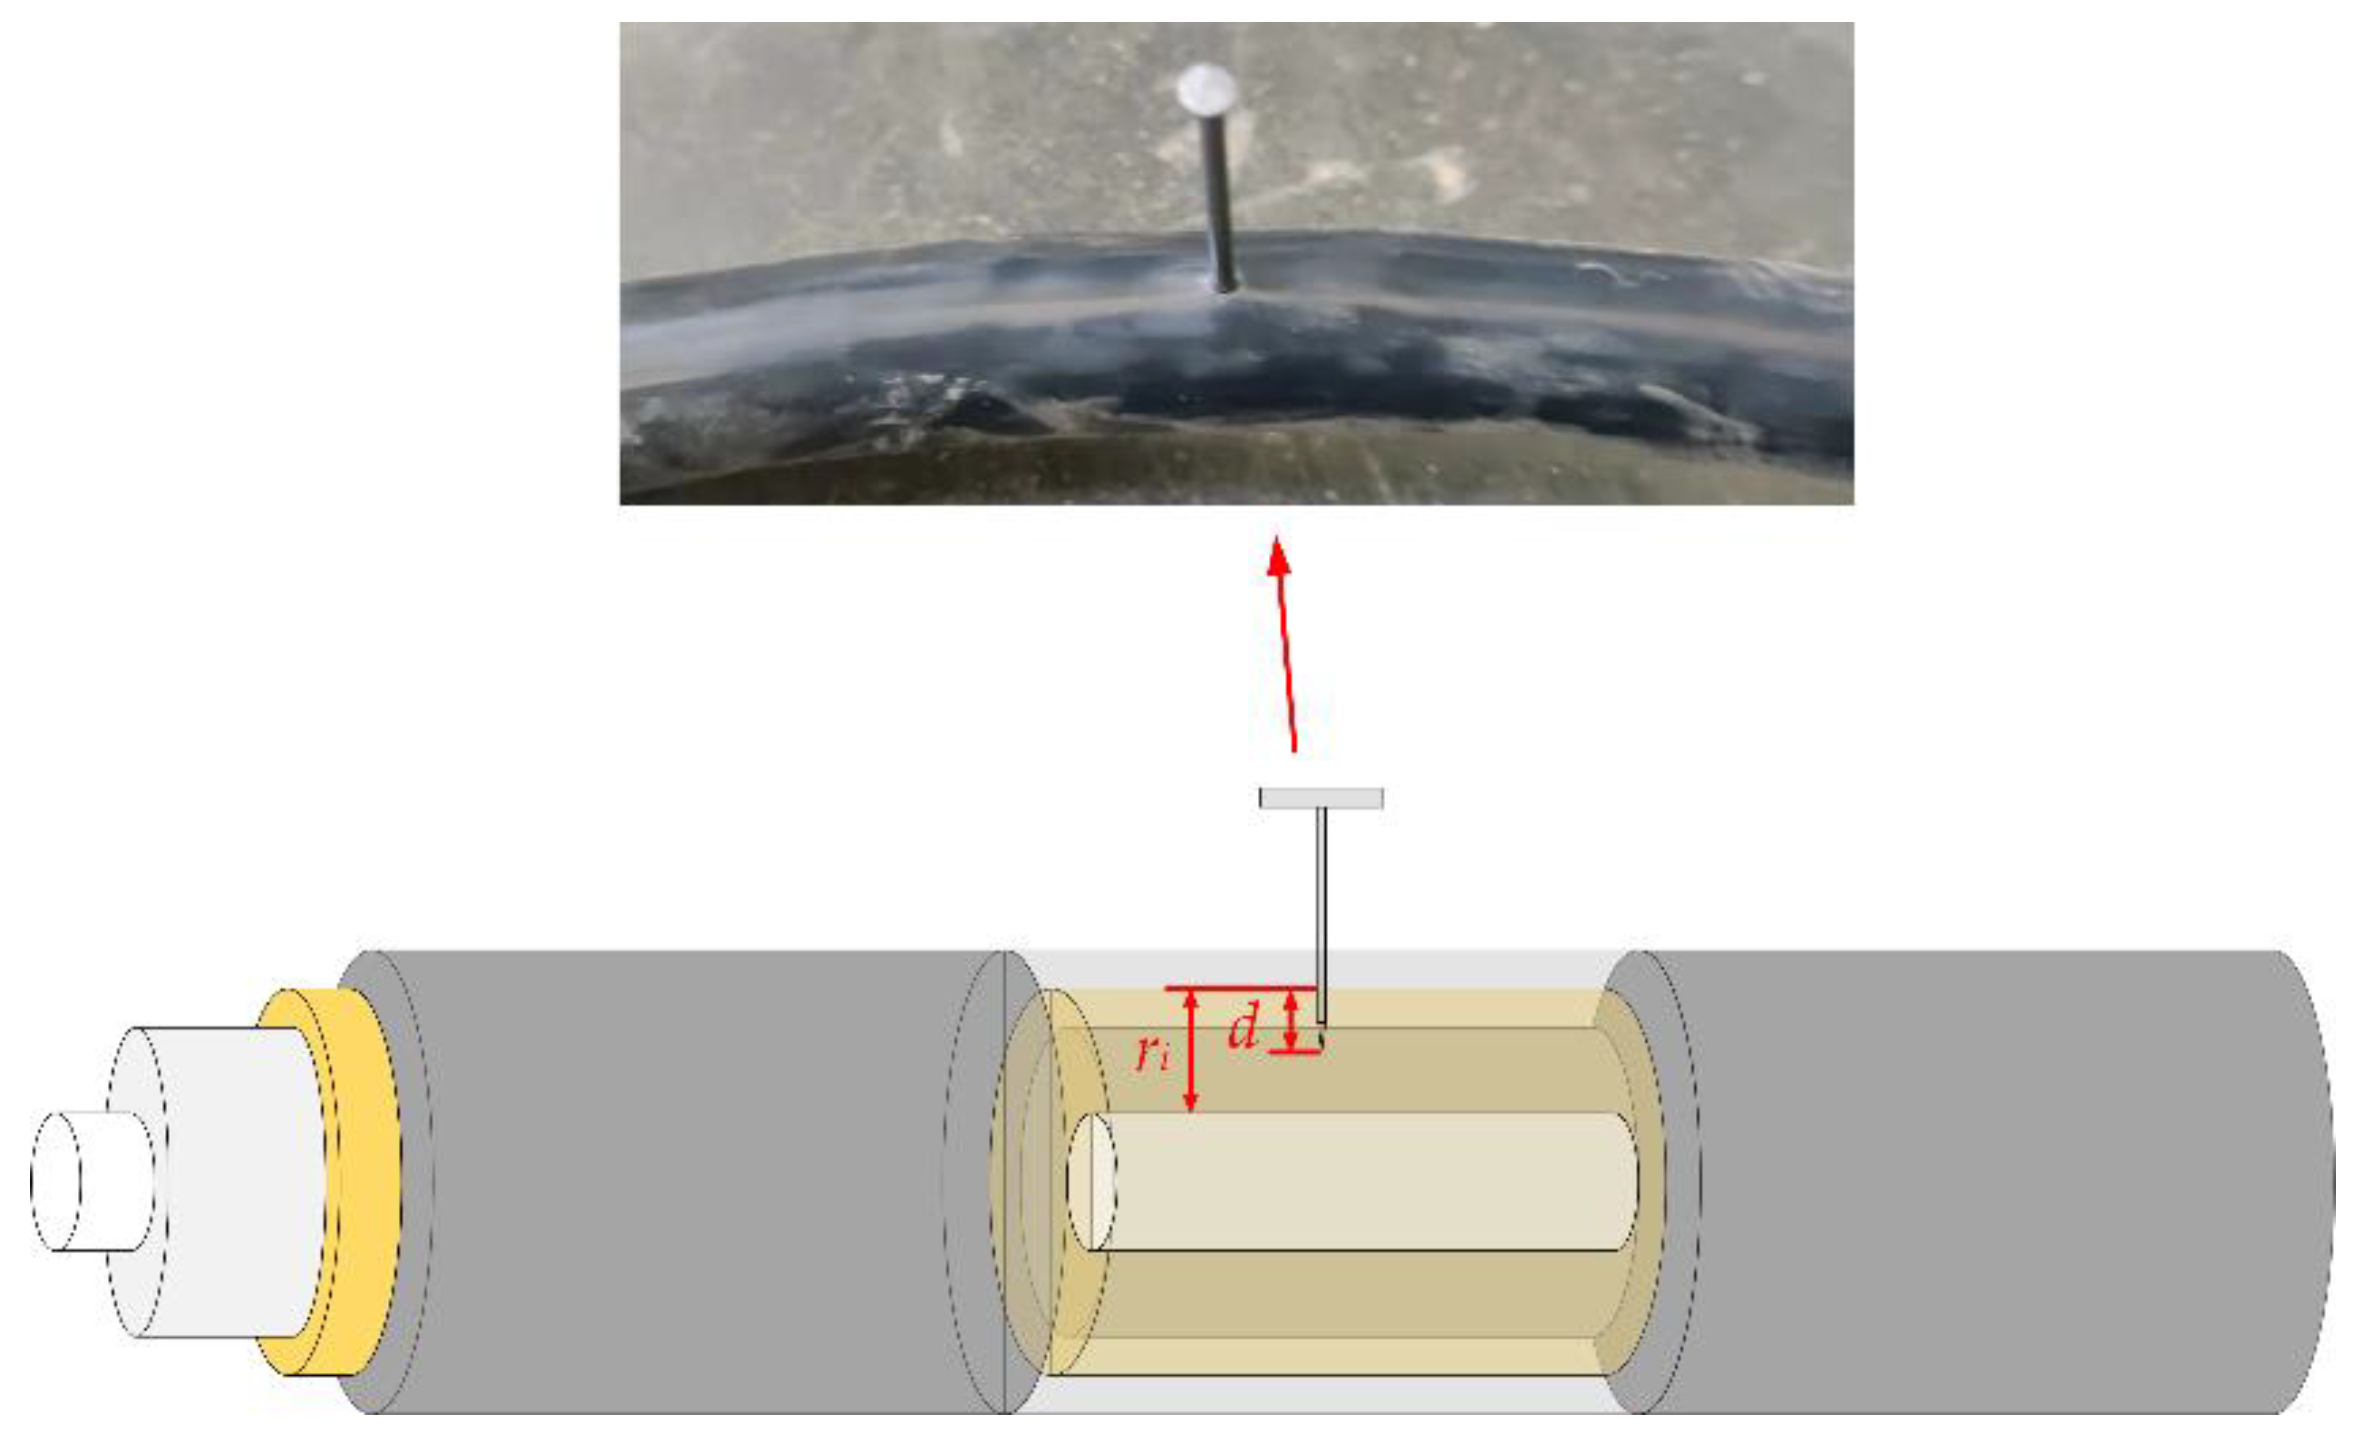
To analyze the locating ability of multiple defects, a nail was inserted in the same cable at 12.35 m after the test of abrasion defects, as shown in Figure 8. d represents the insertion depths of the nail, and ri represents the thickness of the XLPE insulation. The relative inserted depth is defined as n as follows:
n = d r i
BIS at different n (25%, 50%, 75%, and 100%) was measured.

3.2. Location Spectra of Samples

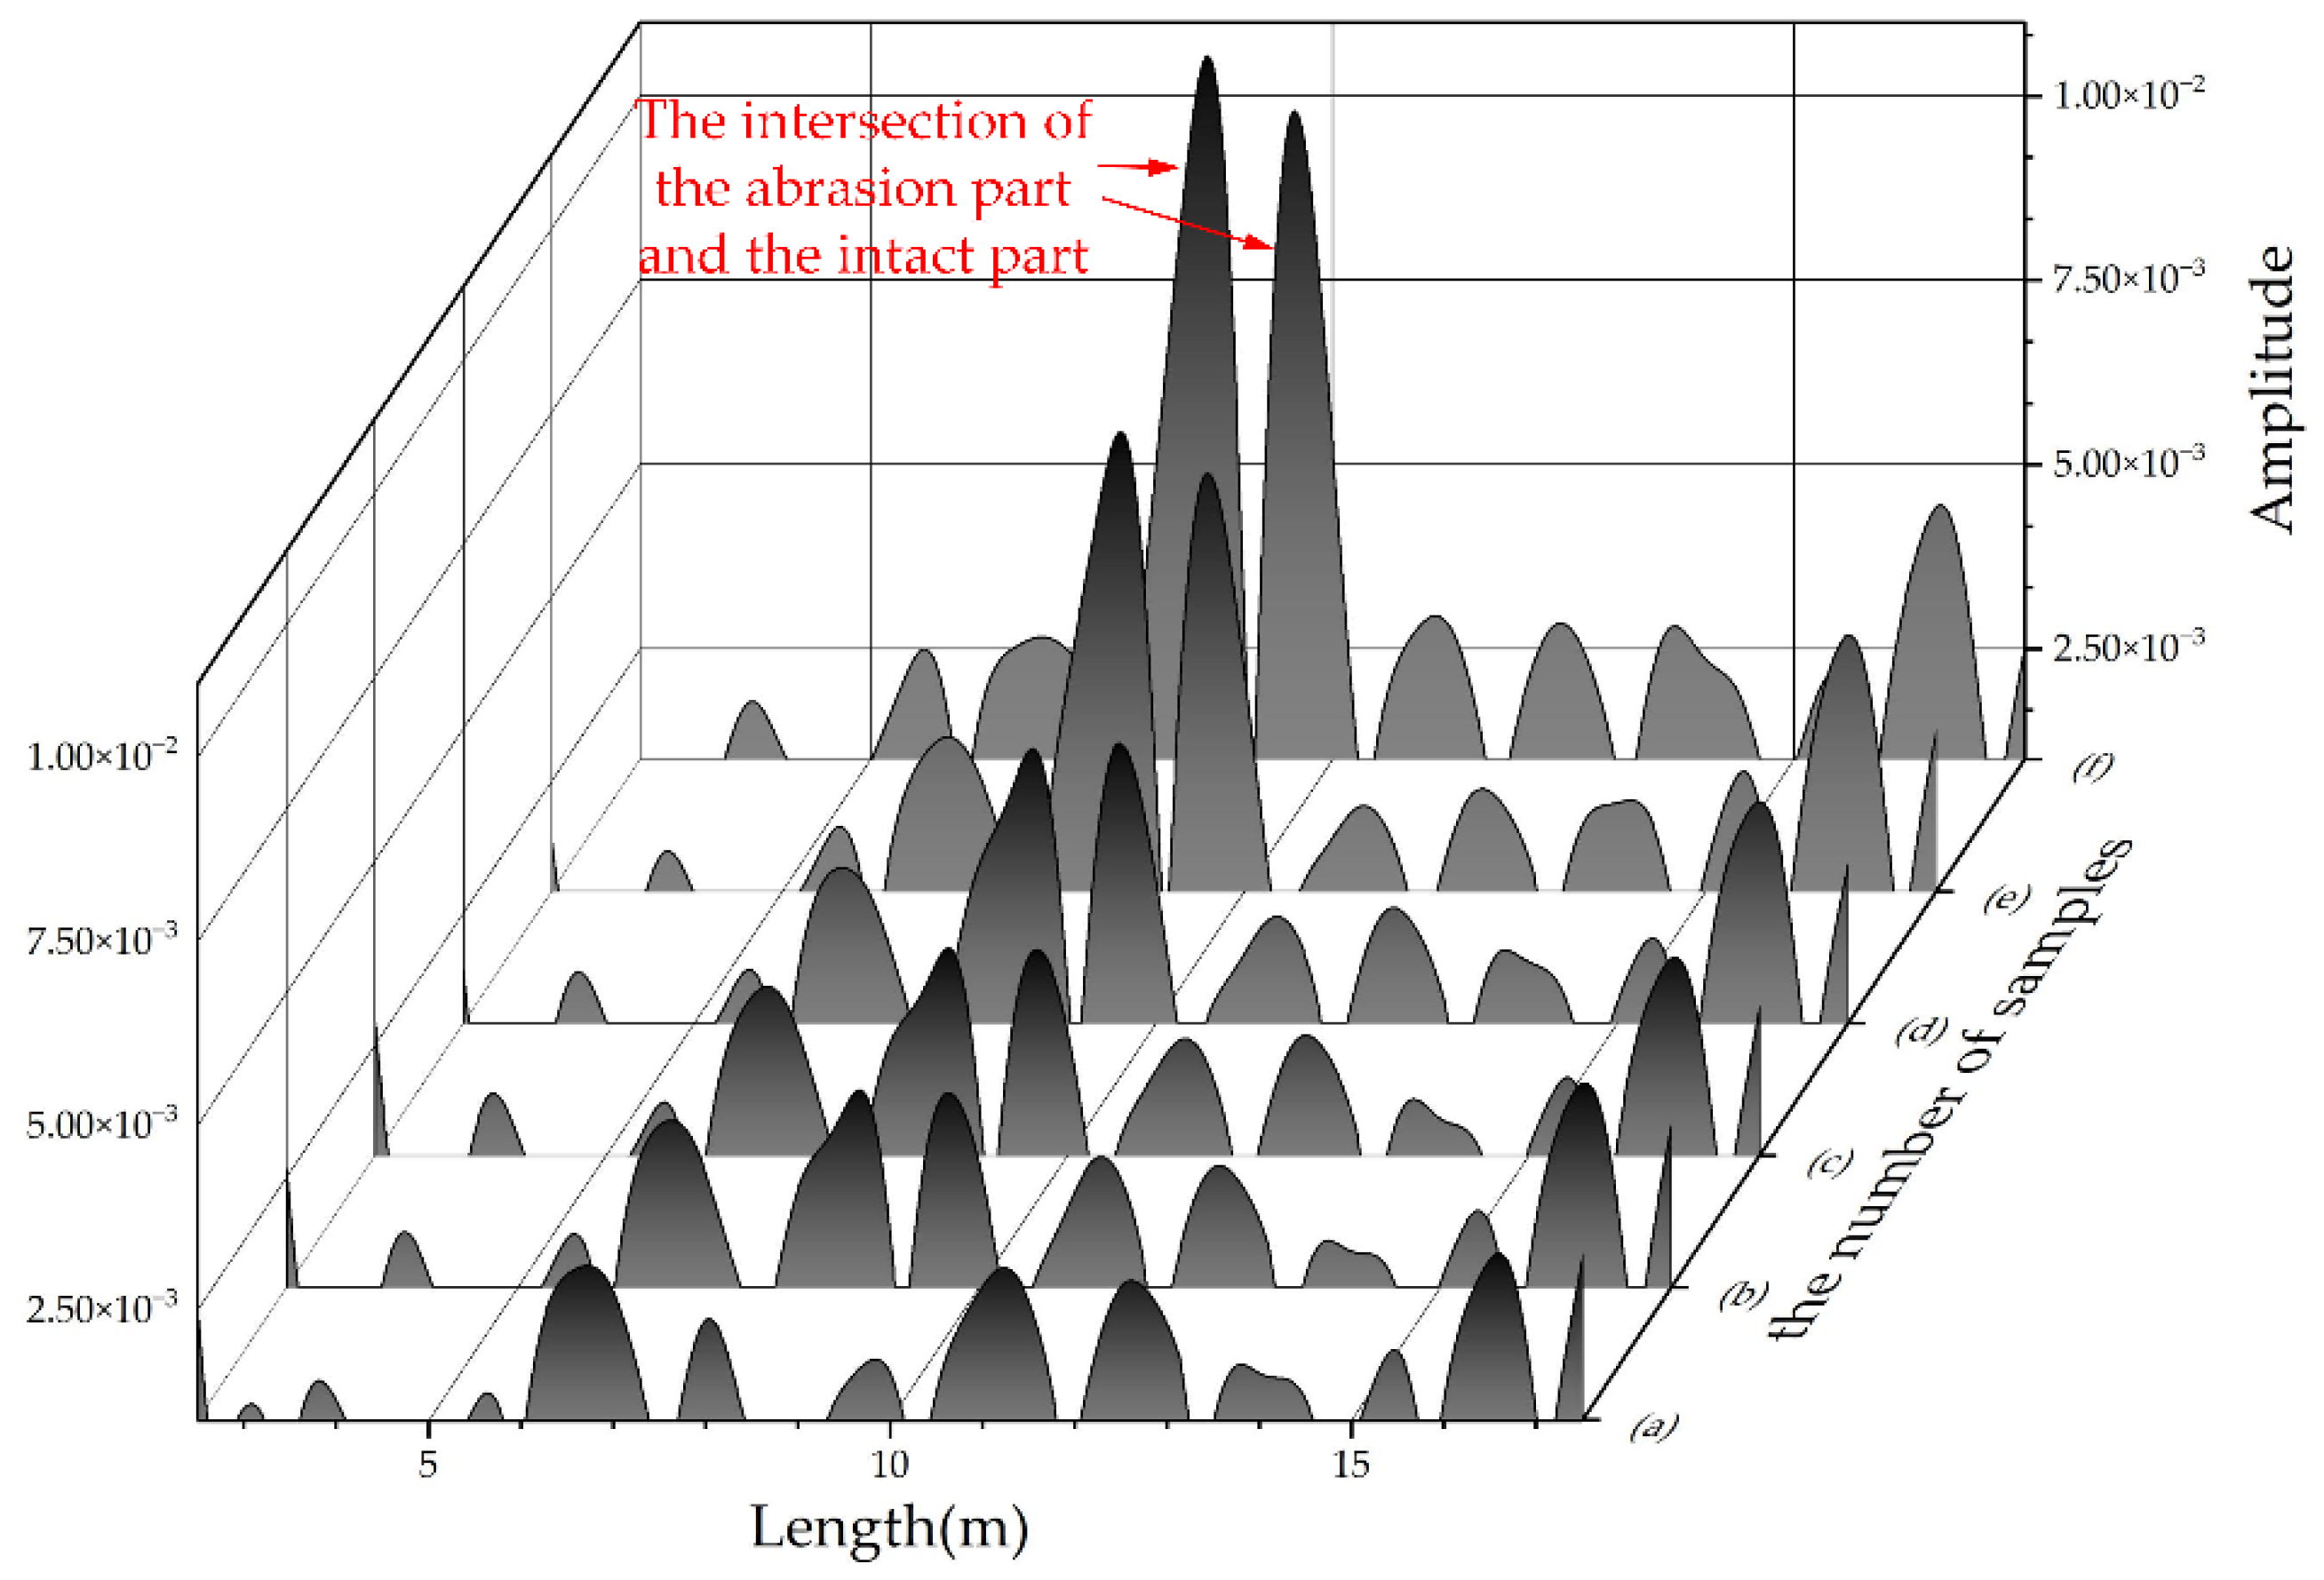
The location spectra of the tested cable are shown in Figure 9. Each location spectrum shows two peaks at the position of 9 m away from the measurement port, which correspond to the location where the wave impedance changes. When the sheath of the cable is broken and copper shields are intact, no reflected peaks appear in the location spectrum (sample a). This is because the sheath will not influence the distribution parameters of the cable, which are related only to the properties of the cable conductors and insulation. When the copper shields of the cable are worn down, there are two peaks in the location spectrum, and the maximum amplitude values are 3.64 × 10⁻³ and 3.68 × 10⁻³ (sample c). The location of the reflected peak corresponds to the intersection of the abrasion part and the intact part. When abrasion occurs on the semiconducting layer of the cable, the maximum amplitude values rise to 4.80 × 10⁻³ and 4.72 × 10⁻³ (sample d). When XLPE insulation is worn down, the maximum amplitude values increase to 9.56× 10⁻³ and 8.64× 10⁻³ (sample f).
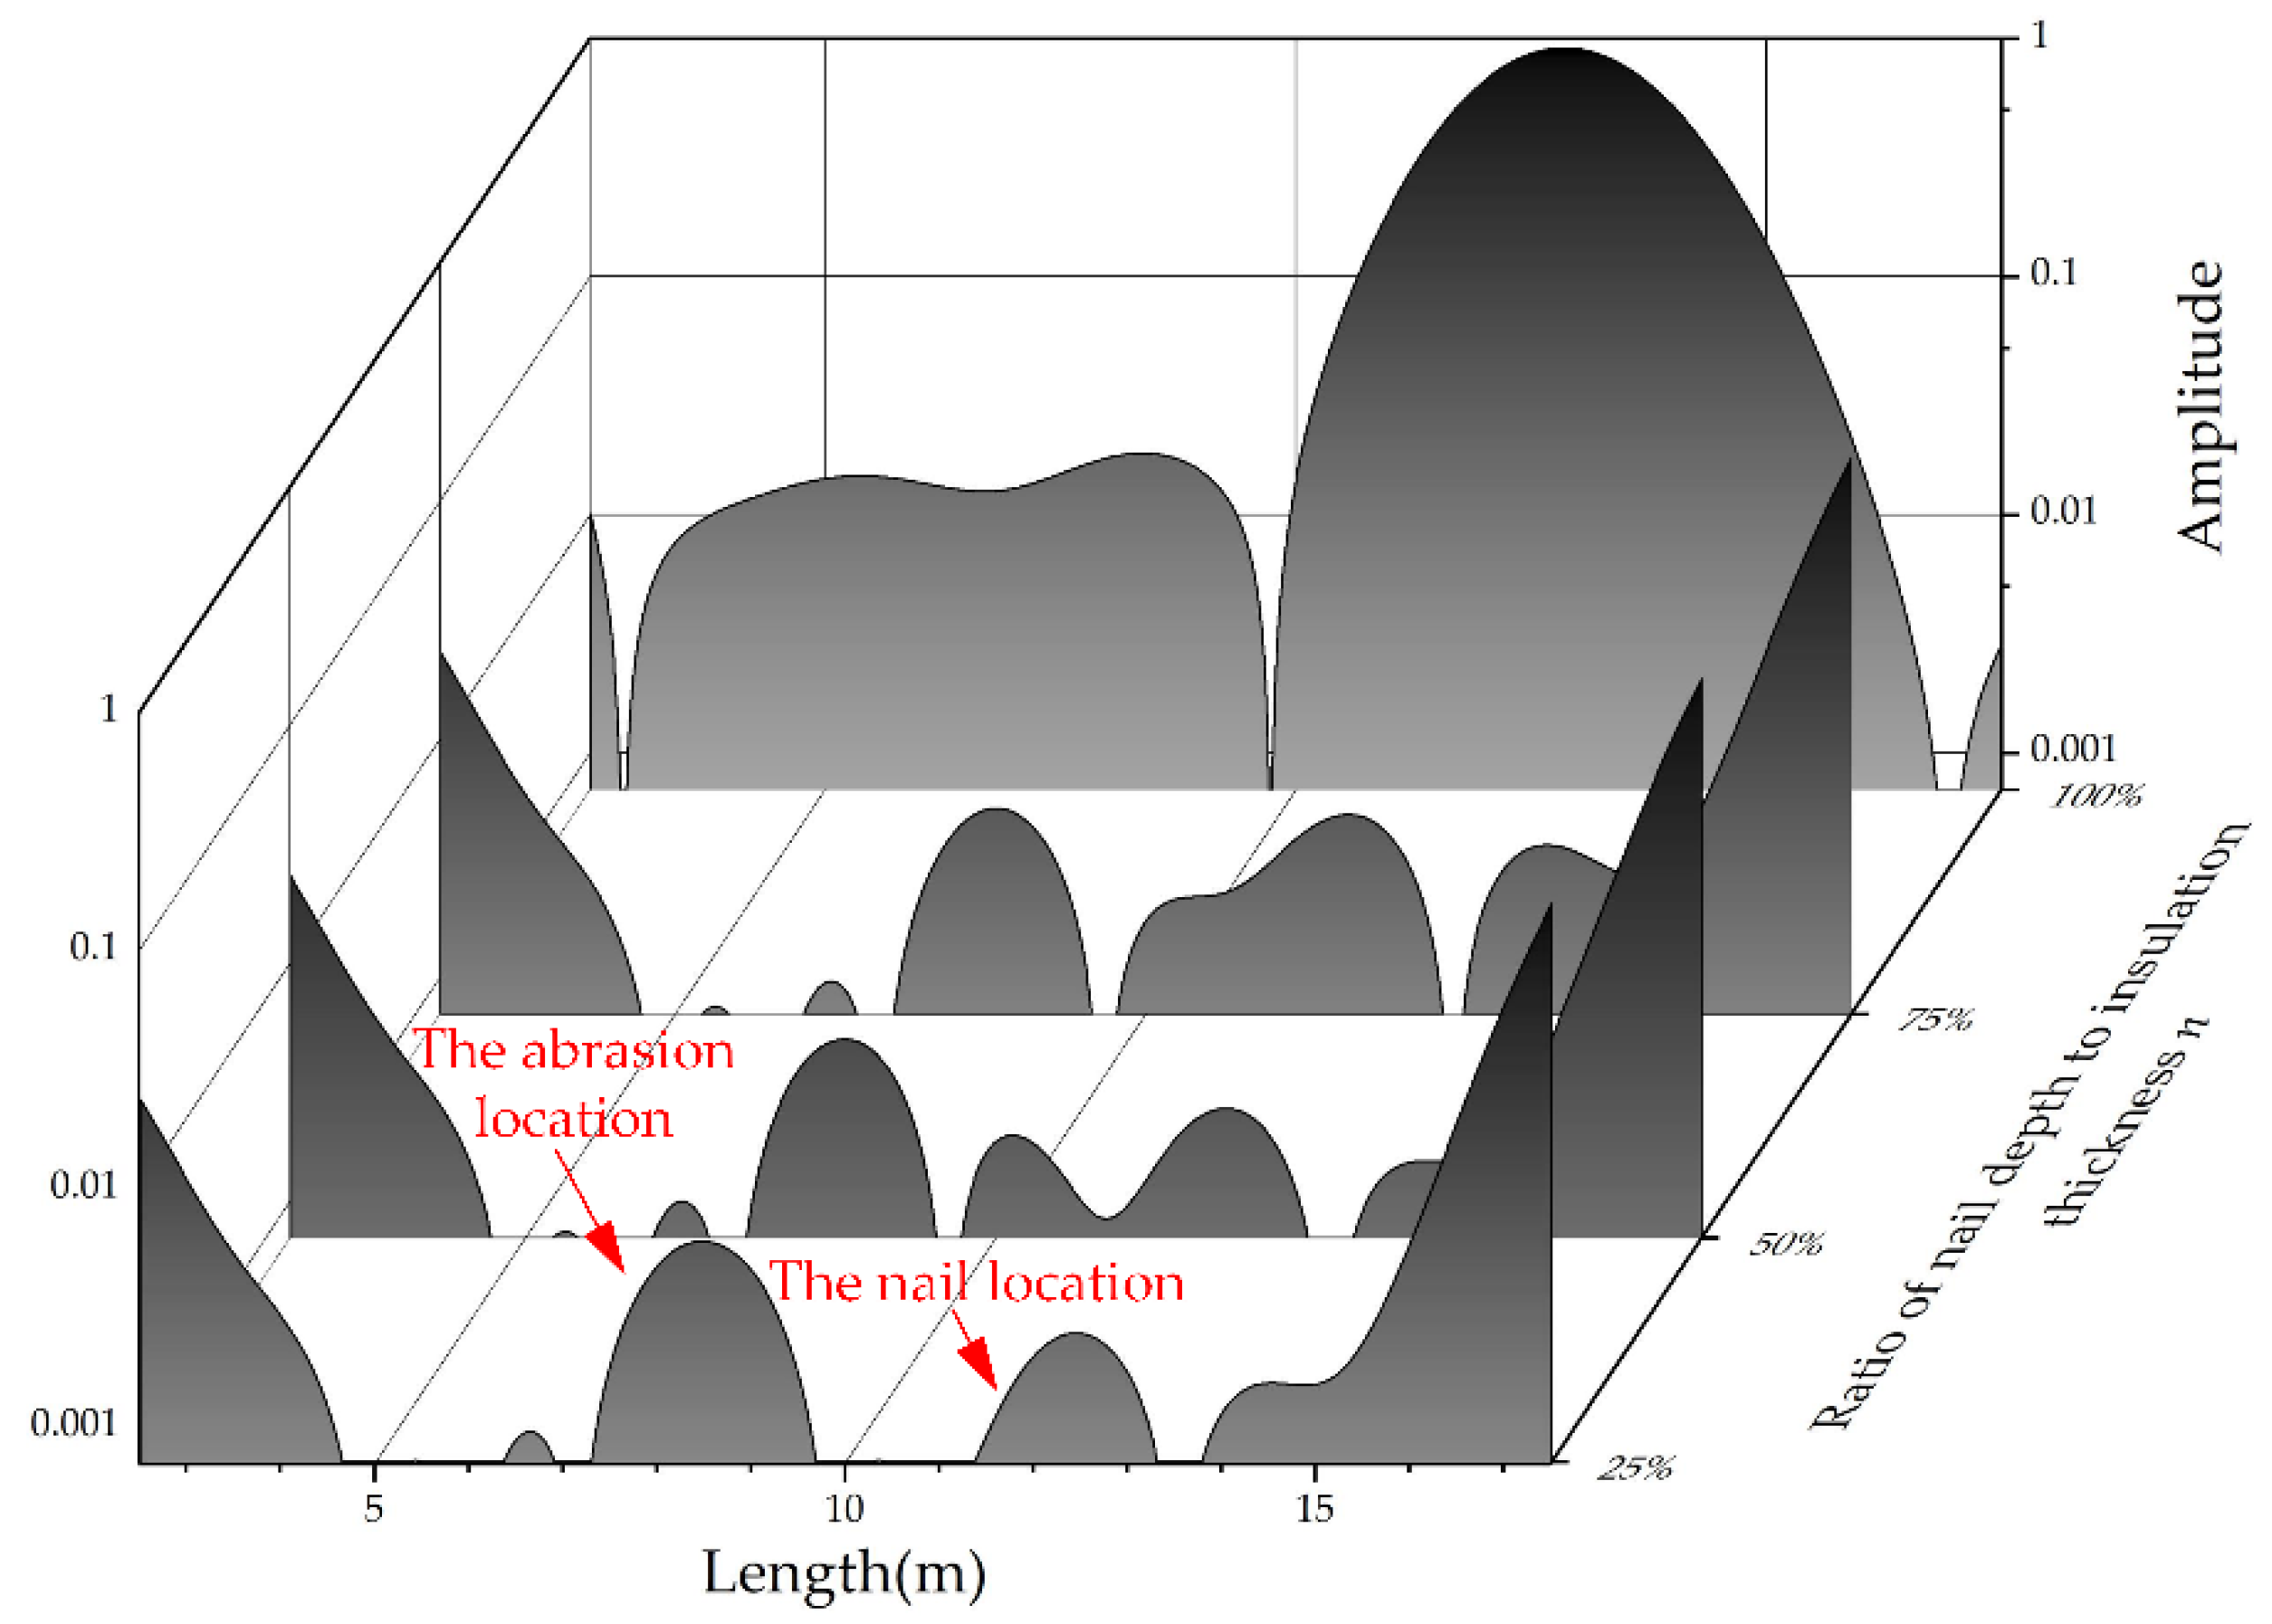
The location spectra of the nail insertion are shown in Figure 10. Each location spectrum shows a high peak at approximately 12.35 m, which also corresponds to the location of the inserted nail. When n reaches 25%, the maximum amplitude value of the reflected peaks is 2.43 × 10⁻³. When n reaches 50%, the value increases to 2.45 × 10⁻³. As n increases to 75%, the corresponding value increases to 4.80 × 10⁻³. When the nail has punctured the insulation completely, the value reaches 9.13 × 10⁻¹, and the distortion of the location spectrum is noticeable. When the relative inserted depth is less than or equal to 75%, the mechanical abrasion at 9 m can be correctly located. However, when n reaches 100%, it is challenging to identify the reflected peak at 9 m due to noise interference. The reason for the signal distortion is the short circuit between the cable core and the copper shield. The total reflection of the traveling wave occurs at the short circuit position, and the incident signal and reflected signal are superimposed between the measurement port and the short circuit location. The amplitude of the location spectrum increases, and the locating resolution decreases.

3.3. Locating Results of Abrasion and Nail Insertion

Since the reflected peaks appear at the two endpoints of the cable defect segment, the midpoint of the two peaks can be defined as the location of the local defect. The locations of the reflected peaks are calculated using the maximum value method, the centroid method, and the function fitting method. The locating deviation can be defined by:
E r r o r = l s l m l
where ls represents the defect location in the location spectrum, lm represents the actual location of the defect, and l represents the length of the tested cable.
Table 1 shows the locating results of abrasion obtained by the three peak recognition methods. Since two reflected peaks in the location spectrum at the starting point and the endpoint of the abrasion area correspond to the impedance mismatch points, the positioning result can be obtained from the midpoint of the reflected peak. The actual abrasion position is 9 m, and the locating results of the three methods are near this value.
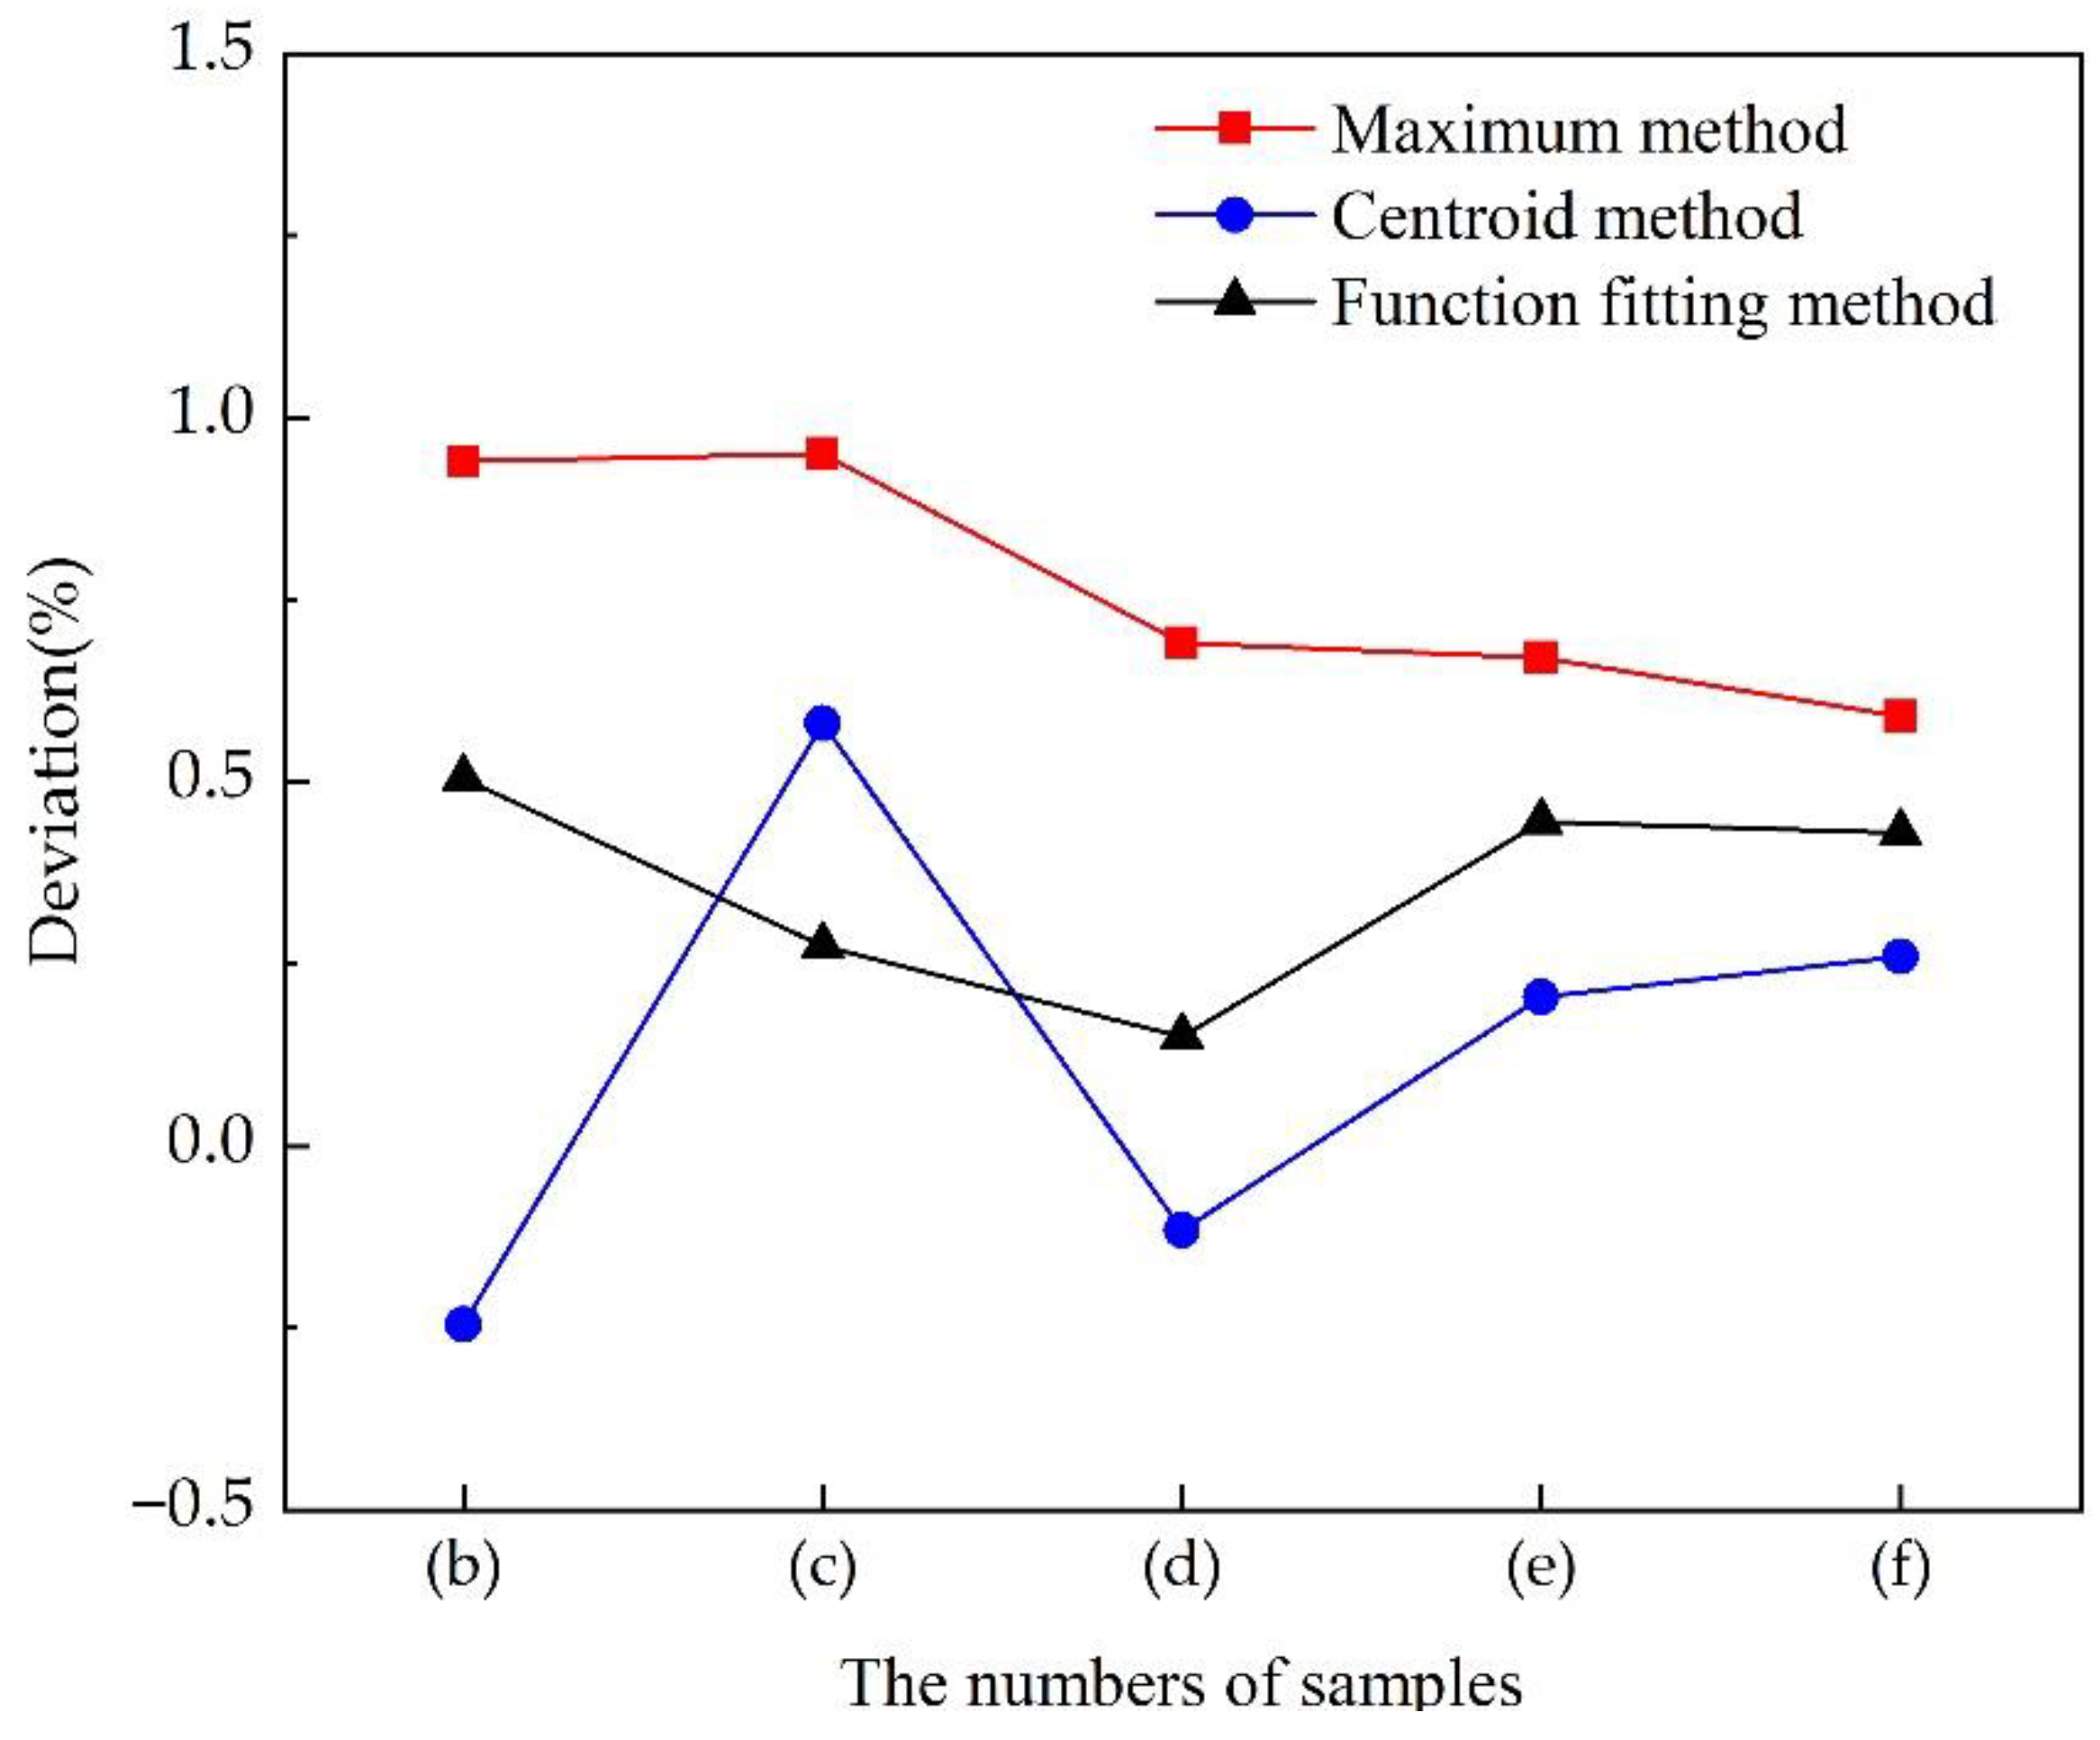
The abrasion locating deviations of the different methods are shown in Figure 11. The absolute value of the deviation of the maximum method is approximately 1%, which is larger than that of the other two methods. The wave impedance at the abrasion location is more mismatched with severe abrasion, and the reflected peak is more pronounced, improving the positioning accuracy. Therefore, the deviation decreases with more severe abrasion. The deviation of the function fitting method is approximately 0.5%. The deviation of the centroid method is approximately 0.25%, except for the sizeable locating deviation of sample c, which reaches 0.58%. The results show that different defect conditions have little effect on the accuracy of the centroid function fitting methods. These two methods can significantly improve the locating accuracy.
Table 2 shows the location of the nail insertion in the insulation. The measured nail insertion location is 12.35 m. Since the nail insertion area is small when the nails are inserted, the traveling wave has a considerable reflection at the nail location, and the defect can be located directly through the reflected peak location. When n reaches 50%, the error in the locating result is small. When n increases to 75%, the position of the reflected peak shifts to the measuring end. When the nail completely penetrates the insulation, the reflected peak shifts to the open circuit end.
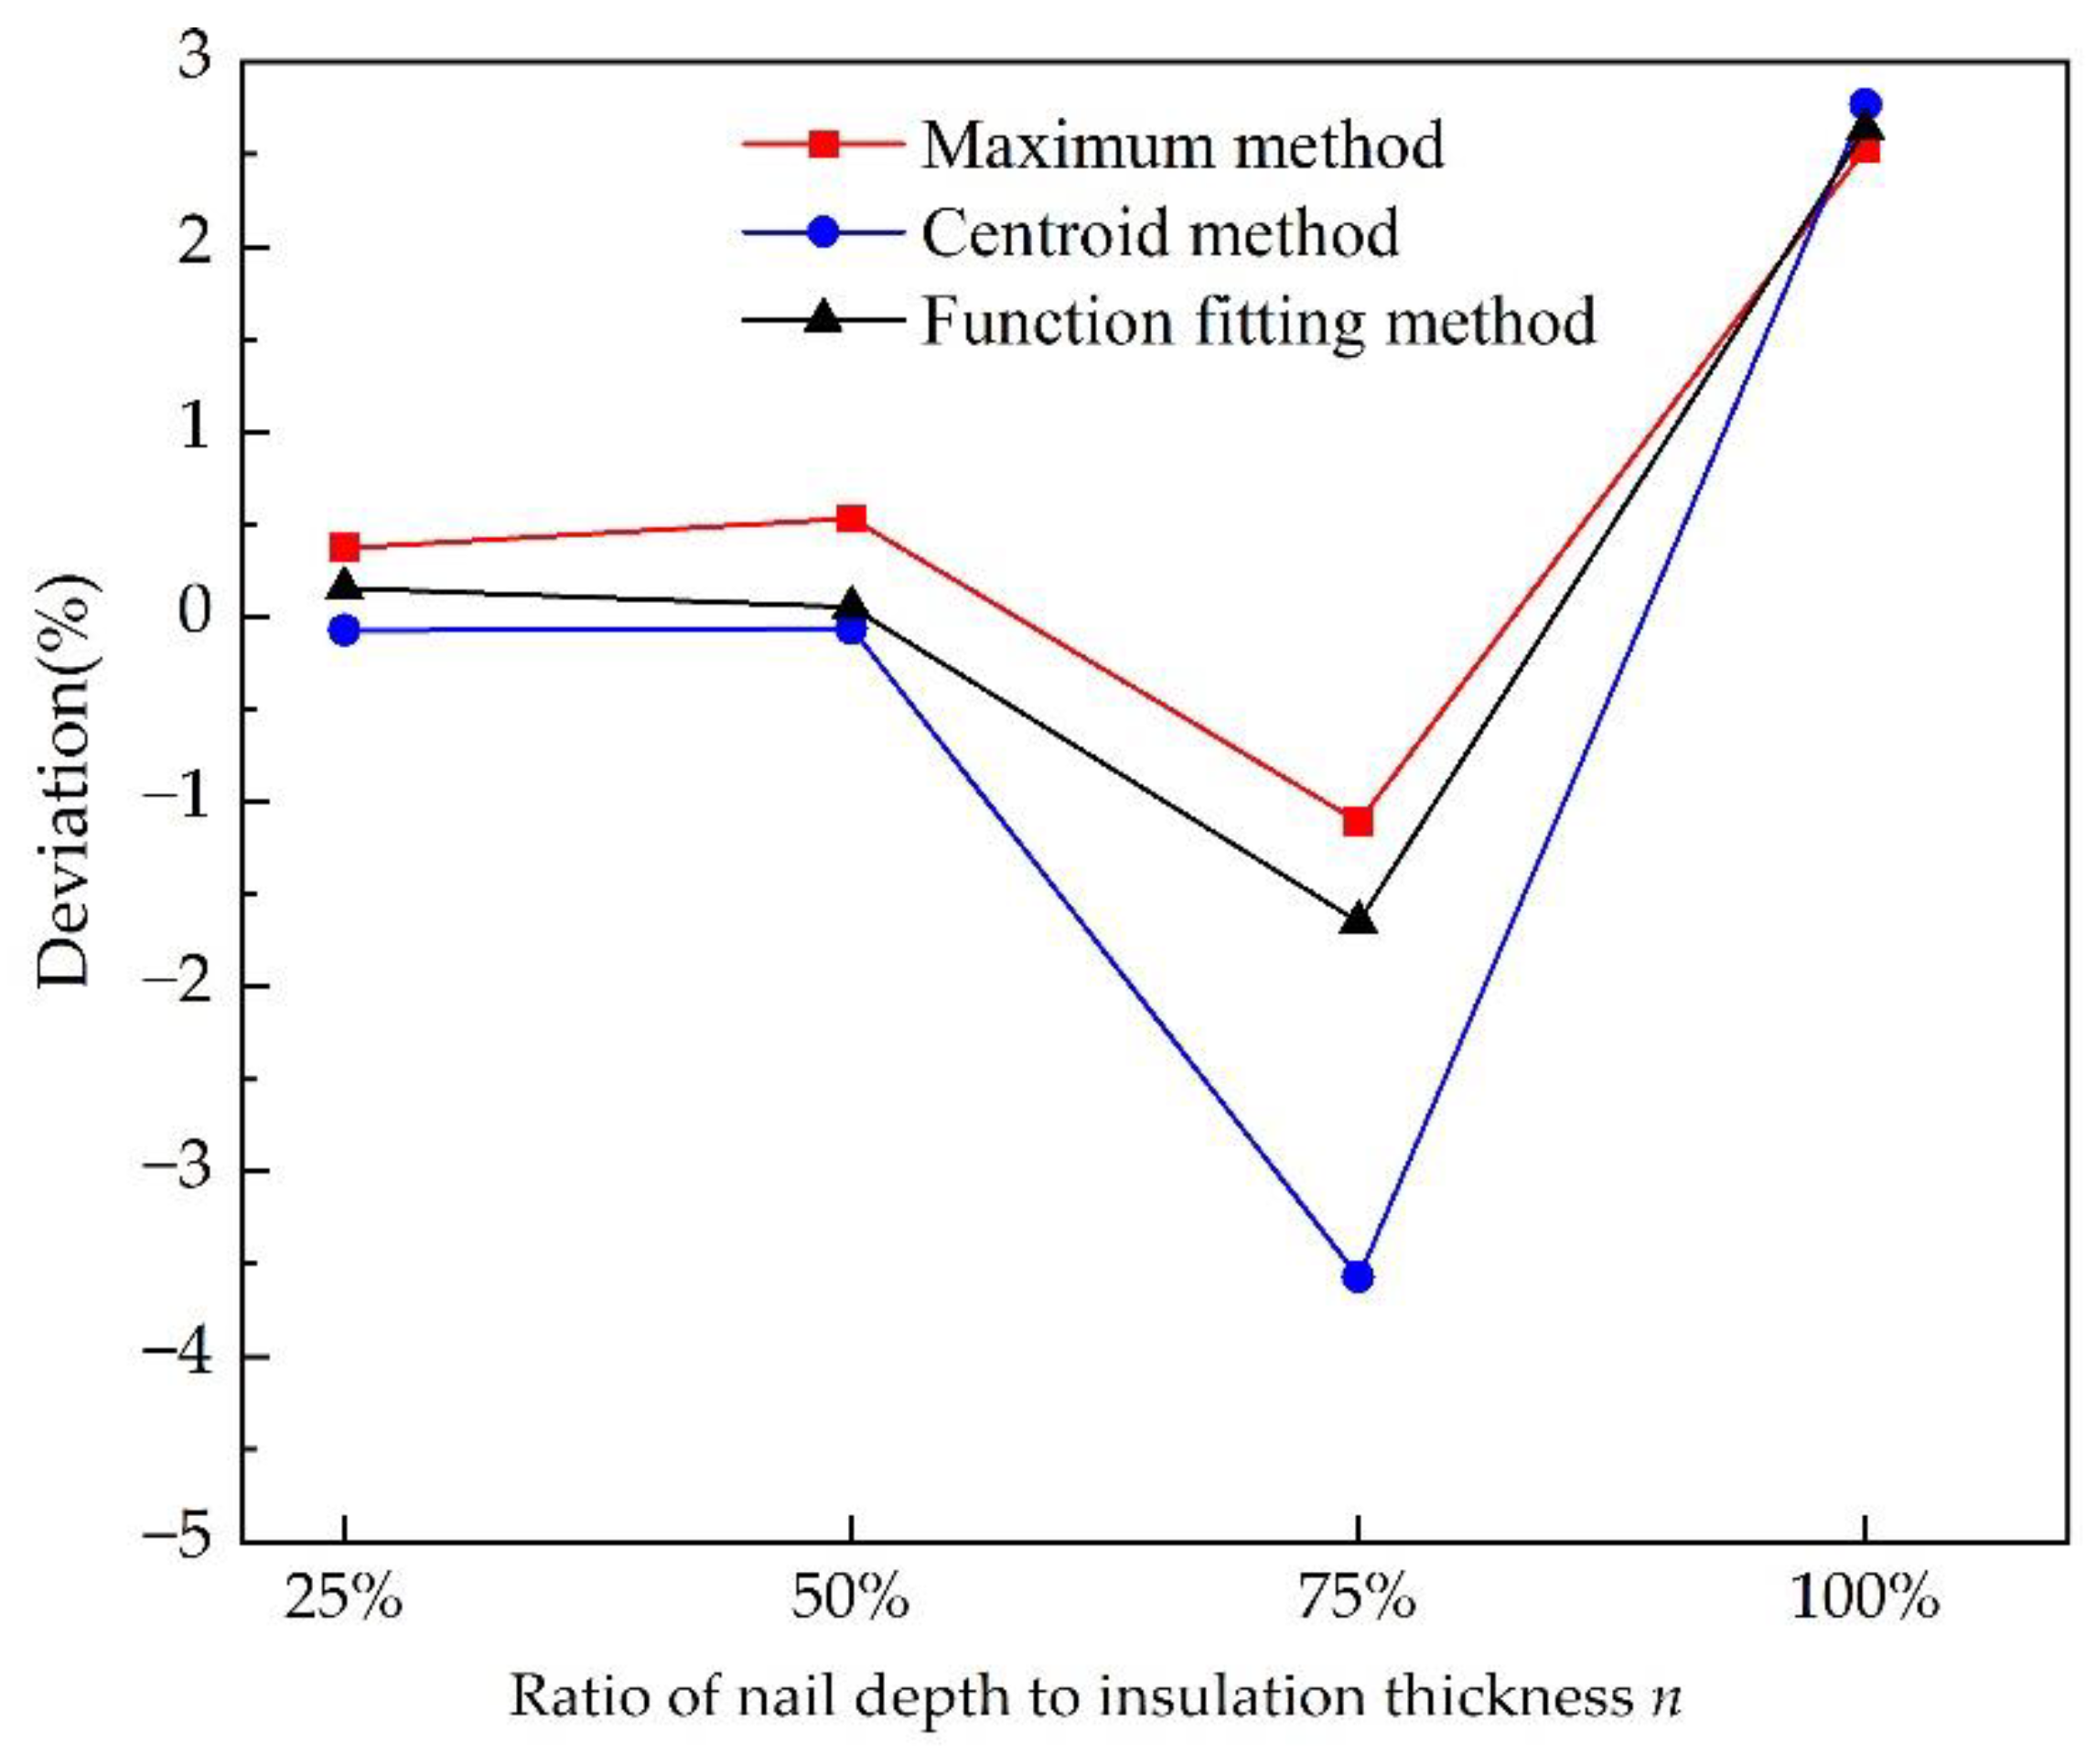
The locating deviations of different peak recognition methods are shown in Figure 12. When n is less than or equal to 50%, the deviation of locating the nail insertion is within 0.5%. The maximum absolute value of the deviation is approximately 4% when n reaches 75%. The deviation is approximately 3% when the nail penetrates the insulation. The changing trend of deviation obtained by different peak recognition methods is consistent. When the insertion depth of the nail is small, the locating accuracy of the centroid method and function fitting method is higher. When the depth of nail is larger (75%), the locating accuracy of the centroid method and function fitting method is lower than that of the maximum method. The reason for the larger locating error is the superimposition of the incident signal and reflected signal when the total reflection occurs. The total reflected signal with high amplitude has a significant influence on the location spectrum, and the accuracy will decrease.

4. Conclusions

In this work, a new defect-locating method was proposed, and the calculation process of the algorithm was analyzed. The selection principle of incident Gaussian signal was discussed, and the results of three different peak recognition methods were analyzed. The location spectra of long cables with different defects were measured. The locating deviations of different methods were analyzed. In our future work, we will focus on the research of 10 kV cable defect’s location and apply this algorithm to the on-site cable maintenance work. At the same time, the location algorithm will be further improved to reduce the noise and improve the locating resolution. The main conclusions are as follows:
  • The pulse width parameter c of the Gaussian signal is determined by the upper limit frequency of BIS. The proper c will improve the locating resolution.
  • The location spectrum can locate mechanical abrasion and an inserted nail in a 20 m cable. The location of the abrasion shows two reflected peaks, and the location of the inserted nail shows a single reflected peak.
  • In the location of abrasion, the deviation is within 1%. The centroid and function fitting methods can effectively reduce the positioning error.
  • When the depth of the nail insertion is small, the locating deviation is within 1%. The centroid method and function fitting method can reduce the locating error. When the nail insertion depth is greater, the absolute value of the deviation will be more significant, and the maximum absolute value is 4%.

Author Contributions

Conceptualization, L.W.; methodology, X.P.; software, J.S.; validation, T.H.; formal analysis, Y.Y.; investigation, T.H.; resources, L.W.; data curation, Y.Y.; writing—original draft preparation, L.W.; writing—review and editing, T.H. and X.P.; visualization, J.S.; supervision, T.H.; project administration, T.H.; funding acquisition, L.W. All authors have read and agreed to the published version of the manuscript.

Funding

This research was funded by Science and Technology Project of State Grid Corporation of China (No. kj2021-049); Natural Science Foundation of Hebei Province (No. E2021521003).

Institutional Review Board Statement

Not applicable.

Informed Consent Statement

Not applicable.

Data Availability Statement

The data presented in this study are available on request from the corresponding author. The data are not publicly available due to privacy reasons.

Conflicts of Interest

The authors declare no conflict of interest.

References

  1. Rybarz, J.; Borucki, S.; Kunicki, M.; Kucińska-Landwójtowicz, A.; Wajnert, D. Influence of the Cable Accessories Installing Method on the Partial Discharge Activity in Medium Voltage Cables. Energies 2022, 15, 4216. [Google Scholar] [CrossRef]
  2. Diban, B.; Mazzanti, G. The Effect of Insulation Characteristics on Thermal Instability in HVDC Extruded Cables. Energies 2021, 14, 550. [Google Scholar] [CrossRef]
  3. Shahid, M.; Khan, T.; Zafar, T.; Hashmi, M.; Imran, M. Health diagnosis scheme for in-service low voltage Aerial Bundled Cables using super-heterodyned airborne Ultrasonic testing. Electr. Pow. Sys. Res. 2020, 180, 106162. [Google Scholar] [CrossRef]
  4. Zhang, Y.; Li, T. Fault location for overhead and cable hybrid transmission lines based on the difference quantities of forward propagating waves and backward propagating waves in HVDC systems. Electr. Pow. Sys. Res. 2022, 203, 107642. [Google Scholar] [CrossRef]
  5. Li, G.; Liang, X.; Zhang, J.; Li, X.; Wei, Y.; Hao, C.; Lei, Q.; Li, S. Insulation Properties and Interface Defect Simulation of Distribution Network Cable Accessories Under Moisture Condition. IEEE Trans. Dielectr. Electr. Insul. 2022, 29, 403–411. [Google Scholar] [CrossRef]
  6. Shan, B.; Li, S.; Yu, L.; Wang, W.; Li, C.; Meng, X. Effect of Segmented Thermal Aging on Defect Location Accuracy in XLPE Distribution Cables. IEEE Access 2021, 9, 134753–134761. [Google Scholar] [CrossRef]
  7. Ning, Y.; Wang, D.; Li, Y.; Zhang, H. Location of Faulty Section and Faults in Hybrid Multi-Terminal Lines Based on Traveling Wave Methods. Energies 2018, 11, 1105. [Google Scholar] [CrossRef] [Green Version]
  8. Baayeh, A.G.; Bayati, N. Adaptive Overhead Transmission Lines Auto-Reclosing Based on Hilbert–Huang Transform. Energies 2020, 13, 5416. [Google Scholar] [CrossRef]
  9. Cataldo, A.; de Benedetto, E.; Masciullo, A.; Cannazza, G. A New Measurement Algorithm for TDR-based Localization of Large Dielectric Permittivity Variations in Long-distance Cable Systems. Measurement 2021, 174, 109066. [Google Scholar] [CrossRef]
  10. Cheng, B.; Hua, L.; Zhu, W.; Zhang, Q.; Lei, J.; Xiao, H. Distributed Temperature Sensing with Unmodified Coaxial Cable based on Random Reflections in TDR Signal. Meas. Sci. Technol. 2018, 30, 015105. [Google Scholar] [CrossRef]
  11. Addad, M.; Djebbari, A. Simultaneous Multiple Cable Fault Locating using Zero Correlation Zone Codes. IEEE Sens. J. 2021, 21, 907–913. [Google Scholar] [CrossRef]
  12. Addad, M.; Djebbari, A. Spread Spectrum Sensing Based on ZCZ Sequences for the Diagnosis of Noisy Wired Networks. IEEE Sens. J. 2021, 21, 914–920. [Google Scholar] [CrossRef]
  13. Bittner, T.; Bajodek, M.; Bore, T.; Vourc’h, E.; Scheuermann, A. Determination of the Porosity Distribution during an Erosion Test Using a Coaxial Line Cell. Sensors. 2019, 19, 611. [Google Scholar] [CrossRef] [PubMed] [Green Version]
  14. Shi, X.; Liu, Y.; Xu, X.; Jing, T. Online Detection of Aircraft ARINC Bus Cable Fault Based on SSTDR. IEEE Syst. J. 2021, 15, 2482–2491. [Google Scholar] [CrossRef]
  15. Berger, W.; Furse, C. Spread Spectrum Techniques for Measurement of Dielectric Aging on Low Voltage Cables for Nuclear Power Plants. IEEE Trans. Dielectr. Electr. Insul. 2021, 28, 1028–1033. [Google Scholar] [CrossRef]
  16. Hu, S.; Wang, L.; Mao, J.; Gao, C.; Zhang, B.; Yang, S. Synchronous Online Diagnosis of Multiple Cable Intermittent Faults Based on Chaotic Spread Spectrum Sequence. IEEE Trans. Ind. Electron. 2019, 66, 3217–3226. [Google Scholar] [CrossRef]
  17. Edun, A.; Tumkur Jayakumar, N.; Kingston, S.; Furse, C.; Scaepulla, M.; Harley, J. Spread Spectrum Time Domain Reflectometry With Lumped Elements on Asymmetric Transmission Lines. IEEE Sens. J. 2021, 21, 921–929. [Google Scholar] [CrossRef]
  18. Kim, H.; Park, J.; Mun, J.; Kim, D.; Hwangbo, S.; Yi, D.; Byun, J. Sensitivity Analysis of Water Tree and Input Pulse Parameters for Time-Domain Reflectometry of Power Cables Using Taguchi Method. J. Electr. Eng. Technol. 2021, 16, 633–642. [Google Scholar] [CrossRef]
  19. Tang, Z.; Zhou, K.; Meng, P.; Li, Y. A Frequency-Domain Location Method for Defects in Cables Based on Power Spectral Density. IEEE Trans. Instrum. Meas. 2022, 71, 1–10. [Google Scholar] [CrossRef]
  20. Yamada, T.; Hirai, N.; Ohki, Y. Improvement in Sensitivity of Broadband Impedance Spectroscopy for Locating Degradation in Cable Insulation by Ascending the Measurement Frequency. In Proceedings of the 2012 IEEE International Conference on Condition Monitoring and Diagnosis, Bali, Indonesia, 23–27 September 2012; pp. 677–680. [Google Scholar] [CrossRef]
  21. Ohki, Y.; Hirai, N. Comparison of Location Abilities of Degradation in a Polymer-Insulated Cable between Frequency Domain Reflectometry and Line Resonance Analysis. In Proceedings of the 2016 IEEE International Conference on High Voltage Engineering and Application (ICHVE), Chengdu, China, 19–22 September 2016; pp. 1–4. [Google Scholar] [CrossRef]
  22. Cao, Y.; Meng, P.; Zhou, K.; Jin, Y.; Zhou, T.; Yang, J.; Wu, W. Defects Location of Multi-Impedance Mismatched of Power Cables Based on FDR Method with Dolph-Chebyshev Window. In Proceedings of the 2011 22nd International Symposium on High Voltage Engineering (ISH 2021), Xi’an, China, 21–26 November 2011; pp. 1810–1815. [Google Scholar] [CrossRef]
  23. Scarpetta, M.; Spadavecchia, M.; Adamo, F.; Ragolia, M.A.; Giaquinto, N. Detection and Characterization of Multiple Discontinuities in Cables with Time-Domain Reflectometry and Convolutional Neural Networks. Sensors 2021, 21, 8032. [Google Scholar] [CrossRef]
  24. Ohki, Y.; Hirai, N. Effects of the Structure and Insulation Material of a Cable on the Ability of a Location Method by FDR. IEEE Trans. Dielectr. Electr. Insul. 2016, 23, 77–84. [Google Scholar] [CrossRef]
  25. Ohki, Y.; Hirai, N. Location Attempt of a Degraded Portion in a Long Polymer-Insulated Cable. IEEE Trans. Dielectr. Electr. Insul. 2018, 25, 2461–2466. [Google Scholar] [CrossRef]
  26. Zhang, H.; Mu, H.; Zou, X.; Zhang, D.; Zhang, G.; Xie, C. A Novel Method for Identifying Cable Defect and Improving Location Accuracy Based on Frequency Domain Reflectomerty. In Proceedings of the 2021 IEEE 4th International Electrical and Energy Conference (CIEEC 2021), Wuhan, China, 28–30 May 2021; p. 9510503. [Google Scholar] [CrossRef]
  27. Md Thayoob, Y.; Mohd Ariffin, A.; Sulaiman, S. Analysis of High Frequency Wave Propagation Characteristics in Medium Voltage XLPE Cable Model. In Proceedings of the 2010 International Conference on Computer Applications and Industrial Electronics (ICCAIE), Kuala Lumpur, Malaysia, 5–8 December 2010; pp. 665–670. [Google Scholar] [CrossRef]
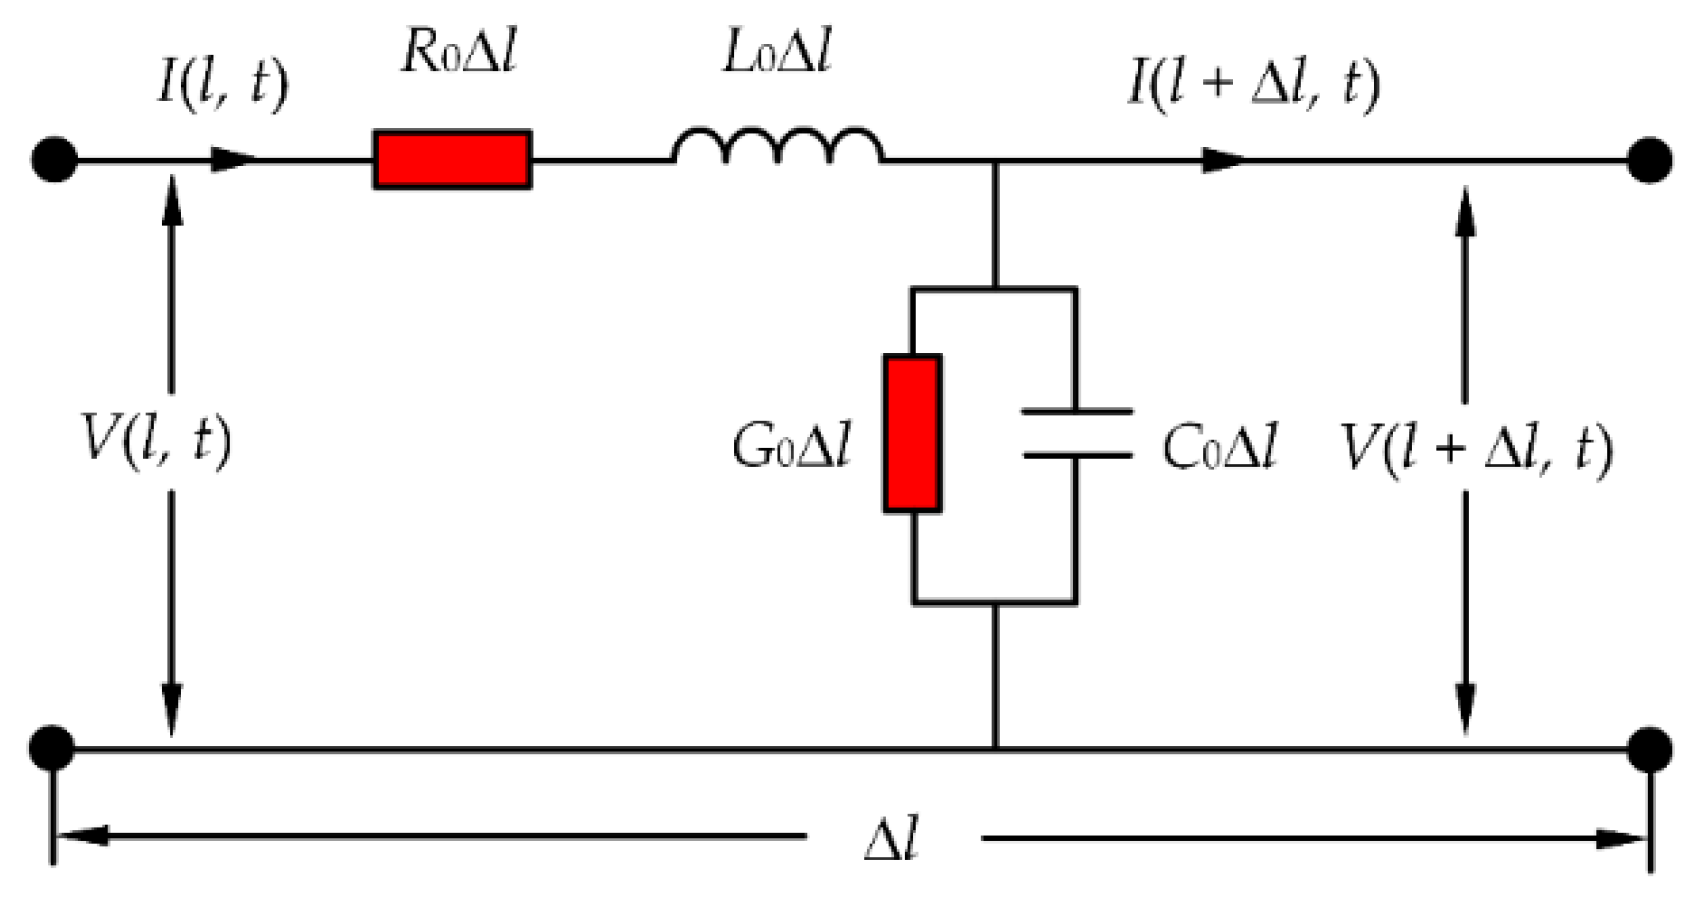
Figure 1. Δl-length transmission line.
Energies 15 08295 g001
Figure 2. The calculation process of the BIS locating algorithm.
Energies 15 08295 g002
Figure 3. Upper limit frequencies of cables with different lengths.
Energies 15 08295 g003
Figure 4. Location spectra of different cables: (a) Different lengths; (b) Different pulse widths c.
Energies 15 08295 g004
Figure 5. Error in peak identification of location spectrum.
Energies 15 08295 g005
Figure 6. Experimental platform setup.
Energies 15 08295 g006
Figure 7. The abrasion condition of the cable sample: (a) The sheath was partly removed; (b) The slight abrasion of the copper shields; (c) The serious abrasion of the copper shields; (d) The abrasion of the semiconducting layer. (e) The slight abrasion of the insulation. (f) The serious abrasion of the insulation.
Energies 15 08295 g007
Figure 8. The cable sample inserted with a nail.
Energies 15 08295 g008
Figure 9. The location spectra of the cable samples with abrasion.
Energies 15 08295 g009
Figure 10. The location spectra of the cable samples with an inserted nail.
Energies 15 08295 g010
Figure 11. The deviations of locating abrasion with three methods.
Energies 15 08295 g011
Figure 12. The deviations of nail insertion with three methods.
Energies 15 08295 g012
Table 1. The abrasion locating results of (a)–(f) samples.
NumberAbrasion Location (Maximum Method) (m)Abrasion Location (Centroid Method) (m)Abrasion Location (Function Fitting Method) (m)
(a)
(b)9.1888.9519.101
(c)9.1909.2169.055
(d)9.1388.9779.030
(e)9.1349.0419.089
(f)9.1189.0529.086
Table 2. The nail locating results of different inserted depths.
Ratio of Nail Depth to Insulation Thickness nNail Location (Maximum Method) (m)Nail Location (Centroid Method) (m)Nail Location (Function Fitting Method) (m)
25%12.42412.33512.381
50%12.45612.33712.360
75%12.12811.63612.020
100%12.85612.90412.878
Publisher’s Note: MDPI stays neutral with regard to jurisdictional claims in published maps and institutional affiliations.