Article

Steam Gasification of Refuse-Derived Fuel with CaO Modification for Hydrogen-Rich Syngas Production

1
Key Laboratory for Thermal Science and Power Engineering of Ministry of Education, Department of Energy and Power Engineering, Tsinghua University, Beijing 100084, China
2
Shanxi Research Institute for Clean Energy, Tsinghua University, Taiyuan 030032, China
*
Author to whom correspondence should be addressed.
Energies 2022, 15(21), 8279; https://doi.org/10.3390/en15218279
Submission received: 7 October 2022 / Revised: 28 October 2022 / Accepted: 3 November 2022 / Published: 5 November 2022
(This article belongs to the Special Issue Green Hydrogen for Industries and Biorefineries)

Abstract

:
Steam gasification of refuse-derived fuel (RDF) for hydrogen-rich syngas production was investigated in a lab-scale gasification system with CaO modification. A simulation model based on Aspen Plus was built to study the characteristics and the performance of the RDF gasification system. The influences of gasification temperature, steam to RDF ratio (S/R), and CaO adsorption temperature on the gas composition, heating value, and gas yield were evaluated. Under the gasification temperature of 960 °C and S/R of 1, H2 frication in the syngas increased from 47 to 67% after CaO modification at 650 °C. Higher syngas and H2 yield were obtained by increasing both S/R and gasification temperature. However, as the CaO adsorption temperature increased, a lower H2 fraction was obtained due to the limitation of the CaO adsorption capacity at high temperatures. The highest H2 fraction (69%), gas yield (1.372 m3/kg-RDF), and H2 yield (0.935 m3/kg-RDF) were achieved at gasification temperature of 960 °C, S/R of 2, and CaO modification temperature of 650 °C. The variation trends of simulation results can match well with the experiment. The deviation was mainly because of the limitation of contact time between the gasification agent and RDF, uneven temperature distribution of the reactors, and the formation of tar during the experiment.

1. Introduction

In the context of the growing problem of pollutants and global warming, hydrogen (H2) is considered to be one of the most promising renewable energy sources that can be an alternative to fossil fuels. According to the IEA report [1], almost 99% of the global hydrogen demand in 2021 was met by fossil fuels. Compared to fossil-fuel-based routes, H2 production by using renewable energy is a sustainable and suitable way. Municipal solid waste (MSW) could be a negatively priced and renewable H2 source [2,3] since it is randomly generated in our daily life.
The rapid expansion and development of cities has led to the massive production of MSW. According to the World Bank report for MSW [4], approximately 2.01 billion tons of MSW were generated globally in 2016, which is expected to reach 2.59 billion tons in 2030. In addition to sanitary landfills and composting, the widely used MSW treatment technology is incineration [5,6]. Although incineration can achieve waste reduction and resource recovery, the emissions of volatile organics (dioxin) and fly ash are still the major concern of the process [7]. Fly ash generated from incineration is classified as hazardous waste, which may cause serious environmental issues [8].
Gasification is another thermal treatment for MSW, aiming for the production of syngas with a high concentration of combustible gases [9,10]. The gasification technology allows the reactor to achieve a reducing atmosphere by using various gasification agents, inhibiting the production of dioxin. In Japan and Europe, more than 100 MSW disposal plants are commercially operated with MSW gasification technology [11,12]. Air gasification is widely investigated because of its feasibility. Dhiroua et al. [13] developed a model for simulating the biomass air gasification process. The results indicate that the combustible components in the syngas decreased with the increase in the air to biomass ratio, while they increased with the gasification temperature but with more tar production. The combination of air and steam as the gasification agent can improve the combustible composition while ensuring the heat supply for the endothermic reactions [14]. Compared to air gasification or oxygen gasification, steam-only gasification can produce hydrogen-rich syngas [15,16,17]. Heat input is required to heat the steam to the temperature required for gasification and provide the reaction heat for the endothermic reactions [18]. A two-stage steam gasification of mixed food waste was investigated by Raizada et al. [19]. The hydrogen fraction reached the highest point of 68% at the gasification temperature of 850 °C.
CO2 sorbents were used to enhance the H2 production and gas yield during the gasification process as well. Madhukar R. et al. [20] conducted research on biomass steam gasification in the presence of CaO. The gasification performance was investigated between 500–700 °C. The H2 yield for the gasification process using CaO at 500 and 600 °C was higher than the steam gasification without CaO at 700 °C. However, the gas yield and H2 yield dropped after 700 °C with the presence of CaO. In this study, steam is used as the only gasification agent to improve H2 production. Low-cost CaO is used downstream from the gasifier to improve the syngas quality by adsorbing acid gases and cracking tar. CaO can promote tar cracking from two aspects: 1. The tar cracking reaction is entirely endothermic. The formation of CaCO3 from CaO can provide heat for the tar cracking reaction. 2. CaO acts as a catalyst for the tar cracking process: the CaO active sites can absorb tar molecules, and promote dehydrogenation, dealkylation, and ring-opening of tar molecules to form gas components and carbon deposits [21]. As for acid gases, the CaO reacts absorb CO2 to format CaCO3 and CaO can react with HCl, the other main acid gas components produced from MSW gasification [22,23,24].
The investigation was conducted with two consecutive lab-scale fixed-bed reactors. Different with steam gasification combined with the usage of CO2 sorbent inside the gasifier, the CaO used for this study was put in another fixed bed reactor to modify the generated raw syngas from the first rector. A simulation model was also developed based on Aspen Plus to investigate the system, validating the reliability of the experiment and also finding the optimal condition for RDF steam gasification.

2. Experimental and Simulation Methods

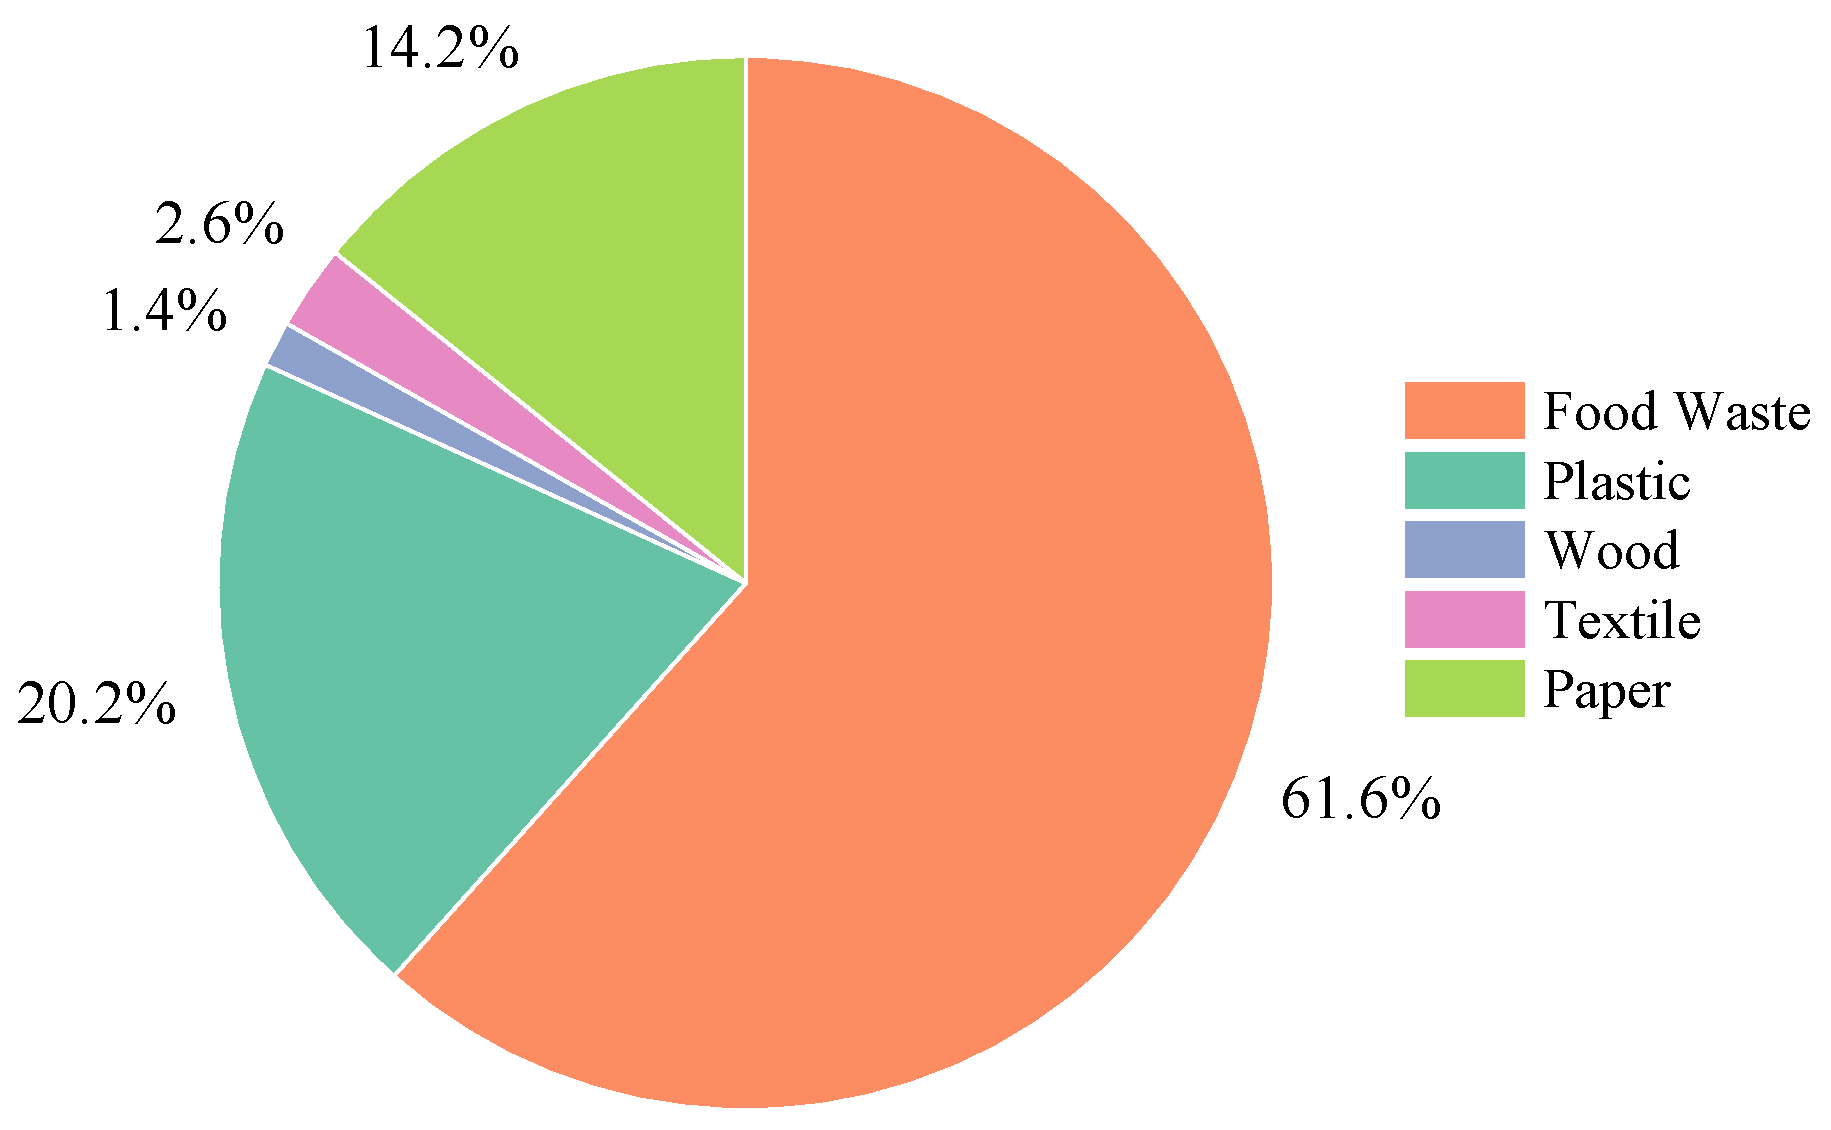
2.1. RDF Characterization

According to previous research, synthetic refuse-derived fuels (RDF) used for gasification experiments mainly contain: food waste, paper, textile, wood, and plastic [25]. According to the composition of MSW collected in Haidian District, Beijing [26], food waste accounts for the largest proportion of the waste component, followed by plastic, paper, wood, and textile. The composition of the synthetic RDF used in this study is shown in Figure 1. Dog food was used as an alternative to real food waste [27]. Cotton, PP powder, and wood chips were selected to represent the textile, plastic, and wood materials, respectively. The above raw materials and paper were crushed and mixed in proportion to their composition to ensure the homogeneity of the feedstock. The crushed raw materials were put into the granulator for generating RDF.
The largest composition of the RDF in this study was dog food simulating the food waste. The dog food we used was ‘hard type’, which has a lower moisture content (6–10%) than other types of dog food. The second and third components were paper and plastic, which contain a much lower content of moisture. From different investigations on RDF gasification, we found that the moisture content of RDF can reach relatively low levels: 3.7–4.3% [28,29,30,31]. These RDF samples have more paper and plastic components, so the moisture content is relatively low. In our study, the moisture content of the used RDF was 6.37%.
As for the heterogeneity of the RFD, we weighed a fixed proportion of the raw materials and mixed them thoroughly before granulation with a crusher to ensure the stability and reproducibility of the experiment. Therefore, we can obtain comparable gasification results under different experimental conditions while excluding the influence of raw material fluctuations.
The results of the proximate and ultimate analysis of the synthetic RDF pellets and calorific value are shown in Table 1.

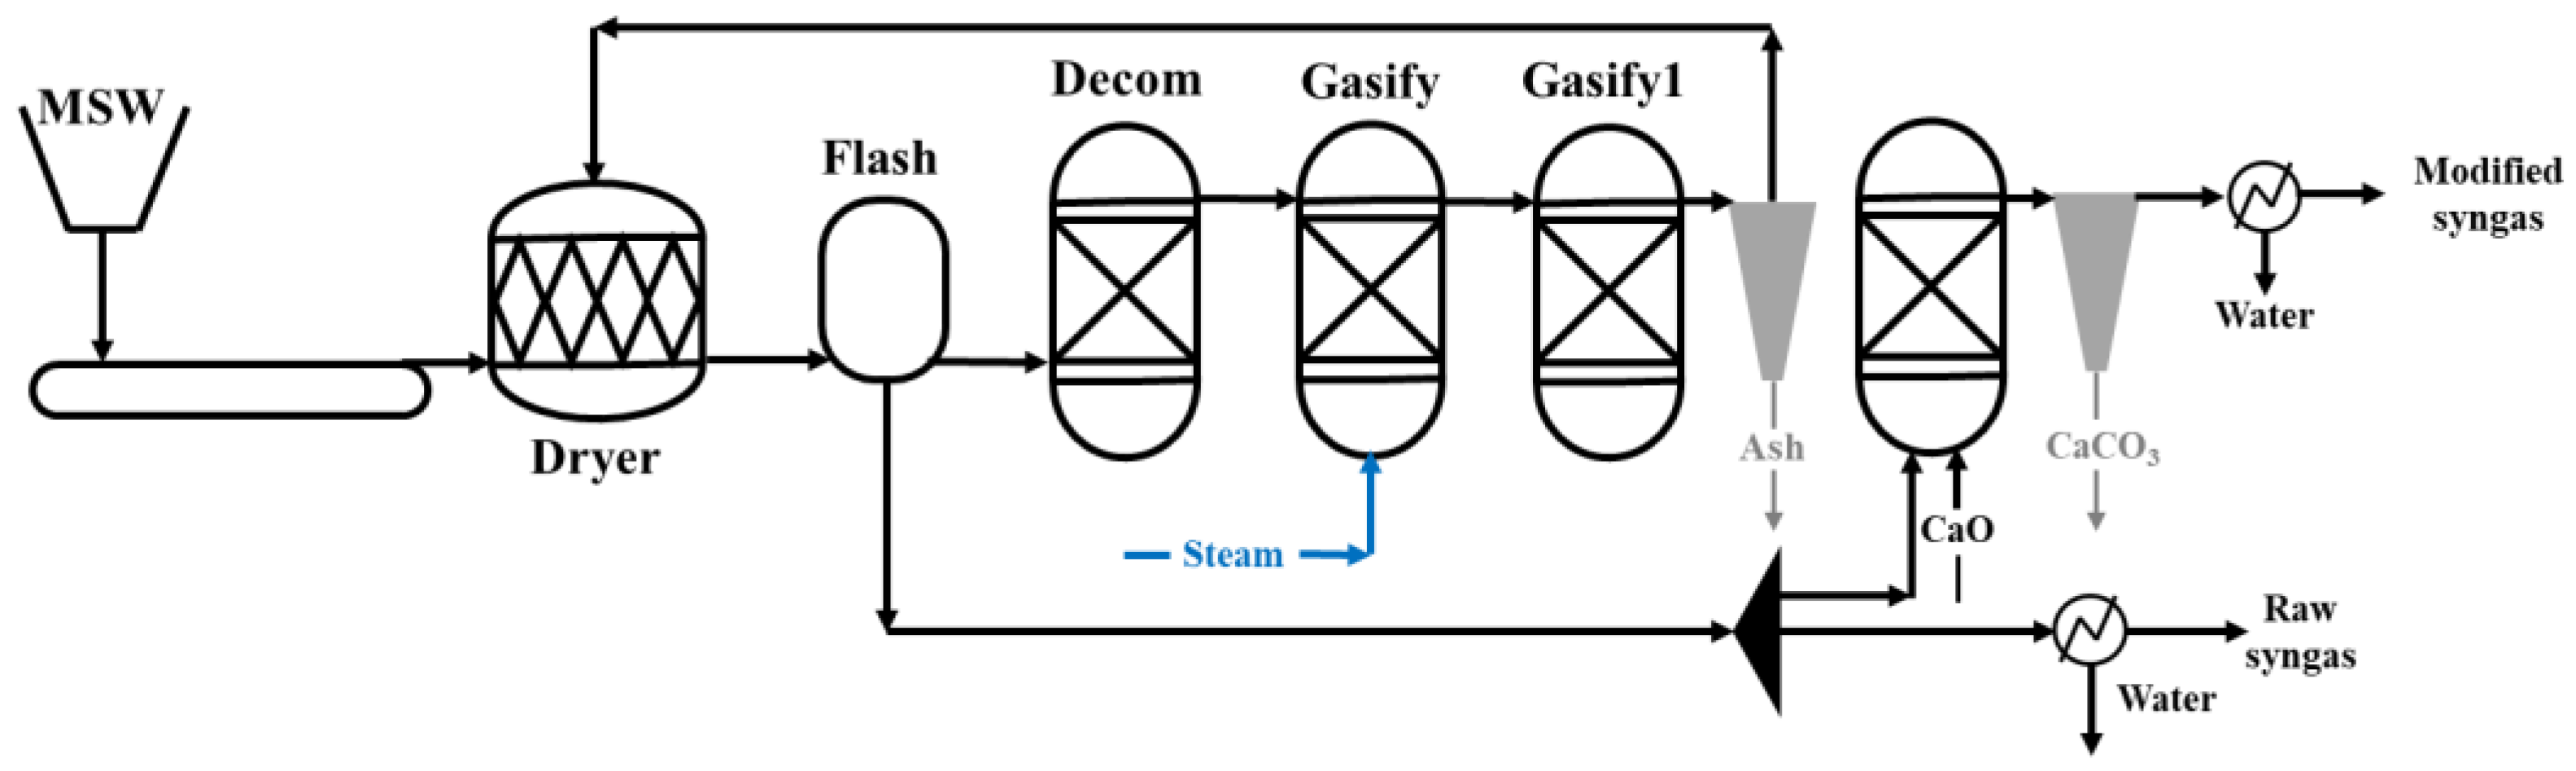
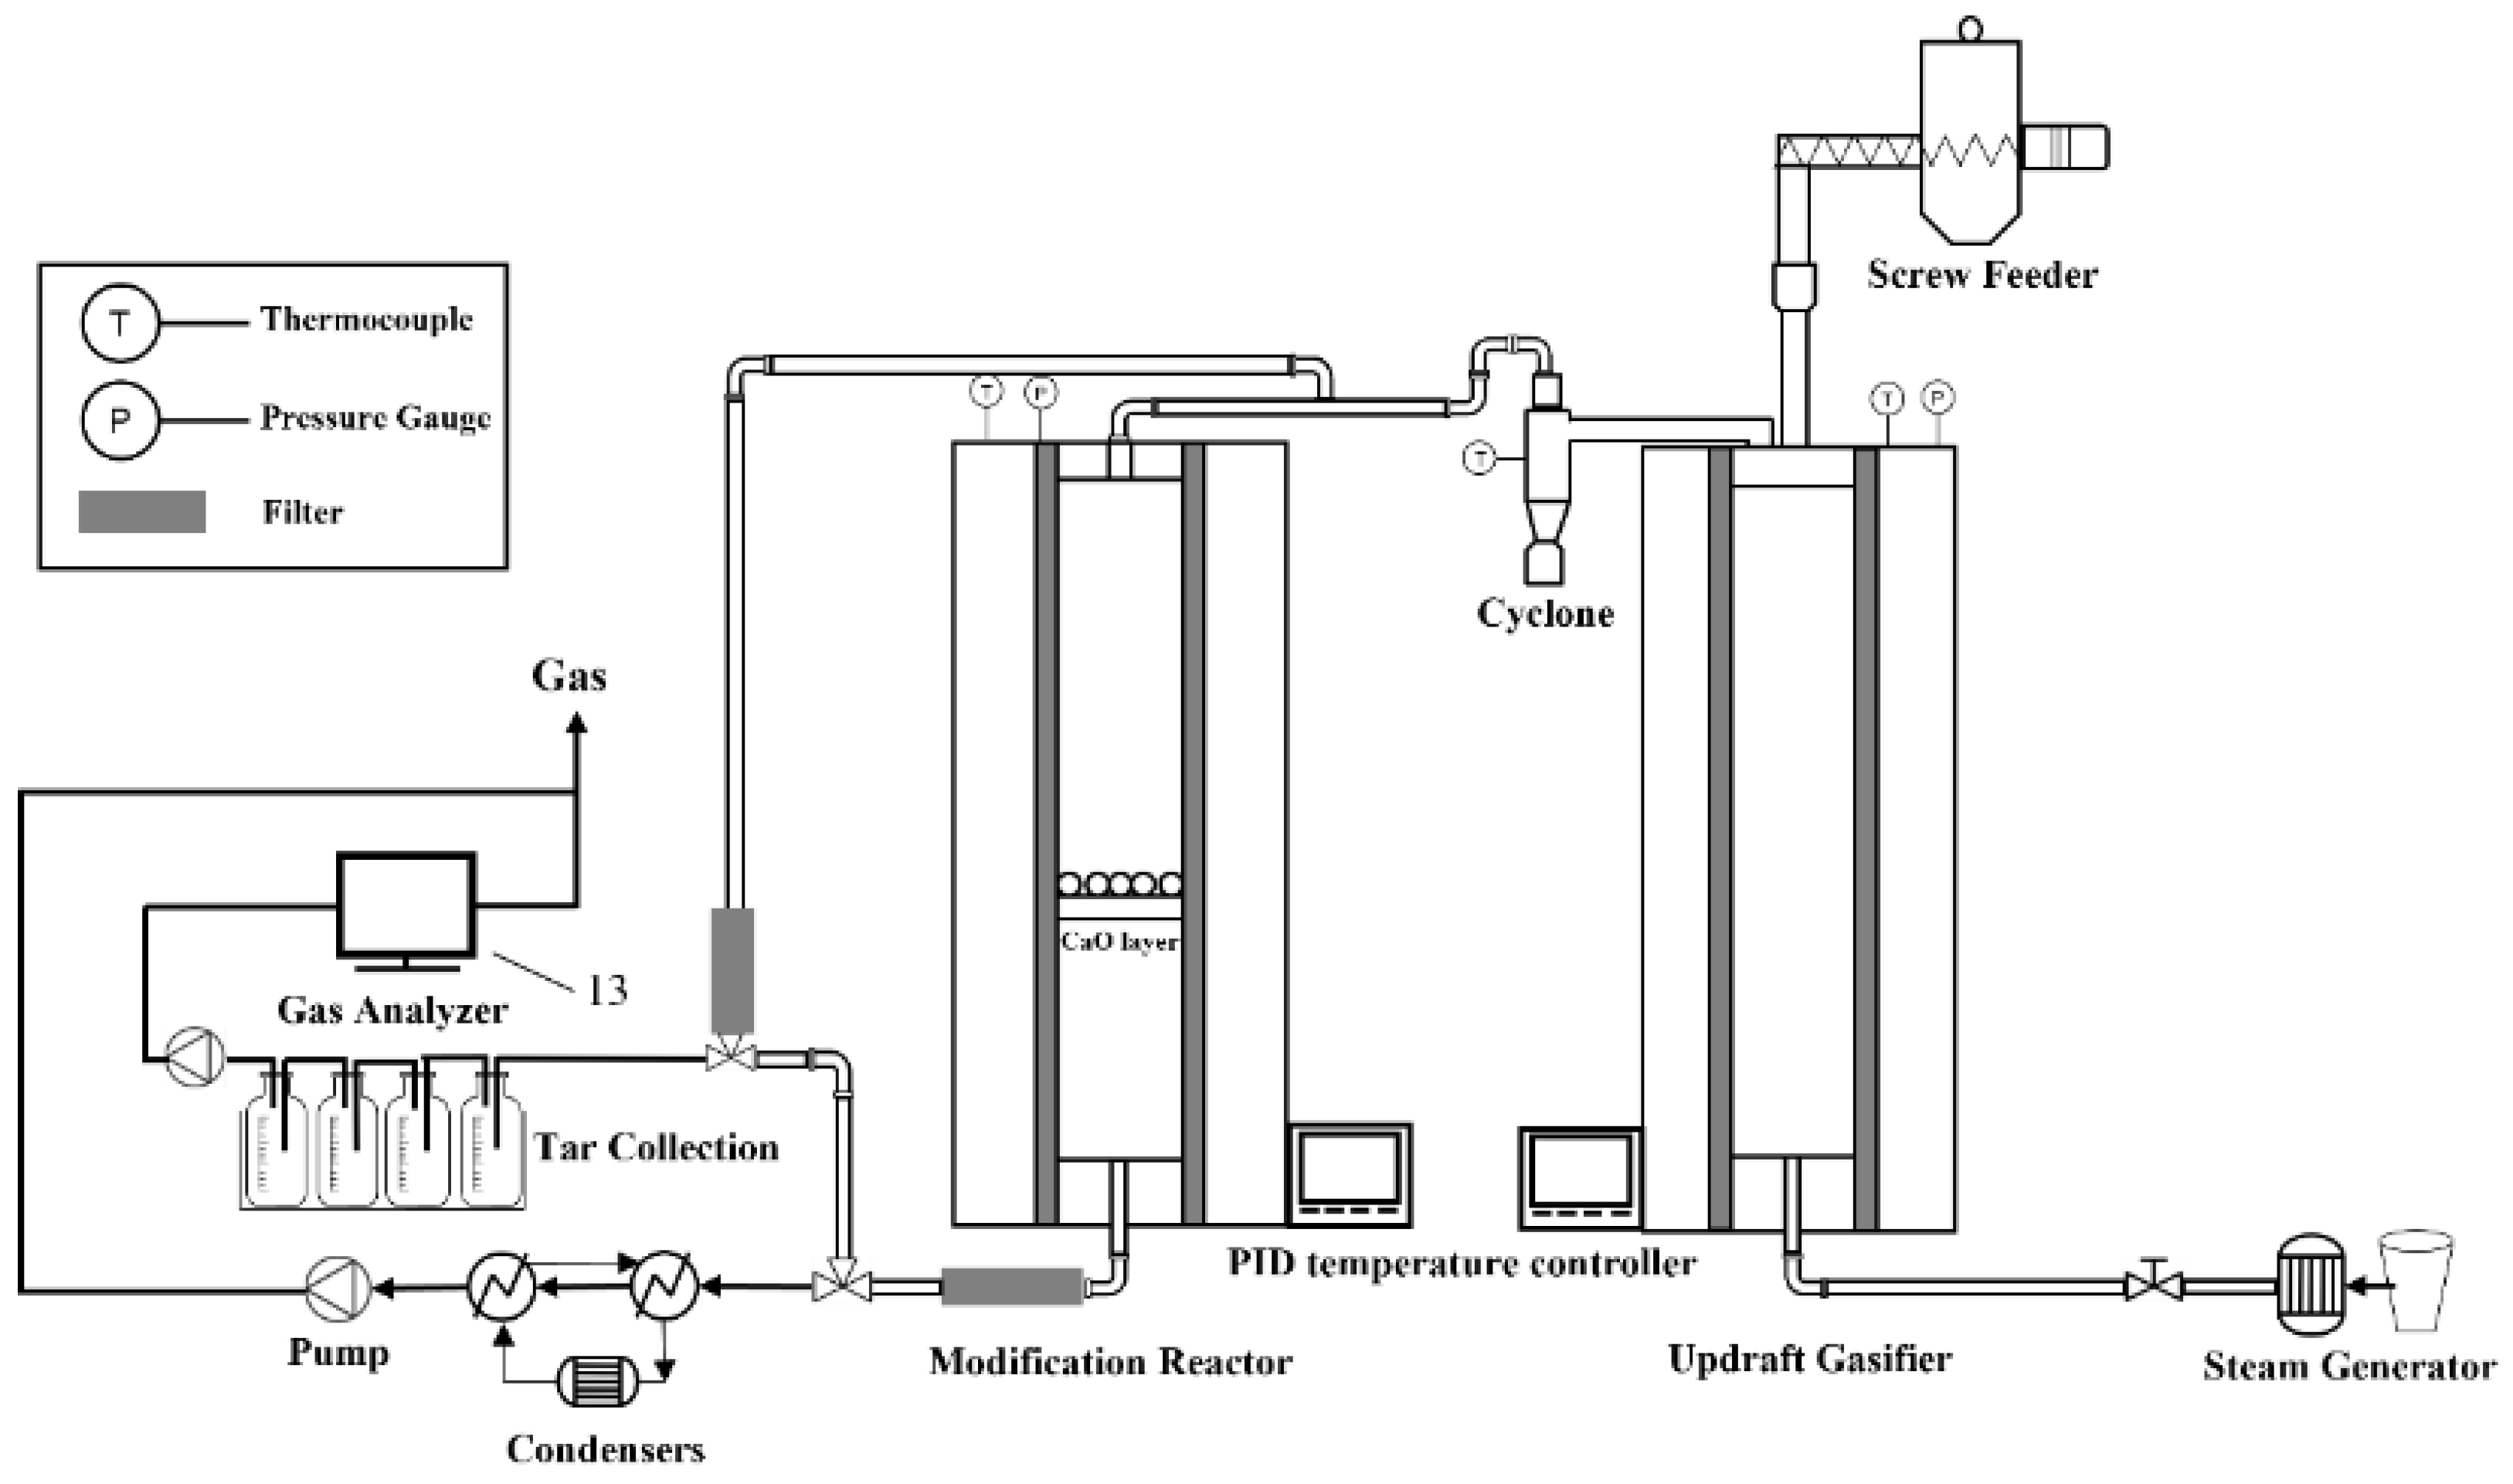
2.2. Experimental Setup

The schematic diagram of the RDF gasification system is shown in Figure 2. The system mainly consists of five units: feedstock unit, steam vaporizer unit, two fixed-bed reactors, the syngas cleaning and acquisition unit, and the syngas analysis unit. The RDF was fed at the top of the first fixed-bed reactor. High temperature steam was purged at the bottom of the reactor. The CaO particles were added to the second reactor. Raw syngas generated from the first reactor was then passed through the CaO bed. The syngas before and after the CaO modification was collected for CH4, CO, CO2 H2, and O2 analysis with a gas chromatograph (GC 9720 Plus, Fuli, China).
The synthetic RDF was introduced into the reactor through a constant velocity screw feeder. Before feeding the material, the screw feeder was calibrated with different speed profiles for different raw materials. The rate of addition of RDF was set to 0.25 kg/h. The reactor for the gasification of RDF was an updraft gasifier. The gasifier was an electrically heated gasifier with three thermocouples inserted in the top, middle, and bottom of the furnace. CaO particles were added in the second fixed-bed reactor to modify the raw syngas. Solid compounds in the syngas were removed by the filters. Tar and other condensable organic compounds were absorbed by isopropyl alcohol, which was proven and widely used for syngas purification, especially for tar removal [32].
The basic scenario for the experiment and simulation was: gasification temperature of 960 °C; modification temperature of 650 °C; and S/R of 1. Apart from the different S/R of 0.5, 1, 1.5, and 2, the properties of the syngas were also evaluated by changing the reactor temperatures: for the gasifier, temperature changes from 660 °C to 960 °C with a 100 °C interval; for the fixed-bed with a CaO layer, temperature changes from 550 °C to 850 °C with a 100 °C interval as well.
The main reactions that occurred in the gasifier and modification reactor are listed in Table 2.

2.3. Data Evaluation

The following indexes are used to evaluate the gasification performance:
Syngas yield: Y S y n g a s is the syngas production per unit mass of RDF input, m3-Syngas/kg-RDF.
Hydrogen yield: Y H 2 is the H2 production per unit mass of RDF input, m3-Syngas/kg-RDF.
Lower heating value (LHV) of syngas [33], MJ/Nm3:
L H V s y n g a s = 10.79 × [ H 2 ] + 12.62 × [ CO ] + 35.81 × [ CH 4 ]
where [H2], [CO], [CH4] represents the volume fraction of H2, CO, CH4 in the corresponding syngas.
Cold gas efficiency, CGE [33]:
C G E s y n g a s = L H V s y n g a s × Q s y n g a s L H V s y n g a s × m s y n g a s
where Q s y n g a s is the volume flow rate of the collected syngas in m3/h; L H V M S W is the lower heating value of RDF in MJ/kg; m R D F is the RDF input in mass per hour: m3/h.

2.4. Model Developing

According to the schematic diagram of the experiment setup, shown in Figure 2, a simulation model was also developed to investigate the system performance. The simulation model was developed with Aspen Plus, a widely used process simulation software for the chemical engineering industry [34]. In the real process, the RDF drops down into the gasifier and through three stages, drying, decomposing, and gasifying [35], shown in Figure 3. To present these three stages in the gasifier, a drying block, decomposition block, and gasifying block were built in process modeling. Referring to Figure 2, the flowsheet of the simulation model is shown in Figure 4.
The conventional components of the system were calculated by the Peng–Robinson equation with the Boston–Mathias α function (PR-BM), which is a proper choice for the non-polar and non-ideal system [36]. With the correction of the Boston–Mathias alpha function, the PR-BM equations can better model the properties of matter above the critical temperature. The PR-BM equation is also widely used in the simulation of chemical processes such as gasification and refining [37,38].
The basic modeling assumptions are:
(1) The whole system is under steady state and reactions reach thermodynamic equilibrium;
(2) The formation of tar and other hydrocarbons is not considered in the model;
(3) Ash cannot participate in any chemical reactions.

2.4.1. Drying Block

The unconventional component RDF, at a feeding rate of 0.25 kg/h, was dried by the syngas out from the gasifying block, at 300 to 500 °C. The moisture content of the dried RDF was reduced to 5 wt%. A flash block was set after the drying block to separate solid content and gas content.

2.4.2. Decomposing Block

The unconventional component could not be identified directly to participate in reactions in Aspen Plus; therefore, a Ryield block was developed to decompose the RDF into its basic constituent elements. The calculation is based on the proximate and ultimate analysis of the RDF [39,40]. According to a similar reactor, the temperature of the Ryield block was set to 500 to 800 °C [41].

2.4.3. Gasifying Block

The Gasifying block consists of two RGibbs blocks. The CH4 content in the syngas is usually underestimated in the simulation model, mainly because of the non-uniform temperature distribution in the real gasifier and the limited reacting time between the gasification agent and raw material, leading to the incomplete crackdown of the raw material and some reactions without reaching equilibrium. To correct the deviation, a RGibbs block named Gasify1 was introduced. A restricted equilibrium method was used to restrict reaction equilibrium by specifying the temperatures [42]. To better match the simulation results with the data obtained from the experiment, the temperature approaches for reactions (3), (5), and (9), listed in Table 2, were set as −140, −200, and 160 °C, respectively.

2.4.4. Modifying Block

The raw syngas generated from Gasify1 then entered the modifying block, where the CO2 content in the syngas would be absorbed by CaO and the combustible content would be improved. The main reaction occurring in the reactor is:
CaO + CO2→CaCO3
The effect of temperature on the reaction equilibrium is significant [43]. As the temperature varied from 550 to 850 °C, the adsorption effect of calcium oxide on CO2 varied as well, resulting in significantly different gas components in the syngas, as will be discussed in the results section.

3. Results and Discussion

3.1. Experimental Results

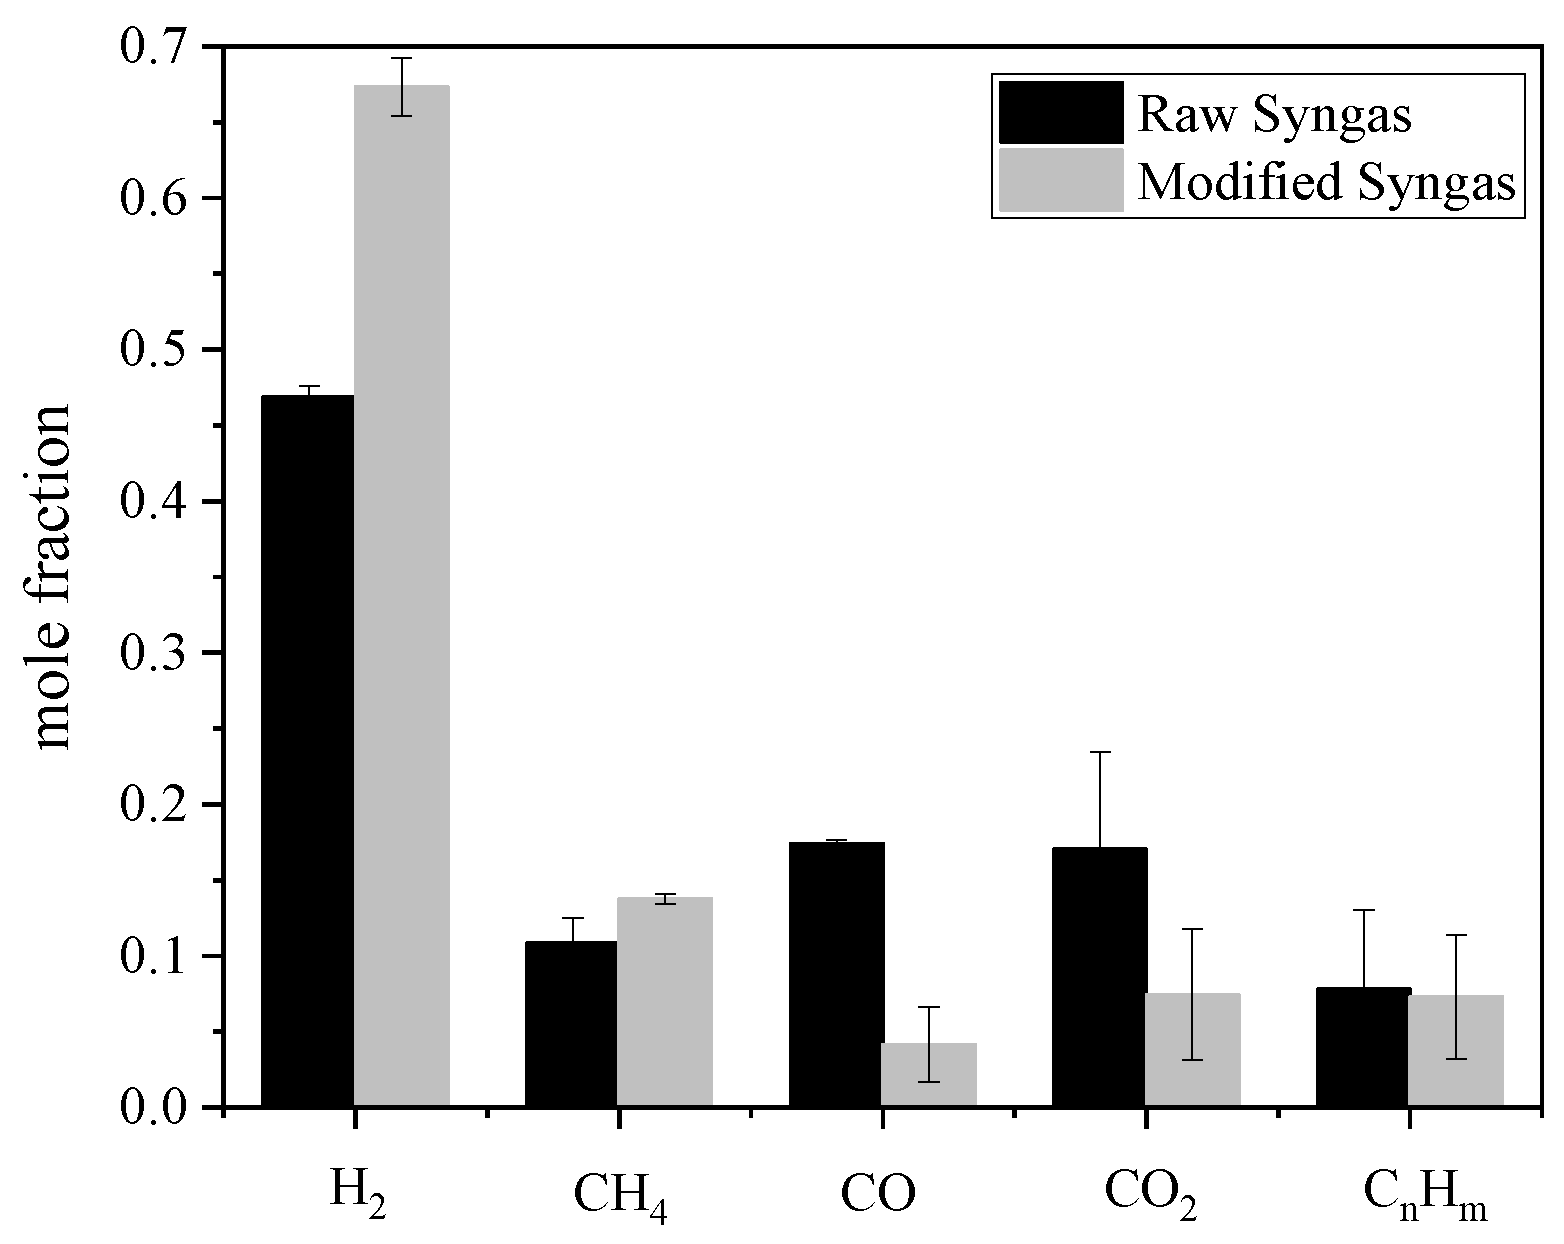
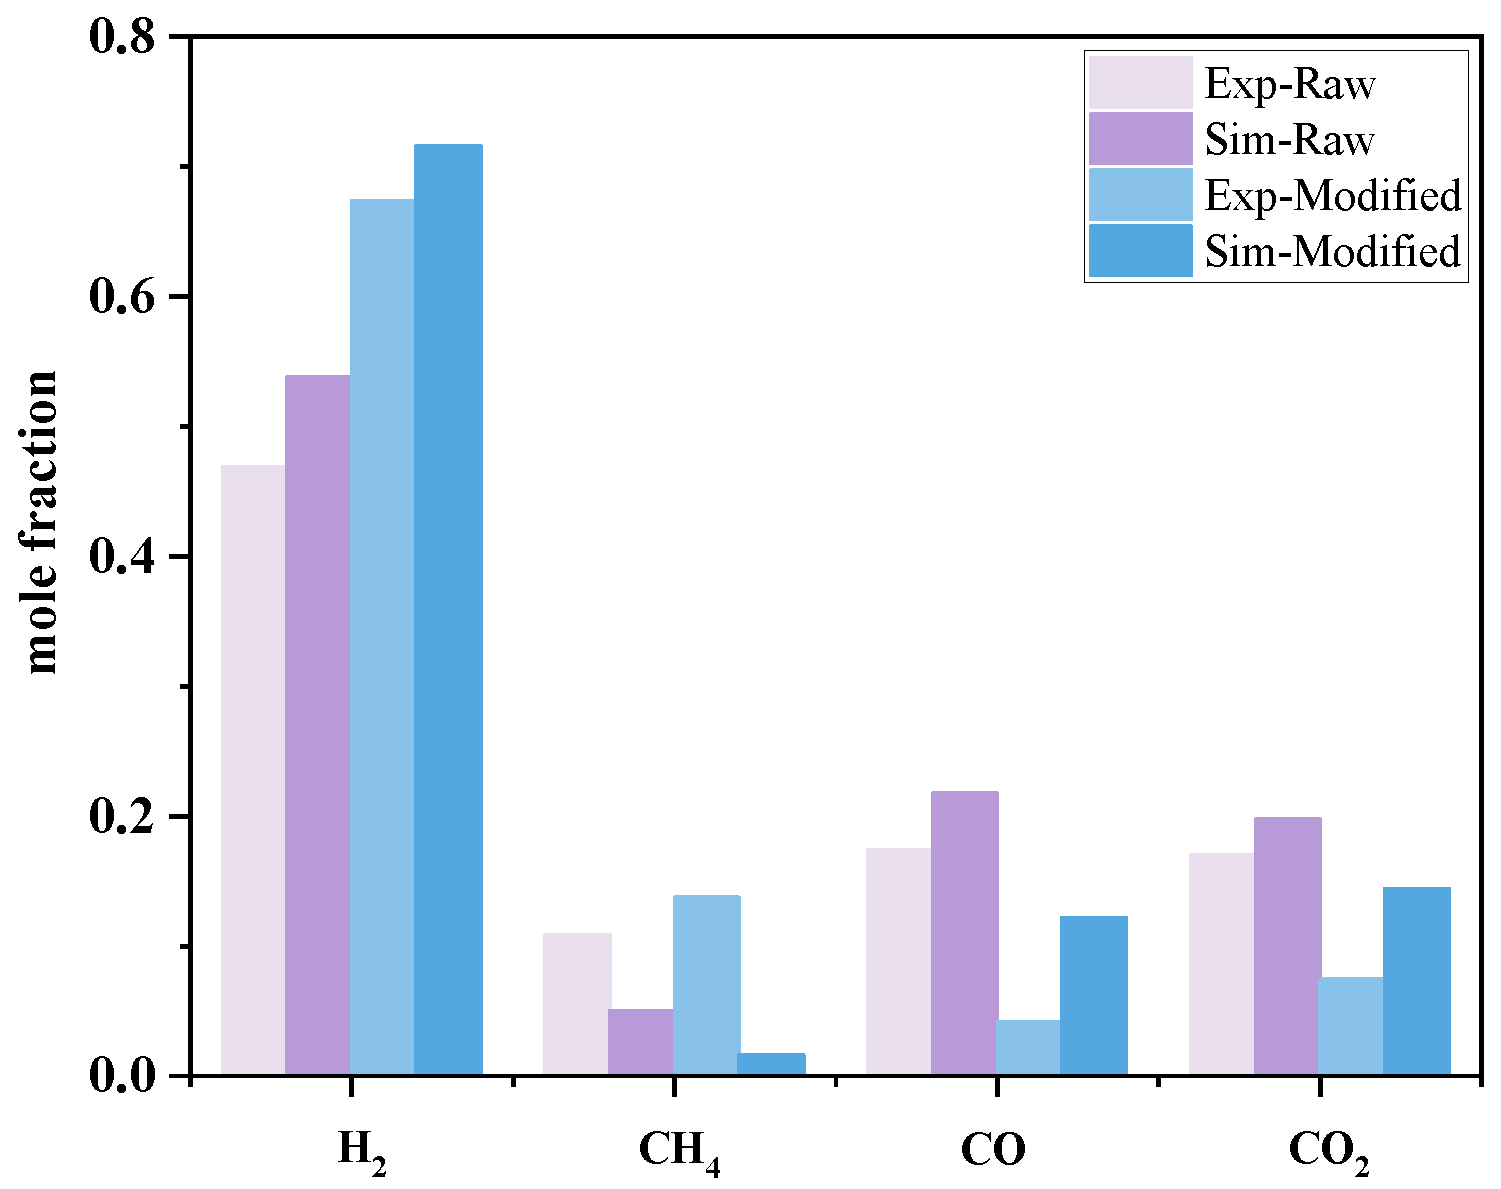
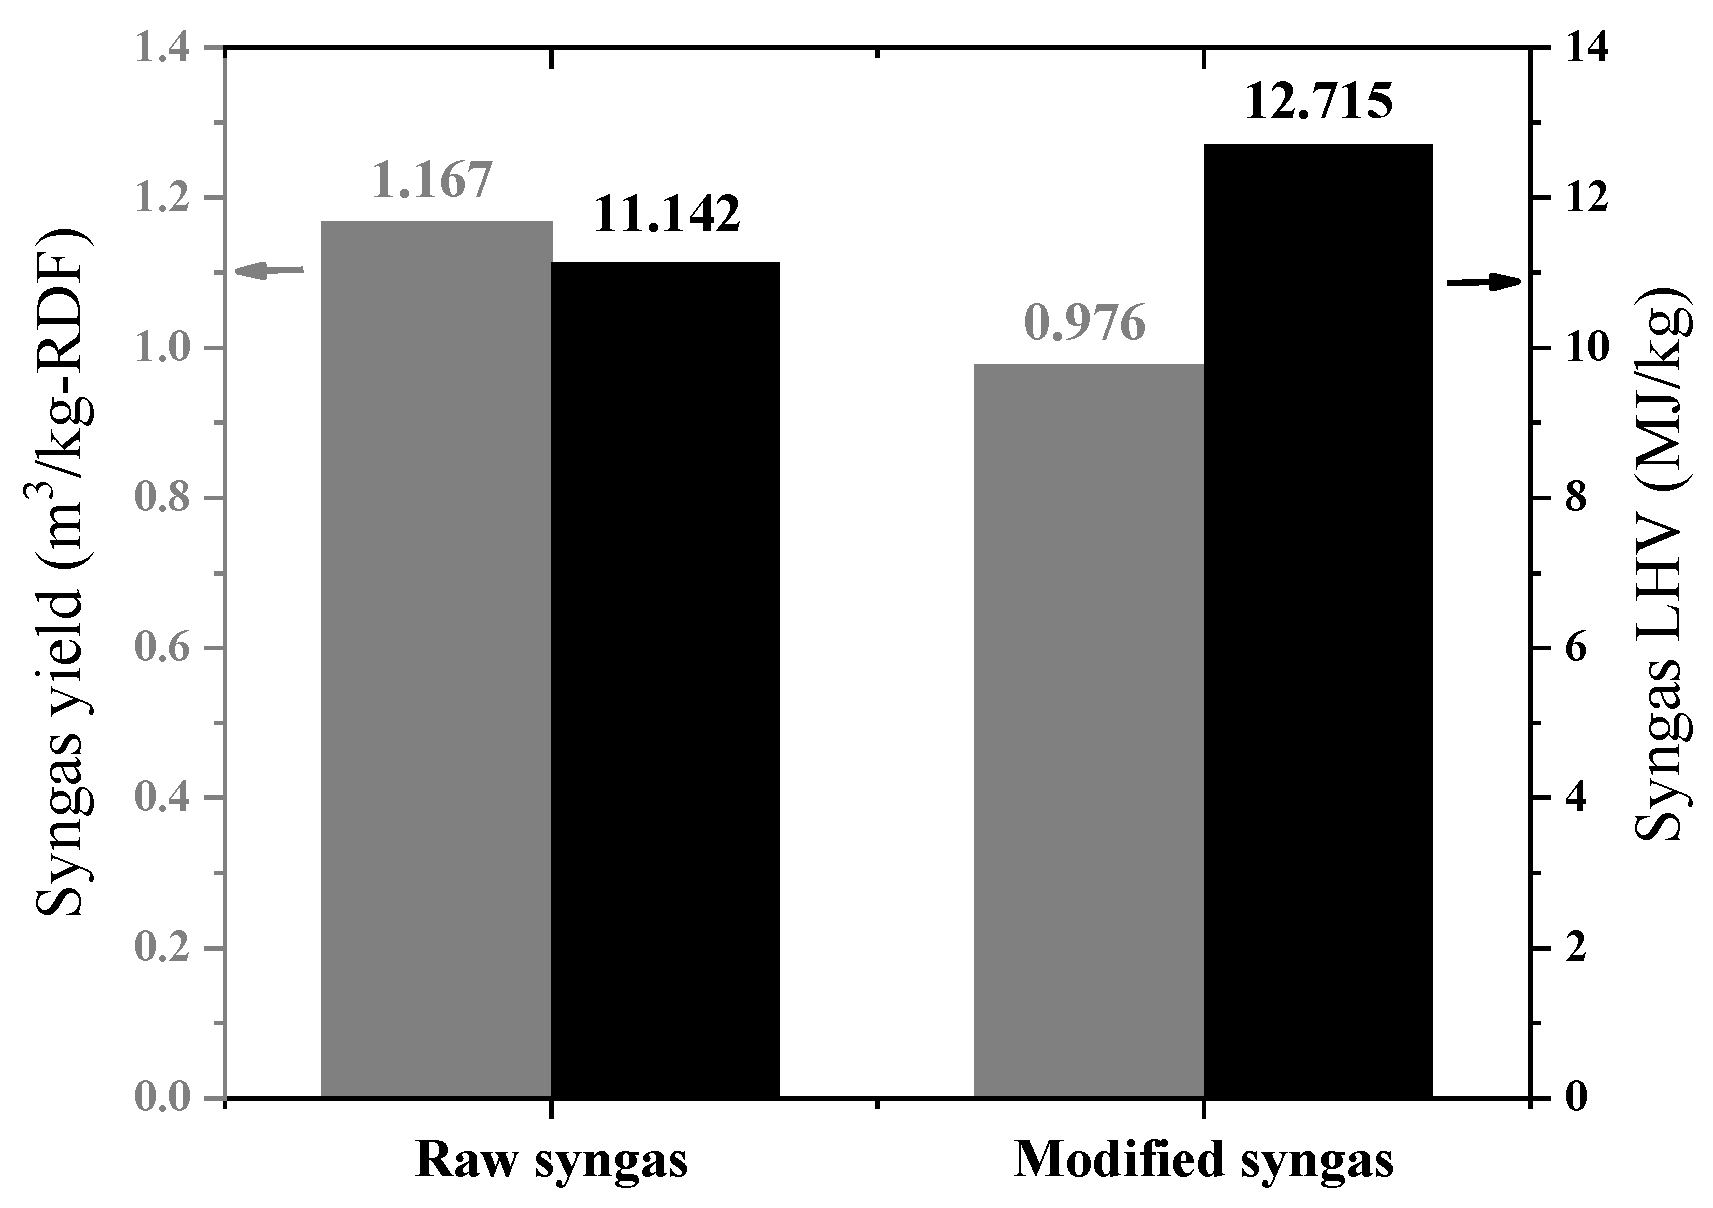
3.1.1. Basic Scenario Results

The parameters for the RDF gasification experimental basic scenario are listed in Table 3. The syngas components for two streams are shown in Figure 5. H2, CH4, CO, and CO2 are the main components in syngas. Because of the incomplete purification of the syngas in the cleaning unit, some volatile organic compounds existed in the collected syngas that were uniformly called CnHm in Figure 5.
It can be seen from Figure 5 that H2 has the highest concentration in the two syngas streams. For the raw syngas, H2 approximately accounts for 46.9% of the total volume, while, after modification by CaO, the concentration reached 67.3%. By introducing steam into the gasifier, the equilibrium of reactions from (5)–(7) shifted towards the product side, enhancing H2 production. After modification by CaO particles, the H2 fraction significantly increased with a significant drop in the CO and CO2 concentration. The CO2 content in the syngas was absorbed by the CaO particles in the modification reactor, enhancing H2 production by shifting the water gas shift reaction (6) towards the product side. LHV of the syngas was also increased after the raw syngas flow through the CaO bed, as shown in Figure 6. The increase in the H2 and CH4 mole fraction contributes to the increase in the syngas LHV. The CGE for the raw syngas and modified syngas are 0.687 and 0.656, respectively.

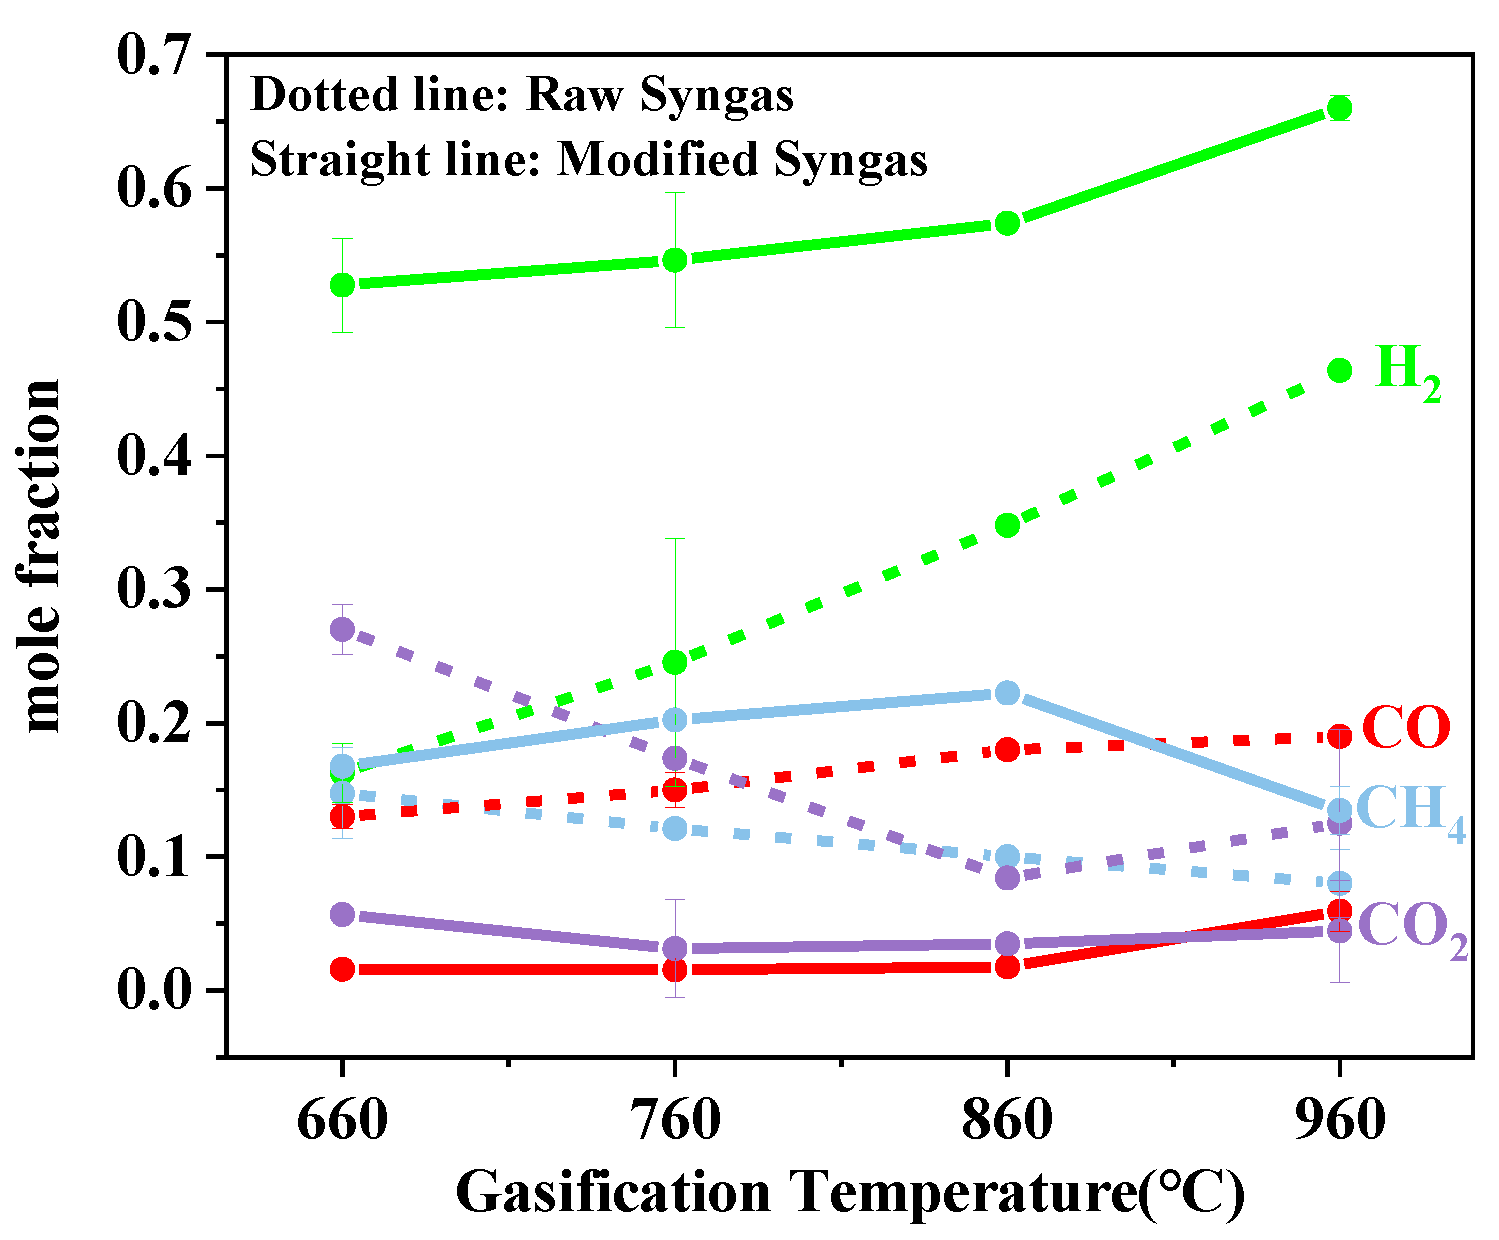
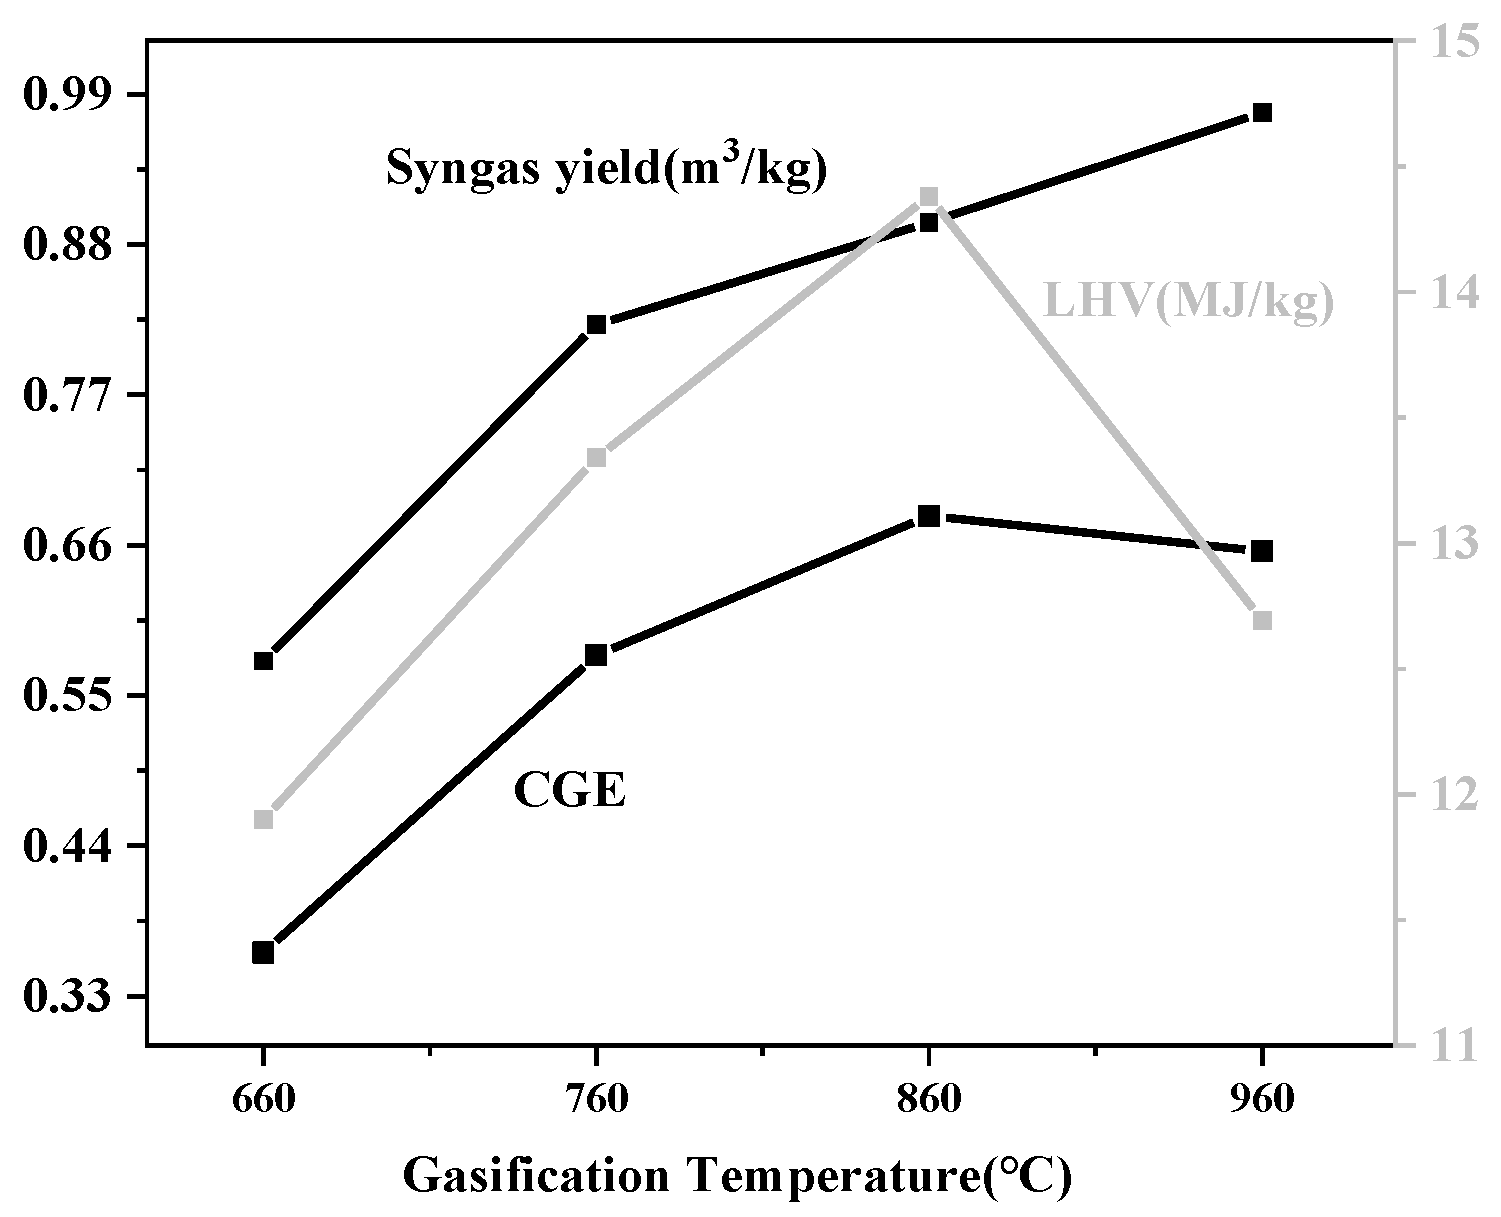
3.1.2. Effect of Gasification Temperature

The effect of gasification temperature on the syngas performance was investigated by varying the gasifier temperature at 660, 760, 860, and 960 °C. The gas product distribution of the raw syngas and modified syngas are shown in Figure 7. The increase in the gasification temperature is more conducive to the endothermic methane dry reforming reaction (8), which converts CH4 and CO2 to H2. Increasing the gasification temperature could also enhance the H2 production by shifting the endothermic reaction (5) and methane steam reforming reaction (7) towards the production side. Higher gasification temperature is beneficial for obtaining a higher quality syngas. The gas distribution of the syngas after the CaO modification did not significantly change. The syngas yield increased with increasing the gasification temperature, reaching 0.976 m3/kg at 960 °C while the H2 yield reached 0.655 m3/kg as well, as shown in Figure 8. The LHV for modified syngas increased from 11.899 to 14.381 MJ/kg, as the gasification varied in the range from 660 to 860 °C, but dropped to 12.715 MJ/kg at 960 °C. The drop of the LHV was mainly because of the significant drop in the concentration of CH4 in the modified syngas.
By integrating the experiment results obtained from different gasification temperatures, the higher quality syngas could be obtained from a temperature of 860 to 960 °C.
The results obtained from our experiment are validated with the experiment data from Luo et al. [44]. The reference experiment was conducted in a lab-scale fixed-bed reactor. The gasification process and catalytic process were separated, which was similar to our experiment. The comparison of the reference results and the article results are listed in Table 4. The results of the two experiments demonstrate similar trends of the variation. Comparing the syngas of both passing through the catalyst/adsorbent bed, it can be found that the CO2 content in the syngas in our experiment is much lower, since it was absorbed by CaO.

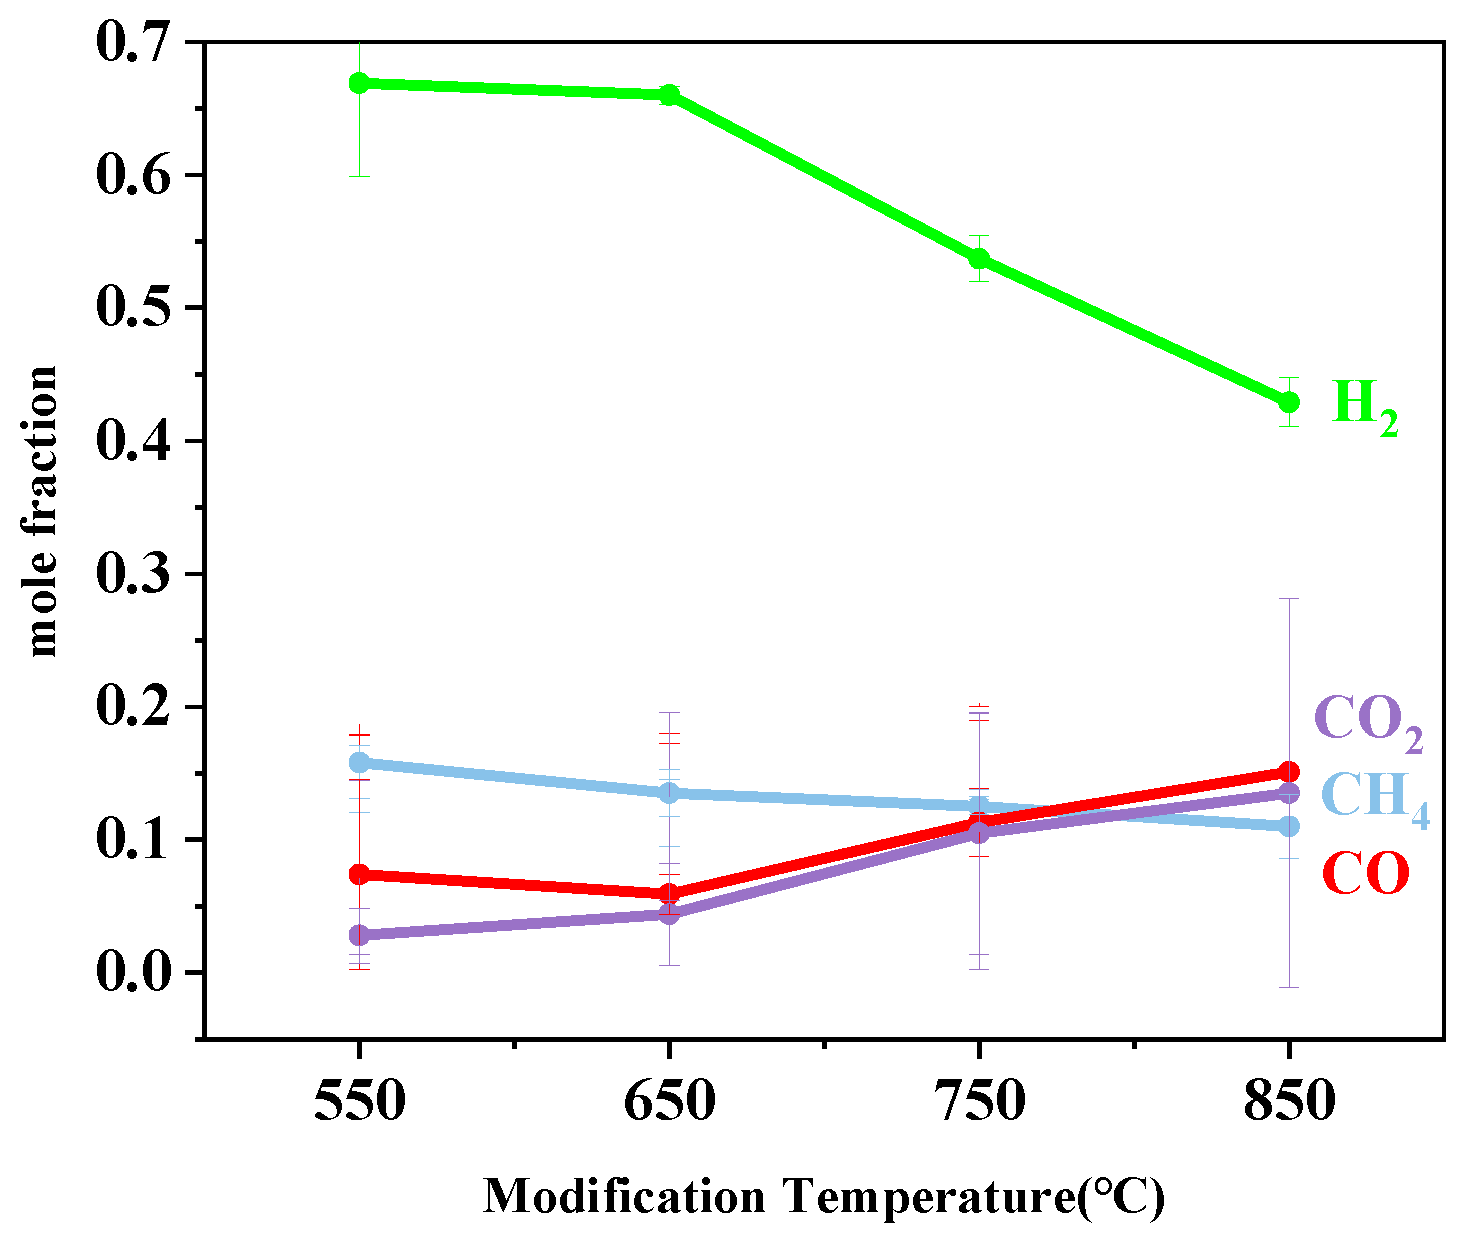
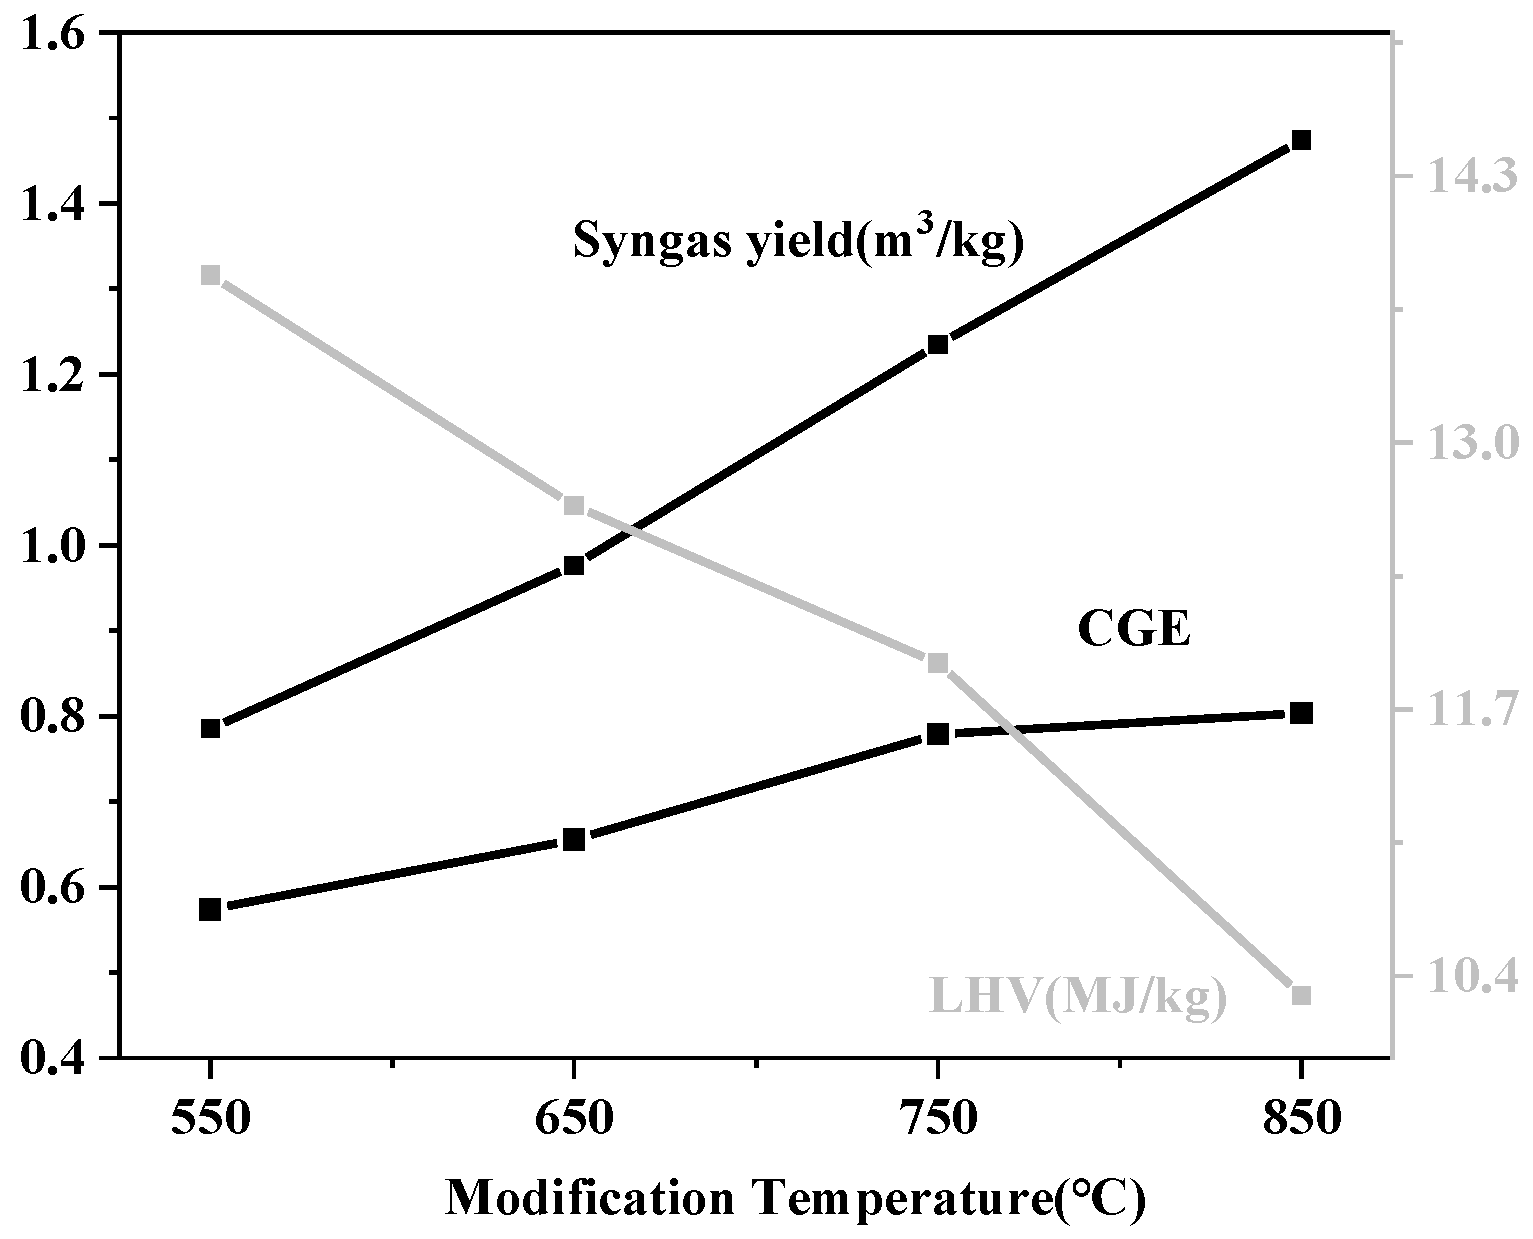
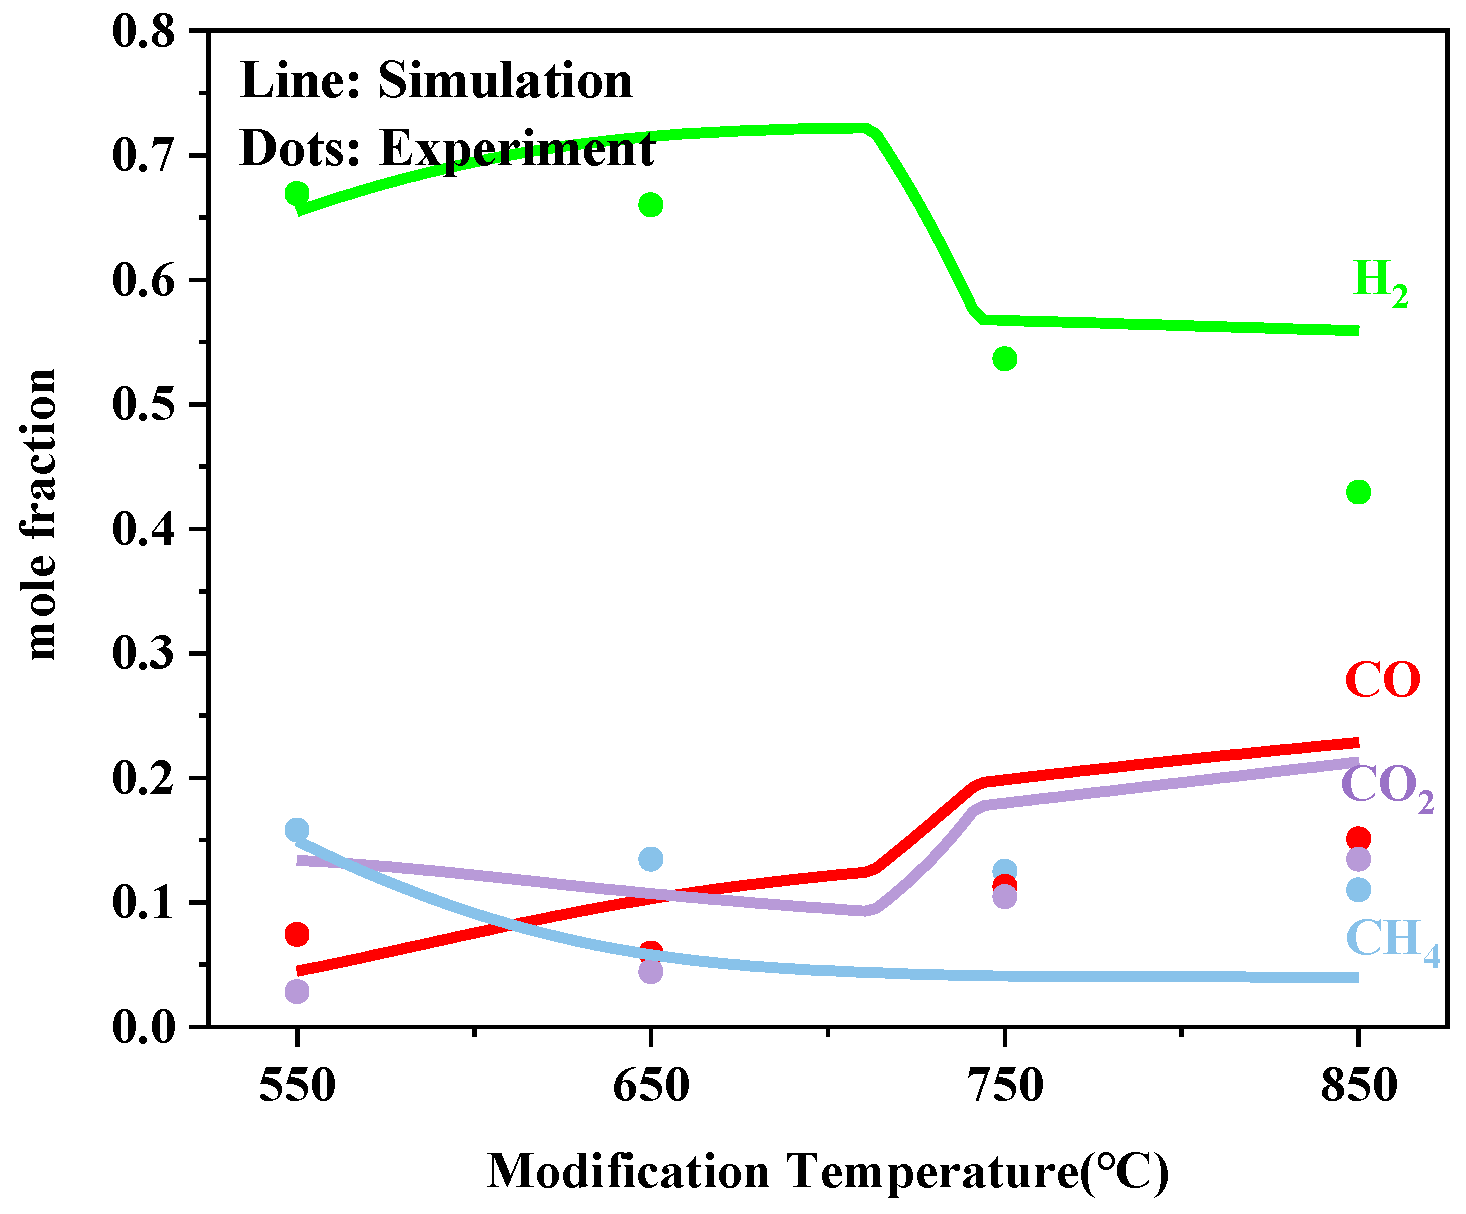
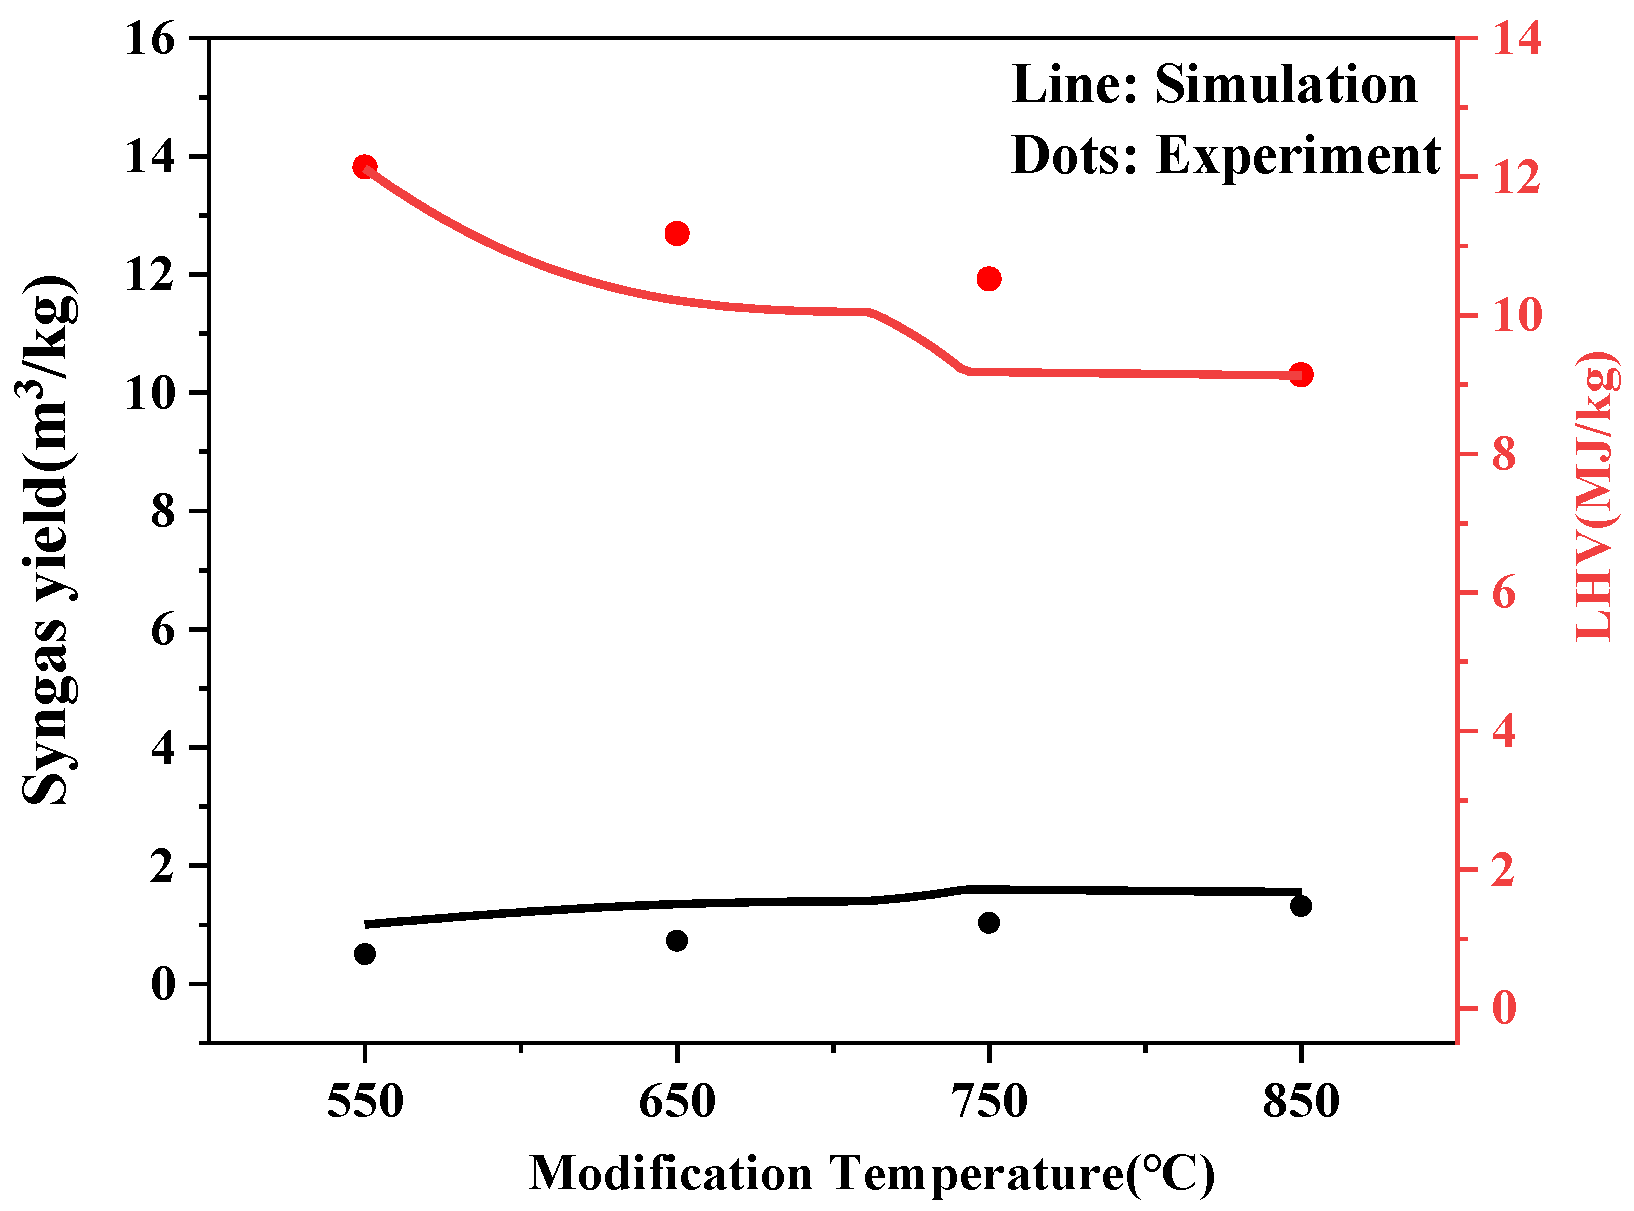
3.1.3. Effect of Modification Temperature

Figure 9 indicates the change in the gas distribution of modified syngas against the modification temperature. Since the CaO carbonation reaction (11) is exothermic, the increase in the modification temperature is not conducive to the adsorption of CO2 by CaO, especially above 700 °C. The partial pressure of CO2 is lower than the equilibrium partial pressure of CO2 in the CaO carbonation reaction (11), resulting in its ineffective absorption CO2. Therefore, the CO2 content increased significantly as the modification temperature rose. The concentration of H2 decreased while the concentration of CO increased through the water–gas shift reaction (6). The composition of the syngas is close to the level of the raw syngas, indicating the ineffectiveness of the modification at high temperature. Figure 10 shows the syngas yield, CGE, and LHV of the modified syngas variation against the modification temperature. The syngas yield rises up to 1.344 m3/kg at the modification temperature of 850 °C. However, the syngas LHV decreased significantly against the modification temperature due to the decrease in H2 and increase in CO2. The CGE for the production syngas reached 73% at the modification temperature of 850 °C.
In order to obtain a higher quality syngas with a higher lower heating value and higher H2 concentration, the modification temperature should be controlled under 650 °C.
The comparison of the influence of the steam amount between the reference experiment and the article experiment is listed in Table 5. It is worth noticing that unlike our experiment, the reference conducted a blank experiment without the addition of steam. Except for the experiment results of S/C = 0, the trend of gas component against the rising steam amount is similar to our data.

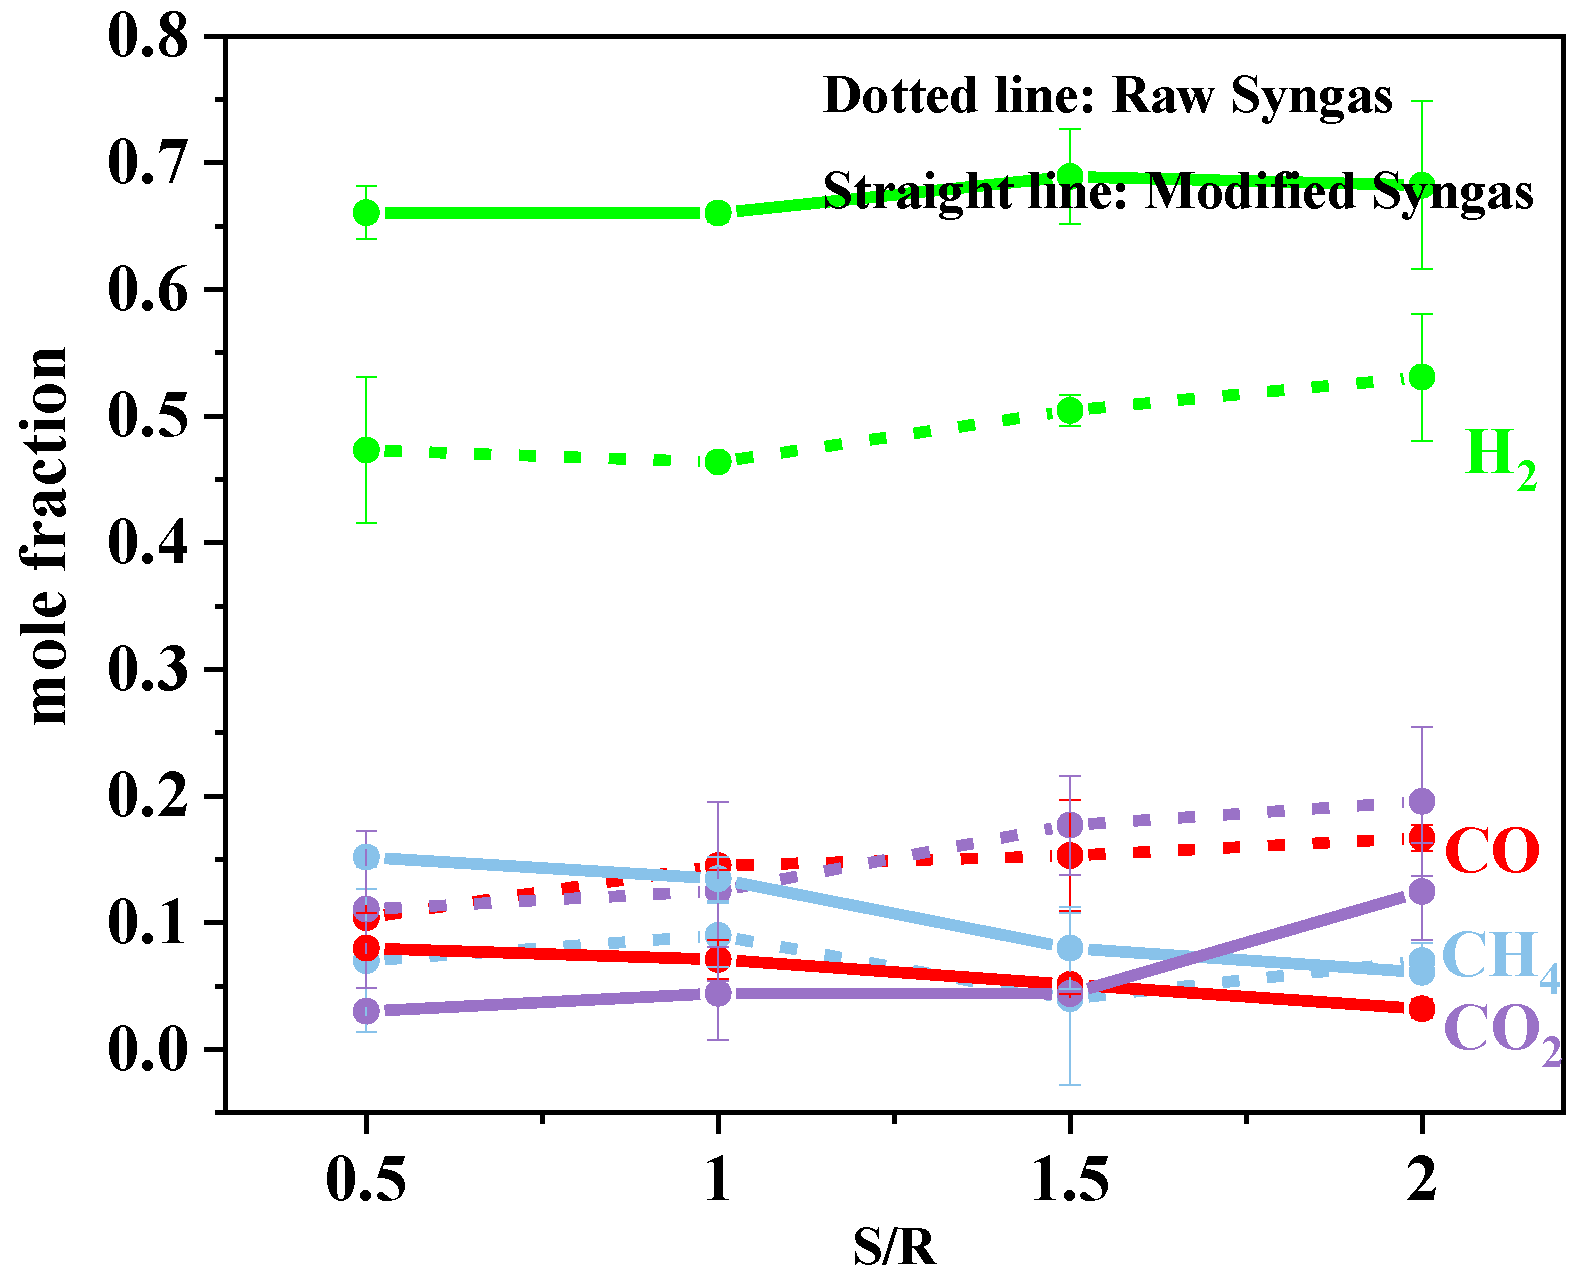
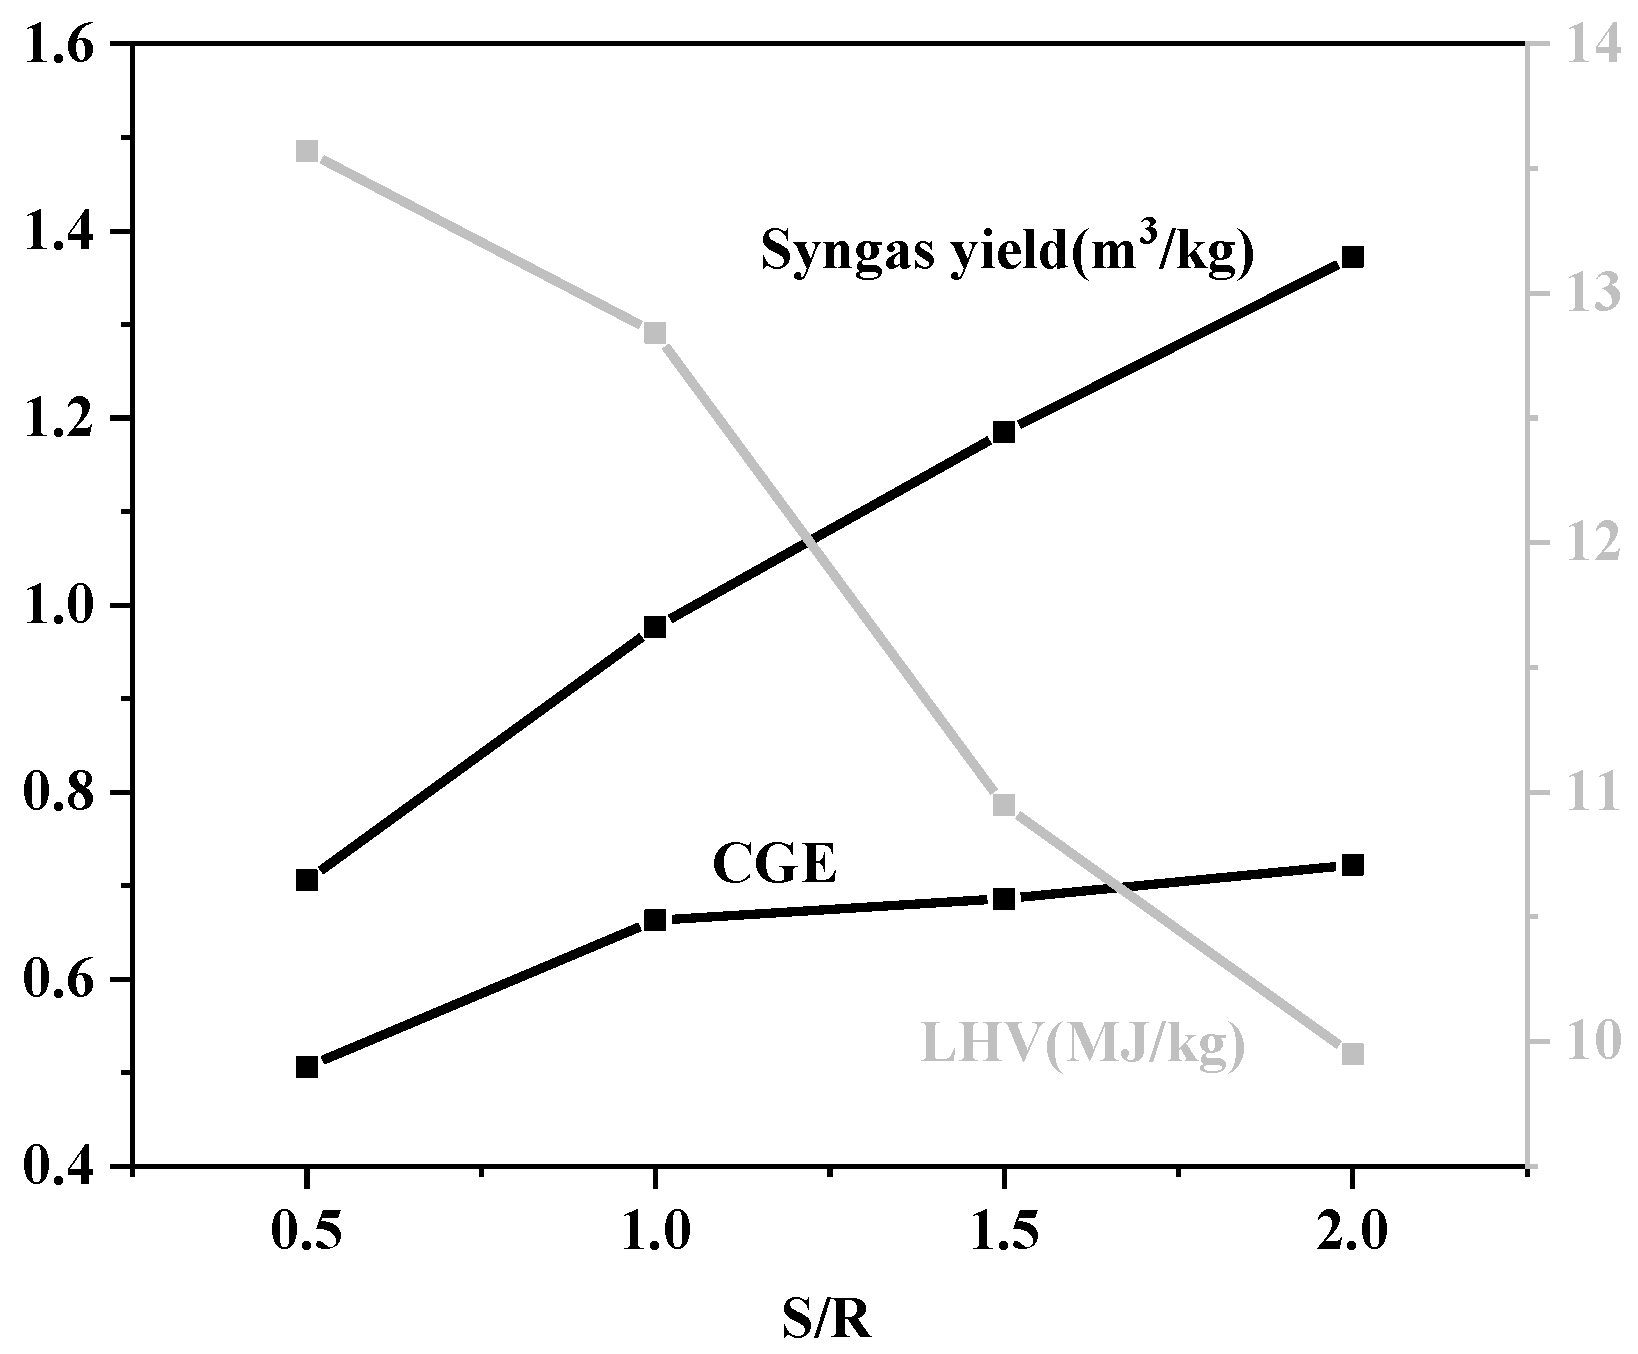
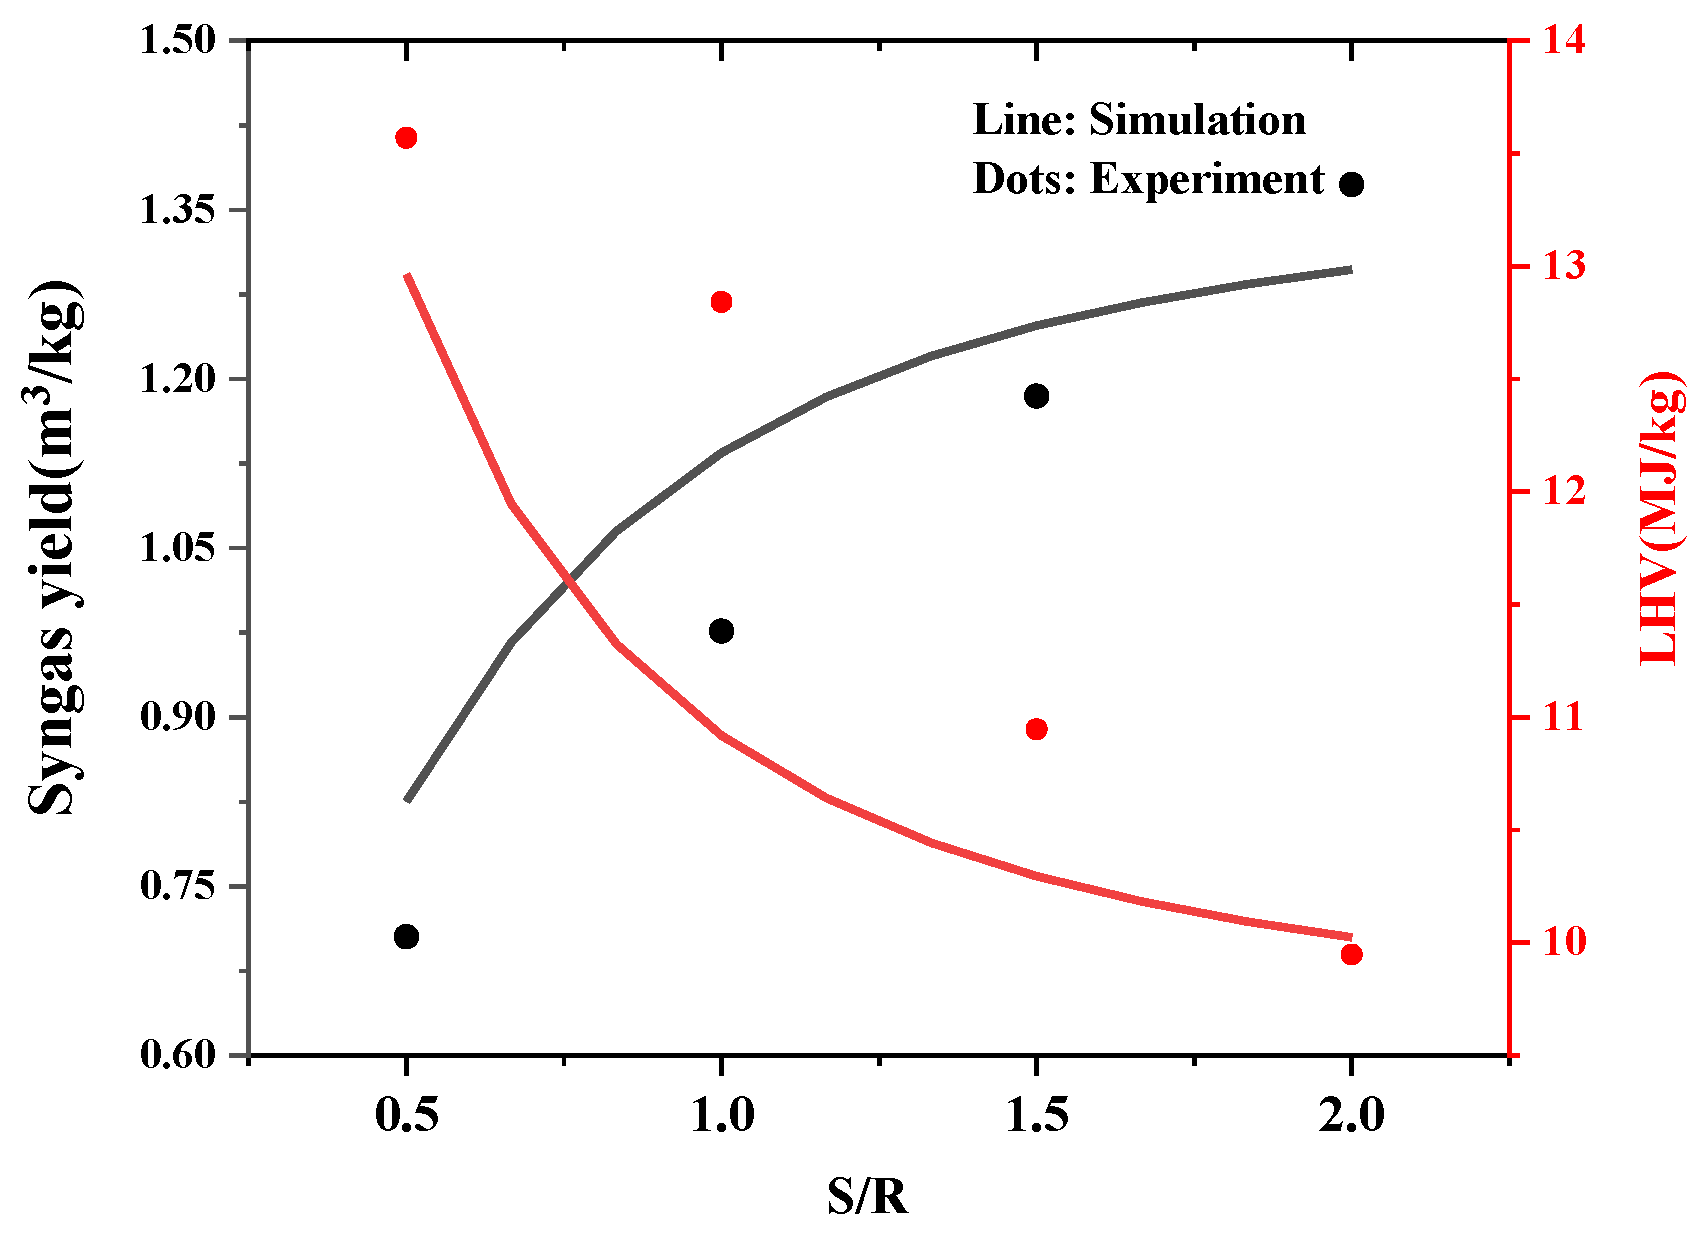
3.1.4. Effect of S/R

Figure 11 shows the effect of the S/R on the gas distribution for the raw syngas and modified syngas. The increase in the steam favors the H2 production. The rise in the amount of steam shifts the reaction (5)–(7) equilibrium towards the production direction. As the S/R reached 2, the H2 content in the raw syngas reached 52%, with 68% in the modified syngas. For the modified syngas, the increasing steam amount also decreased the CH4 concentration by shifting the methane steam reforming reaction (7) towards the right side with increasing H2 content. More CO content was converted to CO2 and H2 by the rising amount of steam. The variation of the syngas yield, CGE, and syngas LHV against S/R are shown in Figure 12. Although injecting more steam into the gasifier could increase the syngas yield, the drop of the CH4 and CO contents led to the drop of the syngas LHV. The CGE increased from 50 to 66% with increasing S/R from 0.5 to 1.0. Considering that more steam means more energy input for the system, the ideal S/R for producing a higher quality syngas is suggested to be around 1.

3.2. Simulation Results

3.2.1. Basic Scenario Simulation Results

The simulation results obtained under the condition of a gasification temperature of 960 °C, a modification temperature of 650 °C, and an S/R of 1 are shown in Figure 13. The results of the experiment data are also shown in the figure to evaluate the reliability of the simulation model. The simulation and experimental data show a similar variation trend for the syngas through the modification of the CaO. After modification by CaO, the CO and CO2 content dropped significantly with the increase in H2 and CH4. The H2, CO, and CO2 content for the simulation result was higher than the experimental results, while the CH4 for the simulation results was significantly lower than the experiment. The formation of tar and other hydrocarbons is inevitable during the experiment, but they are not considered in the simulation model. The RDF is almost all converted in the simulation model to the main gas components, i.e., CO2, CO, and H2, causing a very low CH4 concentration.

3.2.2. Effect of Gasification Temperature

Figure 14 shows the effect of the gasification temperature on the gas distribution of the raw syngas for both the experiment and the simulation. The results for the experiment can be easily predicted by the simulation. However, higher deviation can be found at the lower temperature range. At lower temperatures, the tar generation was higher, yet no tar content was considered in the current simulation model, causing the significant error. At around 960 °C, the simulation model can easily predict the H2 concentration but underestimates the CO, CH4 and overestimates the CO2 content.

3.2.3. Effect of the Modification Temperature

The effect of the modification temperature on the gas distribution of the modified syngas by the process simulation is shown in Figure 15. The H2 content first increased from 550 to 700 °C, then dropped significantly from 700 to 750 °C and remained almost constant afterward. The increase in the modification temperature weakened the adsorption ability of the CaO particles, resulting in the increase in CO2 and CO content. As shown in Figure 15, the CaCO3 generated in the modification reactor decomposed rapidly at the temperature range of 700 to 750 °C, leading to the significant increase in CO2 and decrease in H2 content. The experimental result shows the same trend from 550 to 850 °C. Figure 16 compares the variation of syngas LHV and syngas yield against modification temperature obtained from the experiments and simulation. The simulation model could easily predict the variation trend for both syngas LHV and syngas yield. As the simulation model underestimated the CH4 content in the modified syngas, the LHV obtained by simulation was lower than the experiment data. Considering both the simulation and experimental results, the modification temperature should be controlled below 700 °C to obtain higher quality syngas.

3.2.4. Effect of S/R

Figure 17a,b show the comparison between the simulation and experiment results of the gas distribution under different S/R ratios. A similar variation trend can be found for the simulation results, but the CO and CO2 concentrations are higher than experimental data and CH4 concentration is lower. Both experiment and simulation results indicate that increasing the S/R could improve the syngas quality by producing more H2. As shown in Figure 18, the syngas yield increased significantly at high S/R but gradually became stable since the input steam was enough for the gasification process. Conversely, the LHV of syngas decreased with S/R. Considering the gas distribution, syngas LHV, and syngas yield results from both the experiment and simulation, controlling the S/R at around 1 is beneficial for obtaining H2-rich gas with a higher syngas LHV.

4. Conclusions

In this study, the steam gasification of refuse-derived fuel (RDF) for hydrogen-rich syngas production was investigated in a lab-scale gasification system with CaO modification. For RDF with the LHV of 18.91 MJ/kg, H2 frication in the obtained syngas increased from 47 to 67% after CaO modification at 650 °C with the gasification temperature of 960 °C and steam to RDF ratio of 1. The influences of gasification temperature, S/R, and CaO modification temperature on the gas composition, heating value, and syngas yield were also evaluated. The results indicate that higher H2 content could be obtained by increasing both gasification temperature and S/R. However, as the CaO adsorption temperature increased, a lower H2 fraction was obtained due to the limitation of the CaO adsorption capacity at high temperature. The highest H2 concentration (69%), gas yield (1.372 m3/kg-RDF), and H2 yield (0.935 m3/kg-RDF) were achieved at a gasification temperature of 960 °C, S/R being 2 with the CaO modification temperature at 650 °C. A simulation model based on Aspen Plus was built to study the characteristics and the performance of the RDF gasification system. The variation trends in simulation results can match well with the experiments for gas distribution and syngas LHV, syngas yield. However, the gas concentrations deviated from the experimental data, especially at low gasification temperatures, due mainly to the tar formation that was not considered in the process simulation.

Author Contributions

R.R.: data curation, formal analysis, investigation, software, writing—original draft, and writing—review and editing. H.W.: conceptualization, experimental design, supervision, and writing—review and editing. C.Y.: writing—review and editing, supervision, and funding acquisition. All authors have read and agreed to the published version of the manuscript.

Funding

This work was supported by the National Natural Science Foundation of China (52106163), Beijing Natural Science Foundation (3222032), and the Huaneng Group science and technology research project (HNKJ21-H31).

Data Availability Statement

Publicly available datasets were analyzed in this study. This data can be found here: https://www.iea.org/reports/global-hydrogen-review-2022 (accessed on 2 November 2022); https://datatopics.worldbank.org/what-a-waste/ (accessed on 2 November 2022).

Acknowledgments

The authors acknowledge the funding of the National Natural Science Foundation of China and the Huaneng Group science and technology research project.

Conflicts of Interest

The authors declare no conflict of interest.

References

  1. IEA Global Hydrogen Review. Available online: https://www.iea.org/reports/global-hydrogen-review-2022 (accessed on 1 September 2022).
  2. Hossain, H.M.Z.; Hasna, Q.H.; Monir, M.M.U.; Ahmed, M.T. Municipal solid waste (MSW) as a source of renewable energy in Bangladesh: Revisited. Renew. Sustain. Energy Rev. 2014, 39, 35–41. [Google Scholar] [CrossRef]
  3. Moya, D.; Aldás, C.; López, G.; Kaparaju, P. Municipal solid waste as a valuable renewable energy resource: A worldwide opportunity of energy recovery by using Waste-To-Energy Technologies. Energy Procedia 2017, 134, 286–295. [Google Scholar] [CrossRef]
  4. Kaza, S.; Yao, L.; Bhada-Tata, P.; Woerden, V.F. What a Waste 2.0: A Global Snapshot of Solid Waste Management to 2050; Urban Development Series; World Bank: Washington, DC, USA, 2018; Available online: https://datatopics.worldbank.org/what-a-waste/ (accessed on 1 October 2022).
  5. Lu, J.W.; Zhang, S.; Hai, J.; Lei, M. Status and perspectives of municipal solid waste incineration in China: A comparison with developed regions. Waste Manag. 2017, 69, 170–186. [Google Scholar] [CrossRef] [PubMed]
  6. Ding, Y.; Zhao, J.; Liu, J.W.; Zhou, J.; Cheng, L.; Zhao, J.; Shao, Z.; Iris, C.; Pan, B.; Li, X.; et al. A review of China’s municipal solid waste (MSW) and comparison with international regions: Management and technologies in treatment and resource utilization. J. Clean. Prod. 2021, 10, 126–144. [Google Scholar] [CrossRef]
  7. Shi, D.Z.; Wu, W.X.; Lu, S.Y.; Chen, T.; Huang, H.L.; Chen, Y.X.; Yan, J.H. Effect of MSW source-classified collection on the emission of PCDDs/Fs and heavy metals from incineration in China. J. Hazard. Mater. 2008, 153, 685–694. [Google Scholar] [CrossRef]
  8. Luo, H.; Cheng, Y.; He, D.; Yang, E.H. Review of leaching behavior of municipal solid waste incineration (MSW) ash. Sci. Total Environ. 2019, 668, 90–103. [Google Scholar] [CrossRef]
  9. Zhou, H.; Meng, A.; Long, Y.; Li, Q.; Zhang, Y. An overview of characteristics of municipal solid waste fuel in China: Physical, chemical composition and heating value. Renew. Sustain. Energy Rev. 2014, 36, 107–120. [Google Scholar] [CrossRef]
  10. Yang, Y.; Liew, R.K.; Tamothran, A.M.; Foong, S.Y.; Yek PN, Y.; Chia, P.W.; Van Tran, T.; Peng, W.; Lam, S.S. Gasification of refuse-derived fuel from municipal solid waste for energy production: A review. Environ. Chem. Lett. 2021, 19, 2127–2140. [Google Scholar] [CrossRef]
  11. Djlab, C. Gasification of municipal solid waste (MSW) as a cleaner final disposal route: A mini-review. Bioresour. Technol. 2021, 344, 126217. [Google Scholar]
  12. Dong, J.; Tang, Y.; Nzihou, A.; Chi, Y.; Weiss-Hortala, E.; Ni, M.; Zhou, Z. Comparison of waste-to-energy technologies of gasification and incineration using life cycle assessment: Case studies in Finland, France and China. J. Clean. Prod. 2018, 203, 287–300. [Google Scholar] [CrossRef]
  13. Maryem, D.; Kaouther, G.; Walid, H.; Ahmed, G.; Lioua, K.; Mohamed, N.B. Simulation of Biomass Air Gasification in a Bubbling Fluidized Bed Using Aspen Plus: A Comprehensive Model Including Tar Production. ACS Omega 2022, 7, 33518–33529. [Google Scholar]
  14. Alouani, Y.; Saifaoui, D.; Alouani, A.; Alouani, M.A. Municipal solid waste gasification to produce hydrogen: Integrated simulation model and performance analysis. Int. J. Energy Res. 2022, 46, 20068–20078. [Google Scholar] [CrossRef]
  15. Yadav, S.; Mohanty, P. Utilization of paper mill sludge as a sustainable source of hydrogen production. Biofuels 2022, 13, 1113–1118. [Google Scholar] [CrossRef]
  16. Kong, G.; Wang, K.; Zhang, X.; Li, J.; Han, L.; Zhang, X. Torrefaction/carbonization-enhanced gasification-steam reforming of biomass for promoting hydrogen-enriched syngas production and tar elimination over gasification biochars. Bioresour. Technol. 2022, 363, 127960. [Google Scholar] [CrossRef] [PubMed]
  17. Muhammad, M.K.; Xu, S.P.; Wang, C. Catalytic biomass gasification in decoupled dual loop gasification system over alkali-feldspar for hydrogen rich-gas production. Biomass Bioenergy 2022, 161, 106472. [Google Scholar]
  18. Gupta, A.K.; Cichonski, W. Ultrahigh Temperature Steam Gasification of Biomass and Solid Wastes. Environ. Eng. Sci. 2006, 24, 1179–1189. [Google Scholar] [CrossRef]
  19. Aayush, R.; Sanjeev, Y. Hydrogen rich syngas production from food waste via an integrated two-stage process of in-situ steam gasification after fast pyrolysis. Energy Sources 2022, 44, 1608–1619. [Google Scholar]
  20. Mahishi, M.R.; Goswami, D.Y. An experimental study of hydrogen production by gasification of biomass in the presence of a CO2 sorbent. Int. J. Hydrogen Energy 2007, 32, 2803–2808. [Google Scholar] [CrossRef]
  21. Li, B.; Christian, F.M.M.; Huang, Y.; Liu, D.J.; Wang, Q.; Zhang, S. A review of CaO based catalysts for tar removal during biomass gasification. Energy 2022, 244, 123172. [Google Scholar] [CrossRef]
  22. Wang, H.M.; Liu, G.C.; Zhao, Y.N.; Boon Veksha, A.; Giannis, A.; Lim, T.T.; Grzegorz, L. Dual-functional witherite in improving chemical looping performance of iron ore and simultaneous adsorption of HCl in syngas at high temperature. Chem. Eng. J. 2021, 413, 127538. [Google Scholar] [CrossRef]
  23. Liu, G.C.; Wang, H.M.; Veksha, A.; Giannis, A.; Lim, T.T.; Lisak, G. Chemical looping combustion-adsorption of HCl-containing syngas using alkaline-earth coated iron ore composites for simultaneous purification and combustion enhancement. Chem. Eng. J. 2021, 417, 129226. [Google Scholar] [CrossRef]
  24. Wang, H.M.; Liu, G.C.; Veksha, A.; Giannis, A.; Lim, T.T.; Lisak, G. Effective H2S control during chemical looping combustion by iron ore modified with alkaline earth metal oxides. Energy 2021, 218, 119548. [Google Scholar] [CrossRef]
  25. Elbaba, I.F.; Wu, C.F.; Williams, P.T. Hydrogen production from the pyrolysis gasification of waste tyres with a nickel/cerium catalyst. Int. J. Hydrogen Energy 2011, 36, 6628–6637. [Google Scholar] [CrossRef]
  26. Wang, G.Q.; Zhang, H.Y. Physical Composition and Characteristics Analysis of The Municipal Solid Waste (MSW) In Beijing. Environ. Eng. 2018, 36, 132–136. (In Chinese) [Google Scholar]
  27. Chang, J.I.; Tsai, J.; Wu, K.H. Mathematical model for carbon dioxide evolution from the thermophilic composting of synthetic food wastes made of dog food. Waste Manag. 2005, 25, 1037–1045. [Google Scholar] [CrossRef] [PubMed]
  28. Chavando JA, M.; Silva, V.B.; Tarelho, L.A.; Cardoso, J.S.; Eusébio, D. Snapshot review of refuse-derived fuels. Util. Policy 2022, 74, 10136. [Google Scholar] [CrossRef]
  29. DPio, D.T.; Tarelho LA, C.; Tavares AM, A.; Matos MA, A.; Silva, V. Co-gasification of refused derived fuel and biomass in a pilot-scale bubbling fluidized bed reactor. Energy Convers. Manag. 2020, 206, 112476. [Google Scholar]
  30. Henrietta, E.W.; Khaled, L.; Sary, A.; Mohand, T. Pyrolytic oil production by catalytic pyrolysis of refuse-derived fuels: Investigation of low cost catalysts. Fuel Process. Technol. 2015, 140, 32–38. [Google Scholar]
  31. Trirat, K.; Ratchaphon, S. Effect of Equivalence Ratio on an Efficiency of Single Throat Downdraft Gasifier Using RDF from Municipal solid waste. Energy Procedia 2017, 138, 784–788. [Google Scholar]
  32. Shen, Y.; Wang, J.; Ge, X.; Chen, M. By-products recycling for syngas cleanup in biomass pyrolysis–An overview. Renew. Sustain. Energy Rev. 2016, 59, 1246–1268. [Google Scholar] [CrossRef]
  33. Wang, H.H.; Ren, R.R.; Liu, B.J.; You, C.F. Hydrogen production with an auto-thermal MSW steam gasification and direct melting system: A process modeling. Int. J. Hydrogen Energy 2022, 10, 6508–6518. [Google Scholar] [CrossRef]
  34. Safarian, S.; Unnthornorsson, R.; Richter, C. A review of biomass gasification modelling. Renew. Sustain. Energy Rev. 2019, 110, 378–391. [Google Scholar] [CrossRef]
  35. Ramzan, N.; Ashraf, A.; Naveed, S.; Malik, A. Simulation of hybrid biomass gasification using Aspen plus: A comparative performance analysis for food, municipal solid and poultry waste. Biomass Bioenergy 2011, 359, 3962–3969. [Google Scholar] [CrossRef]
  36. Zhu, L.; Zhang, L.; Fan, J.M.; Jiang, P.; Li, L.L. MSW to synthetic natural gas: System modeling and thermodynamics assessment. Waste Manag. 2016, 48, 257–264. [Google Scholar] [CrossRef] [PubMed]
  37. Pala, L.P.R.; Wang, Q.; Kolb, G.; Hessel, V. Steam gasification of biomass with subsequent syngas adjustment using shift reaction for syngas production: An Aspen Plus model. Renew. Energy 2017, 101, 484–492. [Google Scholar] [CrossRef]
  38. Sun, Y.; Qin, Z.; Tang, Y.T.; Huang, T.; Ding, S.C.; Ma, X.Q. Techno-environmental-economic evaluation on municipal solid waste (MSW) to power/fuel by gasification-based and incineration-based routes. J. Environ. Chem. Eng. 2021, 9, 106–108. [Google Scholar] [CrossRef]
  39. Fan, J.; Hong, H.; Zhang, L.; Li, L.; Jin, H. Thermodynamic performance of SNG and power coproduction from MSW with recovery of chemical unreacted gas. Waste Manag. 2017, 67, 163–170. [Google Scholar] [CrossRef]
  40. Gopaul, S.G.; Dutta, A.; Clemmer, R. Chemical looping gasification for hydrogen production: A comparison of two unique processes simulated using Aspen Plus. Int. J. Hydrogen Energy 2014, 39, 5804–5817. [Google Scholar] [CrossRef]
  41. Tanigaki, N.; Manako, K.; Osada, M. Co-gasification of municipal solid waste and material recovery in a large-scale gasification and melting system. Waste Manag. 2012, 32, 667–675. [Google Scholar] [CrossRef]
  42. Fernandez-Lopez, M.; Pedroche, J.; Valverde, J.L.; Sanchez-Silva, L. Simulation of the gasification of animal wastes in a dual gasifier using Aspen Plus. Energy Convers. Manag. 2017, 140, 211–217. [Google Scholar] [CrossRef]
  43. Donat, F.; Florin, N.H.; Anthony, E.J.; Fennell, P.S. Influence of High-Temperature Steam on the Reactivity of CaO Sorbent for CO2 Capture. Environ. Sci. Technol. 2012, 46, 1262–1269. [Google Scholar] [CrossRef] [PubMed]
  44. Luo, S.Y.; Zhou, Y.M.; Yi, C.J. Syngas production by catalytic steam gasification of municipal solid waste in fixed-bed reactor. Energy 2012, 44, 391–395. [Google Scholar] [CrossRef]
Figure 1. Composition of the synthetic RDF.
Energies 15 08279 g001
Figure 2. Schematic diagram of experiment setup.
Energies 15 08279 g002
Figure 3. Comparison between the real updraft gasifier and simulation gasifier.
Energies 15 08279 g003
Figure 4. Schematic diagram of the simulation model.
Energies 15 08279 g004
Figure 5. Gas components before and after CaO modification.
Energies 15 08279 g005
Figure 6. LHV and yield of the raw syngas and modified syngas.
Energies 15 08279 g006
Figure 7. Effect of gasification temperature on the gas distribution.
Energies 15 08279 g007
Figure 8. Effect of gasification temperature on LHV, syngas yield, and CGE.
Energies 15 08279 g008
Figure 9. Effect of modification temperature on gas distribution for modified syngas.
Energies 15 08279 g009
Figure 10. Effect of modification temperature on LHV and syngas yield for modified syngas.
Energies 15 08279 g010
Figure 11. Effect of S/R on the gas distribution.
Energies 15 08279 g011
Figure 12. Effect of S/R on the syngas LHV and syngas yield for modified syngas.
Energies 15 08279 g012
Figure 13. Simulation result for basic scenario.
Energies 15 08279 g013
Figure 14. Effect of gasification temperature on gas distribution for the raw syngas.
Energies 15 08279 g014
Figure 15. Effect of the modification temperature on the gas distribution and mass flow for CaCO3 generated in the modified reactor.
Energies 15 08279 g015
Figure 16. Effect of the modification temperature on syngas yield and LHV for the modified syngas.
Energies 15 08279 g016
Figure 17. (a) Effect of S/R on gas distribution for the raw syngas, (b) Effect of S/R on gas distribution for the modified syngas.
Energies 15 08279 g017
Figure 18. Effect of S/R on syngas yield and LHV for the modified syngas.
Energies 15 08279 g018
Table 1. Proximate and Ultimate analysis of the synthetic RDF.
Ultimate Analysis/wt%
C41.03
H5.86
O38.22
N0.14
S1.42
Proximate Analysis/wt%
Moisture6.37
Ash13.33
Volatile76.34
Fixed carbon10.33
LHV (MJ/kg)18.91
Table 2. Main reactions that occurred in the reactors.
NumberReactionReaction Heat (kJ/mol)
(1)C + 1/2O2→CO−111
(2)CO + 1/2O2→CO2−283
(3)C + O2→CO2−394
(4)H2 + 1/2O2→H2O−242
(5)C + H2O↔CO + H2+131
(6)CO + H2O↔CO2 + H2−41
(7)CH4 + H2O↔CO + 3H2+206
(8)CH4 + CO2↔2CO + 2H2+259
(9)CO + 3H2↔CH4 + H2O−227
(10)C + CO2↔2CO+172
(11)CaO + CO2↔CaCO3−166
Table 3. Operational Parameters for RDF gasification system.
ParameterValue
RDF feeding rate0.25 kg/h
Steam injection rate0.25 kg/h
S/R1
Gasification Temperature960 °C
CaO Modification Temperature650 °C
Table 4. Validation for the effect of gasification temperature.
Temperature (°C)H2 (%)COCO2CH4
Reference Experiment [44]
7000.340.110.380.10
7500.400.130.36760.05
8000.470.150.320.02
8500.510.160.280.02
9000.540.230.200.01
This Study (Raw Syngas)
6600.160.130.270.14
7600.240.150.170.12
8600.340.180.080.10
9600.460.190.120.08
This Study (Modified Syngas)
6600.530.170.020.06
7600.550.200.020.03
8600.570.220.020.03
9600.660.130.060.04
Table 5. Comparison for the effect of the steam amount.
S/CH2COCO2CH4
Reference Experiment [44]
00.310.270.280.12
0.520.390.480.120.01
0.840.410.420.130.02
1.520.530.260.180.02
1.880.540.240.210.01
2.410.540.230.210.01
This Study (Raw Syngas)
S/MH2COCO2CH4
0.50.470.100.110.07
10.460.150.130.09
1.50.500.150.180.04
20.530.170.200.07
This Study (Modified Syngas)
0.50.660.080.030.15
10.660.070.040.13
1.50.690.050.040.08
20.680.030.120.06
Publisher’s Note: MDPI stays neutral with regard to jurisdictional claims in published maps and institutional affiliations.

