Abstract
Renewable energy sources (RES) are currently the main alternative to fossil fuels and are also seen as an important contributor to slowing down the dangerous climate change on our planet. Energy supplied from renewable sources can reduce the consumption of primary raw materials and reduce emissions of harmful substances that enter the atmosphere in the process of producing electricity and heat, having a negative impact on the environment. This paper provides a multivariate comparative analysis of EU countries in terms of the use of renewable energy. The empirical research used seven variables defining the complex phenomenon under study, collected for 27 EU countries between 2011 and 2020. The research method used was the dynamic version of the non-model method, with a normalisation method based on zero unitarisation. The results of the study confirm that there was a positive change in the use of renewable energy in most EU countries between 2011 and 2020. High levels of renewable energy use were displayed by the Scandinavian countries, Sweden, Finland, and Denmark. In contrast, the least renewable energy use was seen in Poland, Hungary, and Slovakia.
1. Introduction
The dynamic development of civilization in many countries is associated with an increasing demand for energy. The use of traditional energy sources, such as coal, oil, and natural gas, is not only associated with increased environmental pollution but also causes the depletion of natural resources. Renewable energy sources are an alternative to non-renewable energy carriers such as fossil fuels. Energy statistics are in the spotlight due to their strategic importance for sustainable economic development [1].
The transformation of the energy sector towards the replacement of conventional energy carriers with renewable energy sources (RES), made possible by modern, increasingly economically available, innovative energy technologies, can be a crucial factor in mitigating climate change, and can also create new development opportunities for the economy of the entire European Union [2,3].
In recent years, several important energy-related issues have arisen in the European Union, such as oil price volatility, disruptions in energy supply from non-EU countries, and difficulties in market access for suppliers of gas and electricity. These issues have made energy one of the main political topics in European countries, and the use of renewable energy sources is seen as a key element of energy policy.
The aim of this study is to compare EU countries in terms of the use of renewable energy. The research period is 2011–2020 and the research method used is the dynamic version of the non-model method, with a normalisation method based on zero unitarisation.
Achieving the research objective included the following steps:
- -
- conducting a literature review on renewable energy in EU documents,
- -
- collecting statistical data on the level of energy use for the period 2011–2020 for the EU countries and carrying out statistical verification,
- -
- determining the value of a synthetic measure and constructing rankings of EU countries for the period 2011–2020,
- -
- classifying EU countries into groups with a similar level of achievement of the studied phenomenon.
The following research hypotheses were set in the study:
Hypothesis 1 (H1).
There has been a positive change in the use of renewable energy in most EU countries between 2011 and 2020.
Hypothesis 2 (H2).
The leaders of renewable energy use in the EU are the Nordic countries.
Hypothesis 3 (H3).
There have been significant changes in the composition of the groups of EU countries with similar use of renewable energy in 2020 compared to 2011.
The paper is organised as follows. First, we review the discussion of renewable energy in EU documents. Second, we present the methodology. The third section describes the research results. Next, the final part presents the discussion and our conclusions.
2. Renewable Energy in EU Documents
In modern times, energy has become an indispensable element of any country’s industrial and societal development [4]. Energy is necessary for the performance of work, ensuring security, combating climate change, producing food, and efforts to increase national income. Sustainable energy is an opportunity for a better future, as it can transform human lives, entire economies, and even our planet [5].
Energy can be obtained from non-renewable sources derived from fossil fuels such as coal, lignite, natural gas, and oil, or nuclear fuel creating conventional energy. In contrast, energy from renewable sources using nuclear reactions, flowing waters, thermal waters, wind, sun, or ambient heat, produces unconventional energy [6,7]. The availability of renewable sources is limited by geographical location. For example, the use of photovoltaic and solar thermal power is more economical in the states of southern Europe, or Turkey, while wind power is more competitive along coasts and in mountain ranges [8].
Renewable energy sources, mainly those based on the forces of nature, do not become depleted and their use does not burden the environment as significantly as fossil fuels, allowing decentralised energy production that is close to the consumer (as it does not require the transmission of energy over long distances), and allow the efficient development of rural areas with limited access to the electricity grid. The production of renewable energy is also becoming cheaper every year due to technological advances. Renewable energy sources have evolved from a technological novelty to a viable tool–enabling the production of energy to meet the growing needs of the world’s population [9,10,11].
The limited nature of fossil fuel energy sources and concerns about the state of the natural environment increased interest in renewable energy sources in the 1990s. Renewable energy for the European Union has long been an important aspect of the functioning of the Community [12,13].
As a consequence, renewable energy has found more frequent and increasing use in many countries. Initially, the focus was on solar and wind energy [14].
A groundbreaking event that triggered a new phase in the development of renewable energy sources was the signing of the Kyoto Protocol in December 1997 [15].
According to this document and the United Nations Framework Convention on Climate Change, the promotion of sustainable development in individual countries should be based on, for example, developing and increasing the use of new and renewable energy sources, CO2 absorption technologies, and the development of advanced and innovative environmentally friendly technologies. The challenges cited were one of the reasons why the EU introduced Directive 2001/77/EC of the European Parliament and of the Council of 27 September 2001 on the promotion of electricity produced from renewable energy sources in the internal market [16] and Directive 2003/30/EC of the European Parliament and of the Council of 8 May 2003 on the promotion of the use of biofuels or other renewable fuels for transport (publicly known as the “biofuels directive”) [11,17,18].
These directives enabled the accelerated implementation of the Kyoto Protocol and promoted renewable energy sources as technologies deemed to be a priority, environmentally friendly, and ensuring energy security [19].
The 2001 Directive also introduced a definition of renewable energy sources understood as renewable nonfossil energy sources (wind, solar, geothermal, wave, tidal, hydropower, biomass, landfill gas, sewage treatment plant gas, and biogases) [16].
The enlargement of the EU to include more Member States in 2004 forced an update of the RES energy share targets to 21%, and also set targets for candidate countries. However, these demands were nonbinding and did not result in consequences for member states if they were not met [20].
A 2006 document formulated a strategy of action toward sustainable, competitive, and secure energy [21]. In a subsequent document (the Energy Package) from 2007, the status of renewable energy use and assumptions for the future were presented. The previously envisaged target of a 10% share of renewable energy in total consumption in 2010 has become unachievable [22].
Developments in technology and increased public awareness have further tightened EU requirements for energy from renewable sources. The Commission, in its “Communication Renewable Energy Road Map. Renewable energies in the 21st century: building a more sustainable future.” [22] proposed a new framework for Member States aiming to achieve a 20% share of RES in total EU energy consumption by 2020 and a 10% share of renewable energy (biofuels) in transport. These demands were introduced by Directive 2009/28/EC of the European Parliament and of the Council of 23 April 2009 on the promotion of the use of energy from renewable sources [23], which amended and subsequently repealed Directives 2001/77/EC [16] and 2003/30/EC [17]. Directive 2009/28/EC obliged EU member states to develop National Action Plans in 2020 regarding the share of energy from renewable sources in the transport, electricity, heating, and cooling sectors. The “Plans” include, for example, information on the measures to be taken to achieve the national overall targets. Mention is made of cooperation between local, regional, and national authorities, cooperation between Member States and third countries, planned statistical transfers or joint projects, and national strategies aimed at developing new and existing biomass resources for different uses [23]. The Directive indicates that verification of progress in achieving national targets is made on the basis of biennial reports on RES progress [24].
Subsequent documents introduced by the EU tightened the framework for the promotion of energy from renewable sources. The Commission Communication of 22 January 2014, on the Policy framework for climate and energy 2020 to 2030 [25], proposed a new framework for EU climate and energy policy, including a share of renewable energy in EU energy consumption of at least 27%. With its conclusions of 23–24 October 2014, the European Council endorsed the Commission’s demands, leaving the Member States free to pursue more ambitious national targets.
In December 2018, the revised Directive on the promotion of the use of energy from renewable sources under the Clean Energy for all Europeans package [26] entered into force, introducing a more rigorous framework for the share of energy from renewable sources. The purpose of the package was to maintain the Union’s position as a global leader in renewables and, more broadly, to help the Union meet its emissions reduction commitments under the Paris Agreement [27,28]. The revised Directive has been in force since December 2018, and EU Member States had to complete its transposition into national law by June 2021 (with effect from 1 July 2021). According to the 2018 Directive, the main target for Member States is to achieve at least a 32% share of renewable energy in gross final energy consumption in the EU by 2030. There is also a clause to increase this target by 2023 and to increase the target for a 14% share of renewable energy in transport by 2030. Member States’ national targets set for the period up to 2030 should be maintained at least at the minimum level set for a given country for 2020. If the share of energy from RES falls below this value, the country should take appropriate measures to reach the baseline [24].
The above-mentioned measures are currently being implemented in the territory of the European Union Member States by supporting the building of the “green economy”, an important element of which is an increase in the use of renewable energy sources in final energy consumption [29].
In the July 2021 package on implementing the European Green Deal “Fit for 55: delivering the EU’s climate target on the way to climate neutrality”, the Commission proposed an amendment of the Renewable Energy Directive to align its renewable energy targets with the new climate goals. The Commission is proposing to increase the binding renewable energy target in the EU energy mix to 40% by 2030 and is promoting the use of renewable fuels such as hydrogen in industry and transport when setting additional targets [30]. Discussions are currently underway on an energy policy framework for the period after 2030, including the target of achieving EU energy neutrality by 2050 [24]. To achieve climate neutrality by 2050, a series of actions and decisions need to be taken in virtually all areas of economic and social life [31].
Such an orientation of the economy was fostered in particular by the Europe 2020 Strategy [32,33] and later by “Towards a Sustainable Europe by 2030” [34], which defined the main challenges facing EU Member States on the road to sustainable development.
3. Materials and Methods
3.1. Data and Variables
The following variables, forming a potential (pre-selected) set of diagnostic variables, were used in the assessment of the use of renewable energy in EU countries between 2011 and 2020:
X1-Share of energy from renewable sources (% of gross final energy consumption).
X2-Energy production from renewable sources (wind energy in megawatts per 100,000 population).
X3-Energy production from renewable sources (hydro energy in megawatts per 100,000 population).
X4-Energy production from renewable sources (solar energy in megawatts per 100,000 population).
X5-Energy production from renewable sources (solid biofuels energy in megawatts per 100,000 population).
X6-Share of energy from renewable sources for heating and cooling (% of gross final energy consumption).
X7-Share of energy from renewable sources in transport (% of gross final energy consumption).
All variables are stimulants, meaning that their high values are desirable from the perspective of the situation under study, while their low values are undesirable. The values of the variables were taken from the Eurostat database.
The use of multivariate comparative analysis methods in empirical research requires going through several successive stages. The first is the selection of diagnostic variables, i.e., variables that meet specific criteria regarding the level of variability and correlation.
The assessment of the variability of variables is most often performed by means of the classical coefficient of variation defined by the formula [35]:
where:
—coefficient of variation
—standard deviation of the feature
—arithmetic mean of the feature
The individual components of formula 1 are calculated from the formulas:
From the set of potential diagnostic variables, variables that met the following condition were eliminated:
where:
v*—critical value of the coefficient of variation (usually taken at the level of 0.10).
An appropriate level of correlation of variables is also an important criterion for the selection of diagnostic variables. This is because a high level of correlation indicates duplication of information carried by the variables, which is not desirable. The inverse correlation matrix method developed by A. Malina and A. Zelias can be helpful in assessing the correlation of variables.
The steps in this method include [36,37]:
- Calculation of the R matrix of linear correlation coefficients in the form
rjk—Pearson’s linear correlation coefficient between the variables Xj and Xk.
- Determination of the inverse matrix of the matrix,
When a variable is excessively correlated with the other variables, the diagonal elements of the inverse matrix are much larger than unity, which is a symptom of poor numerical conditioning of the matrix.
- Eliminating from the set of variables those for which the condition is met:
—diagonal element of the matrix ,
r*—critical value of diagonal elements of the matrix , most often set at the level of 10.
3.2. Method
In the study of the use of renewable energy in EU countries, one of the methods of multivariate comparative analysis was applied–the dynamic version of the non-model method, with a normalisation method based on zero unitarisation.
The approach of this method involves the following steps [38,39]:
- Representation of the variable values Xj (j = 1, 2, …, m) for individual objects Oi (i = 1, 2, …, n) in the form of a matrix of observations for the subsequent years under study:
- Making the variables comparable by normalisation using the formula:
—the normalised value of a j-th variable for the i-th object, —the value of a j-th variable for the i-th object,—range for the jth variable. Normalisation was carried out for “object-periods”, i.e., , , and values were identified for all studied years.
- Calculating the synthetic measure values as an arithmetical mean of normalised variable values, using the formula:
- Classifying the EU-27 countries with similar levels, according to the following formulas [35]:
—the mean value of the synthetic measure,
—standard deviation of the synthetic measure.
4. Results
4.1. Descriptive Statistics
An initial assessment of the indicators determining the use of renewable energy in EU countries was made by calculating the basic descriptive measures, i.e., maximum, minimum, and average values, coefficient of variation (CV), and coefficient of asymmetry (CA) in the extreme years, i.e., for 2011 and 2020 (Table 1).

Table 1.
Descriptive statistics of variables in 2011 and 2020.
Based on the data presented in Table 1, it can be seen that there have been positive changes in the use of renewable energy in EU countries in 2020 compared to 2011. The maximum (except for variable X3) and average values of the individual variables increased. The leaders in the use of renewable energy have hardly changed in the years compared. The leading countries are Sweden, Denmark, Luxembourg, Germany, and Finland. The variation among EU countries in variables X1–X7, as measured by the coefficient of variation, also decreased. One can also notice changes in the coefficient of asymmetry in 2020 compared to 2011. In 2020, the values of variable X7-Share of energy from renewable sources in transport (% of gross final energy consumption) and X5-Energy production from renewable sources (solid biofuels energy in megawatts per 100,000 population) were below the EU27 average level for the vast majority of countries.
More detailed information on renewable energy usage in 2020 and 2011 in EU countries is presented in Figure 1, Figure 2, Figure 3, Figure 4, Figure 5, Figure 6 and Figure 7.
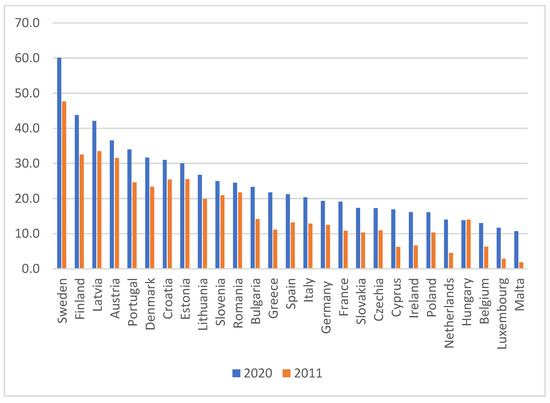
Figure 1.
Share of energy from renewable sources (% of gross final energy consumption) in EU countries in 2020 and 2011.
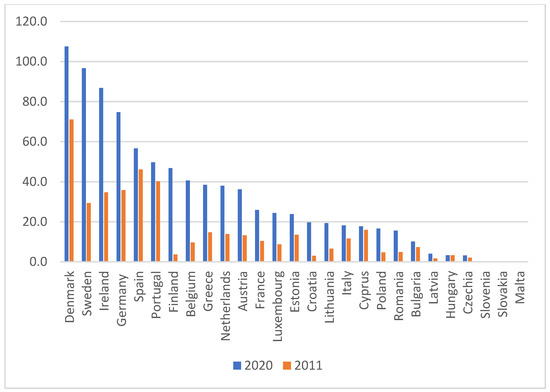
Figure 2.
Energy production from renewable sources (wind energy in megawatts per 100,000 population) in EU countries in 2020 and 2011.
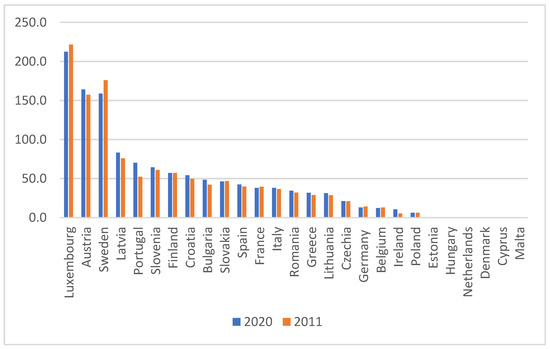
Figure 3.
Energy production from renewable sources (hydro energy in megawatts per 100,000 population).
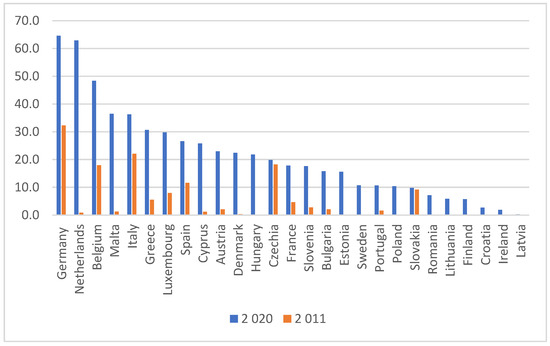
Figure 4.
Energy production from renewable sources (solar energy in megawatts per 100,000 population).
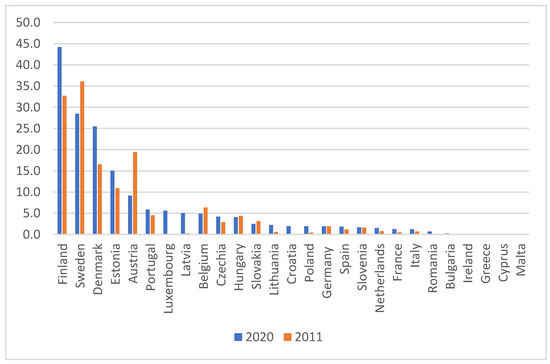
Figure 5.
Energy production from renewable sources (solid biofuels energy in megawatts per 100,000 population).
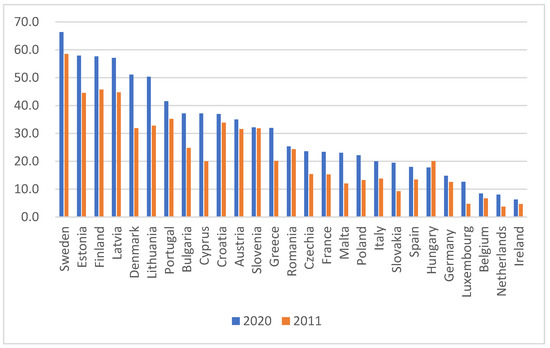
Figure 6.
Share of energy from renewable sources for heating and cooling (% of gross final energy consumption).
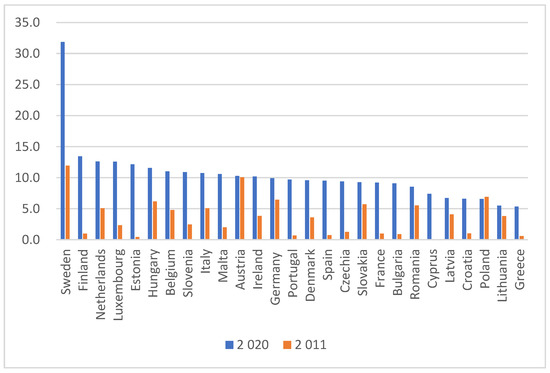
Figure 7.
Share of energy from renewable sources in transport (% of gross final energy consumption).
In the ranking of EU countries in terms of the variable X1-Share of energy from renewable sources (% of gross final energy consumption), which took place in 2020, top positions were taken by Sweden (60.12%), Finland (43.80%) and Latvia (42.13 %). The last positions were taken by Malta (10.71%), Luxembourg (11.70%), and Belgium (6.30%). In all EU countries, except Hungary, there was an increase in the value of the studied variable in 2020 compared to 2011 (Figure 1).
When assessing the development of energy production with the use of wind (variable X2), it can be noted that the leaders in this respect in 2020 are Denmark (107.50 megawatts per 100,000 population), Sweden (96.60), and Ireland (86.75). Malta, Slovakia, and Slovenia barely use wind energy. A comparison of data from 2011 and 2020 shows that most EU countries are interested in the usage of this type of energy (Figure 2).
The situation is different in the field of hydropower. In 2020, compared to 2011, the production of hydropower in megawatts per 100,000 population in almost all EU countries was at a similar level. The leaders in the use of this energy source are Luxembourg (212.51 megawatts per 100,000 population), Austria (164.08), and Sweden (158.86) (Figure 3).
In 2020, compared to 2011, solar energy as an energy source was much more popular in EU countries. Germany (64.59 megawatts per 100,000 population), the Netherlands (62.90), and Belgium (48.38) use it the most. Conversely, it is little used in Latvia (0.27 megawatts per 100,000 population), Ireland (1.87), and (Croatia (2.67). A comparison of the data from both analyzed years shows significant progress in most EU countries in the use of solar energy in overall energy production (Figure 4).
Among EU countries, only a few use solid biofuels energy to a large extent for energy production, principally, Finland (44.20 megawatts per 100,000 population), Sweden (28.49), and Denmark (25.50) (Figure 5).
The share of energy from renewable sources for heating and cooling in EU countries is steadily increasing. In 2020, the highest rates were achieved by Sweden (66.4%), Estonia (57.9%), Finland (57.6%), and Latvia (57.1%). Conversely, the share of energy from renewable sources for heating and cooling in Ireland, the Netherlands, and Belgium was in the range of 6 to 8% (Figure 6).
In 2020, Sweden was the undisputed leader in the use of renewable energy in transport with an indicator level of 31.9%. In other EU countries, the value of the variable X7-Share of energy from renewable sources in transport (% of gross final energy consumption) was at a similar level. In 2020, as compared to 2011, the vast majority of EU countries recorded an increase in the analysed indicator (Figure 7).
Assessing the use of renewable energy in EU countries taking into account the individual variables (X1–X7) considered separately seems difficult, as the situation of the countries studied varies with respect to the individual variables. Multivariate comparative analysis methods are a useful tool for a comprehensive assessment of EU countries in terms of renewable energy use. They make it possible to determine the value of a synthetic measure by taking a number of variables together. One multivariate comparative analysis approach is the non-model method with a normalisation method based on zero unitarisation. The following section presents the results of the subsequent steps involved in the application of this method.
The initial set of variables determining the level of renewable energy use (variables X1–X7) in EU countries in 2020 was checked for variability and correlation. The coefficient of variation values ranged from 0.45 for variable X7-Share of energy from renewable sources in transport (% of gross final energy consumption) to 1.61 for variable X5-Energy production from renewable sources (solid biofuels energy in megawatts per 100,000 population), and were, therefore, well above the cut-off level of 0.10 (Table 1).
The correlation between variables X1–X7 was also checked by determining Pearson’s linear correlation coefficient values (Table 2).
Table 2.
Correlation matrix between variables.
However, when analysing the diagonal elements of the inverse matrix , no values above 10 were found. which means that the variables under study did not show an excessive correlation between themselves (Table 3).
Table 3.
Inverse correlation matrix.
Variables X1–X7 thus became the diagnostic variables in 2020. In order to maintain comparability, the same set of variables was adopted for 2011–2019.
4.2. Rankings
The set of diagnostic variables formed the basis for determining the value of the synthetic measure for the subsequent years 2011–2020 according to the procedure described in Section 3.2. The results are presented in Table 4.
Table 4.
Values of the synthetic measure in the level of renewable energy use for EU countries from 2011 to 2020.
Based on the data in Table 4, it can be seen that there were positive changes in the level of renewable energy use in most EU countries between 2011 and 2020. This is indicated by the increasing values of the calculated synthetic measure for the EU27 countries in the following years:
- in 2011. from 0.0309 (Malta) to 0.5505 (Sweden).
- in 2012. from 0.0474 (Malta) to 0.5814 (Sweden).
- in 2013. from 0.0619 (Malta) to 0.5860 (Sweden).
- in 2014. from 0.0806 (Netherlands) to 0.6338 (Sweden).
- in 2015. from 0.0891 (Netherlands) to 0.6588 (Sweden).
- in 2016. from 0.0979 (Poland) to 0.6922 (Sweden).
- in 2017. from 0.0984 (Poland) to 0.6939 (Sweden).
- in 2018. from 0.1272 (Slovakia) to 0.7228 (Sweden).
- in 2019. from 0.1421 (Poland) to 0.7508 (Sweden).
- in 2020. from 0.1616 (Poland) to 0.7665 (Sweden).
Between 2011 and 2020, Sweden had the highest level of renewable energy use and was the undisputed leader. In contrast, the lowest level was exhibited by different countries in particular years. e.g., Malta (2011–2013), the Netherlands (2014–2015), Poland (2016–2017) and (2019–2020), and Slovakia (2018).
An increase in the value of the synthetic measure was also noticed in all EU countries in 2020 compared to 2010. This emphasizes the positive changes in the use of renewable energy.
In the next stage of the research. the positions of the individual countries compared to the EU average were determined by taking into account the values of the synthetic measure (Table 5).
Table 5.
Positions of EU countries in terms of the value of the synthetic measure indicating the level of renewable energy use from 2011 to 2020.
From 2011 to 2020 the leaders in terms of the use of renewable energy were Sweden (1st place in all years), Finland (2nd place in 8 years), and Austria and Denmark. In contrast, the last places in the European structure were occupied by Poland, Hungary, and Slovakia.
The situation may not improve in the coming years as, as emphasized by the authors [40], the energy crisis and the increase in fossil fuel prices have hit energy consumers around the world hard. This has happened particularly in countries dependent on conventional coal-fired power generation technology that are burdened by the serious rising costs of greenhouse gas emission allowances (e.g., Poland). In addition, a drastic increase in prices has been created by the war in Ukraine and the economic restrictions related to it, which particularly affects countries neighboring the territory of the conflict, most of which have been heavily dependent on fossil fuel supplies from its parties for years.
The greatest progress in the use of renewable energy in the EU27 was recorded by the Netherlands (improving its ranking by 16 places, from 26 in 2011 to 10 in 2020) and Greece (moving up from 21st place in 2011 to 12th in 2020). Comparing the rankings of EU countries in 2020 and 2011, it can be seen that twelve countries improved their places, two countries did not change their positions, while thirteen countries worsened their positions (Table 5).
4.3. Classification
Using the classification scheme defined by formula 11, the EU countries were divided into groups with similar use of renewable energy in 2011 and 2020 (Table 6, Figure 8).
Table 6.
Classification of EU countries in terms of the use of renewable energy in 2011 and 2020.
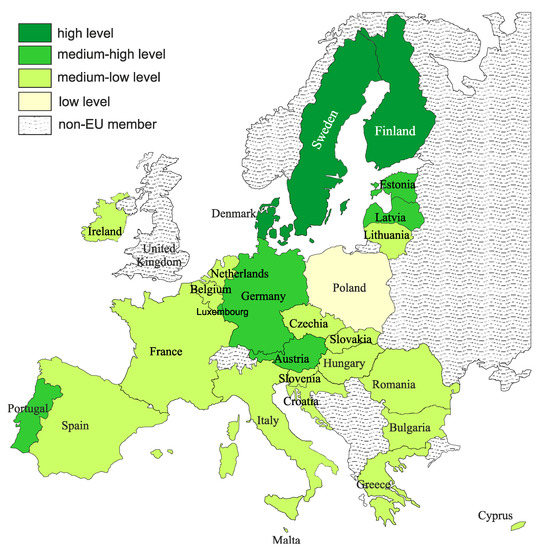
Figure 8.
Classification of EU countries in terms of renewable energy use in 2020.
It can be seen that in 2020 compared to 2011, the classification of EU countries in terms of the use of renewable energy did not change significantly, with only slight shifts of some countries (from group to group). The Scandinavian countries had a high level of renewable energy use: Sweden, Finland, and Denmark, and in 2011, Austria. Six countries had a medium-high level in 2020: Austria, Germany, Estonia, Portugal, Luxembourg, and Latvia. The largest number of EU countries qualified (in both years studied) for the medium-low group of renewable energy use (17 countries in 2020 and 16 in 2011). The Netherlands and Malta were promoted to the higher group in the study period, while Poland was placed in the group with a low level of renewable energy use (Table 6).
5. Discussion and Conclusions
Conventional energy resources. i.e., oil, coal, and gas, are depleting at a rapid rate. The increasing global demand for energy is accelerating this process even further. If we want to make rational use of the energy potential offered by nature, the renewable energy sector must be developed. Otherwise, we will be contributing to environmental pollution and the rapid depletion of our planet’s natural resources. To avoid this, we should create conditions conducive to the development of renewable energy. The energy supplied from renewable sources can reduce the consumption of primary raw materials and reduce emissions of harmful substances that enter the atmosphere in the process of producing electricity and heat, having a negative impact on the environment. The advantages of measures to improve energy efficiency are well known. They have a positive impact on the economy, the environment, society, and, consequently, even on our health and well-being. The implementation of energy-efficient technologies and solutions that reduce final energy consumption has an impact on improving energy security, reducing environmental pollution, and mitigating climate change. Renewable energy sources make an important contribution to improving energy efficiency. The trend of developing the renewable energy systems sector should be maintained, providing support and solutions to ensure the implementation of new technologies and the cost-effectiveness of “clean energy” production [41,42]. The European Union is promoting a Waste-To-Energy (WTE) initiative to minimise waste and greenhouse gas (GHG) emissions and increase renewable energy production [43,44].
This study has presented a statistical evaluation of the use of renewable energy in the EU27 countries. The analysis covered the period from 2011 to 2020. An initial evaluation of the use of renewable energy in EU member countries was performed using the set of descriptive measures (mean. maximum and minimum. CV and CA) for individual indicators.
The variables values determining the level of the use of renewable energy in the EU countries in 2020 and 2011 were also presented graphically. The results show that Sweden, Finland, and Latvia had the largest share of energy from renewable sources (% of gross final energy consumption) in 2020. While Malta, Luxembourg, and Belgium had the lowest share. Denmark, Sweden, and Ireland were the leaders in wind energy production in 2020. Three countries (Malta, Slovakia, and Slovenia) use hardly any wind energy. A comparison of data from 2011 and 2020 shows that the EU has a growing interest in using this type of energy. Hydropower production in 2020, compared to 2011, was at a similar level in almost all EU countries. Luxembourg, Austria, and Sweden are the leaders in using this energy source. Solar energy as a source of energy enjoyed a great interest in the EU countries. Germany, Netherlands, and Belgium use it the most. Conversely, Latvia, Ireland, and Croatia used very little. A comparison of the data from both analyzed years shows significant progress in most EU countries in the use of solar energy in general energy production. Only a few EU countries (principally, Finland, Sweden, and Denmark) use solid biofuels energy to a large extent to produce energy. In 2020, compared to 2011 in EU countries, the share of energy from renewable sources for heating and cooling is systematically growing. The highest rates were achieved by Sweden, Estonia, Finland, and Latvia. On the other hand, Ireland, Netherlands, and Belgium had a small share. In 2020, Sweden was the undisputed leader in the use of renewable energy in transport with an indicator level of 31.9%. In other EU countries, the value of the indicator was at a similar level.
Based on seven diagnostic variables, synthetic measure values were determined for the EU27 countries. The research method used was the dynamic version of the non-model method, with a normalisation method based on zero unitarisation. Progress has been noticed in implementing renewable energy in all EU countries.
The following conclusions can be drawn from the research:
- Between 2011 and 2020, most EU countries experienced positive changes in the use of renewable energy, as shown by the increase in the synthetic measure value. Hypothesis H1 was therefore confirmed.
- High levels of renewable energy use were displayed by the Scandinavian countries Sweden, Finland, and Denmark. However, most EU countries had a medium-low level of use. Hypothesis H2 was positively verified.
- In 2020, compared to 2011, there were no significant changes in the composition of the groups of EU countries with similar levels of renewable energy use, with only slight shifts between groups. Hypothesis H3 was therefore not confirmed.
Overall. it can be seen that EU countries are significantly diverse in their use of renewable energy. Reference should be made here to the importance of the natural conditions in individual countries that can be used in the generation of renewable energy (having a lot of rivers, favorable wind conditions, a significant prevalence of sunny days per year, having biofuels, etc.). Also of great importance are the outlays and costs associated with obtaining and using renewable energy, which can be a heavy burden for countries with a lower level of economic development.
The effort undertaken by individual EU countries is resulting in an increase in the share of renewable energy in the total national energy balance. The measures taken should have a significant impact on reducing the use of energy from traditional raw material sources that cause environmental pollution by dust and greenhouse gases. However. it should be noted that green energy has its natural limitations, which means that other alternative energy sources must also exist.
The issue of renewable energy is therefore becoming an important research area, both now and in the future. It seems that within its framework it is worth paying attention to the following issues:
- Energy is the basis not only of every human activity but also of every production process, hence its rational use becomes important.
- Replacing the use of conventional fossil fuels with renewable raw materials has a positive impact on the environment and is helping to slow down the climate crisis. This is an important issue now and for future generations.
- Increasing the share of renewable energy in the total energy balances of Member States offers an opportunity to strengthen the integrity and independence of the EU as a region.
- It is also important to raise citizens’ awareness of renewable energy and use various forms to support its usage.
- The EU energy policy should be sustainable in order to ensure energy security for present and future generations.
Author Contributions
Conceptualization. M.S. and M.G.; methodology. M.S.; formal analysis. M.S. and M.G.; writing original draft preparation. M.S. and M.G.; writing—review and editing. M.S. and M.G.; visualization, M.S.; supervision. M.S. and M.G.; funding acquisition. M.S. and M.G. All authors have read and agreed to the published version of the manuscript.
Funding
This research was funded by the Institute of Economics and Finance, University of Rzeszów, Poland.
Data Availability Statement
Not applicable.
Conflicts of Interest
The authors declare no conflict of interest.
References
- Angheluta, S.P.; Burlacu, S.; Diaconu, A.; Curea, C.S. The Energy from Renewable Sources in the European Union: Achieving the Goals. Eur. J. Sustain. Dev. 2019, 8, 57. [Google Scholar] [CrossRef]
- Pakulska, T. Green Energy in Central and Eastern European (CEE) Countries: New Challenges on the Path to Sustainable Development. Energies 2021, 14, 884. [Google Scholar] [CrossRef]
- Wojtkowska-Łodej, G.; Nyga-Łukaszewska, H. Low-Carbon Strategy in the European Union and Its Implications for the Member States from Central and Eastern Europe. In Wyzwania ekonomiczne dla Europy Środkowo-Wschodniej; Strojny, M., Wydawnicza, O., Eds.; Szkoła Główna Handlowa w Warszawie: Warszawa, Poland, 2018; pp. 295–314. [Google Scholar]
- Suppes, G.J.; Storvick, T.S. Energy and Civilization. In Sustainable Power Technologies and Infrastructure: Energy Sustainability and Prosperity in a Time of Climate Change; Suppes, G.J., Storvick, T.S., Eds.; Academic Press: Cambridge, MA, USA, 2016; pp. 1–28. [Google Scholar]
- Bórawski, P.; Bełdycka-Bórawska, A.; Jankowski, K.J.; Dubis, B.; Dunn, J.W. Development of wind energy market in the European Union. Renew. Energy 2020, 161, 691–700. [Google Scholar] [CrossRef]
- Karabegović, I.; Doleček, V. Development and implementation of renewable energy sources in the world and European Union. Contemp. Mater. (Renew. Energy Sources) 2015, VI−2, 130–148. [Google Scholar] [CrossRef]
- Rokicki, T.; Michalski, K.; Ratajczak, M.; Szczepaniuk, H.; Golonko, M. Use of renewable Energy sources in European Union countries. Annu. Set Environ. Prot. 2018, 20, 1318–1334. [Google Scholar]
- Boluk, G. Renewable Energy: Policy Issues and Economic Implications in Turkey. Int. J. Energy Econ. Policy 2013, 3, 153–167. [Google Scholar]
- Devine-Wright, P. Community versus local energy in a context of climate emergency. Nat. Energy 2019, 4, 894–896. [Google Scholar] [CrossRef]
- Młynarski, T. Unia Europejska w procesie transformacji energetycznej. Krak. Stud. Międzynarodowe 2019, 16, 31–44. (In Polish) [Google Scholar]
- Papież, M.; Śmiech, S.; Frodyma, K. Determinants of renewable energy development in the EU countries. A 20-year perspective. Renew. Sustain. Energy Rev. 2018, 91, 918–934. [Google Scholar] [CrossRef]
- Janiszewska, D.; Ossowska, L. Diversification of European Union Member States Due to the Production of Renewable Energy from Agriculture and Forestry. Probl. World Agric. 2018, 18, 95–104. [Google Scholar] [CrossRef]
- Janiszewska, D.; Ossowska, L. The role of agricultural biomass as a renewable energy source in European Union countries. Energies 2022, 15, 6756. [Google Scholar] [CrossRef]
- Bórawski, P.; Wyszomierski, R.; Bełdycka-Bórawska, A.; Mickiewicz, B.; Kalinowska, B.; Dunn, J.W.; Rokicki, T. Development of Renewable Energy Sources in the European Union in the Context of Sustainable Development Policy. Energies 2022, 15, 1545. [Google Scholar] [CrossRef]
- Kyoto Protocol to the United Nations Framework Convention on Climate Change (1998). Available online: https://unfccc.int/resource/docs/convkp/kpeng.pdf (accessed on 10 September 2022).
- Directive 2001/77/EC of the European Parliament and of the Council of 27 September 2001on the Promotion of Electricity Produced from Renewable Energy Sources in the Internal Electricity Market; Council of the European Union: Brussels, Belgium, 2001; Available online: https://eur-lex.europa.eu/legal-content/EN/TXT/PDF/?uri=CELEX:32001L0077&from=ES (accessed on 10 September 2022).
- Directive 2003/30/EC of the European Parliament and of the Council of 8 May 2003 on the promotion of the use of biofuels or other renewable fuels for transport. Off. J. Eur. Union 2003, L123, 42–46.
- Strielkowski, W.; Krška, Š.; Lisin, E. Energy Economics and Policy of Renewable Energy Sources in the European Union. Int. J. Energy Econ. Policy 2013, 3, 333–340. [Google Scholar]
- Tytka, R. Odnawialne źródła energii; OWG: Warsaw, Poland, 2009. (In Polish) [Google Scholar]
- Olczak, K. Polityka Unii Europejskiej w odniesieniu do odnawialnych źródeł energii—Ramy prawne. Stud. Prawno-Ekon. 2016, 101, 87–97. (In Polish) [Google Scholar]
- Green paper. In A European Strategy for Sustainable. Competitive and Secure Energy; Commission of the European Communities: Brussels, Belgium, 2006.
- Communication from the Commission to the Council and the European Parliament—Renewable Energy Road Map—Renewable Energies in the 21st Century: Building a More Sustainable Future. Commission Communication of 10 January 2007, COM(2006) 848 Final. Available online: https://eur-lex.europa.eu/legal-content/en/ALL/?uri=CELEX:52006DC0848 (accessed on 10 September 2022).
- Directive 2009/28/EC of 23 April 2009 on the Promotion of the Use of Energy from Renewable Sources and Amending and Subsequently Repealing Directives 2001/77/EC and 2003/30/EC; Council of the European Union: Brussels, Belgium, 2009; Available online: https://eur-lex.europa.eu/LexUriServ/LexUriServ.do?uri=OJ:L:2009:140:0016:0062:en:PDF (accessed on 12 September 2022).
- Wiśniewska, M.; Pusz, A.; Rogalski, D. Development of renewable energy sources (RES) in the European Union and Poland. Pol. J. Sustain. Dev. 2020, 24, 101–112. [Google Scholar] [CrossRef]
- Policy Framework for Climate and Energy (2020 to 2030). Communication from the Commission to the European Parliament, the Council, the European Economic and Social Committee and the Committee of the Regions of 22 January 2014. Available online: https://eur-lex.europa.eu/legal-content/EN/ALL/?uri=CELEX:52014DC0015 (accessed on 8 September 2022).
- Directive 2018/2001/EU of the European Parliament and of the Council of 11 December 2018 on the Promotion of the Use of Energy from Renewable Sources. Brussels, Belgium. 2018. Available online: https://eur-lex.europa.eu/legal-content/EN/TXT/?uri=uriserv:OJ.L_.2018.328.01.0082.01.ENG&toc=OJ:L:2018:328:TOC (accessed on 8 September 2022).
- Paris Agreement. 2015. Available online: https://unfccc.int/files/essential_background/convention/application/pdf/english_paris_agreement.pdf (accessed on 7 September 2022).
- UNESCO 21st Session of the Conference of the Parties to the United Nations Framework Convention on Climate Change (COP21/CMP11). Available online: https://en.unesco.org/events/21st-session-conference-parties-united-nations-framework-convention-climate-change-cop21cmp11 (accessed on 7 September 2022).
- Ryszawska, B. Zielona gospodarka—Teoretyczne podstawy koncepcji i pomiar jej wdrażania w Unii Europejskiej; Wroclaw University of Economics and Business: Wrocław, Poland, 2013. (In Polish) [Google Scholar]
- Miłek, D.; Nowak, P.; Latosińska, J. The Development of Renewable Energy Sources in the European Union in the Light of the European Green Deal. Energies 2022, 15, 5576. [Google Scholar] [CrossRef]
- Brodny, J.; Tutak, M. Analyzing Similarities between the European Union Countries in Terms of the Structure and Volume of Energy Production from Renewable Energy Sources. Energies 2020, 13, 913. [Google Scholar] [CrossRef]
- European Commission. Communication from the Commission. Europe 2020. A Strategy for Smart Sustainable and Inclusive Growth; European Commission: Brussels, Belgium, 2010. [Google Scholar]
- Stec, M.; Grzebyk, M. The implementation of the Strategy Europe 2020 objectives in European Union countries: The concept analysis and statistical evaluation. Qual. Quantity. Int. J. Methodol. 2018, 52, 119–133. [Google Scholar] [CrossRef]
- European Commission. Directorate-General for Communication. Towards a Sustainable Europe by 2030: Reflection Paper; European Commission: Bruxelles, Belgium, 2019; Available online: https://ec.europa.eu/info/sites/default/files/rp_sustainable_europe_30-01_en_web.pdf (accessed on 8 September 2022).
- Nowak, E. Metody Taksonomiczne w Klasyfikacji Obiektów Społeczno-Gospodarczych; PWE: Warsaw, Poland, 1990. (In Polish) [Google Scholar]
- Malina, A.; Zeliaś, A. O budowie taksonomicznej miary jakości życia. In Taksonomia; no. 4, SKiAD PTS: Wrocław, Polamd, 1997. (In Polish) [Google Scholar]
- Malina, A.; Zeliaś, A. On Building Taxonometric Measures on Living Conditions. Stat. Transit. 1998, 3, 523–544. [Google Scholar]
- Kukuła, K. Metoda Unitaryzacji Zerowanej; PWN: Warsaw, Poland, 2000. (In Polish) [Google Scholar]
- Stec, M. Dokładność Danych Statystycznych w Badaniach Zjawisk Złożonych. Wpływ na Wyniki Oceny Zrównoważonego Rozwoju Województw Polski; CeDeWu: Warsaw, Poland, 2021. (In Polish) [Google Scholar]
- Chomać-Pierzecka, E.; Kokiel, A.; Rogozińska-Mitrut, J.; Sobczak, A.; Soboń, D.; Stasiak, J. Hydropower in the Energy Market in Poland and the Baltic States in the Light of the Challenges of Sustainable Development-An Overview of the Current State and Development Potential. Energies 2022, 15, 7427. [Google Scholar] [CrossRef]
- Sowa, S. Renewable sources of energy as a factor influencing improvement in energy efficiency. Zesz. Aukowe Inst. Gospod. Surowcami Miner. Pol. Akad. Nauk. 2018, 105, 187–196. [Google Scholar] [CrossRef]
- Ślusarz, G.; Gołębiewska, B.; Cierpiał-Wolan, M.; Gołębiewski, J.; Twaróg, D.; Wójcik, S. Regional Diversification of Potential, Production and Efficiency of Use of Biogas and Biomass in Poland. Energies 2021, 14, 742. [Google Scholar] [CrossRef]
- Piwowar, A.; Dzikuć, M. Bioethanol Production in Poland in the Context of Sustainable Development-Current Status and Future Prospects. Energies 2022, 15, 2582. [Google Scholar] [CrossRef]
- Sobczak, A.; Chomać-Pierzecka, E.; Kokiel, A.; Różycka, M.; Stasiak, J.; Soboń, D. Economic Conditions of Using Biodegradable Waste for Biogas Production, Using the Example of Poland and Germany. Energies 2022, 15, 5239. [Google Scholar] [CrossRef]


Publisher’s Note: MDPI stays neutral with regard to jurisdictional claims in published maps and institutional affiliations. |
© 2022 by the authors. Licensee MDPI, Basel, Switzerland. This article is an open access article distributed under the terms and conditions of the Creative Commons Attribution (CC BY) license (https://creativecommons.org/licenses/by/4.0/).