Abstract
Functional materials, in the combination of lignocelluloses, known as natural fibers, with oxide materials, can result in cultivating functional properties such as flexibility, relativity good electrical conduction, good electrical charge storage capacity, and tunable electric permittivity. This study presents the morphological, dielectric, and impedance properties of lignocellulose–lead oxide (LC/PbO2) composite sheets electrodeposited with silver metallic nanoparticles for various time spans. The uncoated samples show a rather simple behavior where the impedance data fit well to the two-system model with different relaxation times. On the other side, the impedance spectra of the electrodeposited sample have varying features, which mainly depend upon the deposition thickness of the Ag particles. The common feature is the drift of conductive species, as seen from the straight-line behavior in the Nyquist plots, which were fitted using a Warburg element in the equivalent circuit model.
1. Introduction
Artificial dielectrics, a class of metamaterials, which are insulating materials but with a controllable dielectric constant, are an interesting avenue in modern materials research. A huge interest in these materials stems from their potential applications in negative capacitance field-effect transistors, novel capacitors, and high-power microwave filters, etc. [1,2,3]. The negative permittivity behavior is usually achieved by fabricating artificial periodic structures that are primarily used for electromagnetic metamaterials [4,5]. The properties of electromagnetic metamaterials depend on their periodic structures, which include size, shape, and orientation, rather than on their intrinsic composition and microstructure, as is the case with conventional metamaterials. The materials with semi-intrinsic and negative dielectric features, fabricated via universal and facile routes, have aroused tremendous interest in the materials science research community [6,7,8]. These negative permittivity are known as intrinsic metamaterials or meta-composites, which acquire their tunable properties by altering their composition and/or microstructure.
Much emphasis has been placed on the methods to develop a-composites, in which the negative permittivity can be modified by adjusting their ingredients rather than the microstructures [7]. It has become a custom to fabricate meta-composites with wonderful properties by mixing two or more ingredients with quire different properties from one another because meta-composites derive their properties from the newly designed structure not the properties from their base materials as a-composites do. Many investigators researched that carbon materials, such as carbon nanofibers, multiwalled carbon nanotubes, graphene oxide, reduced graphene oxide, and graphene nanosheets, are appropriate for achieving stable negative permittivity in the bulk materials because of their moderate charge carrier concentration [9,10,11,12,13]. For instance, Sun et al. [1] observed that nanocomposite thin films composed of polydimethylsiloxane/multiwalled carbon nanotubes had a negative permittivity with a dielectric resonance. Negative permittivity was obtained for the polyaniline nanocomposites incorporating different loadings of carbon nanostructures, which could easily be tailored by modifying the loading, morphology, and surface functionality of these carbon nanostructures [14,15].
The polymer-based meta-composites, having an added advantage of flexibility, offer an attractive alternative to ceramic-based ones. The flexibility of polymer-based meta-composites has great advantages in processing and applications, particularly in flexible electronic devices, wearable electronic gadgets, strain sensors, and energy harvesting devices [16,17,18,19]. On the other hand, silver (Ag) nanoparticles possess unique properties of high electrical conductivity and chemical stability under the normal environment [20]. The Ag nanoparticles, therefore, find widespread use when compared with carbon, metals, alloys, and ceramics [21,22,23,24,25,26,27] in applications such as biological sensors, flexible electronic devices, and solar cells [28,29,30,31]. However, Ag can also create a conductive network in the system to improve the overall electrical conductivity of nanocomposites. It has been reported that in an Ag/yttrium iron garnet composite, the dielectric loss is mainly caused by the conduction and polarization [30]. Moreover, in another report, a high-performance stretchable elastic conductor was achieved with an initial electrical conductivity of 6168 S.cm−1 by the incorporation of Ag nanoparticles [32,33]. However, composites with controllable permittivity features using lignocelluloses (LC) coated with Ag nanoparticles have not been reported yet. Therefore, in this paper, we report a study of flexible composites with controllable permittivity. The LC\PbO2\Ag nanocomposite paper sheets offer a unique combination for flexible, wearable, and stretchable devices due to their elasticity, biological compatibility, and convenient preparation.
2. Experimental Section
2.1. Synthesis of LC/PbO2 Composite Sheets
The detail of the synthesis of LC/PbO2 composite sheets is presented in our previously published paper [34]. All precursors were purchased from Unichem, Korea. The thickness of the composite sheets was around 1 mm and could be cut to any further dimension with the help of scissors.
2.2. Electrodeposition of Silver (Ag) on LC\PbO2 Sheet
To address the electrical properties of fabricated paper sheets, the direct electrochemical deposition of silver (Ag) was conducted on the LC\PbO2 sheet by using the chronoamperometry technique. The electrochemical deposition of silver on LC\PbO2 sheets was performed with potentiostat/galvanostat (ECO Chemie, The Netherland), and a simple chronoamperometry technique was used for all samples. The potentiostat deposition of silver was accomplished by using Ag/AgCl reference electrode immersed directly in the silver electrolyte. A platinum wire served as a counter electrode for all depositions. The distance of ~5 mm was maintained between two electrodes. By keeping deposition potential the same and modifying the deposition time the thickness of deposited nanoparticles can vary. The reduction potential of −0.95 V was maintained across the working electrode (LC\PbO2) and a reference electrode (Ag/AgCl2). This potential difference was kept constant for all samples while the deposition of Ag was conducted for different time intervals (i.e., 3000 s, 6000 s, and 9000 s). Dielectric and impedance behaviors were investigated by the precision impedance analyzer (Wayne Kerr) 6500 B series. Figure 1 displays the different electrode position curves of Ag metallic particles on LC\PbO2 sheets.
2.3. Characterizations
The surface morphology of synthesized paper sheets was characterized by using LEO Gemini 1550 field emission gun SEM from Zeiss. Dielectric and impedance measurements were analyzed by the precision impedance analyzer (Wayne Kerr 6500B series).
3. Results and Discussion
Figure 1 displays the electrode position current versus time (I-t) curves acquired during the deposition of Ag nanoparticles on an LC/PbO2 sheet. The first part of the I-t curve shows a sudden decrease in the reduction current followed by an increasing trend, and, finally, attaining the saturation current. The current saturation region (i.e., ~2000–9000 s) indicates the uniform deposition within the pores of the LC/PbO2 sheet that was later confirmed with SEM analysis as shown in Figure 2b. At the first step of the Ag deposition process (0–50 s), the current drops abruptly due to the presence of a double-layer charge between the working electrode (LC/PbO2) and the electrolyte. Later, at 300 s, the current increases promptly to a maximum value (i.e., −0.09 mA) and attains saturation. However, for 6000 s, an increase in the maximum reduction current (−0.15 mA) is observed as compared to 3000 and 9000 s that may be due to the porosity of the sheet (LC/PbO2). The decrease in the maximum reduction current might be due to an early stage nucleation process for 3000 and 9000 s.
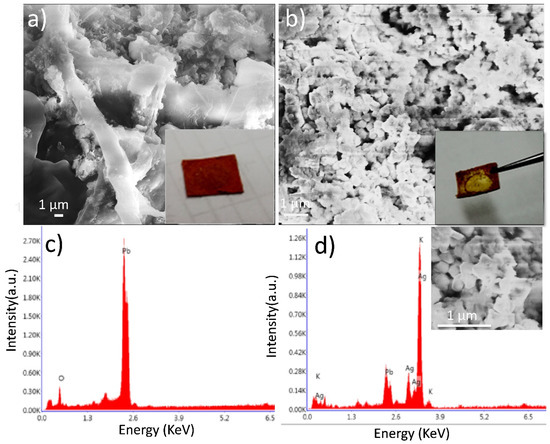
Figure 2.
(a) SEM image and (c) EDX analysis of LC/PbO2 paper sheet before electrodeposition, (b) SEM image, and (d) EDX analysis of LC/PbO2/Ag paper sheet after electrodeposition of silver metallic layer.

Figure 1.
Electrodeposition curves of LC\PbO2\Ag for 3000 s, LC\PbO2\Ag for 6000 s, and LC\PbO2\Ag for 9000 s.
Figure 1.
Electrodeposition curves of LC\PbO2\Ag for 3000 s, LC\PbO2\Ag for 6000 s, and LC\PbO2\Ag for 9000 s.

Scanning electron micrographs of LC/PbO2 composite paper sheets before and after the electrodeposition of Ag are presented in Figure 2a,b, respectively. Figure 2c,d reveal EDX spectra of barred and coated samples where a significant difference in the microstructure of the composite sheet with a different composition is observed. Figure 2a displays the morphology of LC/PbO2, where it can be observed that LC fibers bind the PbO2 particles to provide the flexible matrix for modern bendable technology. To enhance the electronically conductive properties of the LC/PbO2 binary composite, electrodeposition of Ag nanoparticles is employed. In Figure 2b, the distribution of Ag nanoparticles on the surface of LC\PbO2 fibers after electrodeposition can be seen. It can be concluded from Figure 2b that Ag particles of ~130 nm are embedded within the organic matrix of LC, thereby suggesting a good integration of inorganic Ag, PbO2, and organic LC constituents, whereas elemental analysis of LC/PbO2 and LC/PbO2 were measured by EDX. The spectrum shown in Figure 2c was recorded for LC/PbO2 and confirms the presence of Pb and O without any impurities. An EDX spectrum of LC/PbO2/Ag after electrodeposition is displayed in Figure 2d. It shows that the spectrum confirms the presence of Pb, O, and Ag as the main constituents involved in the synthesis of the LC/PbO2/Ag composite sheet.
Figure 3 shows the variation in the dielectric constant with the frequency of the applied electric field for LC\PbO2, LC\PbO2\Ag3000s, LC\PbO2\Ag6000s, and LC\PbO2\Ag9000s sheets. The LC\PbO2 sample has a very small permittivity, and it shows a little variation in the frequency range displayed. The low value of permittivity is attributed to a small number of polar species. The sample contains predominantly nonpolar LC fibers and some PbO2, which are mildly polar. Thus, the only contribution to polarization comes from PbO2. There is a slight decrease in permittivity at high frequencies. Among the Ag-coated samples, the sample coated with the least amount of Ag has the highest value of permittivity at low frequencies. This can be explained in terms of the space charge-type polarization (also known as Maxwell–Wagner–Sillars polarization).
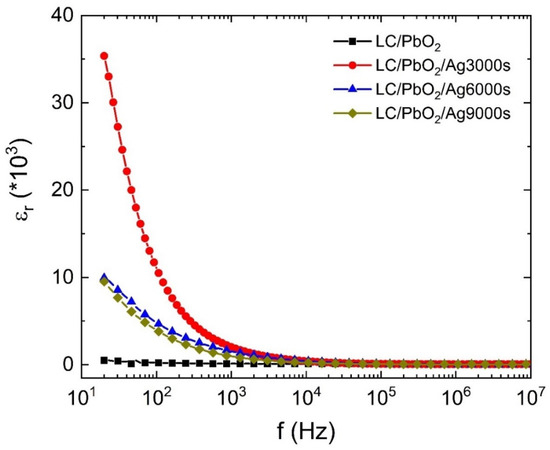
Figure 3.
The dielectric constant of LC\PbO2, LC\PbO2\Ag for 3000 s, LC\PbO2\Ag for 6000 s, and LC\PbO2\Ag for 9000 s.
The sample sheets have imperfect surfaces, containing a high number of voids, gaps, and places to store foreign particles. When Ag is coated on the surface, the metal particles enter these voids. The charge stored in these surface pockets creates charge in homogeneities, thereby giving rise to extrinsic polarization. This extrinsic polarization also responds to the external electric field, displaying a high value of electric permittivity at low frequencies. However, the response of the polarization slows down with an increase in frequency; therefore, there may remain the response of other species (if any). Thus, what we see at higher frequencies is the response of LC/PbO2. Moreover, it is interesting to note that at higher Ag depositions, the samples have a reduced permittivity as compared to that of the sample coated for 3000 s. The most obvious reason for this behavior is that initially for small times of depositions, the metal just enters pores and voids on the surface. With all pores filled initially (for smaller times of deposition), the metal then forms uniform surfaces of itself on top of the pores and holes, therefore removing some of the charge-storing pockets. Thus, for higher deposition times, the sample surface behaves mostly as a metal, just as the electrode metal does, with a smaller number of extrinsic charges responding to the field.
Figure 4 represents the loss tangent as a function of frequency for all samples. The value of the tangent loss is quite small for LC/PbO2 throughout the frequency range. For the Ag-coated samples, the value of the loss tangent is also constant and comparable to that of the LC/PbO2 sample. However, at certain higher frequencies, it goes through a peak-like behavior, then decreases fast and becomes negative. It shows a negative peak at higher frequencies, with a sharp increase then taking it back to the same constant small value. We call this a resonance-like behavior similar to what is observed in the resonating inductor–capacitor (LC) circuit due to an AC voltage. All Ag-coated samples display this behavior; however, the frequency range in which they show this resonance-like behavior is markedly different. The frequency for resonance-like behavior for the LC\PbO2\Ag3000 sample is close to Log f ~7 MHz, while for the LC\PbO2\Ag6000 and LC\PbO2\Ag9000 samples, it is close to Logf~6 MHz and ~5.4 MHz, respectively. Thus, with the increase in coating time/thickness, the resonance-like feature shifts to the lower frequencies. Therefore, we can say that we can control the resonance frequency by controlling the amount of electrodeposited Ag. In the next paragraph, we discuss the possible physics behind the resonance-like behavior in more detail.
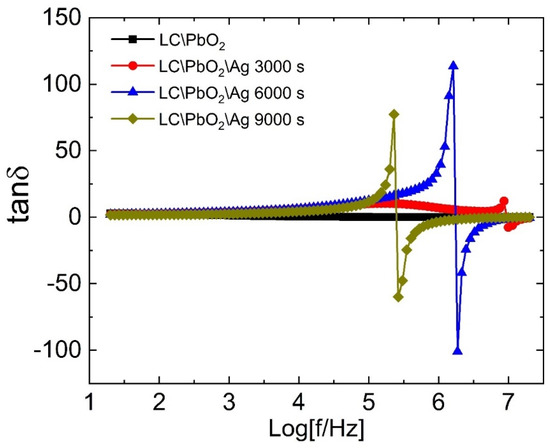
Figure 4.
The dielectric loss tangent of LC\PbO2, LC\PbO2\Ag3000s, LC\PbO2\Ag6000s, and LC\PbO2\Ag9000s samples.
The dielectric loss tangent quantifies the amount of heat energy being dissipated to align the electric dipoles in the direction of the electric field. Any positive peak in the loss at a certain frequency indicates the highest amount of energy being dissipated/absorbed. The dissipation/absorption of energy can be related to the relaxation behavior of charges. Thus, we can say that in a certain small frequency range, the charges require the largest amount of energy to align and go back to their equilibrium/unperturbed state as soon as the field frequency is removed. The inverse of this frequency gives the characteristic time required by the relaxation species, after the removal of the electric field, to go back to their original configuration. As already mentioned in the discussion related to the dielectric constant, dipolar relaxation species, as well as free ions encaged in the pores, act cooperatively. This cooperative behavior provides a basis for the relaxation process in these materials. Now, what about the negative loss peak? Where does it stem from? The negative loss peak lies next to a positive peak in the frequency spectrum. As we take the positive peak as the absorption of energy, the negative peak can be treated as the emission of energy. Thus, in these materials, they absorb energy at certain frequencies and re-emit the same energy at certain other higher frequencies. The absorption of energy is related to the capacitive effect, while the emission is inductive. Thus we can say that the samples show both capacitors as well as the inductive characters simultaneously. One may ask the question, by which mechanism is the energy stored such that it can be re-emitted at certain other frequencies?
As discussed above, there exists a charge separation due to the accumulation of free charges at the pores, and at the grain boundaries due to an imbalance of charge densities. In our case, the Ag is the charged species accumulating at the locations described above. An alternating electric field causes the charge separation to extend gradually at certain frequencies. However, this charge separation is meta-stable and can be removed by the change in frequency. When this happens, it affects the surface structures the most. Under these conditions, the surface cavities/pores, holding the charges, are shattered and the charges are drawn out of these, thereby giving rise to avalanche-type behavior. Thus, the charge separation collapses, and inductive behavior dominates due to the flow of charges. The resonance-like behavior was also observed previously in a broad range of samples [35,36,37,38,39,40,41].
In the following section, relaxation mechanisms are discussed in more detail by employing the electric impedance and related data analysis. Real and imaginary parts of the electric impedance are plotted on so-called Nyquist plots for all samples in Figure 5a–d. To differentiate between various relaxations mechanisms, the experimental data of all samples were fitted to various equivalent circuits. Each equivalent circuit is subdivided into simple elements and their combinations, thereby enabling us to decipher which polar/nonpolar species are causing this dielectric/impedance behavior. Let us analyze these one by one.
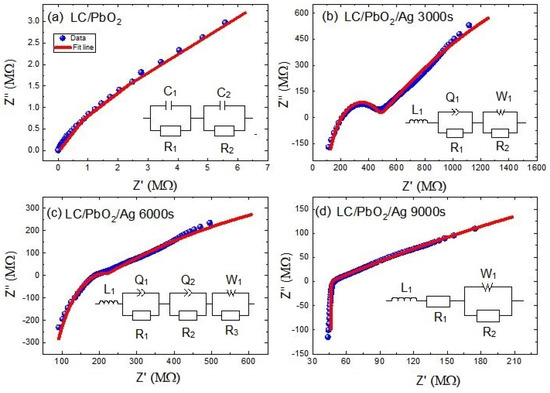
Figure 5.
Impedance Nyquist plots of (a) LC\PbO2 sheet, (b) LC\PbO2\Ag for 3000 s, (c) LC\PbO2\Ag for 6000 s, (d) LC\PbO2\Ag for 9000 s. The symbols show the experimental data and the solid lines represent the fitted curves according to the circuit shown in the insets.
The Nyquist plot for the LC\PbO2 sheet shows a single semicircular arc, and it was fitted to a series combination of two parallelly connected RC circuits. The equivalent circuit is shown on the inset of Figure 5a and is given theoretically by Equation (1)
Two parallel circuits signify two relaxation species, with slightly different (and overlapping) relaxation times. In normal circumstances, two different relaxations are two distinct semicircles; however, due to their closeness in our case, they cannot be resolved by the naked eye. These two relaxation entities can be the grain and grain boundaries. Moreover, we can also say that these can be relaxations due to the bound charge of PbO2 and the dipoles due to the free charges residing at the grain boundaries. The various fitting parameters are given in Table 1. This larger RC product represents the low mobility of charge carriers across the boundary of that component and relaxes up at low frequencies. In our case , which represents the larger time constant of grain boundaries than grains of composite material.

Table 1.
Best-fitting parameters for sample LC/PbO2 sheet according to the circuit shown in Figure 5a.
The Nyquist plot of LC/PbO2/3000s shows two semicircular arcs: a large one at low frequencies and a small one at higher frequencies. Moreover, a peculiar feature is the smaller arc subtending to negative values at higher frequencies. The theoretical modeling of the plot is accomplished by an equivalent electrical circuit, which consists of an inductor connected in series to two parallel circuits. Equation (2) is the corresponding mathematical form of the circuit. One parallel circuit consists of a constant phase element (CPE) and a resistor, while the other one consists of a Warburg element (W) and a resistor. The inductor accounts for the negative arc at high frequencies, and the parallel circuit with CPE represents the smaller arc at high frequencies, while the parallel circuit containing the Warburg element represents the straight-line-like behavior at lower frequencies. The high-frequency, inductor-like behavior is already displayed in the dielectric loss and was explained accordingly. The middle frequency relaxation behavior is modeled with a leaky capacitor (CPE) and a parallel resistor. At low frequencies, the Warburg element represents the diffusion behavior of charges. A general rule for these scenarios is that whenever there is a straight line in the Nyquist plot with an inclination of 45° with the x-axis, it represents diffusion. The Warburg element is a manifestation of Fick’s law of diffusion [41]. In our case, the graph line is a little bent toward the resistance line, which is due to the parallel combination of resistance and Warburg as shown in the fitted circuit [41]. Since the Ag is deposited on the surface, some portion of it goes through the samples due to voids and pores in the sample. This adjustment of the Ag inside the sample gives rise to conductive paths. Fick’s first law states that the overall density of ion flow in the system is the sum of ion diffusion and ion conductivity. Conductive paths through the polymer sheets are not fully developed at lower coating times. Thus, the only way for ion transport is diffusion, which occurs due to the chemical potential differences along the path. Therefore, at low frequencies, the charges may diffuse into the pores and voids in the direction of the applied field, a behavior similar to DC current flow. The modelled parameters for this sample are given in Table 2.
Table 2.
Best-fitting parameters for sample LC/PbO2/Ag3000s according to the circuit shown in Figure 5b.
The Nyquist plot of the LC/PbO2/6000s sample is somewhat similar to that of the LC/PbO2/3000s sample. However, the smaller semicircular arc is somewhat flattened out with just a kink replacing it. Thus, its modeling was also different from the previous one. The theoretical model this time consists of four parts: one inductor and three parallel circuits. Equation (3) is the corresponding mathematical form of the circuit. The relaxation is modeled with the help of two parallel QR circuits, while the low-frequency Warburg circuit and the high-frequency inductor remain as before. The inclusion of two QR circuits signifies two relaxation species, with slightly different time constants. These species can again be described by the grain and grain boundaries in the core of the material due to PbO2 grains. The rest of the analysis remains the same as for the previous sample. The parameters obtained from the fitting are given in Table 3.
Table 3.
Best-fitting parameters for sample LC/PbO2/Ag6000s according to the circuit shown in Figure 5c.
The last and the fourth Nyquist plot (for the LC/PbO2/9000s sample) is quite different from all previous plots. It consists of two straight lines joining one another at an angle slightly greater than 90 degrees. The straight line at high frequency is again to the negative side, and therefore represents an inductor. The other straight line is certainly for the diffusion process. The equivalent circuit model for this plot is a series combination of an inductor, a resistor, and a parallel circuit of a Warburg element and resistor. Equation (4) is the corresponding mathematical form of the circuit. The most plausible reason for this kind of Nyquist plot can be related to the large amount of deposited Ag. For this much time of deposition, Ag fills all the pores/holes on the surfaces of the sample; therefore, the effect of the diffusing species is so large that the effect of the relaxation species inside the bulk of the material is overshadowed. Thus, we witness only the Warburg-like diffusion and induction in the impedance plots. Table 4 depicts the parameters obtained from the fitting.
Table 4.
Best-fitting parameters for sample LC/PbO2/Ag9000s according to the circuit shown in Figure 5d.
4. Conclusions
LC/PbO2 composites were prepared followed by coating with Ag nanoparticles for different time intervals ranging from 3000–9000 s. It can be concluded from SEM results that Ag particles of ~130 nm are embedded within the organic matrix of LC/PbO2, thereby suggesting a good integration of inorganic Ag, PbO2, and organic LC constituents, whereas elemental analyses of LC/PbO2 and LC/PbO2 were measured by EDX. Electrical characterizations of these samples were accomplished employing dielectric and impedance spectroscopy techniques in the frequency range of 20 Hz to 20 MHz. It can be observed that the dielectric loss tangent showed an LC resonance-like feature along with negative peak values in the higher frequency range. The resonance-like feature is coating time-dependent and its position moved toward lower frequencies when increasing the coating time of Ag. Thus, coating time serves as a control feature of metamaterials. Moreover, various relaxation mechanisms have been traced with the help of impedance spectroscopy and its data analysis. The most prominent features in all coated samples include the inductor response as well as the Warburg element, which represents the diffusion of the charged species as a result of Fick’s first law of diffusion.
Author Contributions
Conceptualization, E.-C.C.; Data curation, S.H.M.J. and N.-U.H.; Formal analysis, S.Q.H., Z.U., S.H.M.J. and A.R. (Aamir Razaq); Funding acquisition, Y.K., E.-C.C. and J.Y.; Investigation, Y.K.; Methodology, I.S. and Z.U.; Resources, A.B. and J.Y.; Software, N.-U.H.; Supervision, I.S. and A.R. (Aamir Razaq); Writing—original draft, A.R. (Ali Raza); Writing—review & editing, A.B., S.Q.H., S.A., J.Y. and A.R. (Aamir Razaq). All authors have read and agreed to the published version of the manuscript.
Funding
This research was funded by [Korean Ministry of Trade, Industry and Energy (MOTIE)] grant number [20214000000640] and the APC was funded by [Eun chel Cho, Junsin Yi].
Data Availability Statement
All data has been included in the manuscript.
Acknowledgments
The financial support from the Higher Education Commission Pakistan, NRPU grant number: 5334/Federal/NRPU/R&D/HEC/2016, is gratefully acknowledged. This research was supported by the New & Renewable Energy Technology Development Program of the Korea Institute of Energy Technology Evaluation and Planning (KETEP) grant funded by the Korean Ministry of Trade, Industry and Energy (MOTIE) (20214000000640).
Conflicts of Interest
The authors declare no conflict of interest.
References
- Sun, K.; Dong, J.; Wang, Z.; Wang, Z.; Fan, G.; Hou, Q.; An, L.; Dong, M.; Fan, R.; Guo, Z. Tunable Negative Permittivity in Flexible Graphene/PDMS Metacomposites. J. Phys. Chem. C 2019, 123, 23635–23642. [Google Scholar] [CrossRef]
- Shi, Z.; Wang, J.; Mao, F.; Yang, C.; Zhang, C.; Fan, R. Significantly Improved Dielectric Performances of Sandwich-Structured Polymer Composites Induced by Alternating Positive-: K and Negative- k Layers. J. Mater. Chem. A 2017, 5, 14575–14582. [Google Scholar] [CrossRef]
- Liu, C.H.; Behdad, N. High-Power Microwave Filters and Frequency Selective Surfaces Exploiting Electromagnetic Wave Tunneling through ε-Negative Layers. J. Appl. Phys. 2013, 113, 064909. [Google Scholar] [CrossRef]
- Shalaev, V.M. Optical Negative-Index Metamaterials. Nat. Photonics 2007, 1, 41–48. [Google Scholar] [CrossRef]
- Schurig, D.; Mock, J.J.; Smith, D.R. Electric-Field-Coupled Resonators for Negative Permittivity Metamaterials. Appl. Phys. Lett. 2006, 88, 041109. [Google Scholar] [CrossRef]
- Zhao, B.; Park, C.B. Tunable Electromagnetic Shielding Properties of Conductive Poly(Vinylidene Fluoride)/Ni Chain Composite Films with Negative Permittivity. J. Mater. Chem. C 2017, 5, 6954–6961. [Google Scholar] [CrossRef]
- Xie, P.; Wang, Z.; Zhang, Z.; Fan, R.; Cheng, C.; Liu, H.; Liu, Y.; Li, T.; Yan, C.; Wang, N.; et al. Silica Microsphere Templated Self-Assembly of a Three-Dimensional Carbon Network with Stable Radio-Frequency Negative Permittivity and Low Dielectric Loss. J. Mater. Chem. C 2018, 6, 5239–5249. [Google Scholar] [CrossRef]
- Huang, X.; Yin, R.; Qian, L.; Zhao, W.; Liu, H.; Liu, C.; Fan, J.; Hou, H.; Zhang, J.; Guo, Z. Processing Conditions Dependent Tunable Negative Permittivity in Reduced Graphene Oxide-Alumina Nanocomposites. Ceram. Int. 2019, 45, 17784–17792. [Google Scholar] [CrossRef]
- Zhang, L.L.; Zhao, X.S. Carbon-Based Materials as Supercapacitor Electrodes. Chem. Soc. Rev. 2009, 38, 2520–2531. [Google Scholar] [CrossRef]
- Hong, X.; Yu, W.; Chung, D.D.L. Electric Permittivity of Reduced Graphite Oxide. Carbon N. Y. 2017, 111, 182–190. [Google Scholar] [CrossRef]
- Wu, H.; Zhang, Y.; Yin, R.; Zhao, W.; Li, X.; Qian, L. Magnetic Negative Permittivity with Dielectric Resonance in Random Fe3O4@graphene-Phenolic Resin Composites. Adv. Compos. Hybrid Mater. 2018, 1, 168–176. [Google Scholar] [CrossRef]
- Gu, H.; Zhang, H.; Ma, C.; Xu, X.; Wang, Y.; Wang, Z.; Wei, R.; Liu, H.; Liu, C.; Shao, Q.; et al. Trace Electrosprayed Nanopolystyrene Facilitated Dispersion of Multiwalled Carbon Nanotubes: Simultaneously Strengthening and Toughening Epoxy. Carbon N. Y. 2019, 142, 131–140. [Google Scholar] [CrossRef]
- Zhang, X.; Yan, X.; He, Q.; Wei, H.; Long, J.; Guo, J.; Gu, H.; Yu, J.; Liu, J.; Ding, D.; et al. Electrically Conductive Polypropylene Nanocomposites with Negative Permittivity at Low Carbon Nanotube Loading Levels. ACS Appl. Mater. Interfaces 2015, 7, 6125–6138. [Google Scholar] [CrossRef] [PubMed]
- Abbas, Q.; Ilyas, S.; Saleem, M.; Alvi, F.; Din, R.U.; Shahzad, M.; Sultana, I.; Razaq, A. Fabrication and characterization of metal oxide and lignocelluloses fibers based working electrode for dye-sensitized solar cells (DSSCs). Mater. Res. Express 2020, 6, 126336. [Google Scholar] [CrossRef]
- Zhu, J.; Gu, H.; Luo, Z.; Haldolaarachige, N.; Young, D.P.; Wei, S.; Guo, Z. Carbon Nanostructure-Derived Polyaniline Metacomposites: Electrical, Dielectric, and Giant Magnetoresistive Properties. Langmuir 2012, 28, 10246–10255. [Google Scholar] [CrossRef]
- Zhang, C.; Shi, Z.; Mao, F.; Yang, C.; Zhu, X.; Yang, J.; Zuo, H.; Fan, R. Flexible Polyimide Nanocomposites with Dc Bias Induced Excellent Dielectric Tunability and Unique Nonpercolative Negative- k toward Intrinsic Metamaterials. ACS Appl. Mater. Interfaces 2018, 10, 26713–26722. [Google Scholar] [CrossRef]
- Razaq, A.; Bibi, F.; Zheng, X.; Papadakis, R.; Jafri, S.H.M.; Li, H. Review on graphene-, graphene oxide-, reduced graphene oxide-based flexible composites: From fabrication to applications. Materials 2022, 15, 1012. [Google Scholar] [CrossRef]
- Zhu, J.; Wei, S.; Ryu, J.; Guo, Z. Strain-Sensing Elastomer/Carbon Nanofiber Metacomposites. J. Phys. Chem. C 2011, 115, 13215–13222. [Google Scholar] [CrossRef]
- Yang, S.; Liu, P.; Yang, M.; Wang, Q.; Song, J.; Dong, L. From Flexible and Stretchable Meta-Atom to Metamaterial: A Wearable Microwave Meta-Skin with Tunable Frequency Selective and Cloaking Effects. Sci. Rep. 2016, 6, 21921. [Google Scholar] [CrossRef]
- Sultana, I.; Masood, A.; Shoukat, Z.; Hussain, S.Q.; Mustafa, G.M.; Atiq, S.; Razaq, A. Electrodeposition of multilayers Ag-Ni-Ag on graphite based paper electrodes. Ceram. Int. 2018, 44, 23180–23184. [Google Scholar] [CrossRef]
- Zhao, Y.; Zhang, B.; Hou, H.; Chen, W.; Wang, M. Phase-Field Simulation for the Evolution of Solid/Liquid Interface Front in Directional Solidification Process. J. Mater. Sci. Technol. 2019, 35, 1044–1052. [Google Scholar] [CrossRef]
- Sheng, Y.; Yang, J.; Wang, F.; Liu, L.; Liu, H.; Yan, C.; Guo, Z. Sol-Gel Synthesized Hexagonal Boron Nitride/Titania Nanocomposites with Enhanced Photocatalytic Activity. Appl. Surf. Sci. 2019, 465, 154–163. [Google Scholar] [CrossRef]
- Jiang, D.; Murugadoss, V.; Wang, Y.; Lin, J.; Ding, T.; Wang, Z.; Shao, Q.; Wang, C.; Liu, H.; Lu, N.; et al. Electromagnetic Interference Shielding Polymers and Nanocomposites—A Review. Polym. Rev. 2019, 59, 280–337. [Google Scholar] [CrossRef]
- Zhao, Y.; Qi, L.; Jin, Y.; Wang, K.; Tian, J.; Han, P. The Structural, Elastic, Electronic Properties and Debye Temperature of D022-Ni3V under Pressure from First-Principles. J. Alloys Compd. 2015, 647, 1104–1110. [Google Scholar] [CrossRef]
- Zhao, Z.; Bai, P.; Li, L.; Li, J.; Wu, L.; Huo, P.; Tan, L. The Reaction Thermodynamics during Plating Al on Graphene Process. Materials 2019, 12, 330. [Google Scholar] [CrossRef] [PubMed]
- Raza, M.W.; Kiran, S.; Razaq, A.; Iqbal, M.F.; Hassan, A.; Hussain, S.; Ashiq, M.N.; Meng, Z. Strategy to enhance the electrochemical characteristics of lanthanum sulfide nanorods for supercapacitor applications. J. Nanoparticle Res. 2021, 23, 207. [Google Scholar] [CrossRef]
- Hosenuzzaman, M.; Rahim, N.A.; Selvaraj, J.; Hasanuzzaman, M.; Malek, A.B.M.A.; Nahar, A. Global Prospects, Progress, Policies, and Environmental Impact of Solar Photovoltaic Power Generation. Renew. Sustain. Energy Rev. 2015, 41, 284–297. [Google Scholar] [CrossRef]
- Jia, C.; Shang, J.; Wang, Y.; Bai, L.; Tong, C.; Chen, Y.; Zhang, P. Copper(II)-Mediated Sliver Nanoclusters as a Fluorescent Platform for Highly Sensitive Detection of Alendronate Sodium. Sens. Actuators B Chem. 2018, 269, 271–277. [Google Scholar] [CrossRef]
- Su, M.; Li, F.; Chen, S.; Huang, Z.; Qin, M.; Li, W.; Zhang, X.; Song, Y. Nanoparticle Based Curve Arrays for Multirecognition Flexible Electronics. Adv. Mater. 2016, 28, 1369–1374. [Google Scholar] [CrossRef]
- Sun, K.; Fan, R.; Yin, Y.; Guo, J.; Li, X.; Lei, Y.; An, L.; Cheng, C.; Guo, Z. Tunable Negative Permittivity with Fano-like Resonance and Magnetic Property in Percolative Silver/Yittrium Iron Garnet Nanocomposites. J. Phys. Chem. C 2017, 121, 7564–7571. [Google Scholar] [CrossRef]
- Matsuhisa, N.; Inoue, D.; Zalar, P.; Jin, H.; Matsuba, Y.; Itoh, A.; Yokota, T.; Hashizume, D.; Someya, T. Printable Elastic Conductors by in Situ Formation of Silver Nanoparticles from Silver Flakes. Nat. Mater. 2017, 16, 834–840. [Google Scholar] [CrossRef] [PubMed]
- MMasood, A.; Shoukat, Z.; Rehman, A.R.; Shahid, Z.; Chadury, A.; Mahmood, A.; Ramay, S.; Razaq, A. Nickel hydroxide and lignocelluloses fibers based flexible paper electrodes for energy storage applications. J. Mater. Sci. Mater. Electron. 2019, 30, 14772–14780. [Google Scholar] [CrossRef]
- Raza, A.; Faizan, M.; Sultana, I.; Mustafa, G.M.; Atiq, S.; Bashir, A.; Naveed-Ul-Haq, M.; Razaq, A. Morphology and Dielectric Studies of Natural Fibers and PbO2 Based Flexible Composite Sheets for Potential Energy Storage Applications. J. Electron. Mater. 2020, 49, 1896–1903. [Google Scholar] [CrossRef]
- Axelrod, E.; Puzenko, A.; Haruvy, Y.; Reisfeld, R.; Feldman, Y. Negative Dielectric Loss Phenomenon in Porous Sol-Gel Glasses. J. Non. Cryst. Solids 2006, 352, 4166–4173. [Google Scholar] [CrossRef]
- Bartkowska, J.A.; Bochenek, D. Microstructure and Dielectric Properties of BF–PFN Ceramics with Negative Dielectric Loss. J. Mater. Sci. Mater. Electron. 2018, 29, 17262–17268. [Google Scholar] [CrossRef]
- Yücedaǧ, I.; Kaya, A.; Altindal, S. On the Frequency Dependent Negative Dielectric Constant Behavior in Al/Co-Doped (PVC + TCNQ)/p-Si Structures. Int. J. Mod. Phys. B 2014, 28, 1450153. [Google Scholar] [CrossRef]
- Bartkowska, J.A.; Bochenek, D.; Niemiec, P. Multiferroic Aurivillius-Type Bi6Fe2−xMnxTi3O18 (0 ≤ x ≤ 1.5) Ceramics with Negative Dielectric Constant. Appl. Phys. A Mater. Sci. Process. 2018, 124, 823. [Google Scholar] [CrossRef]
- Liu, Y.; Qu, Y.; Xin, J.; Wang, Z.; Fan, G.; Xie, P.; Sun, K. Weakly Radio-Frequency Negative Permittivity of Poly(Vinylidene Fluoride)/Ti3SiC2 MAX Phase Metacomposites. J. Inorg. Organomet. Polym. Mater. 2019, 29, 248–257. [Google Scholar] [CrossRef]
- Gavrilova, N.D.; Novik, V.K.; Vorobyev, A.V.; Malyshkina, I.A. Negative Dielectric Permittivity of Poly(Acrylic Acid) Pressed Pellets. J. Non. Cryst. Solids 2016, 452, 1–8. [Google Scholar] [CrossRef]
- Kumar, N.S.; Suvarna, R.P.; Naidu, K.C.B. Negative Dielectric Behavior in Tetragonal La0.8Co0.2−xEuxTiO3 (x = 0.01–0.04) Nanorods. Mater. Charact. 2020, 166, 110425. [Google Scholar] [CrossRef]
- Skale, S.; Doleček, V.; Slemnik, M. Substitution of the Constant Phase Element by Warburg Impedance for Protective Coatings. Corros. Sci. 2007, 49, 1045–1055. [Google Scholar] [CrossRef]


Publisher’s Note: MDPI stays neutral with regard to jurisdictional claims in published maps and institutional affiliations. |
© 2022 by the authors. Licensee MDPI, Basel, Switzerland. This article is an open access article distributed under the terms and conditions of the Creative Commons Attribution (CC BY) license (https://creativecommons.org/licenses/by/4.0/).