Abstract
Current and voltage instrument transformers are essential elements of the power system. They work like transformers but do not transmit power. Their task is to accurately transform currents or voltages during system operation, which are then used for measurement and protection. These devices are very precise, and their accuracy is defined by the IEC/CEN standards. Instrument transformers are located at all transformer stations, specialized high-voltage and high-power laboratories, and testing and teaching laboratories. Therefore, the design requirements are very different depending on their type (current, voltage, or combined), function (measuring, protection), and operating voltage (high, medium, and low). The requirements concern not only the operation but also the strength of the insulation system and, sometimes, the mechanical strength.
1. Introduction
This article aims to reach designers of various instrument transformers and show them the possibilities offered by numerical field methods. Using these methods to support the design process enables an accurate estimation of the device’s properties during operation. It thus saves time and money on the construction and testing of subsequent prototypes.
The beginning of the development of the power system is also the beginning of the production and use of inductive instrument transformers. The first primitive instrument transformers appeared about 100 years ago. In 1899, Siemens patented the first current instrument transformer. Initially, the electrical measurements and the instrument transformers were not given due attention. The accuracy problems, magnetic circuits, insulation, and transients were not interesting. The first scientific articles on instrument transformers appeared only after 1906.
As the transmitted power and voltage of transmission lines increased, instrument transformers became an essential element of the measurement system, and their accuracy requirements began to increase. The development of the structure depends primarily on the progress in materials and technology, and therefore only at the end of the 1950s did electromagnetic processes in instrument transformers become of interest. The decisive moment for the development of instrument transformers was the invention of cold-rolled silicon sheets, which allowed higher transformation accuracy and reduced device dimensions. Today, even better results can be achieved with permalloy or nanocrystalline sheets.
In the past, instrument transformers design used methods developed for the design of power transformers, ranging from the classic works of Rogowski to the works of Roth, Rabins, and Jezierski [1].
These methods used to a limited extent the field description of phenomena in instrument transformers. Different requirements for instrument transformers than for power transformers and numerous experimental experiences resulted in several works of authors. However, most authors used analytical and experimental methods using the equivalent circuit (Figure 1) of the instrument transformer, which quickly and easily gives results in the form of errors in the designed instrument transformer but requires the correct calculation of the parameters of the equivalent circuit.

Figure 1.
Equivalent circuits of (a) current and (b) voltage transformers, where I1, I2 are the complex primary and secondary current, I0 is the complex no-load current, IFe, Iμ are the complex no-load current components, U1, U2 are the complex primary and secondary voltage, respectively, R1, R2 are the primary and secondary winding resistances, respectively, X1r, X2r are the windings leakage reactances, RFe represents core loss, and Xμ is the magnetizing reactance.
The analytical methods and empirical formulas used to calculate the parameters give approximate results, sometimes even different from the actual state, and are a source of errors in design calculations. As a result, a certain number of prototypes must be made, which must be rejected after testing, which is costly and labor-intensive.
Designs other than inductive instrument transformers [2] have also appeared, such as electronic devices using low signals from the Rogowski coil, optoelectronic instrument transformers based on Faraday’s law and the Pockels effect using optical fibers, and instrument transformers using microwaves and the so-called Bluetooth technology. However, these solutions are not widely used so far because they are not as accurate and reliable as inductive instrument transformers.
Problems with designing increasingly accurate inductive instrument transformers continue to exist. Engineers continue to work to improve both the instrument transformer design and design methods. Although the principle of operation of the instrument transformers is the same as that of power transformers, the tasks of the instrument transformers, and thus the problems faced by designers during the design, are entirely different.
The requirements for instrument transformers relate to the transformation of currents or voltages with high accuracy and are different for measuring and protection instrument transformers. The concentration of construction and calculation problems, also encountered in the design of other converters and electrical devices, in the case of instrument transformers (especially high-current and high-voltage), is intensified by their metering and protection activities.
Accurate transformation of currents or voltages during system operation is necessary for accurate measurements and proper operation of protection devices. The accuracy of the instrument transformers is defined by standards [3,4,5,6,7,8].
The measuring instrument transformers are part of the measuring system and enable the measurement of system operating parameters, including energy flow measurement. Hence, they decide about financial settlements between electricity consumers. The current ratio of the current transformers and the voltage ratio of the voltage transformers should ensure the safety of the personnel and measuring devices. Regardless of the current transformer’s primary current, the secondary current should usually be 5 A or sometimes 1 A. Similarly, the secondary voltage ratio should always be 100 V for voltage ones. The accuracy class of the measuring instrument transformers is determined by the characteristics of current or voltage errors and phase displacement (permissible values are given in IEC/EN standards).
The IEC/EN standards [3,4,5,6] define transformation errors as current or voltage errors:
and phase displacements:
where Ip, Is and Up, Us are the RMS values of the primary and secondary current and voltages, respectively, and are the phase displacement of these currents and voltages, respectively, and Kn is the CT or VT ratio.
The standard requires that for individual accuracy classes of current transformers, the transformation errors should not exceed the values given in the (Table 1 and Table 2) at different currents corresponding to percentages of the rated current. For S-classes, the requirements also apply to tests at 1% of the rated current.

Table 1.
Standard classes of measurement current transformers according to IEC/EN 61869-2.

Table 2.
Standard classes of measurement voltage transformers according to IEC/EN 61869-3.
During the accuracy tests of measuring voltage transformers, the primary voltage is 80% Upn, and the protection voltage is 5% of the rated voltage (1) and (2).
Measurement instrument transformers are precision devices; the current or voltage error (1) at the rated value should be less than a few parts of a percent after the decimal point, and the phase displacement (2) is measured in minutes (a 10 min error equals 0.17 degrees).
The protection instrument transformers are of two types: P (Protective) for steady-state overcurrent protection and TP (Transient Protection) for transient protection during a transmission line fault when the primary current has an exponential component.
The class of instrument transformers of the first type is determined by the maximum value of the total error for a given rated load of the instrument transformer at the overcurrent corresponding to the set primary current, with the RMS value being a multiple of the rated current IpALF = ALF·Ipn, where ALF stands for the accuracy limit factor.
Accuracy limit factor (ALF):
TPX, TPY, and TPZ are current transformers for transient protection during a transmission line fault, but their construction is different. TPX and TPY have oversized large, heavy cores, whereas TPZ (the most commonly used) has cores linearized by cut air gaps. The requirements must also be different.
The estimation of the instantaneous error current waveform is made based on the participation of the non-periodic component in the course of the primary short-circuit current [9]:
where: —the equivalent time constant of the primary circuit; Θ—the phase angle at which the short-circuit occurred in the primary circuit
The instantaneous error current iε is the difference between the instantaneous values of the secondary current is multiplied by the rated turn ratio Kn and the primary current ip:
The class of current transformers of the first type, TP, is determined by the instantaneous peak error , but for TPY, the remanent flux cannot exceed 10% of the saturation flux. The instantaneous peak error
where Ipsc is the rated primary short-circuit current, i.e., the RMS value of the primary symmetrical short-circuit current on which the rated accuracy performance of current transformer is based.
For TPZ, the remanent flux is practically negligible, and the accuracy is determined by the instantaneous peak error of the AC component of the current :
where —the amplitude of the alternating component of the error current.
The following parts of this article are structured as follows.
Section 2 presents the numerical model of instrument transformers, i.e., gives the field equations resulting from Maxwell equations corresponding to various design problems.
Section 3 presents the problems successively in instrument transformer design that require an exact solution. Calculated based on approximate analytical models, they do not consider most of the physical phenomena accounted for in three-dimensional field-circuit calculations. The simulation results are compared with the results of analytical formulas and experimental tests on real models. The following problems are considered: 1. Windings leakage reactance; 2. direct determination of the characteristics of amplitude errors and phase displacement; 3. operation of current transformers in transient states; 4. linearized current transformers cores by using air gaps; 5. operation of instrument transformers at distorted supply voltages; 6. the peak voltage value with an open secondary of the current transformer; 7. cores consisting of different magnetic materials; 8. shaping the insulation system of high- and medium-voltage transformers.
The practical conclusions of the research are presented in Section 4.
2. Numerical Model of Instrument Transformers
The numerical analysis was performed using the 3D field-circuit method by combining Maxwell’s equations in the physical area of the instrument transformer with the equation for the circuit with the load connected to the secondary terminals of the instrument transformer [10,11,12,13,14,15,16,17,18,19,20,21,22,23,24,25,26,27,28,29,30].
- The electric field in an insulation system (after introducing the scalar electric potential E = −∇V, where E is the electric field strength) is described by Laplace’s equation:
In electrostatic fields, electrode surfaces will obviously have assigned potential boundary conditions (electric potential V has a constant value).
- 2.
- The electromagnetic field created by sinusoidal currents allows the use of complex numbers and the description of the electromagnetic field by the Poisson equation resulting from Maxwell’s equations, using the complex magnetic vector potential A (B = ∇ × A):
The Poisson equation allows one to determine the magnetic field distribution when the primary and secondary current of the instrument transformer are known.
- 3.
- Helmholtz-type equation written in a complex time-harmonic form:
R and L are the load resistance and the inductance of the secondary winding, respectively, μ is the permeability, and γ is the conductivity of the materials. ls is the unit tangent vector along the direction of the secondary current in a winding with a volume Ωs, and Ss is the cross-sectional area of this winding with the number of turns ns.
The Helmholtz equation allows determining not only the distribution of the magnetic field, but most of all, the induced currents.
- 4.
- The diffusion-type equation describes the electromagnetic field in electrical devices at transient.
The diffusion equation allows determining not only the distribution of the magnetic field, but also the waveforms of induced currents.
3. A New Approach to the Design of Instrument Transformers Uses Field and Field-Circuit Methods for Construction Optimization
Analytical and experimental methods are not very precise. The new approach to instrument transformer design assumes the use of field and field-circuit methods for design optimization. The field methods, which have been developing intensively since the early 1970s, are based on Maxwell’s equations [10,11,12,13,14,15,16,17,18,19,20,21,22,23,24,25,26,27,28,29,30]. Using numerical methods of finite elements, finite differences or boundary elements have general properties that allow them to be applied to any design solution.
In the case of some constructions (complicated insulation systems, cores with air gaps) and specific emergency conditions, such as over-current or opening of the secondary current transformer during operation, field methods are even necessary. This also applies to instrument transformer structures and states for which the measurement is burdened with a significant error or is impossible due to the lack of appropriate power sources.
The instrument transformers operate loaded with specific external impedance. The modeling task is to determine the value of the secondary current or voltage with a known value of the primary current or voltage, which requires using the field-circuit method. The nonlinearity of the magnetic materials’ characteristics should be considered, which leads to the situation that the equations describing the problem are non-linear.
The evaluation of the instrument transformer operation with a non-sinusoidal supply or the TPZ protection transformer with a short-circuit in the transmission line in the transient state (for which it is intended) requires the use of full space and time field-circuit analysis.
High-voltage and medium-voltage instrument transformers pose many problems regarding the electrical strength of the insulation, especially combined transformers, where current and voltage transformer elements with diametrically different potentials are located next to each other in one housing.
3.1. Solving Problems during the Design of Instrument Transformers
The 3D finite element method is a proven good tool by designers to evaluate the properties of electromagnetic devices such as motors and transformers and other types of transducers.
Therefore, three-dimensional models of instrument transformers are used, and some problems are solved using the numerical field-circuit method.
By using field-circuit methods, it is possible at the design stage to directly determine both steady-state (Table 1, Table 2, Table 3 and Table 4) and transient errors (Table 5) of the instrument transformers without the need to use an equivalent circuit [17]. However, designers, to determine the metrological characteristics of instrument transformers, still often use commonly known equivalent circuits (Figure 1) [9]. The accuracy of determining these characteristics depends on the correct calculation of the parameters of the equivalent instrument transformer circuit. Structural problems that cannot be solved precisely using analytical or empirical formulas at the design stage are presented below.

Table 3.
Standard classes of protection current transformers according to IEC/EN 61869-2.

Table 4.
Standard classes of protection voltage transformers according to IEC/EN 61869-3.

Table 5.
Limits of error value of current protection transformers TPX, TPY, and TPZ.
3.1.1. Windings Leakage Reactance
Modeling the instrument transformer operation using the equivalent circuit (Figure 1) becomes problematic also in states deviating from the rated state (this also applies to protection transformers during the transient state in the transmission line) due to the significant variability of the diagram parameters. This is the effect of both the change in the saturation state of the core and the change in the spatial distribution of the magnetic field lines, which results in fluxes associated with parts of the windings even when counterturned on. Electromotive forces are induced that are not reflected in the equivalent circuit, in which the winding is modeled by lumped elements. This phenomenon is known and described as double leakage.
The leakage reactance through-going primary cable current transformers of ring and frame can be approximated from the empirical dependencies X2r = Rs tgφs, where the value of tgφs for the secondary winding depends on its arrangement and is determined experimentally [9].
The analytical formulas for calculating the winding leakage reactance X1r, X2r are given in the literature [1,9]:
where rm—the mean radius of the inter-winding gap; np, ns—the number of turns of the windings; b1m, b2m—equivalent length of the winding coils; δ—the width of the inter-winding gap; a1, a2—the height of the winding coils.
These apply only to the structure of the transformer with cylindrical windings, placed coaxially on the core column.
There are no analytical or empirical formulas for the remaining constructions. On the other hand, this parameter of the equivalent diagram significantly impacts the analytical calculations of transformation errors and the assessment of the instrument transformer class during design. In addition, in the overcurrent condition, the X2r secondary winding leakage reactance value differs from the value of this reactance during operation in the rated state. This is due to the saturation of the core in the overcurrent state of the current transformer. Therefore, it cannot be assumed that the leakage reactance X2r is a constant value.
Researchers dealing with instrument transformers proposed the use of field methods to calculate an important parameter in the design of instrument transformers, which is the leakage reactance [12,13,14,15,16,17,18].
Below is a comparison of the results of calculations and measurements for a voltage transformer that meets the requirements for using Formula (6).
The instrument transformer model used in the field-circuit method has distributed parameters and thus allows for considering the induced voltages in parts of the windings. The total winding leakage reactance, i.e., the short-circuit reactance of the instrument transformer reduced to the secondary side, can be determined from the magnetic energy related to the leakage flux from the magnetic field distribution in the equilibrium ampere-turns state of the instrument transformer (Figure 2) Xr = X″1r + X2r.
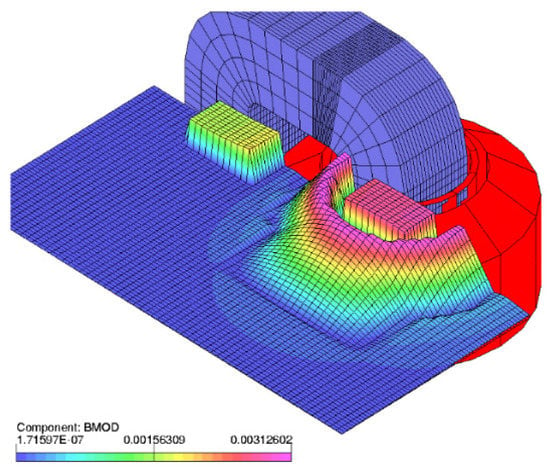
Figure 2.
Distribution of the magnetic flux leakage in the plane passing through the symmetry axis of a voltage transformer 15:/0.1: kV.
The Poisson equation is used to calculate the electromagnetic field created by sinusoidal currents using the complex magnetic vector potential A (9). If, when calculating the reactance of the windings, a sinusoidal variation of field values was assumed, i.e., the equivalent rectilinear magnetization characteristic passing through the point (Bm, Hm) adopted at each point of the area, then for magnetically linear or linearized systems for a given operating point, the energy formula takes the form;
where A, B, H, J are vectors of the magnetic vector potential, of the induction, of the magnetic field strength, and of the forced currents density, respectively; μ is the permeability of the core, Wm is the magnetic energy related to the leakage flux, and Ism is the maximum secondary current.
Then, the total leakage reactance is calculated from the magnetic field distribution and Formulas (17) and (18) (Table 6).

Table 6.
Comparison of the results of calculations and measurements of the total leakage reactance of the windings of a voltage transformer with a coiled core, ratio 15: /0.1: kV and power 100 VA.
3.1.2. Direct Determination of the Characteristics of Amplitude Errors and Phase Displacement Using Field-Circuit Methods
The solution field-circuit method with Helmholtz-type Equations (10)–(12) allows for determining the complex values of the secondary current. Then, based on Formulas (1) and (2), the characteristics of the current error and phase displacement are determined at the currents set by the standard [5] (Table 1 and Table 2) from 5 to 120% of the rated value and with an impedance load (in the range from 0.25 to 1 of its rated value) [17,25,27,28,29,30,31].
As an example, calculations and measurements were made for two different types of through-going current transformers shown in Figure 3: a measurement current transformer with a toroidal core, and a 600 A/5 A ratio [27] and protection 200 A/5 A with an adjustable air gap.
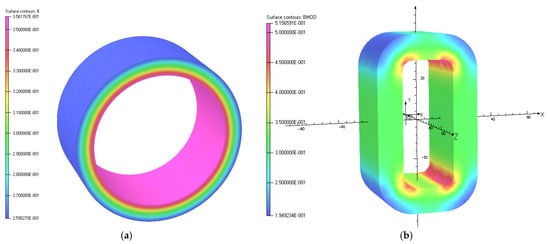
Figure 3.
The distribution of the magnetic induction [T] in (a) the measurement current transformer 600 A/5 A with a toroidal core (b) the core of the protection current transformer of the 200 A/5 A in the steady state for the rated conditions.
The comparison (Figure 4 and Table 7) shows the compliance of the transformation errors determined directly by field-circuit methods and tests.
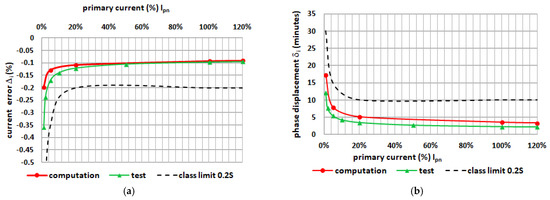
Figure 4.
Comparison of the (a) characteristics of the current error and (b) phase displacement from the calculations and tests for 600 A/5 A current transformers with a toroidal core at a power load of Sn = 2.5 VA. cosφ = 0.8 (Ipn = 600 A).

Table 7.
Errors of a non-linearized protection current transformer 200 A/5 A in the rated conditions in the steady state for S = 5 VA.
3.1.3. Operation of Current Transformers in Transient States
Failures such as short circuits and wire breakage occur in power networks. In this case, transient states appear in the system. A significant number of references can be found on this topic, but the most used analytical methods use the equivalent circuit [32,33,34,35,36,37,38,39,40]; most elements of this schema are determined by the field method [15].
Short-circuit testing laboratories are designed to check power protection devices’ operation and perform basic design tests of the power system components.
Short-circuit current transformers are the equipment of short-circuit laboratories in which components operating in power systems are tested. A short-circuit in the power network is a sudden failure; therefore, short-circuit current transformers should be designed to operate correctly during a transient state. During the tests, high currents of the order of kA flow are used, and due to the safety of operation, the measurements are made at a current of 5 A. Therefore, cascade current transformers are used. A cascade has several cores with primary and secondary windings connected in such a way that the secondary winding of the first core is the primary winding of the next. During design, the behavior of the protective current transformer in a transient state should be checked. First of all, the cores should not saturate and not deform the currents and meet the requirements for overvoltage protection current transformers (TP); that is, the maximum of the instantaneous peak error (6) must not exceed 10% of the error for all subsequent peak waveforms of the current during a specific transient switching cycle
Therefore, a full 3D space–time analysis of the field-circuit is required (13)–(15). It offers opportunities that even research cannot provide.
It allows one to assess the saturation of individual cascade cores, see the waveforms of all currents, and above all, the currents connecting the cascade windings, which cannot be viewed and measured on an oscilloscope [30].
As an example, an analysis of the operation of a 50,000 A/5 A cascade current transformer for measuring short-circuit currents is shown. Designed and manufactured by a factory prototype of current transformer, it has a sleeve structure and ring-shaped cores without gaps (Figure 5).
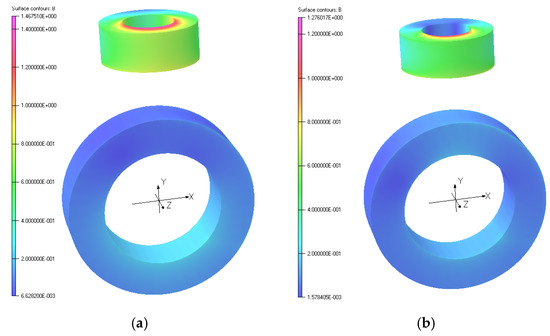
Figure 5.
Distribution of magnetic flux density (T) in the cores of short-circuit current transformers 50,000 A/5 A in a transient state in: (a) time 0.01 s—peak 1 (135.24 kA) and (b) time 0.03 s—peak 2 (128.38 kA).
The maximum of the instantaneous peak error does not exceed 10% (the maximum is 0.72%) (Table 8 and Figure 6 and Figure 7). The value of the induction of 1.47 T (Figure 5) is lower than the saturation induction, and the short-circuit current transformer meets the requirement not to distort the waveform (Figure 7).

Table 8.
Summary of the results of the prototype short-circuit tests 50 kA/5 A at the time constant Tp = 190 ms, Kssc = 2.76, and load R = 0.88 Ω.
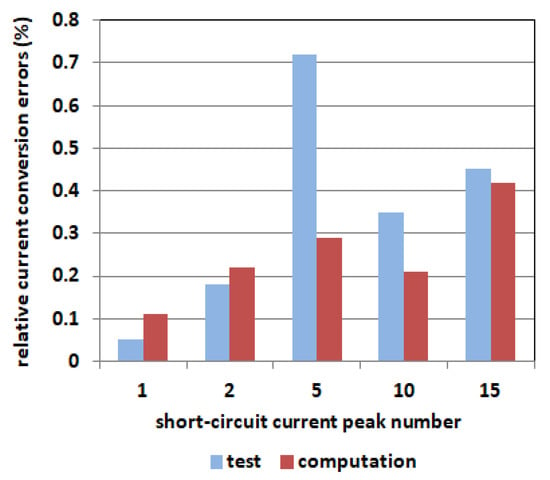
Figure 6.
Relative percentage errors on selected current peaks for the prototype of the short-circuit current transformer 50 kA/5 A at Tp = 190ms, Kssc = 2.76 and load R = 0.88 Ω.
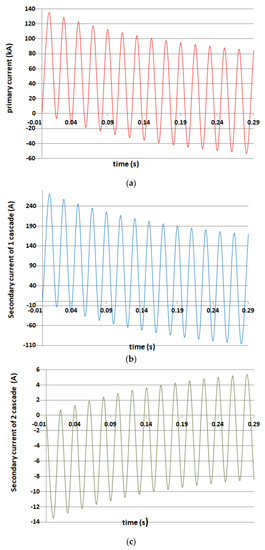
Figure 7.
Calculated waveforms of (a) primary and (b) secondary short-circuit currents in the first stage cascade (coupling winding) and (c) the second stage cascade.
3.1.4. Linearized Current Transformers Cores by Using Air Gaps
The cores of protective current transformers of the TPZ type must be linearized so that they do not operate in the saturation range of the magnetization characteristic and correctly transfer high currents occurring during a power system failure. The standard defines the permissible value of the instantaneous peak error of the AC component of the current (5)–(7) (Table 5).
TPZ class protection current transformers have cores with air gaps, which should guarantee linearity of the magnetization characteristic. Experience shows that not only the total length of the air gaps but also the number and length of the individual air gaps affect the instantaneous fault current of the protection current transformer.
The calculation of the instantaneous error current waveform using analytical methods consists in estimating how saturated the current transformer core is and whether the periodic component of the magnetizing current will not be deformed.
The estimation is made based on the participation of the non-periodic component in the course of the primary short-circuit current (4) and the required equivalent magnetization characteristic of the core with air gaps [9].
The fundamental difficulty and the source of errors and mistakes in this approach to the design of protection current transformers is the inability to predict the distribution of the magnetic field in the core with air gaps and thus correctly determine its equivalent magnetization characteristic.
The biggest mistake is the use of an approximate formula by the designer of protection current transformers [35,36,37,38,39,40], assuming an even distribution of the field in the core:
where la—the total length of air gaps; lFe = 2πrm—the average length in the ferromagnetic material; Ip np—the ampere-turns.
Many researchers are interested in this issue and use approximate analytical solutions [9,35,36,37,38,39,40] based on Formula (19), and some also increase the accuracy of simulation of a current transformer with an air gap considering hysteresis loops based on Preisach theory [38,39,40] or PSCAD/EMTDC [38].
This assumption of uniform field distribution in the core is false and, as a result, gives an erroneous result both in terms of the instantaneous error current and the shape of the equivalent magnetization characteristic. The consequence is an incorrect course of the instantaneous error current and, thus, an incorrect assessment of the designed current transformer.
Therefore, three-dimensional models of current transformers should be used (Figure 8 and Figure 9), and problems should be solved using the numerical field-circuit method [21,22,24].

Figure 8.
3D model of toroidal protection current transformer TPZ with a ratio of 1200 A/1 A.
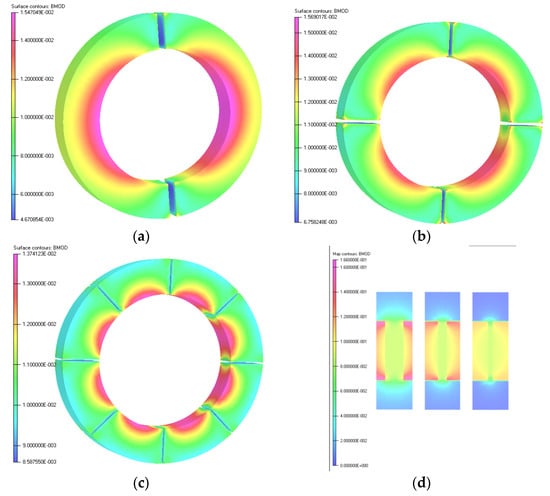
Figure 9.
Distribution of the magnetic induction [T] in the core of the protection current transformer of the core with (a) 2, (b) 4, and (c) 8 air gaps (with the same total gap length δ = 24 mm) in the XY plane and (d) within the surroundings of the air gaps in the XZ plane at a transient state at time t = 0.054 s with the same primary current ip = 30 (cos314.16t − e−20t) kA.
Although the authors of article [32] used FEM, they performed 2D calculations only in the core cross-section. Yet the magnetic flux propagates into the air gap not only in the direction of the core length (Figure 9d. Hence, it is a significant approximation and does not give exact results.
The evaluation of the instrument transformer operation with a non-sinusoidal supply or the TPZ protection current transformer with a short-circuit in the transmission line in the transient state (for which it is intended) requires the use of full space and time field-circuit 3D analysis (13)–(15) [23].
Figure 10 shows how the shape of the instantaneous error current versus time curves changes, using a core with a different number of air gaps but with the same total length. It can be seen that when only two air gaps are used, the waveform is distorted. This is the reason for disqualifying such a project. The instantaneous AC error peaks were required by the standard [4] and were calculated on the based on the instantaneous error current curves shown in Figure 10 and Formula (7).
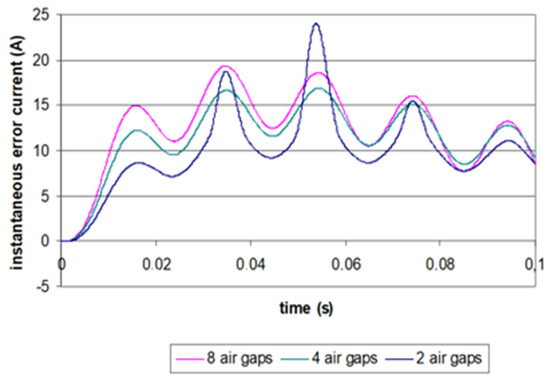
Figure 10.
Instantaneous current error versus time (in terms of secondary winding) for constructions of protective current cores with different number of air gaps (the total length of air gaps of cores was constant) at primary current ip = 30(cos314.16t − e20t) kA.
The equivalent “effective air gap” is always smaller than the total length of air gaps due to the uneven distribution of the magnetic field in the core (Figure 9). The most significant discrepancy occurs where the field distribution is the most uneven, i.e., with a small number of large air gaps (Table 9). The value of the equivalent “effective air gap” length depends on many parameters simultaneously and cannot be calculated without using three-dimensional field analysis.

Table 9.
Comparison of peak instantaneous alternating current errors of protective current cores with different numbers of air gaps obtained applying the field-circuit method and test.
3.1.5. Operation of Instrument Transformers at Distorted Supply Voltages
More often, distribution networks are powered by distributed generation units with uneven electricity production and loaded with non-linear receivers [38]. Exceptional cases of distributed generation are renewable energy production units with an electrical power of up to 40 and 200 kW. Among them, the most popular are solar panels and small wind farms.
A very important issue is the accuracy of power measurements in transmission and distribution stations [41,42]. The measuring instrument transformers are elements of the power measurement system. The standards of the International Electrotechnical Commission (IEC/EN) [3,4,5] oblige designers to identify and reduce these errors (Table 1, Table 2 and Table 3). That is why many authors deal with this topic [41,42,43,44,45,46,47,48,49,50,51]. Research mainly concerns accurate measurement methods and uses analytical methods to work out this phenomenon. Particularly interesting is an article on the influence of the shape of the magnetization characteristics of the core of the current transformer (generated harmonics due to nonlinearity) on the accuracy of the current transformation by the measuring transformer [44].
The research in [50] presents the benefits of using a full three-dimensional space–time analysis of the magnetic field (13)–(15) to calculate the secondary voltage waveforms with distorted voltage supply. It offers opportunities that analytical methods cannot provide.
The research, which was carried out based on very approximate analytical models, did not consider most of the phenomena that are part of the three-dimensional electromagnetic field calculations. It is possible to obtain the current or secondary voltage waveform and accurately calculate the phase displacement as well as perform a discrete Fourier analysis of secondary waveforms. The calculation results for a specific voltage transformer 2000 V/100 V (Figure 11) are shown in the form of a distorted primary voltage waveform in Figure 12 and Table 10 in the form of transformation errors at the primary sinusoidal and distorted voltage.
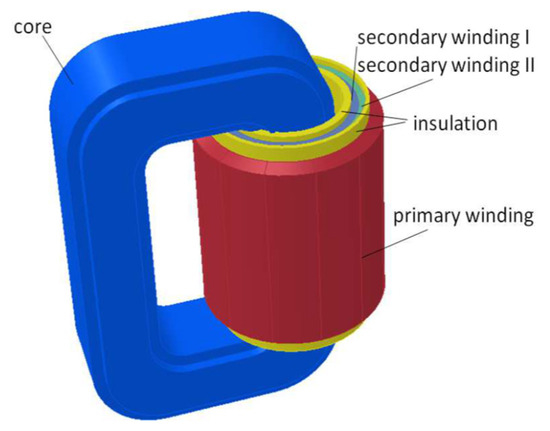
Figure 11.
3D geometrical model of the measuring voltage transformer 2000 V/100 V.
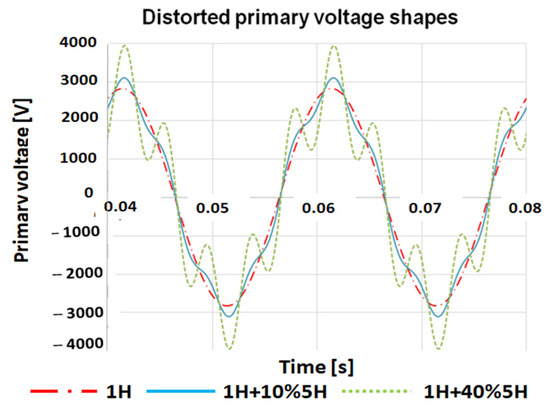
Figure 12.
Curve of the distorted primary voltage (where the first harmonic of 50 Hz amplitude is 100%—2000 V, and fifth harmonic of 250 Hz is 10%—200 V or 40%—800 V rated amplitude), and total harmonic distortion (THD) = 0.1 and 0.4.

Table 10.
Comparison of calculated and measured voltage errors of the tested VT at distorted voltage and load 2 MΩ.
3.1.6. Calculation of the Peak Voltage Value with an Open Secondary of the Current Transformer
The opening of the secondary circuit of the current transformer at the rated primary current causes the voltage on the secondary terminals to reach very high values, and power losses occur in the core. This is a danger both for the operator and for the current transformer’s insulation, which may be punctured. Such a situation may arise due to a breakdown or improper operation. The current transformer designer should know what peak voltage may appear at the terminals of the designed current transformer and what the consequences may be. Performing such a test is also impossible for the above reasons. The constructor has analytical two formulas to determine the peak voltage value [9];
and [52]:
and also an empirical formula (internal, unpublished lab manual):
where: Lμ, RFe are parameters of the equivalent circuit; ns—the number of turns of the secondary winding; SFe—core cross-sectional area in cm2; μmax—the highest value of static magnetic permeability at the beginning of the core magnetization characteristic; Ip—the primary current; Sn—power; Isn—the rated secondary current; k—constant equal to (0.5 ÷ 1.4) V/cm2; these parameters give divergent results (Table 11).

Table 11.
Peak values of the secondary voltage of the model transformer at rated primary current and opening the secondary circuit.
Solving this problem due to the significant deformation of the field value waveforms requires the solution of the full system of differential equations with respect to time (13)–(15).
As an example, the calculations for a 5 A/5 A laboratory current transformer: waveforms of the flux and secondary voltage shown in Figure 13 and a comparison of the induced secondary voltage calculations based on various calculations (Table 11).
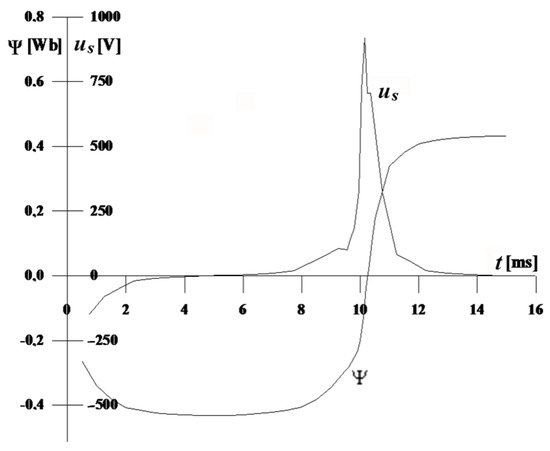
Figure 13.
Waveforms of the flux and secondary voltage, with an open secondary circuit and rated primary current, calculated for a 5 A/5 A laboratory current transformer.
The calculated peak voltage values reach up to kilovolts; therefore, performing measurements under these conditions could damage the current transformer. However, it can be assumed that the current transformer model, which proved successful in the evaluation of other operating states, also gives satisfactory results in the event of opening the secondary circuit.
3.1.7. Cores Consisting of Different Magnetic Materials
The improvement of current transformer measurement properties (Table 1 and Table 2) without changing their dimensions requires the use of high-quality magnetic materials. That is why constructors carry out investigations of constructions of combined toroidal cores concerning nanocrystalline cores [25,27,28,51] (Figure 14).
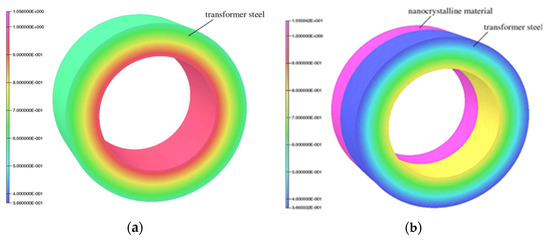
Figure 14.
Magnetic induction distributions [T] of measuring current transformers 200 A/5 A with core made from: (a) steel (b) combined steel and nanocrystalline material (20%) at the same primary current Ip = 200 A and load Sn = 7.5 VA (cosφ = 0.8).
The advantage of nanocrystalline materials is a much higher magnetic permeability value than of electrical steel at the beginning of the magnetization characteristic (Figure 15a). Using a core made of nanocrystalline material allows us to significantly reduce the transformation errors of current transformers (in the initial range) and obtain a low safety factor FS. Figure 15b presents the calculated resultant magnetization characteristics with the use of different proportions of the nanocrystalline material and electric steel in the toroidal core.
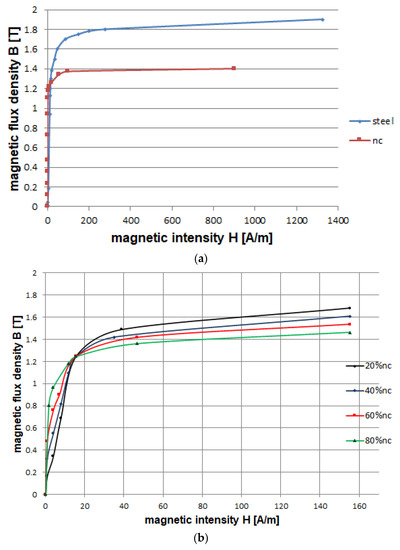
Figure 15.
Magnetic characteristics of (a) core materials (test) and (b) equivalent magnetic characteristics of cores made of different proportions of two different magnetic materials (20%, 40%, 60%, 80% nanocrystalline) (total height of core is constant) computed using the field-and-circuit method.
However, a serious disadvantage is the low value of their saturation induction. This causes an increase in current transformer transformation errors at great primary currents and high loads. The way out of this situation is by using cores made up of both electrical steel and nanocrystalline material.
Two types of current transformers are selected as examples: 200 A/5 A (Figure 14) and 100 A/5 A (Figure 16).
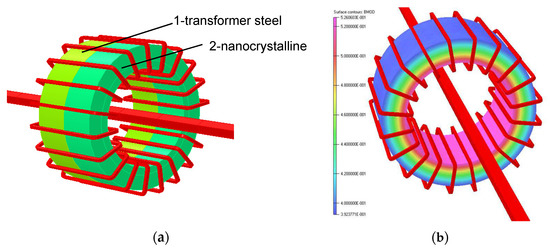
Figure 16.
3D model of a (a) measuring current transformer 100 A/5 A and (b) magnetic induction distributions [T] of measuring current transformers with a core made from nanocrystalline material at the rated primary current Ipn = 100 A and burden Sn = 2.5 VA, cosφ = 0.8.
Designers using the field-circuit simulation method can accurately predict the distribution of the magnetic field in both parts of the core from different materials (Figure 14), as well as accurately determine the transformation errors determining the class (Table 1 and Table 2, Figure 17) of the current transformer or equivalent magnetic characteristics of cores made of different materials (Figure 15b and Figure 16b) [25,27,28].
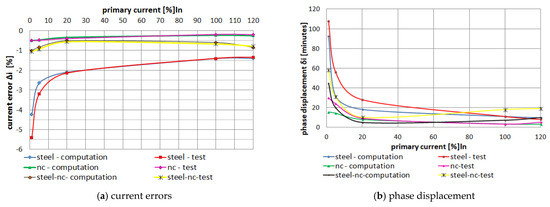
Figure 17.
Comparison of the results of the characteristics of the current error (a) and phase displacement (b) from calculations and tests for 100 A/5 A current transformers with a core made of transformer steel, nanocrystalline material and these materials combined in the proportion of 50% at the same load Sn = 2.5 VA, cosφ = 0.8 (Ipn = 100 A).
To solve the discussed issue, a Helmholtz-type equation written in a complex time-harmonic form should be applied (10)–(12).
The effects that can be obtained in cores made of electric and nanocrystalline tapes provide additional opportunities to improve the production of current transformers and create a new, better-quality generation of these devices with better parameters (Figure 17) [25,27,28].
3.1.8. Shaping the Insulation System of High- and Medium-Voltage Transformers
The correct design of an instrument transformer that meets the accuracy criteria of the required class in the case of high- and medium-voltage transformers is insufficient. Insulation plays an important role here. High- and medium-voltage instrument transformers pose many problems related to the electrical strength of the insulation, especially combined instrument transformers, where in one housing there are current and voltage transformers with diametrically different electric potentials next to each other.
The instrument transformer insulation system consists of metal electrodes and elements of solid (paper, capacitor foil, epoxy resin) and liquid (transformer oil) or gas insulation (SF6). Medium-voltage transformers (up to 50 kV) require resin insulation, while high-voltage insulation is paper-oil or SF6 gas insulation.
A properly designed insulation system should provide the required electrical strength (the maximum electric field strength should be lower than the permissible values) and at the same time not excessively increase the mass and volume of the instrument transformer.
Problems are caused by too high electric field strength values causing insulation breakdown and uneven field distribution causing partial discharges. The insulation should be designed appropriately, and the appropriate strength insulation materials should be selected to avoid this. A proper selection of shapes of system elements and electrostatic screens (at high and low potential) is used.
The importance of these problems is evidenced by the great interest of researchers and numerous publications, some of which are cited in the references [53,54,55,56,57,58,59,60,61,62,63]. Some publications (not listed here) concern insulating materials and their chemical properties (e.g., synthetic and mineral, biodegradable transformer oils). Many articles focus on research [54,55,58,59,60], such as impulse tests of insulation (lightning impulse voltage 1.2/50 s), tests with 1 min voltage with the fundamental frequency, and measurements of partial discharges [58,59]. There are also articles using analytical models of instrument transformer insulation [61].
Field calculations are helpful for the constructor, which allows the design stage to shape the designed device in such a way that there is no possibility of breakdown and partial discharges [53,56,57,61].
The electric field in an insulation system (after introducing the scalar electric potential E = −∇V where E is the electric field strength) is described by Laplace’s Equation (8).
Calculating the electric field distribution in the instrument transformer insulation allows for assessing its resistance to breakdown and the formation of partial discharges. The aim of the improvement of the design is to obtain greater electrical strength and higher-rated power with the same accuracy class and assuming the same external dimensions. Of course, this also needs to be considered economically.
The instrument transformers’ insulation systems must be modeled to ensure that the permissible electric field strength (electrical stress) has not been exceeded in the materials and that the homogeneity of the electric field is maintained. It is possible to introduce electrostatic screens and change the insulating materials to those with higher electrical strength. The fulfillment of these conditions eliminates breakdowns of insulation and partial discharges.
Medium-voltage instrument transformers as an example [57] (Figure 18):
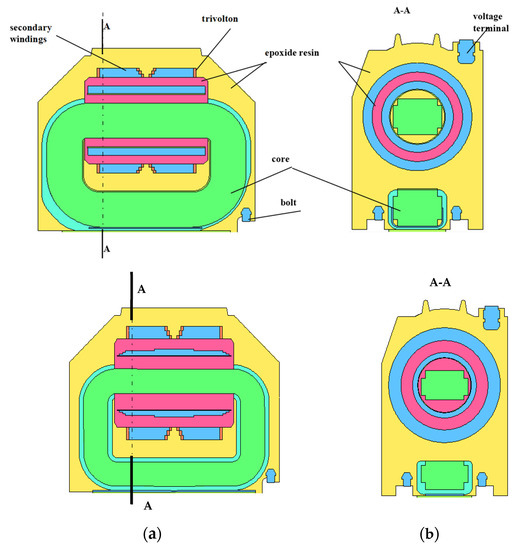
Figure 18.
Two constructional variants of the same external dimensions of the voltage transformer 15:kV/100: V (a) before redesign and (b) after redesign.
As a result of the calculations, it turned out that the highest stresses occur in the areas of the corners of the primary coil in the insulation, which are made of trivolton H foils separated from each other by epoxy resin layers. When supplied with a 1 min 38 kV test voltage (Figure 19), they reach the value of 16.2 kV/mm in version 1 and 12.3 kV/mm in version 2 after the redesign. The redesign mainly involved a change in the core cross-section.
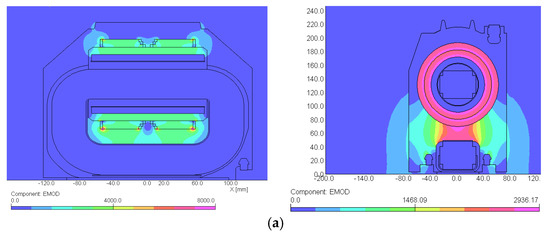
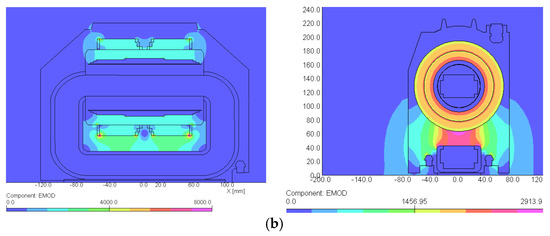
Figure 19.
Distribution of the electric field strength (V/mm) in the area of the voltage transformer 15:kV/100: V after redesign, under operating conditions (38 kV—1 min) (a) before redesign and (b) after redesign.
The computation done for the final version of the voltage transformer at the operating state (15: kV) shows the average level of electric field strength to be 3 kV/mm and the peak values in trivolton, near the edges of the primary coil, to be 6.4 kV/mm.
High-voltage instrument transformers as an example (Figure 20):
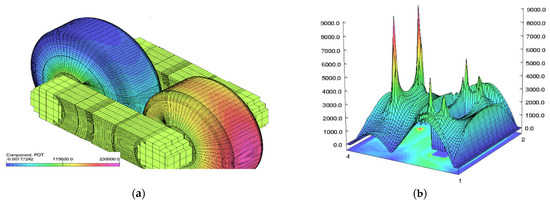
Figure 20.
Distribution of the electric potential (V) (a) in the insulation system of the HV voltage transformer 110: kV/100: V and (b) distribution of the electric field strength 9 V/mm) in the core window.
The technology of insulating coils in the most advantageous version 1 requires more work than the more straightforward version 3 (Figure 21 and Table 12). It would be advisable to use screens to eliminate edge effects. However, there is no space in the window of the voltage transformer core, and enlarging the core would increase the dimensions, weight, and costs of the voltage transformer, which is uneconomical.

Figure 21.
Distribution of electric potential (ΔV = 5% Vmax) in the core window of the voltage transformer inductive with oil-paper insulation: (a) version 1, (b) version 2, (c) version 3.

Table 12.
Maximum values of the electric field strength in paper-oil, in oil insulation, and on the surface of the paper-oil insulation in the considered voltage transformer.
It is possible to compute the electric field distribution and then shape windings and insulation to reduce peaks of the electric field strength and estimate the electric strength.
4. Conclusions
Analysis of physical fields’ distributions using accurate numerical methods gives wide possibilities, especially for constructors of precision electrical devices, which require very high accuracy.
Building a prototype and testing is very costly and time-consuming, and it is not acceptable during optimization.
Therefore, it is extremely important first to conduct thorough experiments using computer software and to fine-tune the design as much as possible.
Thanks to the use the field method, the constructor can determine the properties of the designed device both during steady-state operation and in emergency and transient states before the prototype.
To meet the high metrological requirements of devices, when creating device models, real physical phenomena should be considered, and approximate analytical models (equivalent circuits) should not be used. It is especially important to take into account the nonlinearity of the characteristics of the magnetic materials used, which leads to the situation that the equations describing the problem are non-linear.
For instrument transformers, electromagnetic modeling is crucial for proper design.
Funding
This research received no external funding.
Institutional Review Board Statement
Not applicable.
Informed Consent Statement
Not applicable.
Data Availability Statement
The data presented in this study are available upon request from the corresponding author. Computer data are not publicly available because they are not suitable for use by other researchers.
Acknowledgments
I would like to thank the engineers and manufacturers of POLCONTACT Warsaw LLC, TRANSFORMEX LLC, Electrical Apparatus Factory ZWARPOL LLC, and especially the former High Voltage Apparatus Manufacturing Plants ZWAR for cooperation and inspiration in research on the accuracy of various instrument transformer solutions.
Conflicts of Interest
The author declares no conflict of interest.
References
- Jezierski, E. Power Transformer; WNT: Warsow, Poland, 1983; pp. 1–650. ISBN 5905279053229. (In Polish) [Google Scholar]
- Wiszniewski, A. Instrument Transformers in the Power Industry; WNT: Warsow, Poland, 1983; pp. 1–302. ISBN 8320403707. (In Polish) [Google Scholar]
- IEC/EN 61869-1; Instrument Transformers—Part 1: General Requirements. International Electrotechnical Commission: Geneva, Switzerland, 2009.
- IEC/EN 61869-2; Instrument Transformers—Part 2: Additional Requirements for Current Transformer. International Electrotechnical Commission: Geneva, Switzerland, 2012.
- IEC/EN 61869-3; Instrument Transformers—Part 3: Additional Requirements for Inductive Voltage Transformers. International Electrotechnical Commission: Geneva, Switzerland, 2011.
- IEC/EN 61869-4; Instrument Transformers—Part 4: Additional Requirements for Inductive Combined Transformers. International Electrotechnical Commission: Geneva, Switzerland, 2014.
- IEC/EN 61869-5; Instrument transformers - Part 5: Additional requirements for capacitor voltage transformers. International Electrotechnical Commission: Geneva, Switzerland, 2011.
- IEC\TR 61869-103; Instrument Transformers—The Use of Instrument Transformers for Power Quality Measurement. International Electrotechnical Commission: Geneva, Switzerland, 2012.
- Koszmider, A.; Olak, J.; Piotrowski, Z. Current Transformers; WNT: Warsow, Poland, 1985; pp. 1–283. ISBN 8320407109. (In Polish) [Google Scholar]
- Asghari, B.; Dinavahi, V.; Rioual, M.; Martinez, J.A.; Iravani, R. Interfacing Techniques for Electromagnetic Field and Circuit Simulation Programs IEEE Task Force on Interfacing Techniques for Simulation Tools. IEEE Trans. Power Deliv. 2009, 24, 939–950. [Google Scholar] [CrossRef]
- Amoiralis, E.I.; Georgilakis, P.S.; Tsili, M.A.; Kladas, A.G. Global transformer optimization method using evolutionary design and numerical field computation. IEEE Trans. Magn. 2009, 45, 1720–1723. [Google Scholar] [CrossRef]
- Turowski, J.; Turowski, M.; Kopec, M. Method of three-dimensional network solution of leakage field of three-phase transformers. IEEE Trans. Magn. 1990, 26, 2911–29190. [Google Scholar] [CrossRef]
- Tomczuk, B. Analysis of 3-D magnetic fields in high leakage reactance transformers. IEEE Trans. Magn. 1994, 30, 2734–2738. [Google Scholar] [CrossRef]
- Zakrzewski, K.; Tomczuk, B. Magnetic field analysis and leakage inductance calculation in current transformers by means of 3-D inte-gral methods. IEEE Trans. Magn. 1996, 32, 1637–1640. [Google Scholar] [CrossRef]
- Zakrzewski, K.; Lukaniszyn, M.; Tomczuk, B. 3-D calculations of leakage field and reactance for special transformers. Int. J. Comput. Math. Electr. Electron. Eng. 1998, 17, 460–474. [Google Scholar] [CrossRef]
- Kladas, A.G.; Papadopoulos, M.P.; Tegopoulos, J.A. leakage flux and force calculation on power transformer windings under short-circuit: 2D and 3D models based on the theory of images and the finite element method compared to measurements. IEEE Trans. Magn. 1994, 30, 3487–3490. [Google Scholar] [CrossRef]
- Lesniewska, E.; Jalmuzny, W. The estimation of metrological characteristics of instrument transformers in rated and overcurrent conditions based on the analysis of electromagnetic field. Int. J. Comput. Math. Electr. Electron. Eng. 1992, 11, 209–912. [Google Scholar] [CrossRef]
- Raitsios, P. Leakage field of a transformer under conventional and superconducting condition. J. Mater. Process. Technol. 2001, 108, 246–252. [Google Scholar] [CrossRef]
- Semlyen, A.; De Leon, F. Computation of electromagnetic transients using dual or multiple time steps. IEEE Trans. Power Syst. 1993, 8, 1274–1281. [Google Scholar] [CrossRef]
- Lesniewska, E.; Koszmider, A. Influence of the Interaction of Voltage and Current Parts of a Combined Instrument Transformer on its Measurement Properties. IEE Proc. Sci. Meas. Technol. 2004, 151, 229–234. [Google Scholar] [CrossRef]
- Paic, I.; Krajtner, D.; Nenadic, Z. A new approach to design and construction process of instrument transformers. In Proceedings of the EUROCON 2005—The International Conference on “Computer as a Tool”, Belgrade, Serbia, 21–24 November 2005; p. 1. [Google Scholar] [CrossRef]
- Konrad, A.; Brudny, J.F. Virtual air gap length computation with the finite-element method. IEEE Trans. Magn. 2007, 43, 1829–1832. [Google Scholar] [CrossRef]
- Lesniewska, E.; Jalmuzny, W. Influence of the Number of Core Air Gaps on Transient State Parameters of TPZ Class Protective Current Transformers. IET Sci. Meas. Technol. 2009, 3, 105–112. [Google Scholar] [CrossRef]
- Lesniewska, E.; Tulodziecki, B. Optimization of the Magnetic Circuits of the Column Voltage Transformers Using the Field-Circuit Method. Int. J. Comput. Math. Electr. Electron. Eng. 2012, 31, 1417–1427. [Google Scholar] [CrossRef]
- Lesniewska, E.; Rajchert, R. Application of the Field-Circuit Method for the Computation of Measurement Properties of Current Transformers with Cores Consisting of Different Magnetic Materials. IEEE Trans. Magn. 2010, 46, 3778–3782. [Google Scholar] [CrossRef]
- Ahn, H.M.; Lee, J.Y.; Kim, J.K. Finite-element analysis of short-circuit electromagnetic force in power transformer. IEEE Trans. Ind. Appl. 2011, 47, 1267–1271. [Google Scholar] [CrossRef]
- Lesniewska, E.; Rajchert, R. 3D Field-Circuit Analysis of Measurement Properties of Current Transformers with Axially and Radially Connected Cores Made of Different Magnetic Materials. Prog. Electromagn. Res. M 2013, 28, 1–13. [Google Scholar] [CrossRef]
- Lesniewska, E.; Rajchert, R. Behaviour of Measuring Current Transformers with Cores Composed from Different Magnetic Materials at non-rated loads and over-currents. IET Sci. Meas. Technol. 2019, 13, 944–948. [Google Scholar] [CrossRef]
- Lesniewska, E. Influence of the Selection of the Core Shape and Winding Arrangement on the Accuracy of Current Transformers with through-Going Primary Cable. Energies 2021, 14, 1932. [Google Scholar] [CrossRef]
- Lesniewska, E.; Olak, J. Analysis of the Operation of Cascade Current Transformers for Measurements of Short-Circuit Currents with a Non-Periodic Component with a Large Time Constant of Its Decay. Energies 2022, 15, 2925. [Google Scholar] [CrossRef]
- Zurek, S.; Al-Naemi, F.; Moses, A.J. Finite-element modeling and measurements of flux and eddy current distribution in toroidal cores wound from electrical steel. IEEE Trans. Magn. 2008, 44, 902–905. [Google Scholar] [CrossRef]
- Rafajdus, P.; Bracinik, P.; Hrabovcova, V.; Saitz, J.; Kankula, L. Current transformer analysis under transient conditions. In Proceedings of the XIX International Conference on Electrical Machines-ICEM 2010, Rome, Italy, 6–8 September 2010. [Google Scholar] [CrossRef]
- Qi, X.; Yin, X.G.; Zhang, Z.; Gan, L. A simulation platform for the analysis of the current transformer transient characteristic. In Proceedings of the 2015 5th International Conference on Electric Utility Deregulation and Restructuring and Power Technologies, Changsha, China, 26–29 November 2015. [Google Scholar] [CrossRef]
- Rezaei-Zare, A.; Iravani, R.; Sanaye-Pasand, M.; Mohseni, H.; Farhangi, S. An accurate current transformer model based on Preisach theory for the analysis of electromagnetic transients. IEEE Trans. Power Deliv. 2008, 23, 233–242. [Google Scholar] [CrossRef]
- Ceron-Oliver, L.F.; Wang, Q.; Zeze, D. Air-Gapped Current Transformer simulation and accuracy assessment. In Proceedings of the 2022 IEEE 21st Mediterranean Electrotechnical Conference, Palermo, Italy, 14–16 June 2022; pp. 183–188. [Google Scholar] [CrossRef]
- Lu, B.; Chen, X.; Xu, Z.; Nie, G.; Tang, X. Design and simulation analysis of wide-range current transformer with adaptively adjustable air gap length. J. Phys. MSOTA 2021 2022, 2219, 1–10. [Google Scholar] [CrossRef]
- Muthumuni, D.; McLaren, P.; Chandrasena, W.; E Parker, A. Simulation model of an air gapped current transformer. In Proceedings of the 2001 IEEE Power Engineering Society Winter Meeting. Conference Proceedings, Columbus, OH, USA, 28 January–1 February 2001; pp. 705–709. [Google Scholar] [CrossRef]
- Huang, L.; Yang, W.; Zhang, X. Modeling and simulation of current transformer with air gap based on PSCAD/EMTDC. Power Syst. Prot. Control. 2010, 38, 178–182. [Google Scholar]
- Wu, Y.H.; Dong, X.Z.; Mirsaeidi, S. Modeling and simulation of air-gapped current transformer based on Preisach Theory. Prot. Control. Mod. Power Syst. 2017, 2, 11. [Google Scholar] [CrossRef]
- Wu, Y.H.; Dong, X.Z.; Mirsaeidi, S. Design and Simulation of a New Model for Air-Gapped Current Transformers. IEE J. Trans. 2018, 13, 1127–1135. [Google Scholar] [CrossRef]
- Xu, W.; Liu, Y. A method for determining customer and utility harmonic contributions at the point of common coupling. IEEE Trans. Power Deliv. 2000, 15, 804–811. [Google Scholar] [CrossRef]
- Cataliotti, A.; Di Cara, D.; Emanuel, A.E.; Nuccio, S. Current Transformers Effects on the Measurement of Harmonic Active Power in LV and MV Networks. IEEE Trans. Power Deliv. 2011, 26, 360–368. [Google Scholar] [CrossRef]
- Filipović-Grčić, D.; Filipović-Grčić, B.; Krajtner, D. Frequency response and harmonic distortion testing of inductive voltage transformer used for power quality measurements. Procedia Eng. 2017, 202, 159–167. [Google Scholar] [CrossRef]
- Chen, Y.; Huang, Z.; Duan, Z.; Fu, P.; Zhou, G.; Luo, L. A Four-Winding Inductive Filtering Transformer to Enhance Power Quality in a High-Voltage Distribution Network Supplying Nonlinear Loads. Energies 2019, 12, 2021. [Google Scholar] [CrossRef]
- Kaczmarek, M. The effect of distorted input voltage harmonics rms values on the frequency characteristics of ratio error and phase displacement of a wideband voltage divider. Electr. Power Syst. Res. 2019, 167, 1–8. [Google Scholar] [CrossRef]
- Bajaj, M.; Singh, A.K.; Alowaidi, M.; Sharma, N.K.; Sharma, S.K.; Mishra, S. Power Quality Assessment of Distorted Distribution Networks Incorporating Renewable Distributed Generation Systems Based on the Analytic Hierarchy Process. IEEE Access 2020, 8, 145713–145737. [Google Scholar] [CrossRef]
- Kaczmarek, M.; Stano, E. Measuring system for testing the transformation accuracy of harmonics of distorted voltage by medium voltage instrument transformers. Measurement 2021, 181, 109628. [Google Scholar] [CrossRef]
- Mahesh, G.; George, B.; Jayashankar, V.; Kumar, V.J. Instrument transformer performance under distorted conditions. Proc. IEEE Indicon 2004, 2004, 468–471. [Google Scholar] [CrossRef]
- Kaczmarek, M.; Stano, E. Nonlinearity of Magnetic Core in Evaluation of Current and Phase Errors of Transformation of Higher Harmonics of Distorted Current by Inductive Current Transformers. IEEE Access 2020, 8, 118885–118898. [Google Scholar] [CrossRef]
- Lesniewska, E.; Kaczmarek, M.; Stano, E. 3D Electromagnetic Field Analysis Applied to Evaluate the Accuracy of a Voltage Transformer under Distorted Voltage. Energies 2021, 14, 136. [Google Scholar] [CrossRef]
- Chojnacki, J.; Liszewski, P.; Soinski, M.; Rygal, R.; Pluta, W.; Zurek, S.; Pinkosz, P. Harmonic distortion of magnetizing current in combined wound toroidal cores. IEEE Trans. Magn. 2008, 44, 3816–3819. [Google Scholar] [CrossRef]
- Starczakow, W. Instrument Transformers; PWT: Warsow, Poland, 1959; pp. 1–394. (In Polish) [Google Scholar]
- Lesniewska, E.; Kowalski, Z. Designing voltage transformer insulation systems with SF6-insulations using CAD. Archiv. Für Elektrotechnik 1991, 74, 427–432. [Google Scholar] [CrossRef]
- Mayoux, C. Degradation of Insulating Materials under Electrical Stress. IEEE Trans. Dielectr. Electr. Insul. 2000, 7, 590–601. [Google Scholar] [CrossRef]
- Kolev, N.; Genovski, T.; Topalis, F. Analysis And Investigation of Electrical Breakdown Critical Areas Of High Voltage Current Transformers. In Proceedings of the 12th International Symposium on High Voltage Engineering (ISH 2001), Bangalore, India, 20–24 August 2001; Volume 4, pp. 809–812. [Google Scholar]
- Lesniewska, E. The use of 3D electric field analysis and the analytical approach for improvement of a combined instrument transformer insulation system. IEEE Trans. Magn. 2002, 38, 1233–1236. [Google Scholar] [CrossRef]
- Lesniewska, E. Improvement of the electric strength of an insulation system of a medium voltage instrument transformer using field analysis. In Computer Engineering in Applied Electromagnetism; Springer: Dordrecht, The Netherland, 2003; pp. 143–148. [Google Scholar] [CrossRef]
- Pompili, M.; Mazzetti, C.; Bartnikas, R. Partial discharge pulse sequence patterns and cavity development times in transformer oils under AC conditions. IEEE Trans. Dielect. Electr. Insul. 2005, 12, 395–403. [Google Scholar] [CrossRef]
- Montanari, J.C. Insulation diagnosis of high voltage apparatus by partial discharge investigation. In Proceedings of the 2006 IEEE 8th International Conference on Properties & Applications of Dielectric Materials, Bali, Indonesia, 20–30 June 2006; pp. 1–11. [Google Scholar] [CrossRef]
- Dan, C.; Morar, R. Determining insulation condition of 110 kV instrument transformers. Linking PD measurement results from both gas chromatography and electrical method. IOP Conf. Ser. Mater. Sci. Eng. 2016, 200, 1–7. [Google Scholar] [CrossRef]
- Lesniewska, E.; Olak, J. Improvement the Insulation System of Unconventional Combined Instrument Transformer Using 3D Electric Field Analysis. IEEE Trans. Power Deliv. 2018, 33, 2582–2589. [Google Scholar] [CrossRef]
- Hernandez, G.; Ramirez, A. Dielectric Response Model for Transformer Insulation Using Frequency Domain Spectroscopy and Vector Fitting. Energies 2022, 15, 2655. [Google Scholar] [CrossRef]
- Thiviyanathan, V.A.; Ker, P.J.; Leong, Y.S.; Abdullah, F.; Ismail, A.; Jamaludin, M.Z. Power transformer insulation system: A review on the reactions, fault detection, challenges and future prospects. Alex. Eng. J. 2022, 61, 7697–7771. [Google Scholar] [CrossRef]
Publisher’s Note: MDPI stays neutral with regard to jurisdictional claims in published maps and institutional affiliations. |
© 2022 by the author. Licensee MDPI, Basel, Switzerland. This article is an open access article distributed under the terms and conditions of the Creative Commons Attribution (CC BY) license (https://creativecommons.org/licenses/by/4.0/).