Abstract
Hydrogen (H2) is an attractive energy carrier to move, store, and deliver energy in a form that can be easily used. Field proven technology for underground hydrogen storage (UHS) is essential for a successful hydrogen economy. Options for this are manmade caverns, salt domes/caverns, saline aquifers, and depleted oil/gas fields, where large quantities of gaseous hydrogen have been stored in caverns for many years. The key requirements intrinsic of a porous rock formation for seasonal storage of hydrogen are: adequate capacity, ability to contain H2, capability to inject/extract high volumes of H2, and a reliable caprock to prevent leakage. We have carefully evaluated a commercial non-isothermal compositional gas reservoir simulator and its suitability for hydrogen storage and withdrawal from saline aquifers and depleted oil/gas reservoirs. We have successfully calibrated the gas equation of state model against published laboratory H2 density and viscosity data as a function of pressure and temperature. Comparisons between the H2, natural gas and CO2 storage in real field models were also performed. Our numerical models demonstrated more lateral spread of the H2 when compared to CO2 and natural gas with a need for special containment in H2 projects. It was also observed that the experience with CO2 and natural gas storage cannot be simply replicated with H2.
1. Introduction
Hydrogen is the most abundant substance in the universe, but it must be separated from some other substance such as water or fossil fuels, since it does not exist as a gas. For example, industries such as oil refineries use large quantities of hydrogen that mostly comes from separation of hydrogen from natural gas called steam methane reforming. Some of its potential usages are in powering long-haul trucks, trains, and air travel. Some energy companies are also looking into blending hydrogen with natural gas for home heating and cooking. The existing natural gas infrastructure already has an advanced and mature hydrogen production process through natural gas reforming. Currently, large central plants of natural gas reforming are responsible for 95% of the hydrogen production from the United States [1]. This is an important path for the production of hydrogen in the short term. Carbon capture and storage can be combined with these processes in order to reduce the overall carbon emissions from industrial activities. The National Aeronautics and Space Administration (NASA) began using liquid hydrogen in the 1950s as a rocket fuel; NASA was one of the first to use hydrogen fuel cells to power the electrical systems on spacecraft.
There are already experiences in storing H2 in geological sites. In Texas, hydrogen has been stored since the 1980s in a solution-mined salt cavern by the Chevron Philips Clemens Terminal. The cavern roof is about 2800 ft underground, comprised of a cylinder with a diameter of 160 ft with 2520 metric tons storage capacity [2]. Another example is the RAG Austria AG storing H2 in a depleted oil and gas field in Austria in 2017 [3]. Their research included the development and testing of technology for storing excess wind and solar powered electricity through its use in the production of natural gas, for later use in power generation, in storage facilities. The same infrastructure and technology can be used to replace the natural gas by hydrogen.
A first assessment of risk factors associated with subsurface hydrogen storage is essential for fact-guided policy and investment decisions, and for effective communication with stakeholders, including regulators and the general public [4]. While hydrogen storage in salt caverns is being practiced in Texas and the UK for decades and can be considered tested in a commercial-scale environment, experience of storing hydrogen in porous reservoirs that include depleted oil and gas fields and saline aquifers is currently limited to H2-natural gas mixtures (town gas or syn gas with subsurface storage in Europe until the 1980′s and the recent Underground SUN Storage and Conversion projects by RAG AG in Austria).
Underground storage is widely practiced for natural gas and oil, with about 350 storage sites in the US (79% in depleted O&G fields, 11% in aquifers, 10% in salt domes) and with established regulatory guidelines in place (for natural gas storage in salt caverns [5] and natural gas storage in depleted hydrocarbon reservoirs and aquifer reservoirs [6]). The lower viscosity and higher diffusivity of H2 relative to methane or natural gas leads to a higher tendency of H2 to spread laterally in porous reservoirs with an ensuing economic risk of reduced recoverability of stored product and an enhanced physical risk of leakage. Increased lateral spread increases the probability for stored H2 to reach abandoned and leaky wells or leaking faults. These risks can be minimized by proper storage site selection with attention to trap geometry, reservoir properties, reservoir pressure monitoring and management, and caprock capacity, careful design of injection and production well geometry through reservoir simulations, and by plume and leakage monitoring during operations [4].
Pipelines are a safe and economical way for transporting large quantities of petroleum product daily, but several threats may produce the risk of pipe failure when not properly managed [7]. Some examples for disruption include corrosion, construction defects, and many others [7]. A robust risk mitigation system is required to keep Risk Factors (RF) as low as possible. Kraidi et al. [7] identified several RF’s that can affect oil and gas pipelines and grouped them into different categories. While not being considered in this study, such risk analysis should be considered in the design of hydrogen storage projects for preventing leakage and improving the safety of transporting hydrogen between the storage site and operating facilities.
While there are recent studies on numerical simulations of underground hydrogen storage, most of these focus on H2 storage in synthetic aquifer models and building an anticline with one well to inject and withdraw, with no details of the modeling of phase behavior, fluid properties, relative permeability and capillary pressure [8,9,10,11,12,13,14,15,16].
Other authors considered application in models generated from real field data but still presented no details regarding the phase behavior and fluid properties. Sainz-Garcia et al. [17] presented the numerical simulation of H2 in the San Pedro Aquifer in Spain [18]. They studied the impacts of number of producers and the locations on H2 recovery. The results of very fine grid models showed a significant water coning in one well case where the addition of a horizontal well below the cap rock reduced the water coning and multiple extraction wells increased recovery of H2. Hydrogen recovery increased from 63 to 78% by adding 3 producers in 3 years. Lysyy et al. [19] conducted numerical simulations based on the Norne field in Norway. Their simulations considered three scenarios of injecting hydrogen using one vertical well either in top gas zone, middle oil zone, or bottom water zone of the reservoir for 5 years with 7 months injection and 5 months production cycles. They injected CH4 as the cushion gas prior to H2 injection. Their results indicated a better performance if H2 is injected in the gas zone. The final H2 recoveries from gas, oil, and water zones were 87%, 77%, and 49%, respectively. They also conducted sensitivities to different mixtures of CH4 and H2 injection. Ershadnia et al. [20] presented a sensitivity study of UHS in an aquifer model named PUNQ-S3 which was constructed based on field observations by Elf exploration and production Company [21]. Some of their conclusions included that aquifers with high anisotropy ratio were more beneficial for UHS, hysteresis should be considered to avoid underestimating the residual trapping of hydrogen, and perforation placement is one of the most important parameters affecting storage efficiency. Additionally, Delshad et al. [22] performed sensitivity studies for the hydrogen storage in saline aquifers and depleted oil and gas reservoirs. However, the work from Delshad et al. [22] did not present a comparative study between the storage of hydrogen, CO2, and natural gas which is the focus of this paper.
We searched and collected publications on measured data for H2 properties such as density and viscosity as a function of temperature and pressure [23,24,25], interfacial tension with water [26,27,28], water/rock/H2 contact angle and wettability [27,29,30]; water/rock/H2-CH4 contact angle and wettability [28,31] and relative permeability and capillary pressure [32]. The impacts of geochemistry [33] and biochemistry [34,35] are also of an interest as potential loss mechanisms for stored H2. There are several research groups that have published on the large-scale geologic storage and their challenges [11,19,36].
In this paper, a non-isothermal compositional reservoir simulator was evaluated for its suitability for the hydrogen seasonal storage process in saline aquifers and depleted oil reservoirs. The Peng Robinson equation of state model [37] was successfully calibrated against published H2 density. Likewise, the LBC [38] correlation for viscosity as a function of pressure and temperature was also calibrated. The numerical simulation results for the hydrogen obtained in this study indicated that containing the stored volume of H2 (working gas) is critical for both the saline aquifer and the depleted oil reservoir. This is a consequence of hydrogen’s high mobility due to its low density and viscosity. Such containment can be achieved by integrating the selection of the storage site, while considering its geological features (i.e., faults) and the well strategy (such as location and if pump wells are required). To the best of our knowledge, this is the first time that the suitability of hydrogen storage is performed and compared in real sites that were considered for natural gas and CO2 storage using compositional reservoir simulation.
2. Materials and Methods
We selected one natural gas storage model in a depleted oil reservoir and one CO2 storage model in a saline aquifer to evaluate their suitability as hypothetical storage candidates for H2. Main goals of the simulations were to assess the H2 capacity, working volume, and cushion gas volumes. There are other factors that can impact the H2 cyclic storage such as reservoir minerology, geochemical reactions, biological reactions, interfacial tension, physical dispersion, and hysteresis effects on relative permeability and capillary pressure curves that were not included in the work presented here. Additionally, the geomechanical evaluation of the seal integrity is not considered in this work.
The cushion gas is the amount of gas that cannot be recovered and is needed to keep the reservoir pressurized. It includes both free and dissolved gas. It is important to mention that there is no free gas in the sites considered here. The consequence of this is that a portion of injected hydrogen volume is the cushion gas and is no longer recoverable. For this reason, minimizing the volume of cushion gas is the key objective of optimizations. Different gases such as Nitrogen, Methane and CO2 have been as the cushion gas [10,15,17,39,40,41,42].
2.1. Gas Storage Site in Colorado, USA
A dynamic reservoir model of a natural gas storage in a depleted oil reservoir in Colorado, USA, is chosen to perform a comparative simulation study between natural gas (NG) and hydrogen (H2) storage. Suitability of this field for gas storage suggests that it may be potentially suitable for hydrogen storage [43]. We have used a compositional reservoir simulator for this study (CMG-GEM). Two key factors are defined as primary contributors to the successful storage operation: gas containment and gas working capacity. Gas containment in the reservoir was carefully tracked over entire storage process and compared between natural gas and hydrogen storage at different timesteps of storage process. Gas working capacity was defined as the largest injected gas volume at one cycle. High gas working capacities imply that more gas could be stored in one cycle. Natural gas and hydrogen storage are mostly compared based on these two aspects. The next part of this study is an attempt to enhance hydrogen storage in terms of working capacity and containment by optimizing well locations and operational constraints. Impact of reservoir properties on loading cycle was examined in detail considering relative permeability curves, critical gas saturation, and reservoir temperature. The goal of this study was to identify the possibility of storing hydrogen in abandoned oil/gas fields and conditions under which it would be possible.
Simulation model of a depleted oil field in Colorado (production from 1953–2011) converted into natural gas storage site in 2011 was chosen to compare between storage/withdrawal of natural gas and hydrogen and its suitability for H2 storage. Two historical field waterflooding periods (1959–1966 and 1999–2011) dramatically increased in situ water saturation. About 16.4 MMSTB of water was injected in the first period, and only nominal volumes were injected in the second phase. The influence of water saturation values at the start of the H2 storage can be critical and deserves further investigation. The reservoir fluid is undersaturated black oil with 37.2 API, bubble-point pressure of 1240 psig, temperature of 194 °F and solution gas-oil ratio of 475 SCF/bbl at initial conditions. Two different rock types are present in the reservoir shown in Figure 1: channel sand with an average permeability of 400 mD at the top (shown in red) and non-channel sand (shown in blue) with an average permeability of about 10 mD.
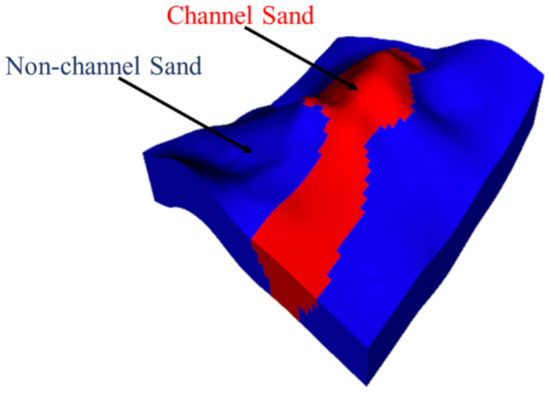
Figure 1.
Two rock types in the reservoir model—Colorado site. Adapted from [22].
The model is based on the history match of measured field production rates of oil, gas, and water, and pressure. We used the Carter-Tracy analytical aquifer model to account for the aquifer presence and its connection to the oil reservoir (arrows in Figure 2).
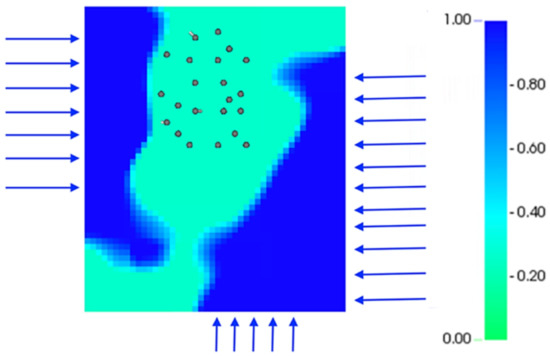
Figure 2.
Location of the wells (circles), aquifer (arrows) and water saturation at the beginning of production in 1953 for model—Colorado site.
The reservoir model gives about 25.5 MMSTB of initial oil-in-place and 8.4 BSCF of solution gas.
A detailed summary of the model is presented in Table 1. Oil/water and oil/gas relative permeability curves are shown in Figure 3. An upscaled model was considered for these simulations and we did not study the grid refinement or local grid refinement to minimize the numerical dispersion.

Table 1.
Reservoir model summary—Colorado site.
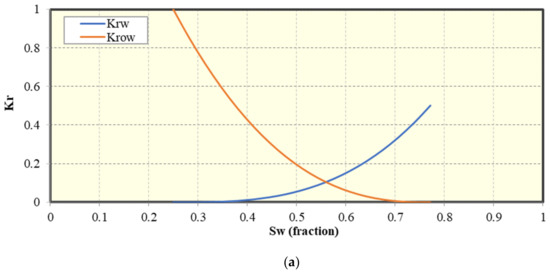
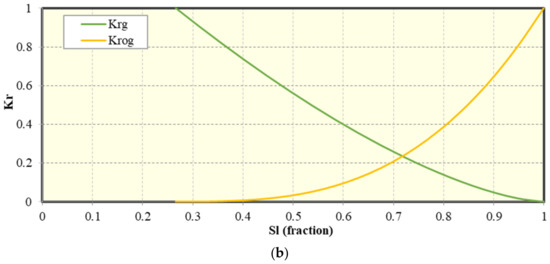
Figure 3.
Relative permeability curves (kr). (a) Oil/water vs. water saturation (Sw); and (b) oil/gas vs. total liquid saturation (Sl).
The Peng-Robinson Equation of State with 13 components was used based on produced fluid samples taken from years 1953 through 2010. Figure 4 shows oil composition of the reservoir fluid and lumping of the components.
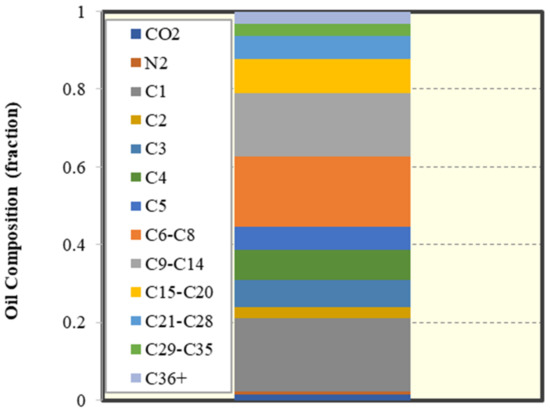
Figure 4.
Oil composition of the reservoir fluid—Colorado site.
Figure 5 shows the oil saturation at the end of the production history. Note that the average oil saturation is 10.9%, average water saturation is 88.7%, and average gas saturation is 0.4% at the beginning of gas storage operation.
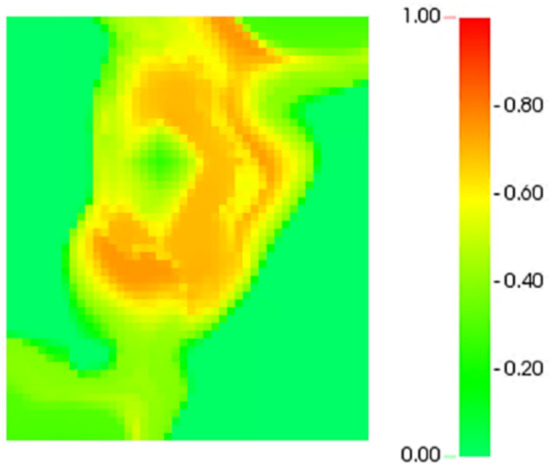
Figure 5.
Oil saturation prior to gas storage project—Colorado site.
About 19.7 MMSTB of water is injected via injection wells during waterflood operations and 7.1 MSTB of water is from the aquifer, replacing oil in the reservoir. The mobile water should be produced to free up additional pore spaces for gas storage. Hence, one of the main objectives for conversion process from abandoned oil field to gas storage site is removing as much liquids from it. Additionally, gas containment in the reservoir is another goal for an efficient gas storage as well as increasing gas working capacities. These strategies are considered to enhance hydrogen capacity.
Two different types of wells are considered to meet these objectives. The first type is injection/withdrawal (I/W) wells. These wells inject and produce gas at specified locations. Maximum well-head pressure (MAX WHP) and maximum gas injection rates (MAX STG) are used as injection constraints, while minimum well-head pressure (MIN WHP) and minimum bottom-hole pressure (MIN BHP) are utilized as withdrawal constraints. The second case is using wells equipped with electrical-submersible pumps (ESP) and defined as ‘P’ or pump wells. These wells are used to produce excess water from the reservoir and free up pore spaces for gas storage. Pump wells are constraint by the maximum liquid flow rate (MAX BHL), minimum bottom-hole pressure (MIN BHP), and maximum gas production rate (MAX STG). The gas produced from pump wells is reinjected into I/W wells, achieving a net zero gas withdrawal during the injection period.
Three cases considered for NG storage are: (1) all-vertical well case with 16 I/W wells and 8 P-wells, (2) all-horizontal well case with 5 horizontal I/W wells and 4 horizontal P wells, and (3) a case with 5 horizontal I/W wells and 8 vertical P wells. However, since the original field reports did not specify the exact locations of the wells, a new case with fewer injection wells and more pump wells was constructed to assess the impact on the working capacity. This case has 9 I/W and 15 P vertical wells to compare with hydrogen storage. Figure 6 shows well locations and Table 2 summarizes the well data. The numerical layers of 1 to 4 are where the gas is injected and reservoir fluids are extracted (referred to perforated layers in Table 2).
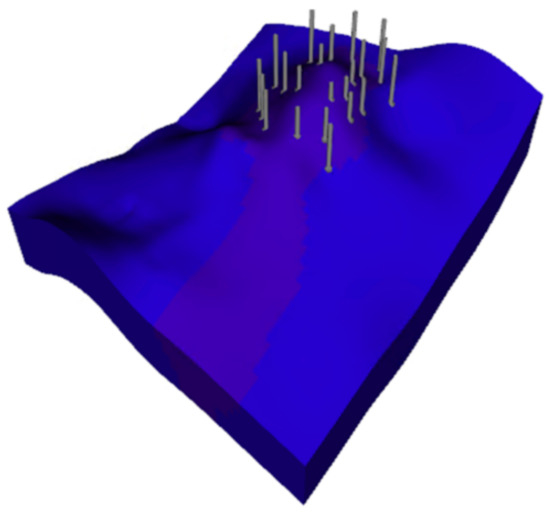
Figure 6.
Location of wells during gas storage project—Colorado site.

Table 2.
Description of I/W and Pump wells—Colorado site.
An initial twelve-month loading (fill-up) period marks the beginning of the gas storage project. Subsequently a six-month withdrawal period was simulated. The same initial fill up period that was considered for the natural gas storage was also followed for hydrogen. From that point, 3-month injection and 3-month withdrawal cycles were initiated for 5 years.
Nitrogen component of the gas phase is replaced by hydrogen in the Peng Robinson EOS model. Hydrogen fraction is zero for initial conditions and fractions of other components are re-normalized. The conversion of oil field into a hydrogen storage site is simulated using the same strategy and development plan as the NG base case.
A manual sensitivity approach for hydrogen storage is primarily focused on three aspects: well locations, completion, and orientation, reservoir properties, and injection operation. Initial case has 9 I/W wells and 15 pump wells with perforations in the first 4 numerical layers out of 6. Gas is being produced mostly from the top layers, while oil and water are produced from the lower structure. Ultimately, we studied 4 different designs for I/W and pump wells: (1) all vertical wells (initial case), (2) horizontal I/W wells and vertical pump wells, (3) vertical I/W wells and horizontal pump wells, and (4) lastly all horizontal wells. A summary of these cases is presented in Table 3. Note that Case 0-A is the base case for the natural gas storage, and Case 1-A is the base case for the hydrogen storage.

Table 3.
Well locations for optimization cases—Colorado site.
For the sensitivity studies, Case 1B from Table 3 is used as the base case. The sensitivity studies are performed on reservoir/fluid properties such as relative permeabilities, critical gas saturation, and reservoir temperature by changing their values from those used in the base case simulation. Multiphase relative permeability data present one of the biggest uncertainties in reservoir simulation. Hence, it is necessary to include different relative permeability curves in almost any modeling study to account for its uncertainty. The lack of published experimental H2 relative permeability data in the presence of both oil and water encouraged us to use measured water/H2 relative permeability curves from Yekta et al. [32] for this sensitivity case but keeping oil/gas relative permeabilities as before (Figure 7).
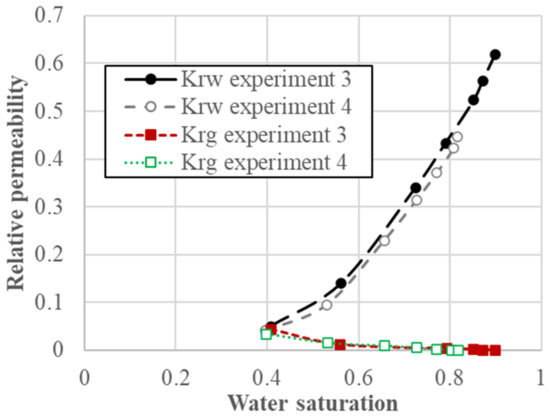
Figure 7.
H2-water relative permeabilities adapted from Yekta et al. [32]. The points refer to different experiments.
The oil relative permeability is the same as the NG case and water/gas relative permeability curves are changed according to Figure 7 to incorporate such data into three-phase relative permeability input tables. In the original model, the critical gas saturation was 0 causing an overestimated gas withdrawal rate. The critical gas saturation is a minimum saturation above which the gas phase starts flowing. A large critical gas saturation value indicates that significant hydrogen volumes are trapped in the reservoir. Four new cases are set up with critical gas saturation values from 5 to 20% to study its effects on the storage efficiency [44]. Figure 8 shows oil/gas relative permeability curves using different critical gas saturations.
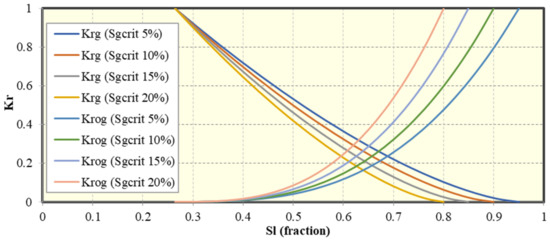
Figure 8.
Oil/gas relative permeability curves (Kr) with the modified critical gas saturation vs. liquid saturation (Sl).
The hydrogen properties such as viscosity and density are functions of the reservoir temperature and have an effect on the hydrogen spreading and distribution in the reservoir. The reservoir temperature of 244 °F is used as a sensitivity case for the phase behavior and fluid property calculations. The last step in the sensitivity studies is to alter gas injection strategies such as injection/withdrawal times, ‘soaking time’, and the time to activate pump wells. Initial cycles consist of 3-month injection/3-month of withdrawal. Two more scenarios, 6-month injection/6-month withdrawal and 10-month injection/10-month withdrawal, are also considered. However, total injection and withdrawal times are kept the same as 42-month injection/30-month withdrawal. Next, the ‘soaking time’ is modeled when there is either no gas injection or gas withdrawal, mimicking gas storage for scenarios of no hydrogen supply or demand. ‘Soaking time’ is modeled as 3-month and 6-month periods executed after 5 cycles. Lastly, activation time for the pump wells is studied and they can be active during either injection or withdrawal cycles. The initial natural gas storage design was implemented in the first case (pump wells are producing oil and water during injection cycles). The pump wells are then activated during the withdrawal cycle to compare the efficiency of pump wells during injection and withdrawal cycles. A new case is also simulated without pump wells for comparison purposes. A summary of the manual sensitivity and optimization workflow is in Figure 9.
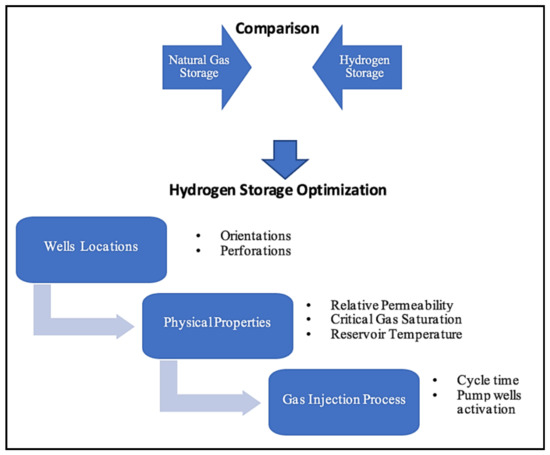
Figure 9.
Manual sensitivity and optimization workflow used in this study.
2.2. Cranfield Site, Mississippi, USA
A numerical model which was developed for modeling CO2 storage demonstration project in Cranfield formation in Mississippi, USA [45,46] is used to study the feasibility of hydrogen storage. Technical focus areas of this study are documenting hydrogen retention in the injection zone and quantifying gas working capacity. This study is intended to demonstrate the potential of using saline aquifer for hydrogen storage.
The Cranfield site is a highly heterogeneous formation composed of stacked and incised channel fills at about 10,000 feet depth in the lower Tuscaloosa formation of the cretaceous age. It consists of a simple 4-way anticline overlying a deep salt dome with a large gas cap surrounded by an oil ring (Figure 10) and has produced oil and gas between the 1940′s and 1960′s with 62 wells. A representative thickness of the hydrocarbon-bearing formation is 60 ft. CO2 injection started in July 2008. A numerical model of the field’s northern section was developed using the multiphase-flow, compositional CMG-GEM software. The interpretation of logs from old and recently drilled wells and geophysical data were used to build the model [46]. The dynamic model is history matched considering oil, gas, and water production starting from the reservoir natural state to the first CO2 injection phase. The modeling results of the production period are consistent with historical production. Due to the heterogeneous nature of the reservoir, both permeability and porosity are extremely variable (ranging from 1 mD to 1000 mD and from 10 to 30%, respectively). Figure 11 shows permeability and porosity distributions. The residual oil saturation is 0.25 and maximum residual gas saturation is 0.3. Relative permeability curves follow a Brooks-Corey model. A summary of model properties is presented in Table 4. For more details on the reservoir characterization and simulation model refer to Delshad et al. [45] and Hosseini et al. [46].
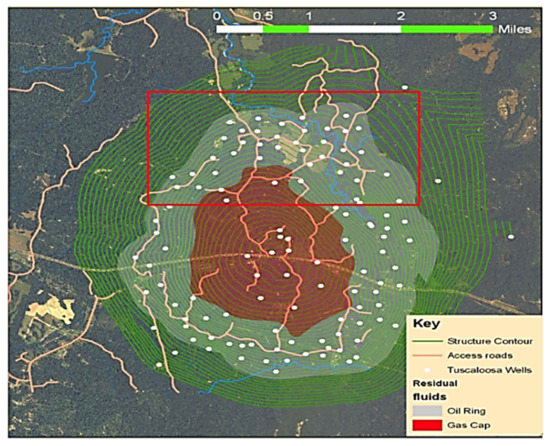
Figure 10.
Contour map of the Cranfield reservoir. Reproduced with permission from [22]. Copyright 2022 SPE.

Figure 11.
Porosity and permeability distributions—Cranfield site.

Table 4.
Cranfield numerical model description.
Seven CO2 injectors located in the Northern section of the field are activated in July 2008, totaling about 24 MMSCF/D following historical injection rates (Figure 12). Water is produced from 5 production wells. There are seven pseudo horizontal wells on the boundary of the model to account for the aquifer dynamics and maintaining a constant pressure boundary condition. Figure 13 shows location of these wells and Table 5 summarizes essential information about these wells.
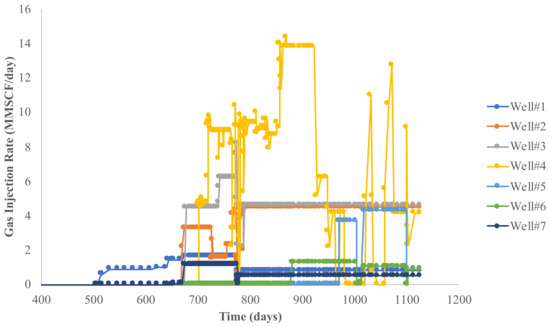
Figure 12.
Historical injection rates—Cranfield site.
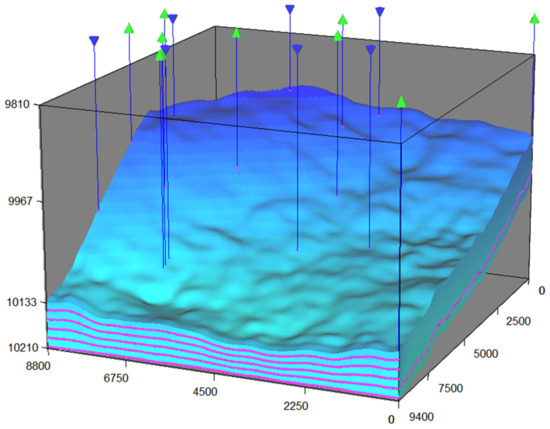
Figure 13.
Well locations—Cranfield site.

Table 5.
Well data—Cranfield site.
CO2 was then replaced with hydrogen and its injection followed the same schedule as the CO2. The difference in injection between these two gases is investigated by comparing average reservoir pressure and gas saturation. Hydrogen storage was simulated considering only one vertical injection/withdrawal well and seven boundary wells. It consisted of initial fill up (12-month injection and 6-month production), and two cycles (3-month injection and 3-month production). Hydrogen injection was constrained by a maximum bottomhole pressure of 6000 psia and maximum injection rate of 25 MMSCF/D. Additional pump wells were introduced into the model in order to speed up the hydrogen storage process. They primarily produced water during the withdrawal cycle to increase free pore space for subsequent gas injection. The effect of perforation was also studied. Table 6 presents a summary of simulation cases.

Table 6.
Description of the H2 storage cases—Cranfield site.
3. Results and Discussion
The results and discussion for the two storage sites tested here is presented next.
3.1. Gas Storage Site in Colorado
The performance of hydrogen and natural gas storage in a depleted oil field is compared by conducting compositional reservoir simulations using the commercial reservoir simulator CMG-GEM. Geochemical and biological reactions are neglected in these simulations. The key results compared are the injection volume, working capacity, and production volume. The results indicate that 10% less volume of hydrogen is injected compared to the natural gas because of the H2 properties and consequent impact on reaching the maximum wellhead pressure for the H2 case. For example, the well-head pressure reaches the imposed constraint for H2 almost 12 days earlier in the first injection cycle compared to natural gas. In other words, natural gas is injected 12 days longer at maximum rate. Moreover, 39% less working gas capacity is calculated in the last storage cycle with hydrogen compared to the natural gas because of smaller volumes injected and the difference in physical properties of the two gases (Figure 14).
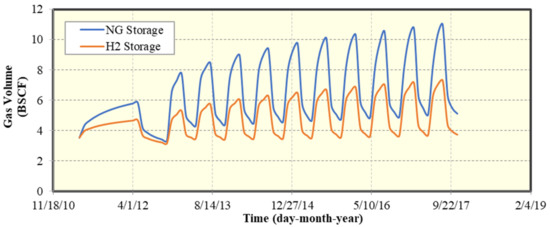
Figure 14.
Gas volumes for H2 and NG—Colorado site.
About 4.3 BSCF more hydrogen is produced and reinjected through pump wells compared to natural gas, even though more volume of natural gas is injected. Finally, during hydrogen storage 3.5% less oil volume is produced, indicating that natural gas mimics huff-n-puff enhanced oil recovery process due to partial miscibility of NG in the reservoir oil. Table 7 gives a summary of the storage performance of hydrogen and natural gas.

Table 7.
Comparison of hydrogen and natural gas storage results—Colorado site.
Gas saturation distributions at different times are provided to highlight gas containment and vertical growth of the gas saturation bubble. Figure 15 shows gas saturation at the end of initial fill-up: 14.9 BSCF of natural gas and 13.7 BSCF of hydrogen is injected. These images give insights into the development of the gravity override for both gases (layer 2 vs. layer 5 saturations) and the more spreading of hydrogen in both layers in comparison with NG.
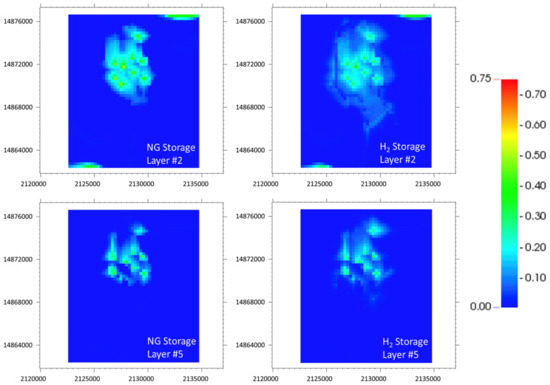
Figure 15.
Natural gas (left images) and hydrogen (right images) saturation profiles in layers 2 (top images) and 5 (bottom images) after initial fill-up cycle—Colorado site.
Figure 16 shows the NG and H2 saturation distributions at the 3rd year of operations in layers 2 and 5 to demonstrate their vertical migrations and more concentrated natural gas at the dome of the channel sand in comparison to spreading of H2 across the entire high permeability channel sand.
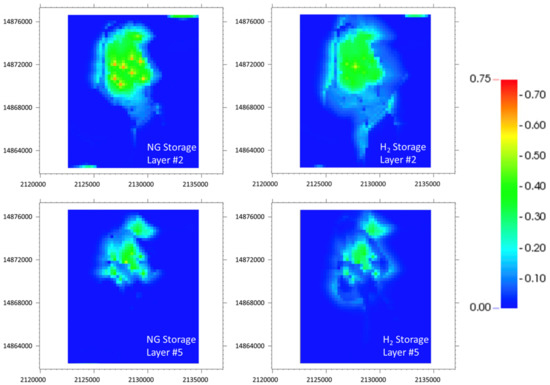
Figure 16.
H2 (right images) and NG (left images) saturation growth in the middle of storage time in layers 2 (top images) and 5 (bottom images)—Colorado site.
Figure 17 compares the NG and H2 saturations in layers 2 and 5 at the last injection cycle with working capacities of approximately 5.80 BSCF natural gas and 3.55 BSCF hydrogen. Note that natural gas with higher working capacity is still more contained within the channel sand, while hydrogen spreads almost close to the numerical model boundaries. Hydrogen is more buoyant and migrates towards the top of the dome with nearly 3% higher saturation in the top layer due to its low density.
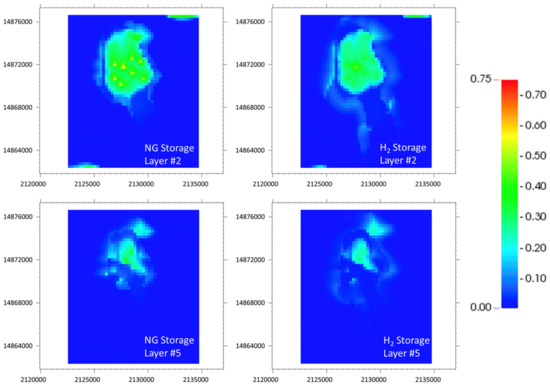
Figure 17.
H2 (right images) and NG (left images) saturation growth and containment in layers 2 (top images) and 5 (bottom images) after the last injection cycle—Colorado site.
Figure 18 comparing the saturation distributions for NG and H2 and hydrogen clearly has a larger swept volume and is less confined, and spreads through the channel sand downdip.
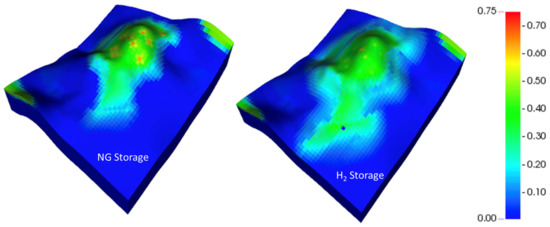
Figure 18.
NG (left image) and H2 (right image) saturation distributions after the last injection cycle—Colorado site.
Figure 19 gives the pressure distributions at the beginning and at the end of the last storage cycle. Note that the pressure transient is dominated in the channel sand shape. Pressures at both loading and extraction cycles change very little outside the channel sands during natural gas storage, while more pressurization occurs during hydrogen injection.
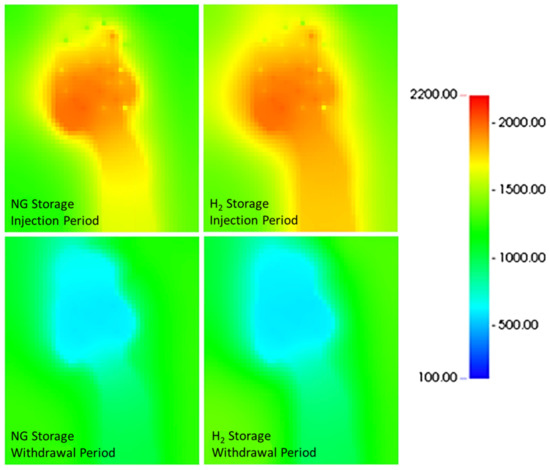
Figure 19.
Pressure distribution in psi after the last injection (top images) and withdrawal (bottom images) cycles for NG (left side images) and H2 (right side images)—Colorado site.
In addition to comparing gas working capacities, gas withdrawal as a fraction of the previously injected gas volume is also calculated. Gas withdrawal values indicate the fraction of injected gas that is produced in one cycle. For example, H2 withdrawal rate increased from 91% after the second cycle to 99% after the last cycle compared to 77 and 99% for NG. Initial cycles of storage are less effective for both gases, more gas remains in the reservoir, and cushion gas volumes increase. However, 99% of both gases is produced in the last storage cycle.
The cushion gas is defined as the volume of gas in the reservoir including the solution gas. A greater cushion gas volume of about 5.10 BSCF is obtained for natural gas compared to only 3.72 BSCF for H2 (Figure 20) for the base case. Figure 21 shows hydrogen mole fraction in produced gas from withdrawal wells with a reduction of 94 to 50% in the first cycle. However, the H2 concentration is always above 90% in all subsequent cycles. Moreover, hydrogen composition in produced gas is more than 99% in the last withdrawal cycle, more hydrogen remains in the reservoir initially but almost all the injected hydrogen is produced back in the last cycles. The high purity of the hydrogen produced is the lack of free initial gas. Hence, the purity of produced hydrogen can only be reduced by vaporized water and oil components.
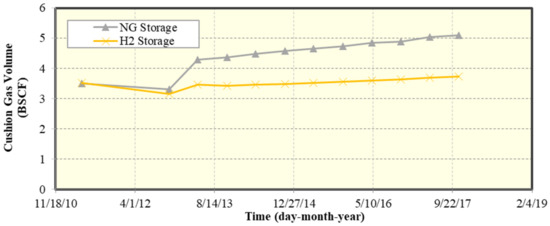
Figure 20.
Cushion gas volumes during natural gas and hydrogen storage—Colorado site.
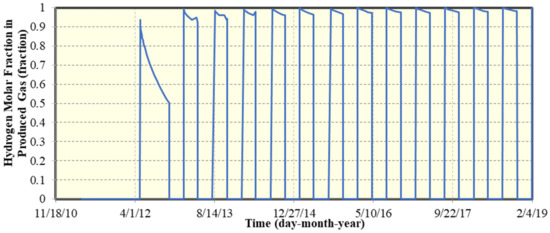
Figure 21.
Hydrogen molar fraction in produced gas from withdrawal wells—Colorado site.
The next step is to optimize hydrogen storage to increase working capacity and hydrogen containment within the high permeability channel sand. Well location sensitivity simulations indicate that injected gas and recycled gas volumes are strongly dependent on well configuration. More than 50% change in injected gas volume and 38% change in recycled gas volume is achieved by optimizing well locations. However, such a big difference in injected gas volumes did not indicate any injectivity issues in the model since injected gas consists of hydrogen from a hypothetical production plant and hydrogen is produced through pump wells and reinjected. The most effective hydrogen storage strategy is believed to be the case with the lowest injected volumes, lowest recycled volumes, and highest working capacity. This strategy has most likely a lower compression cost. The changes in cumulative water and oil volumes are 6 and 5% accordingly. The highest gas working capacity is 4.20 BSCF for Case 2B and the lowest is 1.17 BSCF for Case 2A. However, working capacities in other cases are close with a maximum difference of 0.54 BSCF. Table 8 presents well location sensitivity results.

Table 8.
Summary of well location sensitivity and manual optimization results—Colorado site.
Sensitivity simulations indicate that relative permeability curves have the greatest impact on the storage performance. The changes in relative permeability curves cause higher injected volumes, less recycled gas volumes, higher cumulative water and oil production, and 69% less working capacity. Critical gas saturation and reservoir temperature have minor impact on injected, recycled, working capacity, and cumulative water productions. However, critical gas saturation had significant impact on cumulative oil production, increasing it by 25% for 20% critical gas saturation compared to the value of zero in the base case (Table 9).

Table 9.
Physical property and temperature sensitivity simulation results—Colorado site.
Sensitivity studies on gas injection operational parameters suggest that the number of injection/withdrawal cycles in a fixed period of storage has a moderate effect on final hydrogen storage. There is a reduction of 11.2% (6/6-month case) and 14.6% (10/10-month case) in gas volumes. Recycled gas volumes and cumulative water and oil productions remain almost the same. However, working capacity increased by 9% (6/6-month case) and 12% (10/10-month case). The soaking time has no effect on final hydrogen performance. On the other hand, activating the pump wells has a considerable effect on storage results. There is an 26% increase in working capacity and 65% reduction in injected gas volumes when pump wells are activated during the withdrawal cycle. The activation of pump wells during withdrawal period seems more efficient to store hydrogen for this case. Withdrawal and pump wells produce both hydrogen and water during the withdrawal period creating a more favorable storage conditions by creating more free space in the reservoir for the next hydrogen injection period. A new case without pump wells is simulated to assess the benefits of pump wells. The results show reduction of 53% for gas working capacity and 87% for injected gas volume (Table 10).

Table 10.
Summary of sensitivity results on gas operational parameters—Colorado site.
For the Colorado site, the following insights were obtained:
- Stored hydrogen volume is smaller than that of the natural gas for the reference case. Maximum working capacity of hydrogen is about 39% lower than the natural gas since the increase in pressure is much faster with hydrogen causing a reduction in injection rate. Less injected gas volumes lead to smaller working capacity, more hydrogen is produced via pump wells and recycled to reduce the net injection volume requirement.
- There is a substantial difference in saturation distributions of the two gases. Natural gas is contained within the channel sand in anticline structure and hydrogen spreads throughout the storage process resulting noticeable differences in gas distribution in top layers. H2 saturation front almost reaches the model boundaries by the last cycle indicating that it is more challenging to confine H2 in reservoirs with geological characteristics as of this study site. Hydrogen is more mobile and buoyant and the natural gas storage strategies may not be optimum for the hydrogen storage. Hydrogen working capacity is increased by optimizing well completions, a longer storage period (i.e., 6.5 yrs of reference case to 13.5 yrs), and activating pump wells during the unload cycles.
- Physical properties and injection well operational constraints can have significant impacts on the storage efficiency. Relative permeabilities and the time of activating pump wells have the greatest impact on storage process. Relative permeability curves need to be measured for the relevant fluid systems. The activation of pump wells during withdrawal period significantly increases hydrogen working capacity. The benefits of pump wells during withdrawal period to speed up gas storage and increase working capacities need to be considered for each storage site.
3.2. Cranfield, Mississippi
The average reservoir pressure is slightly higher during hydrogen injection compared to CO2 (Figure 22). This observation suggests that pressure build ups faster with hydrogen injection and injection well constraint is reached earlier compared to either natural gas or CO2 injection. CO2 is well contained around injection wells, while hydrogen spreads in the entire reservoir model and approaches the model boundary by the end of injection cycle (Figure 23).
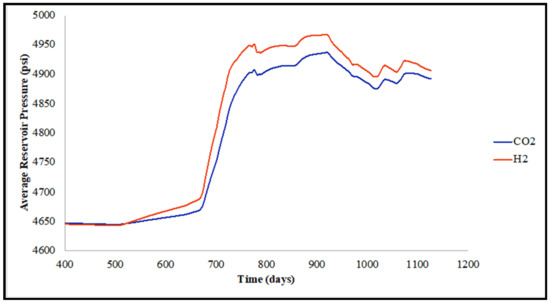
Figure 22.
Comparison of average reservoir pressure during injection of CO2 vs. H2—Cranfield site.
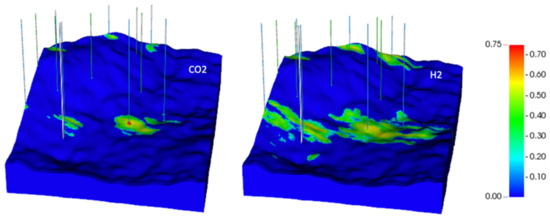
Figure 23.
CO2 (left image) and H2 (right image) saturations at the end of injection—Cranfield site.
About 13.56 BSCF of hydrogen is injected but only about 66% is produced with working capacity of 2.25 BSCF in the last cycle. The well perforations have minimal effect on hydrogen storage (Table 11). The pump wells also had negligible effect on total gas volume injected and working capacity. However, since the pump wells produced both water and H2, the produced gas volume is about 2 BSCF greater than the Case 1. Hydrogen reaches the boundaries of the model in all three cases (Figure 24). Note the difference in saturation between layers 4 and 11, indicating vertical movement of hydrogen. Additionally, hydrogen was spreading even more in Case#3 because pump wells created additional free pore space by producing water. Figure 25 shows 3D view of the model along with hydrogen saturation in the end of storage process, indicating severe spreading of gas. This propagation might be because of the presence of boundary wells, which produced water in order to keep constant pressure at the edges of model. Finally, we have also observed very low solubilization of hydrogen into the aqueous phase.

Table 11.
Summary of the hydrogen storage cases.
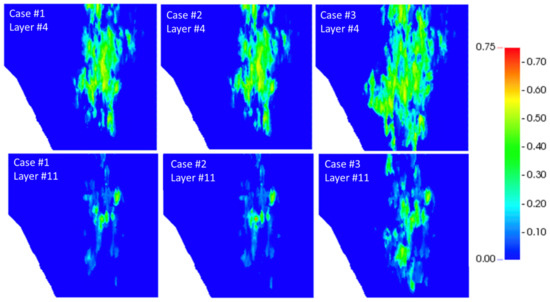
Figure 24.
H2 saturation distributions in layer 4 (top images) and layer 11 (bottom images) at the end of last injection cycle for cases 1–3 (left to right).
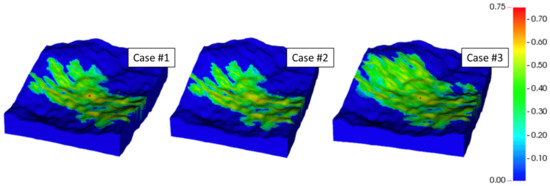
Figure 25.
H2 saturation distributions in last injection cycle for Cases 1–3 (left to right).
4. Summary and Conclusions
The simulation results indicated that hydrogen spreads more laterally in both saline aquifer and natural gas cases compared to both CO2 and natural gas and there is a need to optimize the well operations for efficient H2 cyclic injection/production. The benefit of using pump wells to improve the working gas capacity was demonstrated. The numerical simulation results indicated that containing the stored volume of H2 (working gas) is critical for both the saline aquifer and the depleted oil reservoir. This is a consequence of hydrogen’s high mobility due to its low density and viscosity. Such containment can be achieved by integrating the selection of the storage site, while considering its geological features (i.e., faults) and the well strategy (such as location and if pump wells are required). The reservoir properties and the geological features for example faults, natural fractures, and caprock properties are also critical parameters for the site selections but are not included in this paper.
Some conclusions based on the two cases studied here regarding the comparison between the depleted oil reservoir and the saline aquifer, while neglecting the potential impacts on seal integrity (geomechanics), geochemical, and biological impacts on H2 injectivity and H2 loss in these formations, are:
- Modeling of H2 injection in saline aquifer is simpler with respect to phase behavior, physical properties, and analysis of residual trapping and dissolution compared to the depleted oil or gas reservoirs.
- Both aquifer and depleted oil reservoir have significant storage and deliverability capacity.
- Reservoir structure and high permeability channel in the depleted oil reservoir require additional wells to contain the hydrogen.
- The cushion gas is higher in the aquifer case (4.57 BSCF against 3.72 BSCF for the depleted oil case).
- We might be limited in the number of withdrawal wells in saline aquifer cases whereas existing wells in depleted oil and gas fields can be utilized pending a careful evaluation of integrity of the legacy wells.
- Presence of reliable caprock/seal needs to be evaluated in saline aquifer cases.
Despite the vast experiences in storing CO2 and natural gas in different geological settings of saline aquifers and depleted oil/gas reservoirs, H2 storage has its own challenges, and more research and development is needed to select, design, and execute efficient and safe storage projects. Some of these challenges and future research studies are:
- Impact of H2 properties on swept volume and its containment in contrast to carbon dioxide and methane storage.
- Physical properties and injection well operational constraints have significant impacts on the storage efficiency. Relative permeabilities and the time of activating pump wells will have the greatest impact on the storage process. Relative permeability curves need to be measured for the relevant fluid systems.
- Suitability of saline aquifers compared to depleted oil or gas reservoirs considering storage integrity, mixed gases, and potential impact of H2 on rock properties.
- Managing large variations in volumes/rates to load and unload.
- Impact of H2 purity on fluid separation and transport.
Author Contributions
Conceptualization, M.D.; Methodology and investigation, M.D., P.E. and Y.U.; Writing—original draft, M.D. and Y.U.; Writing—review and editing, M.D., K.S. and B.R.B.F.; Supervision, M.D., P.E. and K.S.; Funding acquisition, M.D., P.E. and K.S. All authors have read and agreed to the published version of the manuscript.
Funding
This research was funded by the Hildebrand Seed Money Program from the Hildebrand Department of Petroleum Engineering from The University of Texas at Austin.
Data Availability Statement
The data are not publicly available due to confidentiality restrictions.
Conflicts of Interest
The authors declare no conflict of interest.
References
- Hydrogen Production: Natural Gas Reforming. Available online: https://www.energy.gov/eere/fuelcells/hydrogen-production-natural-gas-reforming (accessed on 19 September 2022).
- Forsberg, C.W. Assessment of Nuclear-Hydrogen Synergies with Renewable Energy Systems and Coal Liquefaction Processes; Oak Ridge National Laboratory: Oak Ridge, TN, USA, 2006.
- RAG Austria AG–Energy Storage–RAG’s Energy World. Available online: https://www.rag-austria.at/en/rags-energy-world/energy-storage.html (accessed on 19 September 2022).
- Eichhubl, P. Assessing Risk of Geological Hydrogen Storage; Bureau of Economic Geology, The University of Texas at Austin: Austin, TX, USA, 2022. [Google Scholar]
- American Petroleum Institute. API RP 1170 Design and Operation of Solution-Mined Salt Caverns Used for Natural Gas Storage, 1st ed.; API: Washington, DC, USA, 2015. [Google Scholar]
- American Petroleum Institute. API RP 1171 Functional Integrity of Natural Gas Storage in Depleted Hydrocarbon Reservoirs and Aquifer Reservoirs, 1st ed.; API: Washington, DC, USA, 2015. [Google Scholar]
- Kraidi, L.; Shah, R.; Matipa, W.; Borthwick, F. An Investigation of Mitigating the Safety and Security Risks Allied with Oil and Gas Pipeline Projects. J. Pipeline Sci. Eng. 2021, 1, 349–359. [Google Scholar] [CrossRef]
- Panfilov, M.; Gravier, G.; Fillacier, S. Underground Storage of H2 and H2-CO2-CH4 Mixtures. In Proceedings of the ECMOR X—10th European Conference on the Mathematics of Oil Recovery, Amsterdam, The Netherlands, 4–7 September 2006; European Association of Geoscientists & Engineers: Amsterdam, The Netherlands, 2006. [Google Scholar]
- Ebigbo, A.; Golfier, F.; Quintard, M. A Coupled, Pore-Scale Model for Methanogenic Microbial Activity in Underground Hydrogen Storage. Adv. Water Resour. 2013, 61, 74–85. [Google Scholar] [CrossRef]
- Hagemann, B.; Rasoulzadeh, M.; Panfilov, M.; Ganzer, L.; Reitenbach, V. Mathematical Modeling of Unstable Transport in Underground Hydrogen Storage. Environ. Earth Sci. 2015, 73, 6891–6898. [Google Scholar] [CrossRef]
- Pfeiffer, W.T.; Bauer, S. Subsurface Porous Media Hydrogen Storage—Scenario Development and Simulation. Energy Procedia 2015, 76, 565–572. [Google Scholar] [CrossRef]
- Pfeiffer, W.T.; Al Hagrey, S.A.; Köhn, D.; Rabbel, W.; Bauer, S. Porous Media Hydrogen Storage at a Synthetic, Heterogeneous Field Site: Numerical Simulation of Storage Operation and Geophysical Monitoring. Environ. Earth Sci. 2016, 75, 1177. [Google Scholar] [CrossRef]
- Hagemann, B.; Rasoulzadeh, M.; Panfilov, M.; Ganzer, L.; Reitenbach, V. Hydrogenization of Underground Storage of Natural Gas: Impact of Hydrogen on the Hydrodynamic and Bio-Chemical Behavior. Comput. Geosci. 2016, 20, 595–606. [Google Scholar] [CrossRef]
- Heinemann, N.; Scafidi, J.; Pickup, G.; Thaysen, E.M.; Hassanpouryouzband, A.; Wilkinson, M.; Satterley, A.K.; Booth, M.G.; Edlmann, K.; Haszeldine, R.S. Hydrogen Storage in Saline Aquifers: The Role of Cushion Gas for Injection and Production. Int. J. Hydrog. Energy 2021, 46, 39284–39296. [Google Scholar] [CrossRef]
- Pfeiffer, W.T.; Beyer, C.; Bauer, S. Hydrogen Storage in a Heterogeneous Sandstone Formation: Dimensioning and Induced Hydraulic Effects. Pet. Geosci. 2017, 23, 315–326. [Google Scholar] [CrossRef]
- Feldmann, F.; Hagemann, B.; Ganzer, L.; Panfilov, M. Numerical Simulation of Hydrodynamic and Gas Mixing Processes in Underground Hydrogen Storages. Environ. Earth Sci. 2016, 75, 1165. [Google Scholar] [CrossRef]
- Sainz-Garcia, A.; Abarca, E.; Rubi, V.; Grandia, F. Assessment of Feasible Strategies for Seasonal Underground Hydrogen Storage in a Saline Aquifer. Int. J. Hydrog. Energy 2017, 42, 16657–16666. [Google Scholar] [CrossRef]
- Zivar, D.; Kumar, S.; Foroozesh, J. Underground Hydrogen Storage: A Comprehensive Review. Int. J. Hydrog. Energy 2021, 46, 23436–23462. [Google Scholar] [CrossRef]
- Lysyy, M.; Fernø, M.; Ersland, G. Seasonal Hydrogen Storage in a Depleted Oil and Gas Field. Int. J. Hydrog. Energy 2021, 46, 25160–25174. [Google Scholar] [CrossRef]
- Ershadnia, R.; Singh, M.; Mahmoodpour, S.; Meyal, A.; Moeini, F.; Hosseini, S.A.; Sturmer, D.M.; Rasoulzadeh, M.; Dai, Z.; Soltanian, M.R. Impact of Geological and Operational Conditions on Underground Hydrogen Storage. Int. J. Hydrog. Energy 2022, in press. [CrossRef]
- Floris, F.J.T.; Bush, M.D.; Cuypers, M.; Roggero, F.; Syversveen, A.-R. Methods for Quantifying the Uncertainty of Production Forecasts: A Comparative Study. Pet. Geosci. 2001, 7, S87–S96. [Google Scholar] [CrossRef]
- Delshad, M.; Alhotan, M.; Batista Fernandes, B.R.; Umurzakov, Y.; Sepehrnoori, K. Pros and Cons of Saline Aquifers Against Depleted Hydrocarbon Reservoirs for Hydrogen Energy Storage. In Proceedings of the SPE Annual Technical Conference and Exhibition, Houston, TX, USA, 3 October 2022; SPE: Houston, TX, USA, 2022; p. D012S071R002. [Google Scholar]
- Lemmon, E.W.; Huber, M.L.; Leachman, J.W. Revised Standardized Equation for Hydrogen Gas Densities for Fuel Consumption Applications. J. Res. Natl. Inst. Stand. Technol. 2008, 113, 341. [Google Scholar] [CrossRef]
- Thermophysical Properties of Fluid Systems. Available online: https://webbook.nist.gov/chemistry/fluid/ (accessed on 19 September 2022).
- Hassanpouryouzband, A.; Joonaki, E.; Edlmann, K.; Heinemann, N.; Yang, J. Thermodynamic and Transport Properties of Hydrogen Containing Streams. Sci. Data 2020, 7, 222. [Google Scholar] [CrossRef]
- Hassanpouryouzband, A.; Joonaki, E.; Edlmann, K.; Haszeldine, R.S. Offshore Geological Storage of Hydrogen: Is This Our Best Option to Achieve Net-Zero? ACS Energy Lett. 2021, 6, 2181–2186. [Google Scholar] [CrossRef]
- Hashemi, L.; Glerum, W.; Farajzadeh, R.; Hajibeygi, H. Contact Angle Measurement for Hydrogen/Brine/Sandstone System Using Captive-Bubble Method Relevant for Underground Hydrogen Storage. Adv. Water Resour. 2021, 154, 103964. [Google Scholar] [CrossRef]
- Higgs, S.; Da Wang, Y.; Sun, C.; Ennis-King, J.; Jackson, S.J.; Armstrong, R.T.; Mostaghimi, P. In-Situ Hydrogen Wettability Characterisation for Underground Hydrogen Storage. Int. J. Hydrog. Energy 2022, 47, 13062–13075. [Google Scholar] [CrossRef]
- Ali, M.; Jha, N.K.; Al-Yaseri, A.; Zhang, Y.; Iglauer, S.; Sarmadivaleh, M. Hydrogen Wettability of Quartz Substrates Exposed to Organic Acids; Implications for Hydrogen Geo-Storage in Sandstone Reservoirs. J. Pet. Sci. Eng. 2021, 207, 109081. [Google Scholar] [CrossRef]
- Hosseini, M.; Fahimpour, J.; Ali, M.; Keshavarz, A.; Iglauer, S. Hydrogen Wettability of Carbonate Formations: Implications for Hydrogen Geo-Storage. J. Colloid Interface Sci. 2022, 614, 256–266. [Google Scholar] [CrossRef] [PubMed]
- Hashemi, L.; Boon, M.; Glerum, W.; Farajzadeh, R.; Hajibeygi, H. A Comparative Study for H2–CH4 Mixture Wettability in Sandstone Porous Rocks Relevant to Underground Hydrogen Storage. Adv. Water Resour. 2022, 163, 104165. [Google Scholar] [CrossRef]
- Yekta, A.E.; Manceau, J.-C.; Gaboreau, S.; Pichavant, M.; Audigane, P. Determination of Hydrogen–Water Relative Permeability and Capillary Pressure in Sandstone: Application to Underground Hydrogen Injection in Sedimentary Formations. Transp. Porous Media 2018, 122, 333–356. [Google Scholar] [CrossRef]
- Ebrahimiyekta, A. Characterization of Geochemical Interactions and Migration of Hydrogen in Sandstone Sedimentary Formations: Application to Geological Storage. Ph.D. Thesis, Earth Sciences Institute, Université d’Orléans, Orléans, France, 2017. [Google Scholar]
- Thaysen, E.M.; McMahon, S.; Strobel, G.J.; Butler, I.B.; Ngwenya, B.T.; Heinemann, N.; Wilkinson, M.; Hassanpouryouzband, A.; McDermott, C.I.; Edlmann, K. Estimating Microbial Growth and Hydrogen Consumption in Hydrogen Storage in Porous Media. Renew. Sustain. Energy Rev. 2021, 151, 111481. [Google Scholar] [CrossRef]
- Eddaoui, N.; Panfilov, M.; Ganzer, L.; Hagemann, B. Impact of Pore Clogging by Bacteria on Underground Hydrogen Storage. Transp. Porous Media 2021, 139, 89–108. [Google Scholar] [CrossRef]
- Heinemann, N.; Alcalde, J.; Miocic, J.M.; Hangx, S.J.T.; Kallmeyer, J.; Ostertag-Henning, C.; Hassanpouryouzband, A.; Thaysen, E.M.; Strobel, G.J.; Schmidt-Hattenberger, C.; et al. Enabling Large-Scale Hydrogen Storage in Porous Media–the Scientific Challenges. Energy Environ. Sci. 2021, 14, 853–864. [Google Scholar] [CrossRef]
- Peng, D.-Y.; Robinson, D.B. A New Two-Constant Equation of State. Ind. Eng. Chem. Fundam. 1976, 15, 59–64. [Google Scholar] [CrossRef]
- Lohrenz, J.; Bray, B.G.; Clark, C.R. Calculating Viscosities of Reservoir Fluids From Their Compositions. J. Pet. Technol. 1964, 16, 1171–1176. [Google Scholar] [CrossRef]
- Kanaani, M.; Sedaee, B.; Asadian-Pakfar, M. Role of Cushion Gas on Underground Hydrogen Storage in Depleted Oil Reservoirs. J. Energy Storage 2022, 45, 103783. [Google Scholar] [CrossRef]
- Muhammed, N.S.; Haq, B.; Al Shehri, D.; Al-Ahmed, A.; Rahman, M.M.; Zaman, E. A Review on Underground Hydrogen Storage: Insight into Geological Sites, Influencing Factors and Future Outlook. Energy Rep. 2022, 8, 461–499. [Google Scholar] [CrossRef]
- Pfeiffer, W.T.; Bauer, S. Comparing Simulations of Hydrogen Storage in a Sandstone Formation Using Heterogeneous and Homogenous Flow Property Models. Pet. Geosci. 2019, 25, 325–336. [Google Scholar] [CrossRef]
- Wang, G.; Pickup, G.; Sorbie, K.; Mackay, E. Numerical Modelling of H2 Storage with Cushion Gas of CO2 in Subsurface Porous Media: Filter Effects of CO2 Solubility. Int. J. Hydrog. Energy 2022, 47, 28956–28968. [Google Scholar] [CrossRef]
- Delshad, M.; Mehrabi, M.; Ganjdanesh, R.; Eichhubl, P.; Umurzakov, Y.; Sepehrnoori, K. Simulations of Hydrogen Storage in Sedimentary Geologic Formations. GeoGulf Trans. 2021, 71, 45–53. [Google Scholar]
- Sidiq, H.; Amin, R.; Kennaird, T. The Study of Relative Permeability and Residual Gas Saturation at High Pressures and High Temperatures. Adv. Geo-Energy Res. 2017, 1, 64–68. [Google Scholar] [CrossRef]
- Delshad, M.; Kong, X.; Tavakoli, R.; Hosseini, S.A.; Wheeler, M.F. Modeling and Simulation of Carbon Sequestration at Cranfield Incorporating New Physical Models. Int. J. Greenh. Gas Control 2013, 18, 463–473. [Google Scholar] [CrossRef]
- Hosseini, S.A.; Lashgari, H.; Choi, J.W.; Nicot, J.-P.; Lu, J.; Hovorka, S.D. Static and Dynamic Reservoir Modeling for Geological CO2 Sequestration at Cranfield, Mississippi, USA. Int. J. Greenh. Gas Control 2013, 18, 449–462. [Google Scholar] [CrossRef]
Publisher’s Note: MDPI stays neutral with regard to jurisdictional claims in published maps and institutional affiliations. |
© 2022 by the authors. Licensee MDPI, Basel, Switzerland. This article is an open access article distributed under the terms and conditions of the Creative Commons Attribution (CC BY) license (https://creativecommons.org/licenses/by/4.0/).