Review

A Survey of Diagnostic and Condition Monitoring of Metal Oxide Surge Arrester in the Power Distribution Network

1
School of Electrical and Computer Engineering, College of Engineering, University of Tehran, Tehran 1439957131, Iran
2
Clinical-Laboratory Center of Power System & Protection, Faculty of Intelligent Systems Engineering and Data Science, Persian Gulf University, Bushehr 7516913817, Iran
3
Center for Energy Informatics, The Maersk Mc-Kinney Moller Institute, University of Southern Denmark, 5230 Odense, Denmark
*
Authors to whom correspondence should be addressed.
Energies 2022, 15(21), 8091; https://doi.org/10.3390/en15218091
Submission received: 19 September 2022 / Revised: 16 October 2022 / Accepted: 19 October 2022 / Published: 31 October 2022

Abstract

:
Metal oxide surge arresters (MOSAs) are a popular solution for dealing with overvoltages due to lightning and switching in power distribution networks. As a result, a MOSA’s performance and longevity have a significant impact on the quality of energy and the frequency of outages. A MOSA performance is determined by several elements such as leakage current, partial discharge, and thermal image measured in various ways. In this study, different techniques for diagnostic and condition monitoring of MOSAs are discussed, and each method’s advantages and disadvantages are investigated. Additionally, the results of practical tests on two 20 kV healthy and degraded MOSAs are investigated and compared.

1. Introduction

One of the common distribution system vulnerabilities that negatively impact equipment is overvoltage brought on by lightning, switching capacitor banks, and ferroresonance. In such circumstances, the system’s operation may be jeopardized, leading to economic loss and consumers’ dissatisfaction. Surge arresters are frequently used in the distribution system to address overvoltage concerns and mitigate their potential drastic consequences [1,2]. Among the various arrester kinds, gas-filled arresters can be addressed. They are used to protect electronic equipment and work by electrically breaking down gas while regulating overvoltages on the equipment. The electrical stresses that are applied to this protective equipment determine how long it will last, and estimating those stresses and lifetime is an interesting area of research [3,4]. In this paper, a MOSA is investigated, as it is the most frequently used currently on the market. This is due to its high nonlinearity and quick performance under overvoltage [5,6]. The arrester similar to all engineering systems is vulnerable to different faults and harms. These faults could be due to thermal stresses, aging, and mistakes in the selection and installation of the arrester. Additionally, the location of surge arresters is important for protection and good performance [7,8,9]. Some of the criteria used to assess the health of arresters include the leakage-current measurement, investigating the surge arrester characteristics in fast transient voltage, and partial discharge. Additionally, thermal imaging is one of the most used ways to diagnose the fault in the surge arrester [10,11]. The leakage current can be evaluated in a variety of ways, such as investigating the amplitude of the leakage current, analysis of the total leakage-current harmonics, power loss, the study of resistive leakage current’s third order harmonic, and the capacitive current compensation method. In addition to those previously mentioned, there are methods such as arrester temperature and electromagnetic field measurements that are used for the online testing of arresters [12,13,14]. A laboratory lightning model or fast keying is utilized to examine the specifications of the surge arrester in fast transient voltage. For this, a model of lightning to the arrester is applied, and by analyzing the voltage-time curve, the arrester’s ability to control overvoltage is determined [15]. The performance of the surge arrester can be impacted by environmental conditions such as humidity. Although metal oxide arresters are more moisture-resistant than silicon carbide, moisture’s impact cannot be entirely ignored [16]. The partial discharge test is an efficient method for figuring out how moist the lightning arrester’s interior is. Furthermore, the arrester’s internal current and the varistor’s deterioration are brought on by partial discharge and moisture. As a result, it is important to pay attention to partial discharge in order to ensure the arrester’s lifetime and functionality [11,17]. Additionally, ultraviolet (UV) radiation is one of the environmental parameters that reduce a lightning arrester’s lifespan, and depending on the environment in which the arrester is located, various pollutions affect its lifespan [18]. To carry out different tests and to determine the considered conditions, these parameters can also be produced in a laboratory. Additionally, the arrester can be exposed to a lightning sequence to age it and examine the already mentioned criteria [12,19].
Tests can be categorized into online and offline. In online tests, the object is under the operating voltage and the equipment does not have to be removed from the system. Even though the test is not very accurate in this situation, it is useful for early fault detection. Offline testing is costly but reliable, and it works best in lab situations and sensitive cases [20,21].
In this study, multiple papers have been reviewed and compared. Various approaches to evaluate the condition of MOSAs are reviewed. These methods include the thermal image, partial discharge, electromagnetic field, total leakage current, resistive and capacitive components of leakage current, V-I characteristic, reference voltage, and power loss. The advantages and disadvantages of each method are investigated and the effects of environmental and electrical factors including temperature, ambient humidity, internal humidity, pollution, UV radiation, voltage amplitude, voltage harmonics, object emissivity, and sealing loss on MOSA indicators are studied. Additionally, the results of tests performed in the High Voltage Laboratory of the Clinical-Laboratory Center of Power System & Protection of Persian Gulf University are used as a supplement for references in this article, and the practical test results on healthy and degraded MOSAs are investigated and compared.
The approaches discussed in the current article are described in Table 1 together with information on the methods utilized in other papers.
Regarding the rest of the paper, firstly, in Section 2, the faults related to MOSAs have been discussed; in Section 3, different methods to evaluate MOSAs are explained and the results of practical tests are presented. In Section 4, the conclusions relevant to the subjects are given.

2. Failures

In this section, the causes of typical MOSA failures and the problems that may occur from these failures are investigated. These failures include internal humidity, superficial pollution, sealing loss, non-uniform voltage distribution, overvoltage due to switching, magnitude and duration of an excessive lightning surge, varistor degradation, and varistor displacement [11,21,28,29,30,31,32].
Furthermore, in [21,28,29,30], methods for simulating MOSA failures in a laboratory environment are mentioned, and their explanations are presented in the relevant parts of each MOSA failure in this paper.

2.1. Internal Humidity

MOSAs may experience internal humidity as a result of sealing failures that happened during production, or as a result of sealing loss brought on by the equipment’s aging process naturally. Internal humidity causes a number of problems, but the main one is the incidence of partial discharge brought on by the creation of water vapor inside the arrester.
In the simulation of this type of failure, the arresters were opened, and water was sprayed into the varistor column. After that, the MOSA was closed.

2.2. Superficial Pollution

Pollution in MOSA housing is the cause of this problem. This is a common problem at several substations, particularly those near the coast or in heavily industrialized areas. When contamination on arresters is discovered early, it can be remedied by washing the surface. Permanent failures, such as the early deterioration of the varistors, may happen as a result of the high heating if the issues persist for a long period.
Salt moisture was sprayed on the whole porcelain of the surge arrester to simulate this failure.

2.3. Sealing Loss

Sealing loss occurs when there is no longer a physical barrier between the surge arrester’s inner and environment, allowing gases to flow. Due to the flow of gases, the loss of physical isolation between the interior of the MOSA and the environment causes changes in the arrester’s heating and electrical characteristics.
The sealing loss was artificially produced in the lab by establishing communication routes between the environment and the interior of the arrester, permitting the flow of gases.

2.4. Non-Uniform Voltage Distribution

Surface pollution on the arresters or problems with the arrester design results in a non-uniform voltage distribution on the arrester components, which may lead to a malfunction. Electrical fields that are concentrated near high-voltage terminals or in more polluted areas cause varistors to prematurely degrade.
In the simulation of this form of failure, a number of assemblies with internal short-circuited varistors was used, changing the way the electrical field was distributed along the arrester.

2.5. Overvoltage due to Switching

Surge arrester failure can occur as a result of a mismatch between the system voltage rating and the surge arrester voltage rating. Therefore, it is important to properly measure the dimensions of the surge arrester, considering the topography of the overhead lines, the grounding arrangement, and the potential short-circuit current.

2.6. Excessive Lightning Surge Magnitude and Duration

A surge arrester with a greater nominal discharge current, basic impulse level, and line discharge class should be taken into consideration for areas that are more likely to experience lightning strikes, since these requirements ensure that the surge arrester will be able to absorb more energy without suffering damage.

2.7. Varistor Degradation

Varistor degradation can be brought on by a varistor break, premature aging, or natural aging. The varistors can be severely and repeatedly damaged by electrical surges, humidity, and other factors, losing their electro-thermal stability and resulting in overheating and a large leakage current. The MOSA may experience a thermal avalanche as a result of premature degradation, which can cause the varistors to fracture or explode and, as a result, cause permanent damage to the equipment.
Damaged varistors were placed in the arrester active column to simulate this defect in a laboratory. By applying overvoltages and current impulses, the electrical stress was created that caused the varistors to break down.

2.8. Varistor Displacement

This problem usually happens as a result of inappropriate surge arrester transport or storage. Nevertheless, assembly faults during production could result in this type of problem. The displacement results in the formation of preferential conducting paths in the area of the best contact, which overheats the area and causes the varistors to degrade prematurely. Displacements in the active column were carried out during the simulation.

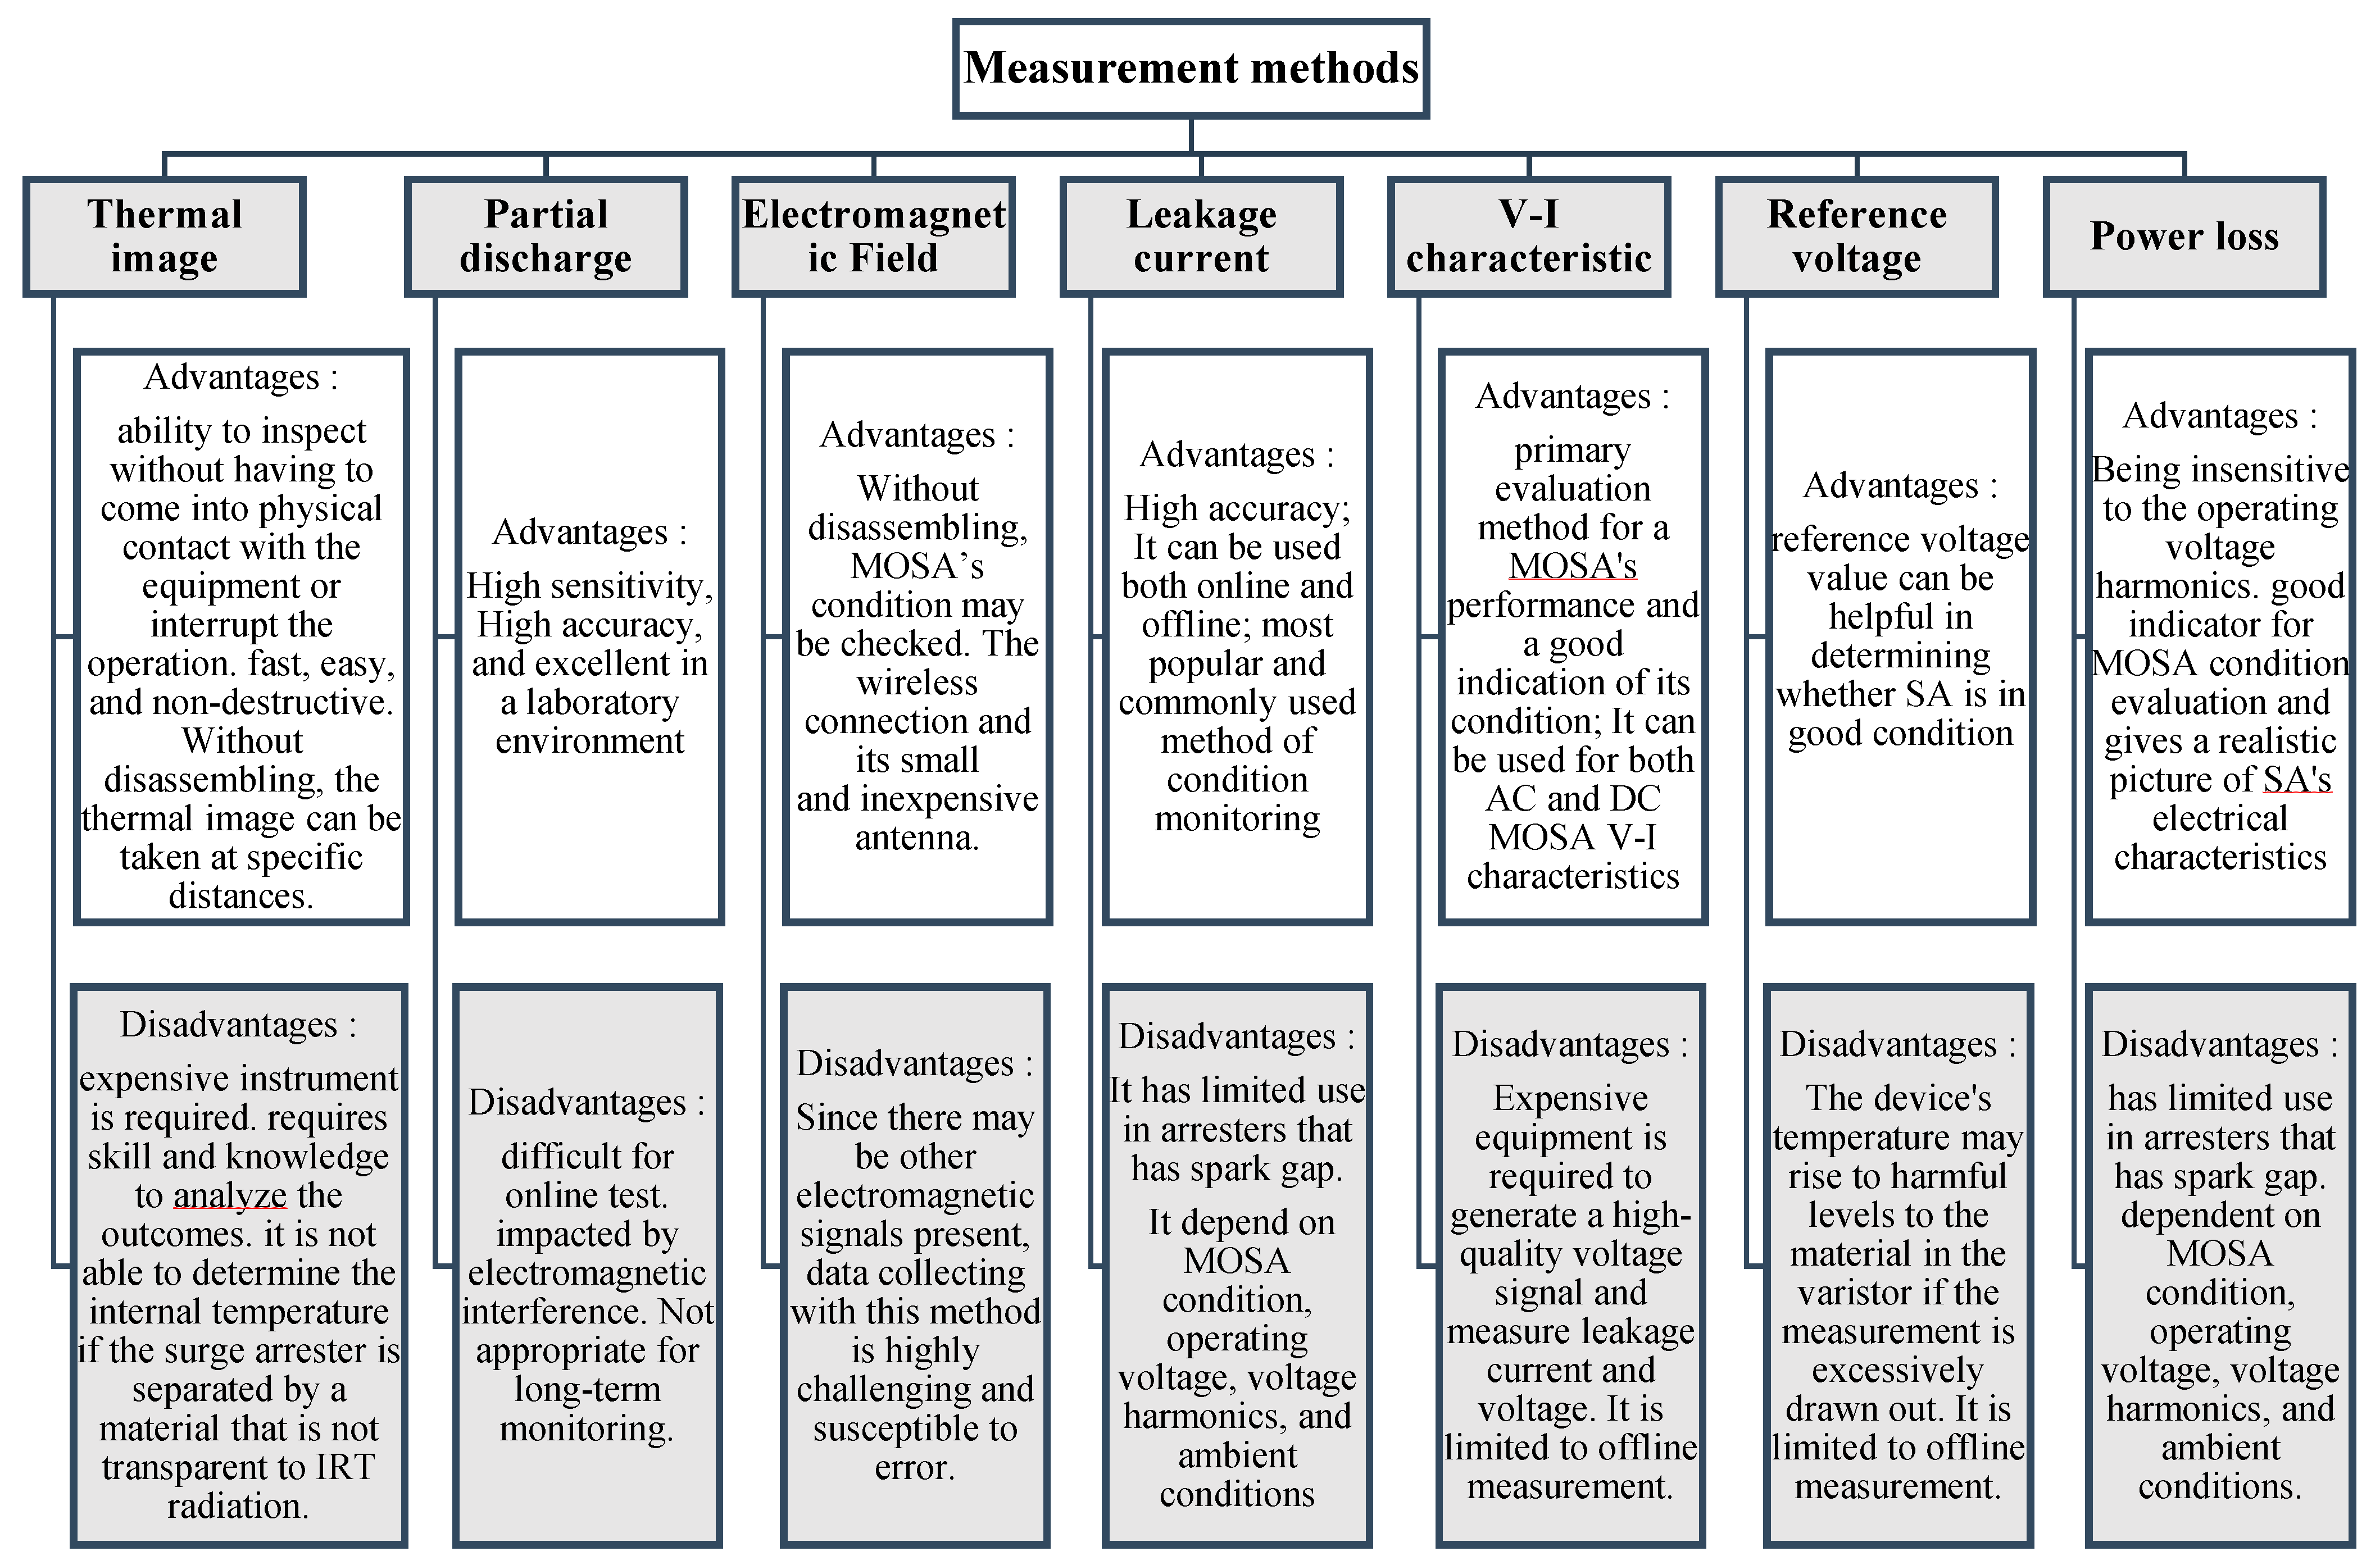
3. MOSA Diagnostic and Condition Monitoring Methods
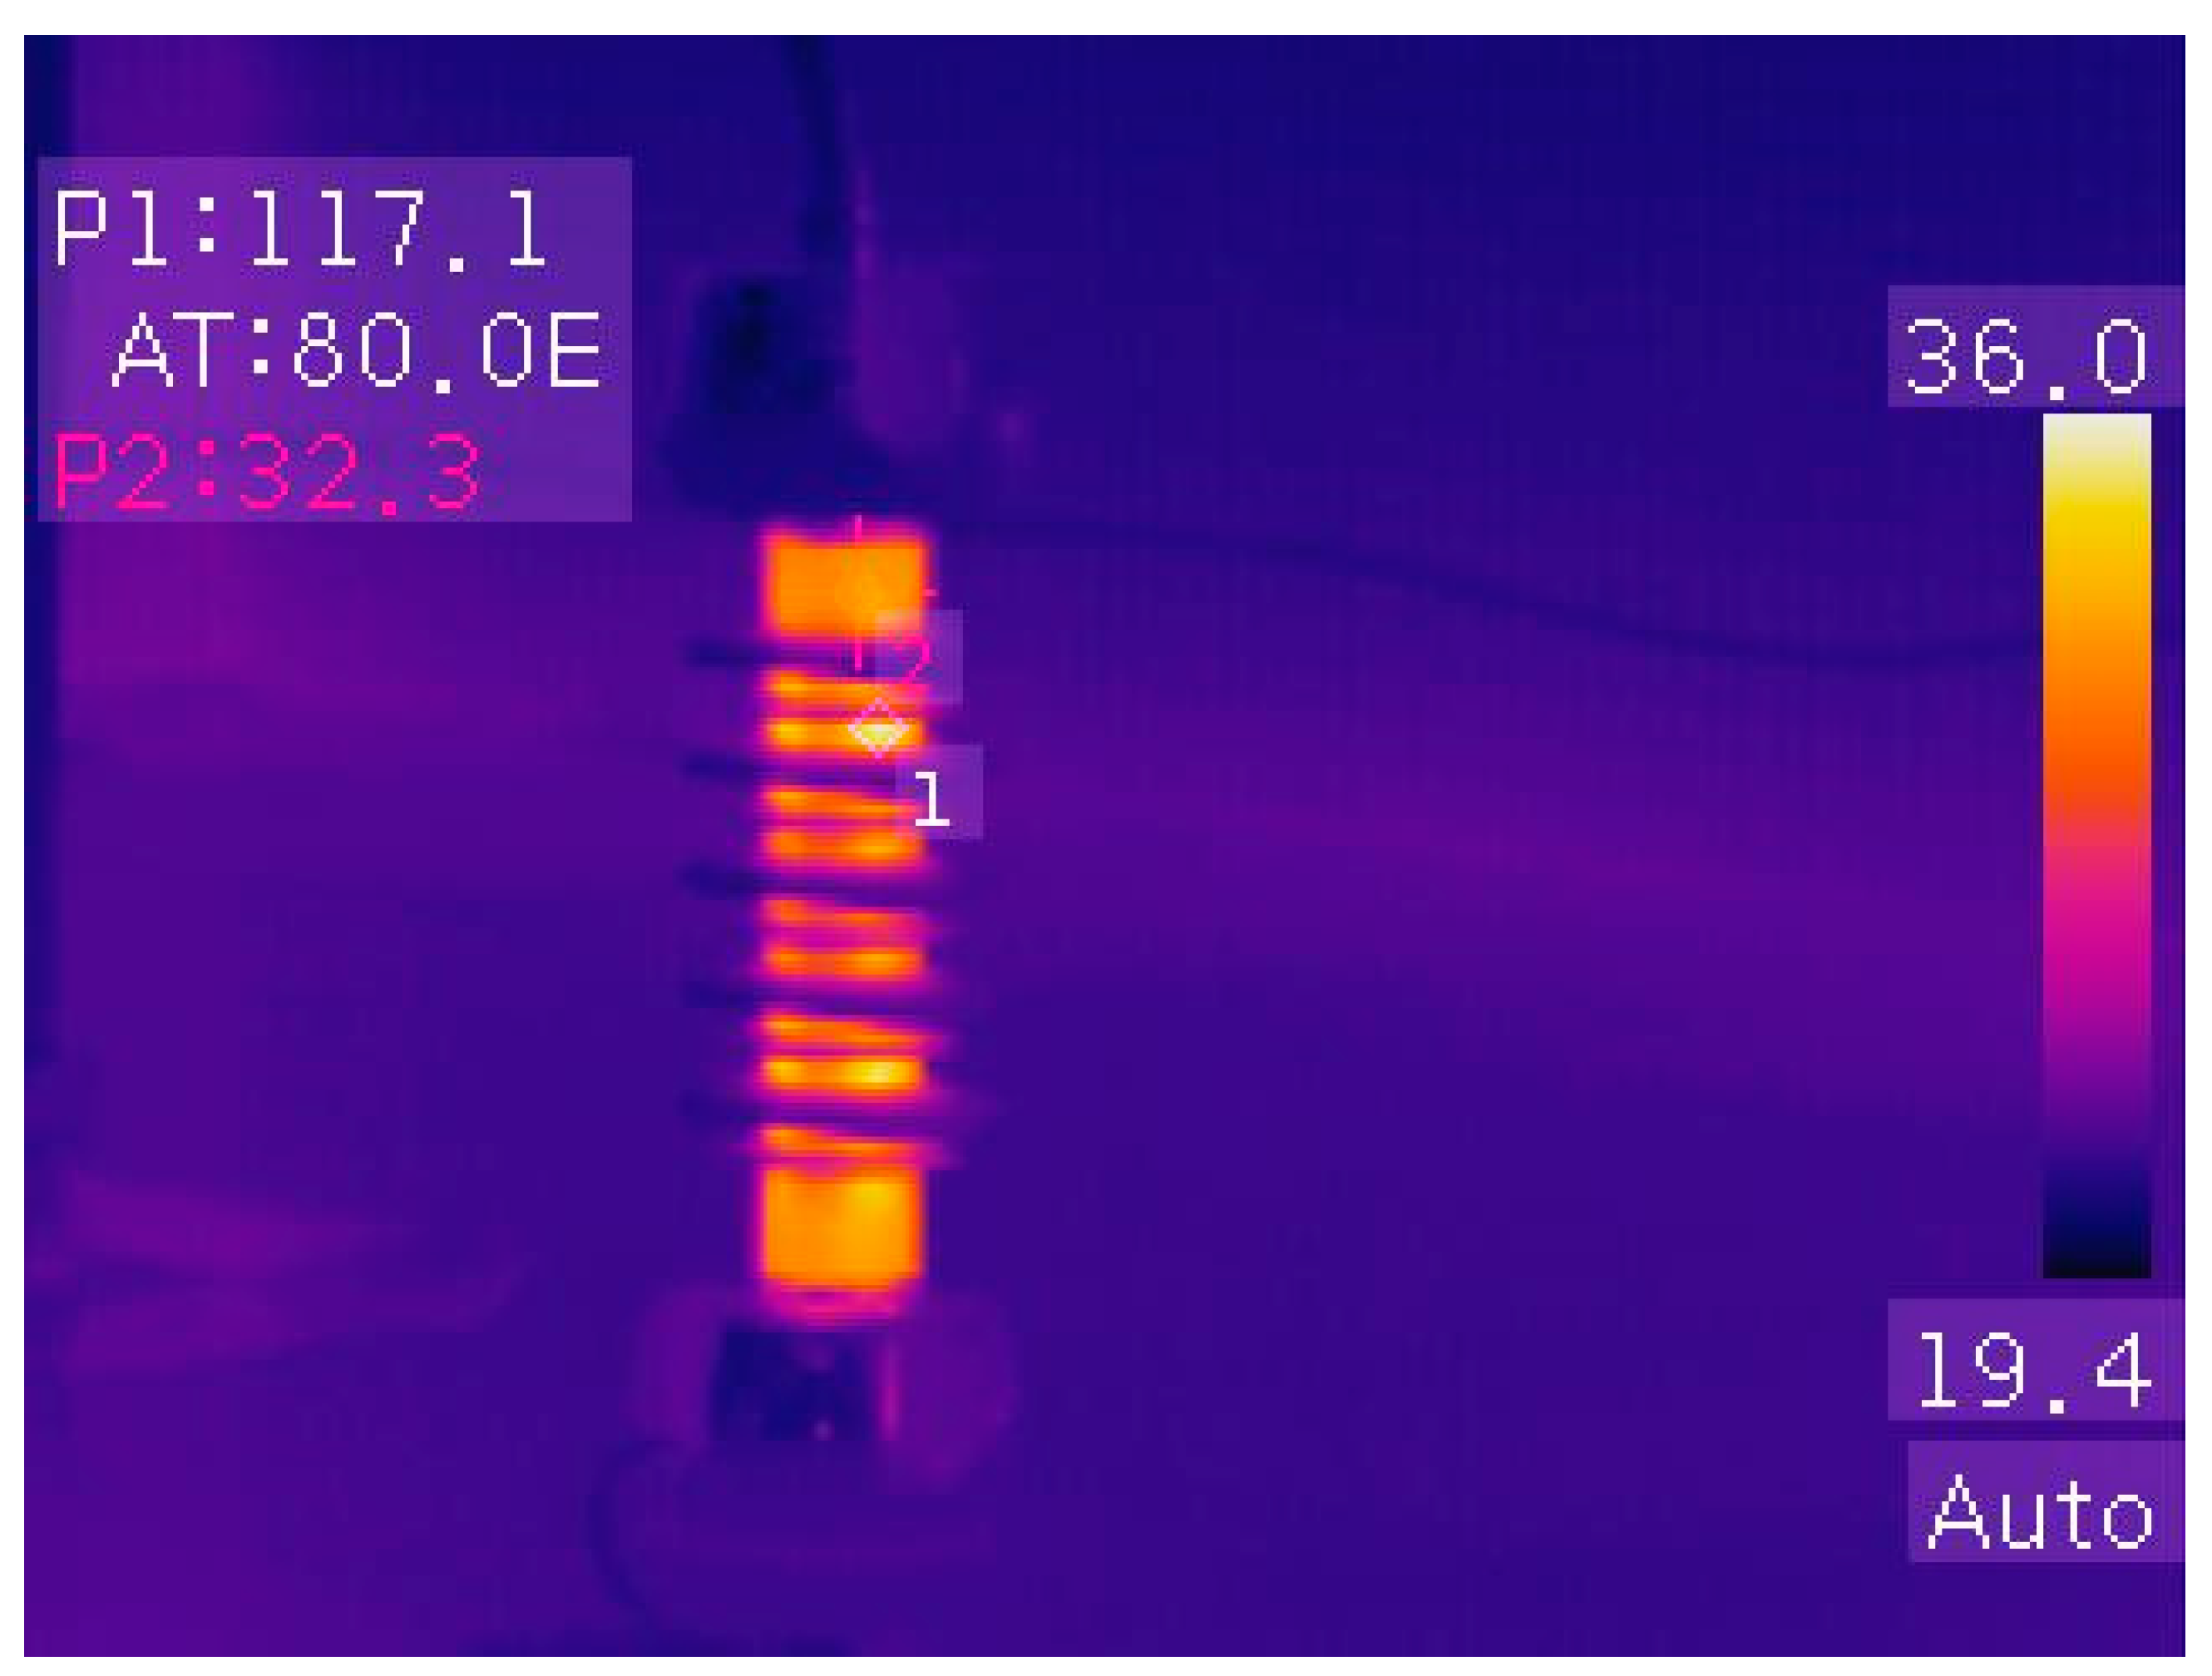
3.1. Thermal Image

Thermography inspection is a method to indicate equipment temperature, and this method is popular and has wide applicability in the areas of electrical, bio-medical, mechanical, and different engineering disciplines [33,34]. In addition, the MOSA is among the equipment that can have infrared photographs taken of it and its temperature analyzed in order to diagnose it [35]. In order to obtain an infrared image of the equipment, a thermoviewer or infrared camera can be employed. An object is captured using an infrared camera, which then uses infrared radiation to turn the picture into a thermogram [36]. In [37], an infrared camera is used to take an infrared image of surge arrester and examine the impact of various variables on the outcome of the thermal image and this equipment’s diagnostic.
The thermal image can reveal potential problems with the MOSA and even the specific type of problem in a detailed analysis of this method. Loose connections, degrading insulation, decaying components, surface pollution severity, an unbalanced load, overload conditions, and many other potential problems can all be detected with a thermal image measurement [27,37]. As a result of these studies, the thermal image is correlated with the degradation of the surge arrester. Consequently, this technique is a crucial element that may be utilized to predict the lifespan of the MOSA and identify its failures [27,38].
A thermovision photo of a 20 kV MOSA is displayed in Figure 1. As can be observed, at the operating voltage, the MOSA varistor’s temperature is 32.3 °C, while the ambient temperature is 24 °C; however, due to surface pollution, the temperature is about 36 °C in some areas of the arrester that are shown in the thermovision photo. This higher temperature may be harmful to the MOSA if the pollution is not cleaned up. Thus, it shows the importance of periodic surge arrester cleaning.
The advantages of using the thermal image measurement include the ability to inspect without having to physically contact the equipment and the ability to utilize it for online monitoring when the equipment is in service and under the operating voltage [27,37]. This method is fast, easy, non-invasive, and one of the non-destructive methods of the diagnostic and condition monitoring of MOSAs [35]. In addition, this method has some disadvantages, such as requiring expensive instrument, skills and knowledge to analyze the outcomes. Additionally, if the surge arrester is separated by a material that is not transparent to infrared thermography (IRT) radiation, such as glass or other coverings, it is not able to determine the internal temperature [33,34].
In [11], the thermal image measurement is used to detect the failure of the surge arrester in the Tenaga Nasional Berhad distribution network, and this measurement allows for the precise determination of the MOSA’s condition. This reference defines a table that displays five severity levels of the thermographic measurement that indicates the action that must be taken for surge arresters according to the difference in temperature between the test object and healthy surge arresters. For instance, when the temperature is overheating by less than one degree of centigrade, no action is necessary, but overheating by greater than 35 degrees needs immediate action, and must be replaced.
The temperature of a MOSA can be increased according to some reasons. Compared with a healthy MOSA, when a failed MOSA enables the current to pass through it, the thermal image should be capable of detecting a higher temperature of 10° to 20° [11]. The MOSA temperature and the thermal image are influenced by a number of variables, including internal moisture, reflected temperature, ambient temperature, distance from the test object, infrared energy emissivity, and external pollution [27,37].
A neural network is very useful in diagnosing and analyzing the thermal image of a MOSA. The thermal image and leakage current, which are correlated with the degradation of the surge arrester, are the main measurements used in [27]. The third harmonic of a MOSA-resistive leakage current and temperature from thermal imaging were correlated using a feed-forward back propagation (FFBP) neural network in this reference. In addition, there is a detailed discussion of more optimization methods in [39], including gradient descent, quasi-Newton, conjugate gradient backpropagation (CGB), and Levenberg-Marquardt (LM). Figure 2 shows the back propagation neural network structure. Humidity, ambient temperature, and collected data from the leakage current and MOSA thermal image are this neural network’s input layers. Each node in the hidden layer receives an input from every node in the input layer, which is multiplied by the proper weights and then added, and the non-linear modification of this final sum is the hidden node’s output. Each node in this network has a weight assigned to it, and the initial weights are selected at random. During the training process, these weights are adjusted. Finally, the condition of the MOSA is reported with normal, suspicious, or fault labels after the hidden layer data analysis.
In [28], a neural network was used to diagnose a MOSA, and this neural network was developed using simulations of six different failure tests. These failure tests are sealing failure, internal humidity, superficial pollution, the generation of short circuits on the varistor’s surface as though a conduction path had been made as a result of carbonization or moisture, the arrester active column which contained broken varistors, and the displacement of the varistor along the active column. For each kind of these tests, the thermal image and thermal profile of the MOSA have been reported and have revealed the differences in the arrester’s thermal behavior for the various types of problems. These differences can be sent into an artificial neural network to categorize the arresters based on whether or not failures have occurred.

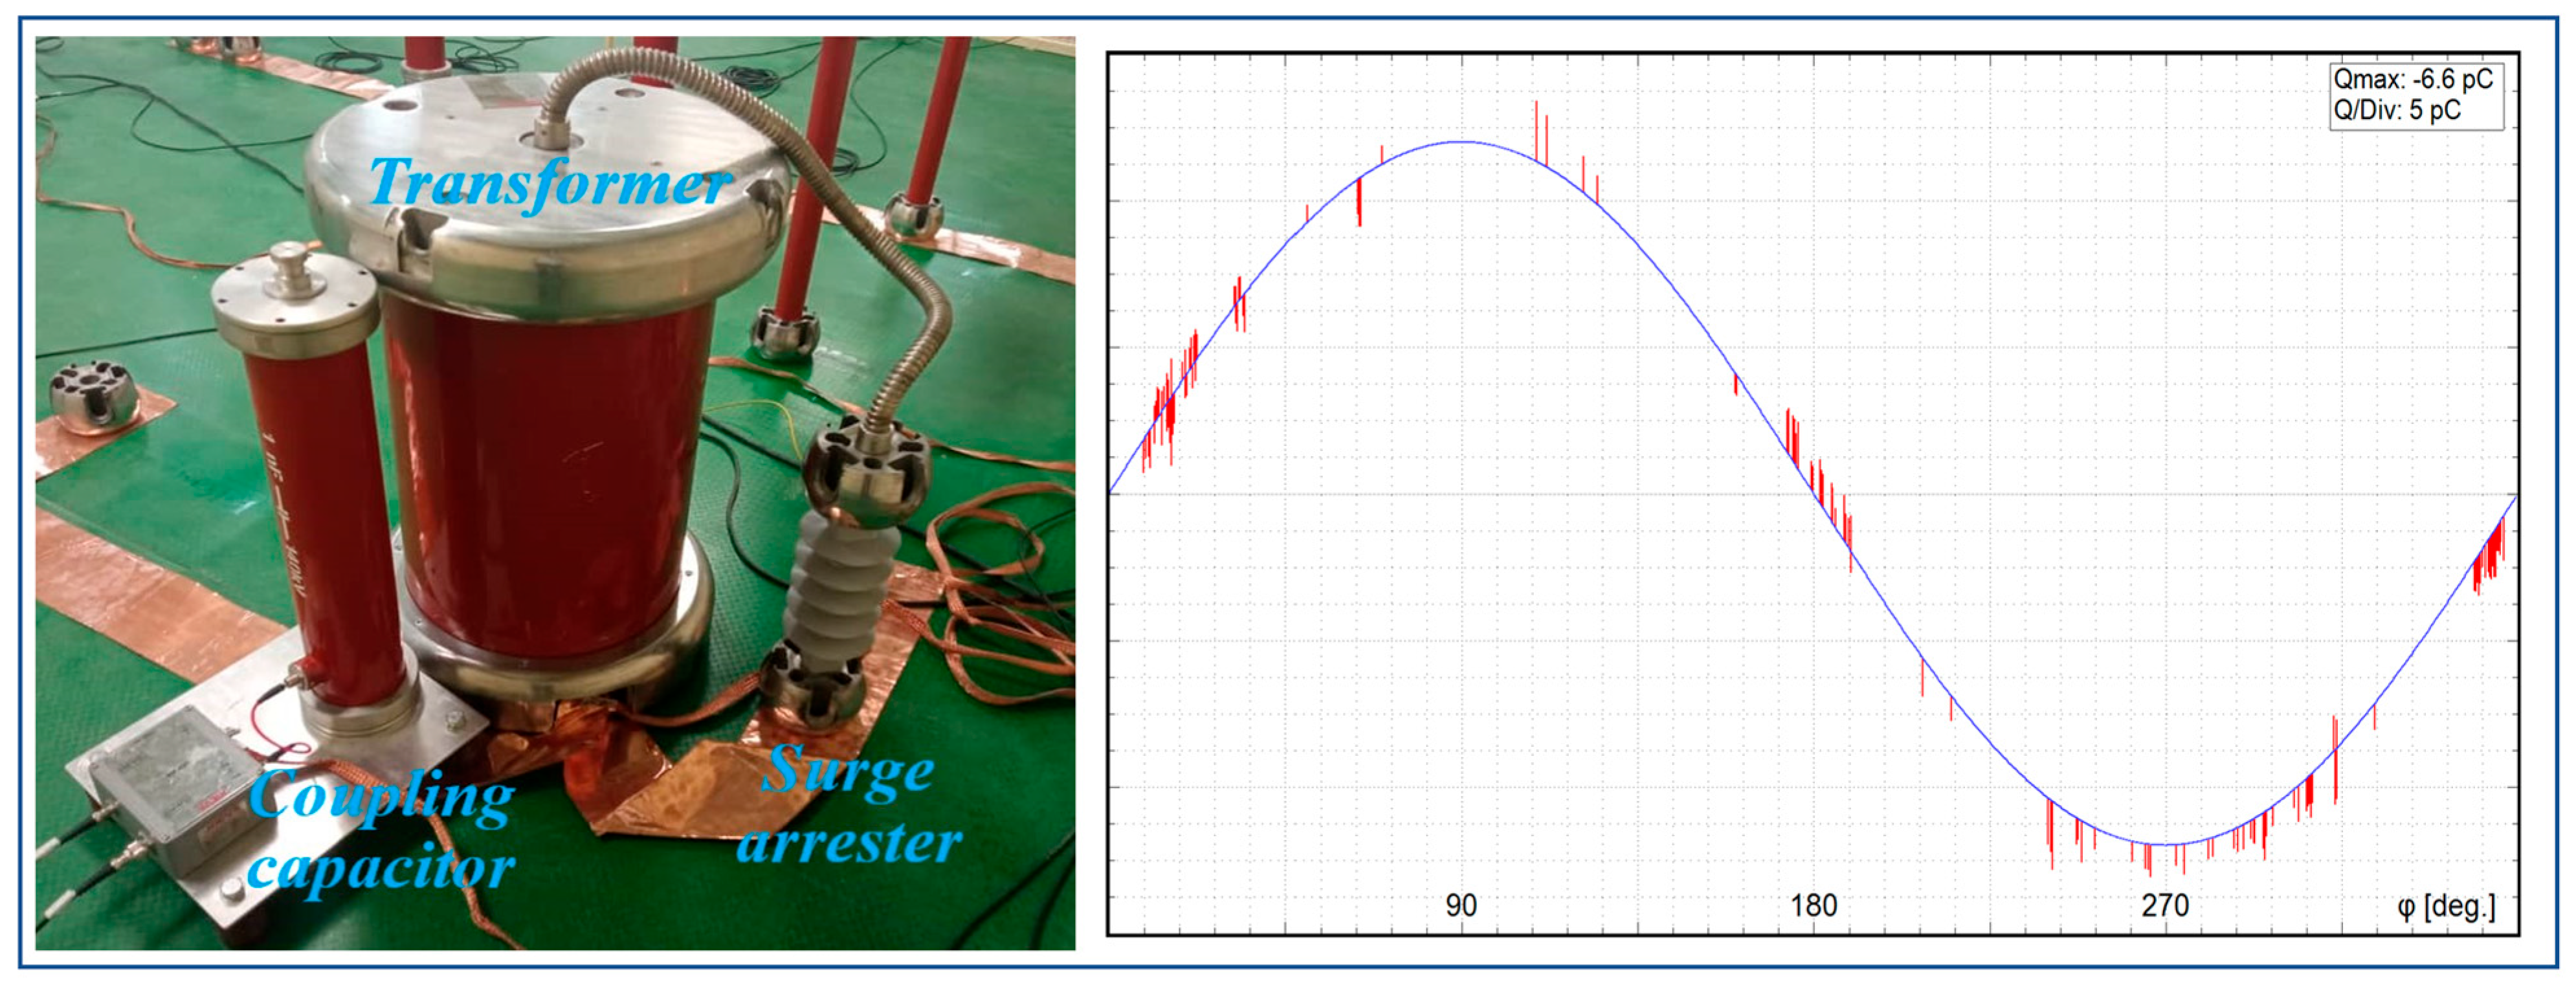
3.2. Partial Discharge

When the local electric field exceeds the threshold value, there is a partial breakdown of the surrounding medium, leading to partial discharge. The partial discharge measurement is one of the qualities of MOSA insulation, which is crucial for defect detection and error prediction [40]. There are typically two ways to measure partial discharge. One is the electrical model, which depends on current pulse observations, and the other is a non-electrical model, which measures the partial discharge using sound, light, and electromagnetic waves. The non-electrical technique has the benefit over the electrical method in that it allows for measurement of the device without removing it from the system [41,42].
In [16], the relationship between the component and internal humidity has been investigated. In this study, there have been eight medium-voltage MOSAs from various manufacturers utilized and a schematic which assessed for partial discharge and power loss.
In [11], the partial discharge of each of the six arresters has been tested at six levels, ranging from 33 dB to 60 dB, at six distinct locations. In the mentioned study, partial discharge is measured using an infrared technology that is appropriate for online tests.
In [43], ultrasound was used to collect data on different insulations under various situations, including pollution, insulation defects, humidity, and salt. An artificial hole was made in the insulation using a mechanical drill. A total of 20 min was used to obtain the ultrasound data using an ultrasound microphone placed 0.4 m from the test object. The sound waves that this approach uses disperse in several directions, which makes it difficult to determine the exact location of the flaw without the operator’s expertise and experience. The insulators are set to a voltage of 7.95 kV phase-to-ground in order to perform the test. The data that were received have been examined using the ANN approach. This technique is more effective than contamination at identifying perforated insulation flaws.
The experimental setup for the electrical partial discharge measurement is shown in Figure 3. In this experiment, one Nano Farad of capacitance is used, parallel to and close to the transformer. The transformer and capacitor are parallel connected with the test item, which is a MOSA here. The distance between the components has no particular influence on the outcome, but the partial discharge is sensitive to sharp surfaces and objects with points that could throw electrons. As a result, according to the voltage range of the MOSAs in the distribution network, the environment should be isolated at a distance of at least one meter from the set of a transformer, capacitor, and test object. In the sample of this measurement outcome, which is shown in Figure 3, the voltage applied to the arrester is shown by the blue sinusoidal waveform, and the arrester’s partial discharge at each angle of the sinusoidal waveform is represented by the raised red lines. The partial discharge of the healthy arrester is in the hundreds of femtocoulomb (fC) range, but the tested arrester has a value of 6.6 picocoulomb (pC), which indicates that it is not healthy.

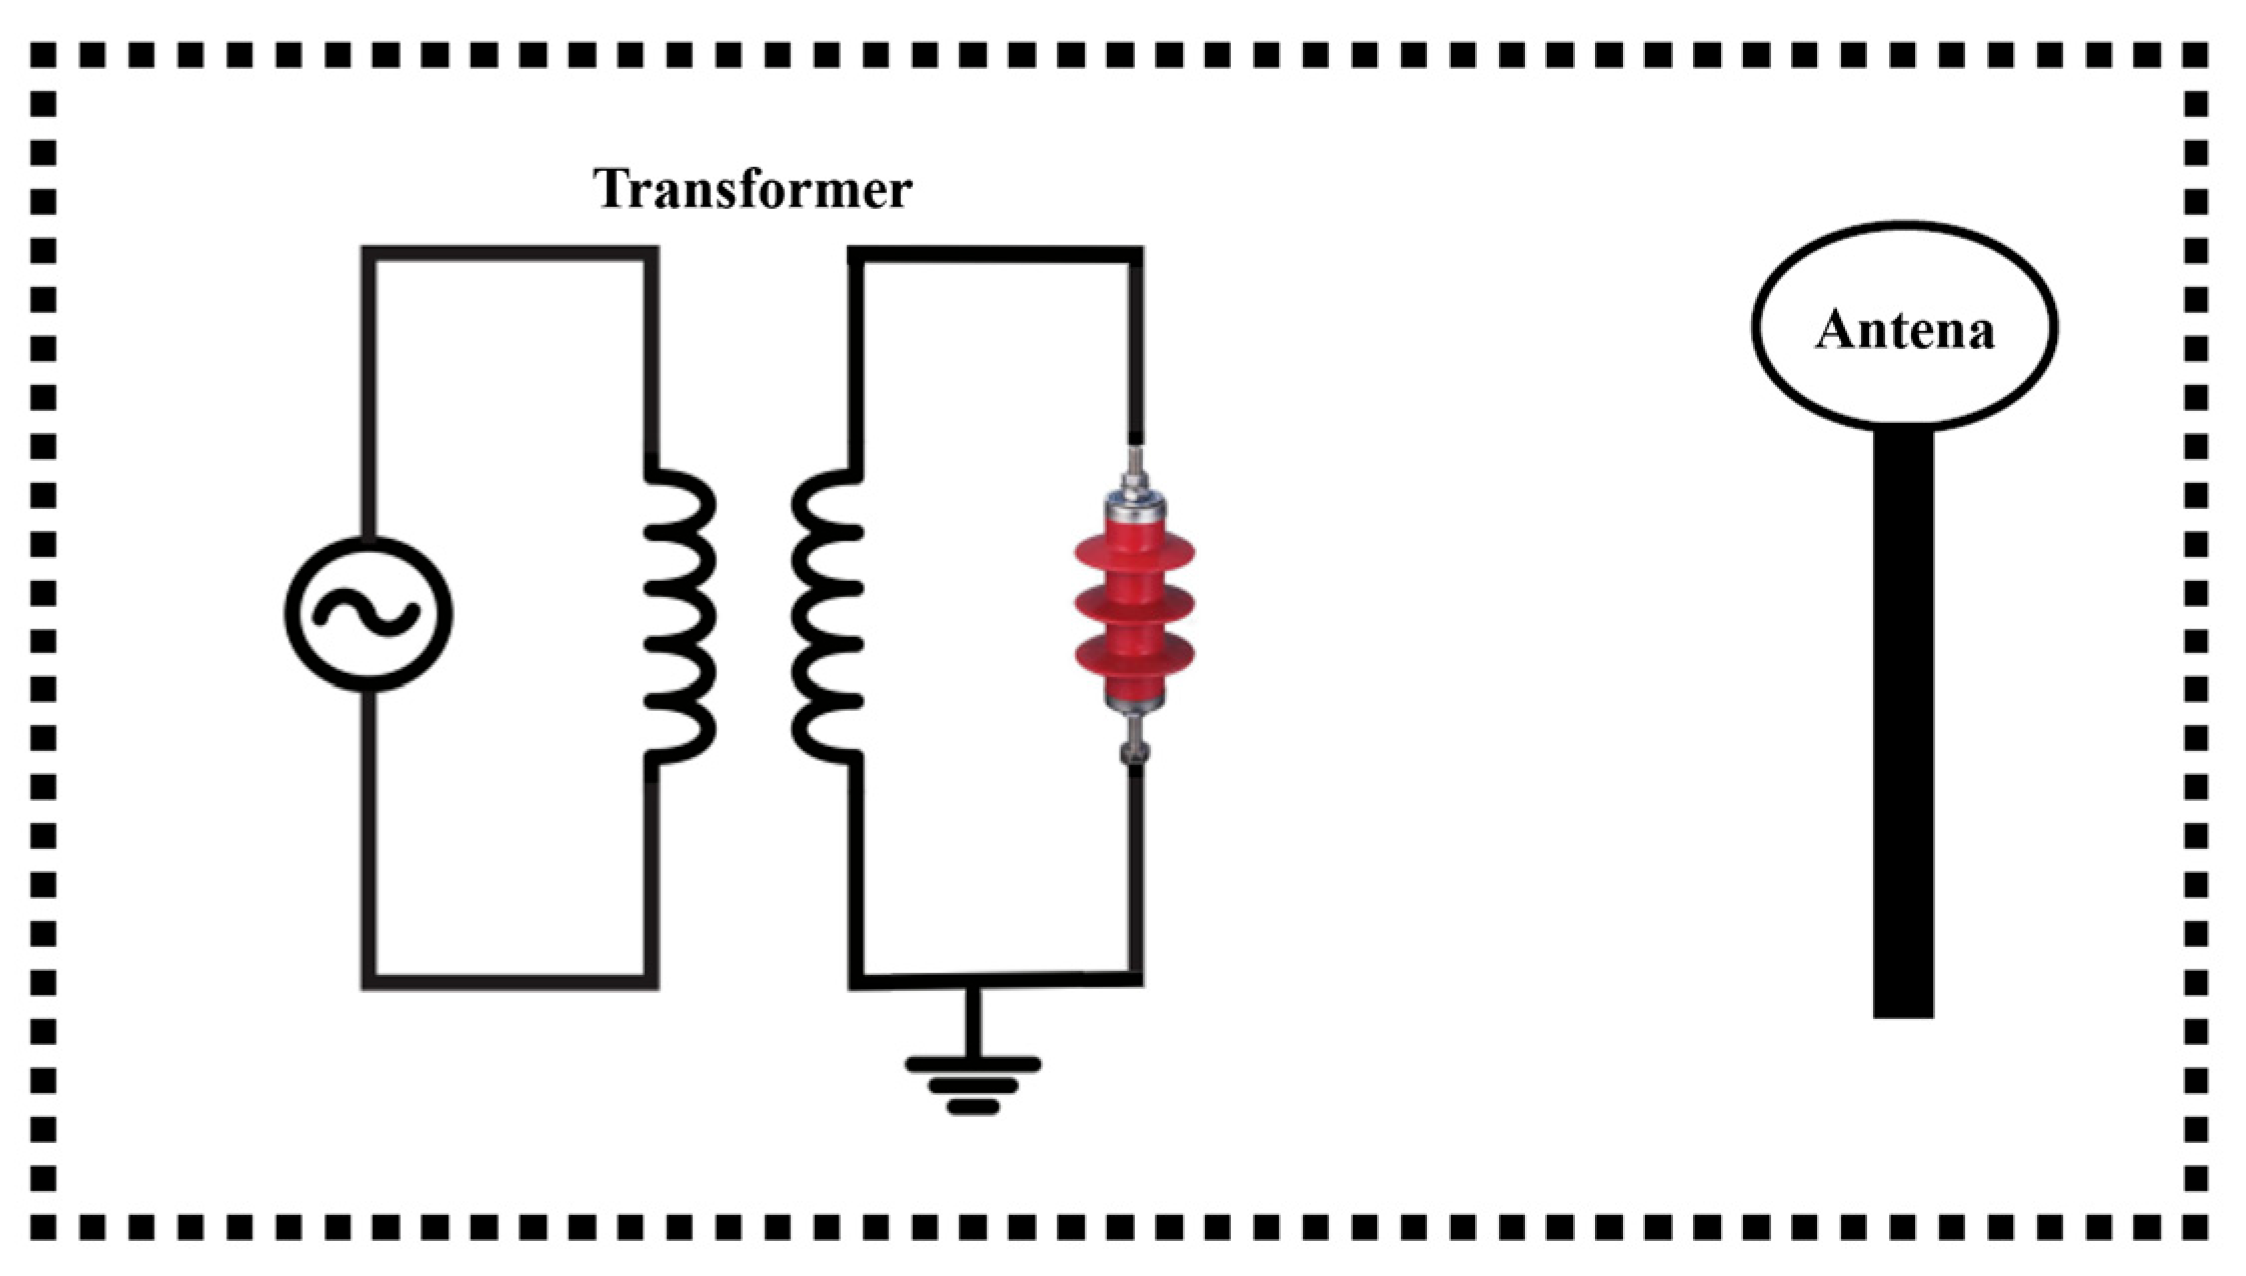
3.3. Electromagnetic Field

Defects and fractures in the MOSA insulator cause an inflow of electrons to the damaged region, which leads to the creation of a partial discharge and increases the leakage current. A technique for measuring partial discharges is electromagnetic emission. This approach involves obtaining partial discharge signals using sensors and an antenna, signal processing, and identifying the area of the fault. The wireless connection and its small and inexpensive antenna are some benefits of this approach, since they allow for placement in the distribution system’s towers and continuous assessment. Interference of waves can be a problem with this method, but due to the high frequency of this transmission, low-frequency signals do not often present a problem, but for interference in a specified band, a filter can be applied [24,44].
The electromagnetic pulses received from the lightning arrester have been studied [24] using the Wigner–Ville distribution (WVD) approach, and the impact of humidity and pollution has been examined. The classic fast Fourier transform (FFT) has been abandoned in preference of the WVD approach due to the non-periodic characteristics of the data under investigation. The frequency spectrum of the received signal is determined using the above-mentioned approach, and it can be seen that the frequency spectrum of the polluted and moisture-exposed surge arrester has a higher amplitude than that of the clean and healthy surge arrester.
A setup of the electromagnetic emission is shown in Figure 4. The antenna is connected to the preamplifier, digital oscilloscope, and computer.

3.4. Leakage Current

The methods that depend on the measurement of leakage current under the operating voltage are the most traditional and popular techniques for diagnosing the MOSA’s condition [13]. This measurement can be used either online in service under the operating voltage or offline in the laboratory. The offline techniques can be used to achieve precise results, but the offline method’s disadvantages are the need for costly equipment and the requirement to remove the MOSA from the system [18,25]. In [45,46], on the secondary side of the transformer, a shunt resistor is connected in series with an arrester for measuring the leakage current, and a capacitive divider is connected in parallel with the set of shunt and arrester to measure voltage. Figure 5 shows the experimental setup for the leakage-current measurement, where simultaneously, the voltage and current of the surge arrester are measured in a laboratory.
This method has limited use in classical arresters because of the presence of a spark gap, but the MOSA’s creation elevated their use and significance because a low current is always flowing through this arrester, which is called a leakage current since a MOSA lacks a spark gap. Furthermore, the other drawback of this method is that it is dependent on the fluctuation and harmonics of the operating voltage, but this can be rectified by using development methods that rely on the leakage-current measurement. For instance, the fundamental harmonics of the resistive leakage current and power loss can provide a reliable diagnosis of MOSA health because they are less sensitive to voltage harmonics and fluctuation [13].
As indicated in the preceding section, surge arresters fail due to a variety of circumstances, including pollution, varistor degradation, and displacement of the varistors. As a result of analyzing their leakage current, diagnosing MOSAs based on peak currents seems unsuitable because the peak currents are generally close together with the exception of varistor deterioration, which is the most serious failure, as it exhibits a slightly higher value. However, the distortion levels have shown more significant variations, with no two waveforms having the same magnitude at any time. The observed characteristics were consistent with those of the other measured leakage currents. Therefore, the results support the theory that MOSA diagnostics and monitoring by analyzing the harmonic content of the leakage current due to the differences in distortion level can be useful [30].
The total leakage current includes the impact of capacitive and resistive current components. The capacitive and resistive leakage-current measurement has always been essential. As a result, various techniques for calculating the resistive leakage current from the total leakage current are developed [47,48], such as the modify shifted current method (MSCM) [49], time-delay addition method (TDAM) [50], improved time-delay addition method (ITDAM) [46,51], capacitive current compensation method (CCCM) [25], current orthogonality method (COM) [18], and hybrid method [52].
A total leakage current example, together with the capacitive and resistive components of this signal, is shown in Figure 6. Due to the fact that the capacitive component of a leakage current is voltage-dependent, the resistive component of a leakage current is primarily responsible for the change in harmonic components that occurs as the MOSA deteriorates. Changes in the resistive component have little impact on the total leakage current because the capacitive component makes up the majority of it. These facts suggest that the resistive leakage current analysis, as compared with the total leakage current analysis, can give a more accurate picture of the MOSA’s health [48].
For assessing the MOSA’s condition, the leakage current-resistive component obtained through the decomposition process is a good indicator. The calculation and analysis of the resistive current amplitude [25,53], fundamental harmonics [50], third harmonics [26,27], and its harmonic ratios [45] serve as the essential purposes of most diagnostic methods.
In [54], the effects of three variables, including UV radiation, pollution, and varistor faults on the harmonic of MOSA-resistive and total leakage current, are examined. The results indicate that in the conditions of varistor degradation and outside pollution, the fundamental harmonics of the resistive and total leakage current are more predominant. Hence, they can be regarded as effective criteria for identifying clean conditions from those caused by pollution and degradation. In addition, UV aging has caused a significant increase in the third harmonics of resistive and total currents, and a decrease in their fifth harmonics.
Harmonic ratios of the MOSA-resistive leakage current are used in [45] for the diagnostic and condition monitoring. Therefore, the ratio of i r 3 i r 5 is a valuable index since it can distinguish between virgin MOSA and UV-aged ones because of the higher value in UV-aged MOSAs. In addition, polluted MOSA surfaces have a higher i r 1 i t 1 ratio. As a result, this ratio is a useful and effective indicator for separating clean virgin and clean new from polluted MOSAs.
V-I characteristics, the reference voltage, and power loss measurements are MOSA diagnostic and condition monitoring methods that are discussed and examined in the following sections of this article. They are often carried out offline in a laboratory because it is necessary to measure the leakage current and operating voltage at the same time; however, this is either impossible under operational conditions or involves other risks and problems. The circuit is shown in Figure 5 is employed for simultaneous voltage and current measurements during the course of these tests in a laboratory environment. Despite the fact that each of these methods uses the same circuit as the leakage current circuit, they each have their particular analyses and advantages, making them distinct methods for determining the arrester’s health condition.

3.5. V-I Characteristics

MOSAs V-I characteristic is nonlinear and can be divided into three distinct regions that are named the leakage region, breakdown region, and upturn region. In the first region— the leakage region—a tiny amount of leakage current passes through surge arresters since the voltage is lower than the nominal value. The breakdown region is where extremely big changes in the current correspond to extremely small changes in the voltage. In the upturn region, the voltage and current are both more than the residual voltage and rated current [55,56].
In [10], the impact of temperature on V-I characteristics is discussed. In the leakage current region where the surge arrester is in continuous operation, increasing temperature causes the current to increase. The discharge current flows when switching or lightning impulses occur, and voltage is limited to the residual voltage level by the MOSA. The MOSA conductivity changes slightly with temperature. The MOSA is extremely conductive in the upturn and breakdown areas. Hence, the temperature effect on these regions is insignificant.
In [57], the influence of temperature, operation history, and varistor material on MOSA V-I characteristics was investigated. These factors alter V-I characteristics, which must be taken into account in power loss, and hence, its analysis.
The primary evaluation method for a MOSA’s performance and a good indication of its condition is measuring the V-I characteristic. This measurement can be used for both AC and DC MOSA V-I characteristics. For measuring V-I characteristics, a DC or AC voltage source is required, and based on the amplitude of the voltage supply, the leakage current is recorded. If this method is used online, only one point from the V-I characteristics can be taken according to the line-to-earth voltage. As a result, this method is limited to offline measurements. Expensive equipment is required to generate a high-quality voltage signal and to measure the leakage current and voltage [20].
Figure 7 indicates an example of a comparison between the V-I characteristics of healthy and degraded MOSAs in the same ambient condition. As a result, a degraded MOSA has a larger current than a healthy one at the same voltage. Additionally, from these characteristics, it is possible to record the leakage current RMS value and reference voltage of both healthy and degraded MOSAs.

3.6. Refrence Voltage

The voltage difference between the surge arrester terminals while operating with the reference current is referred to as the reference voltage. The reference current, which is defined by the manufacturer, is in the range of 1 to 10 mA [20].
The method that is most frequently used to measure reference voltage is to apply an AC voltage across the varistor while the current is monitored. Then, the reference voltage is equal to the AC RMS voltage, resulting in the sample’s peak current conduction reaching the target reference current. Typically, reference voltage measurement takes a few seconds. The device’s temperature may rise to harmful levels to the material in the varistor if the measurement is excessively drawn out. The test object could not possibly maintain the voltage level if this measurement took ten minutes [58].
High impulses have the potential to change the conductivity of MOSA characteristics. The device’s manufacturer and the surge’s severity significantly impact the degree of damage [58]. The capability of a MOSA to clamp a surge voltage reduces with MOSA degradation. A reduction in the MOSA’s reference voltage is indicated as a result of degradation. Less voltage is needed in order to pass greater current around the 1 mA through the more degraded MOSA, and complete failure is defined as a reduction of between 5% and 10% in the reference voltage of a MOSA. Consequently, measuring the voltage reference can be helpful in determining whether MOSA is in good condition [23,26,59].

3.7. Power Loss

Power loss in the surge arresters was computed based on the leakage current and applied voltage data. The following formula can be used to calculate active power losses: [25]
P = 1 T t t + T v t i t d t
The power loss measurement is frequently used in laboratories (offline) but is rarely used online because simultaneous leakage-current and operating-voltage measurements are required. Simultaneous measurement of this method is either not feasible in operating conditions or is related to various risks and problems. Hence, this is one of this method’s disadvantages [25]. In addition, this method has some advantages, such as being a good indicator for the MOSA’s condition evaluation and giving a realistic picture of MOSA’s electrical characteristics and changes brought on by various types of degradation [60,61]. As a result, although it is insensitive to the operating voltage harmonics, even under direct or non-sinusoidal voltage, it provides reliable results and is another benefit of the power loss method [20].
Growing power loss as well as service life are indicators of MOSA aging. The power loss of surge arresters depends on both internal and external watt loss. As a result of a contaminated moist surface, when compared to the internal power loss, a MOSA exhibits an external power loss that is at least ten times greater [19,62].
In [16], the influence of internal moisture on partial discharge and power loss was assessed. It became recognized that power loss diagnostics are more sensitive when compared to partial discharge diagnostics to detect differences due to internal moisture.

3.8. Impulse Test

The impulse test is one of the tests that is carried out offline in a laboratory, and it can be utilized as one of the periodic tests of surge arresters. Utilizing an impulse test, the surge arrester insulation withstand and residual voltage can be determined. Figure 8 shows an example of the experimental setup for the lightning impulse voltage test in a laboratory.
This test is designed to show the arrester housing’s external insulation’s ability to withstand voltage. Impulses have different types based on their duration. One of the several impulse types for which the standard is defined and used is 1.2/50 µs impulses. Fifteen positive and negative 1.2/50 µs impulses were applied to the sample. Out of these fifteen impulses, the sample passed with fewer than two discharges, indicating that its insulating withstand is acceptable [63].
The peak value of the voltage that occurs between the surge arrester terminals when a discharge current is applied is referred to as the residual voltage [14]. However, the discharge current’s amplitude and waveform can have an effect on the residual voltage; the residual voltage must be lower than the protection level of the operating equipment [64].

3.9. Comparison of Different Diagnostic Methods

In this section, numerous papers have reviewed and described various methods of the diagnostic and condition monitoring of MOSAs. The experimental setup is described, and the outcomes of each technique are displayed. In addition, each method’s benefits and drawbacks are generally discussed. Figure 9 shows the advantages and disadvantages of MOSA diagnostic methods.
In the final part of this section, the methods investigated in this study are compared due to the investigation of six other papers in Table 2. For each paper, the properties of its proposed approach are discussed in the first column. The advantages and disadvantages of the paper methods are discussed in the second and the third column of the table.

3.10. A Look at Upcoming Research

Some research gaps have been found, which may include potential future research topics, in view of the information presented in Table 2 and Figure 9. The titles of several of these works are mentioned below.
Fault detection in MOSA using thermal image analysis with image processing and reinforcement learning.
Noise removal in partial discharge measurements with the fast Fourier transform method and artificial intelligence for fault detection in MOSAs.
The analysis of received signals from electromagnetic emission using an optimal neural network.
Online diagnostic fault and extracting the resistance and capacitor current from the leakage current of MOSAs by ITDAM (improved time-delay addition method), and develop its result using machine learning.
Designing and manufacturing a new MOSA system with efficient performance against ferroresonance and temporary overvoltage.

4. Conclusions

In this paper, issues such as internal moisture, pollution, different overvoltages, and aging that may lead to MOSA failures were investigated. Internal humidity and surface pollution are the two most frequent factors in surge arrester failure, which develops over time as a result of the surrounding ambient condition. Therefore, periodic cleaning and insulation testing are recommended to minimize the degradation and failure of arresters. Failures such as lightning surge and overvoltage due to switching can cause MOSAs to fail instantly, making them unsuitable for use in service and requiring replacement. As a result, it is crucial select arresters in the distribution network, considering the topography of the overhead lines, the grounding arrangement, as well as making the required preparations to replace arresters in the case of the possible failures that are described.
According to the advantages and disadvantages mentioned, the thermal image tests, leakage current tests, and partial discharge testing among the MOSA evaluation techniques discussed in this article can be useful for routine maintenance and essential MOSA tests. The non-destructive aspect of the thermal imaging method is a key component that can be used for online testing, and it can provide a reliable picture of the MOSA’s condition by employing a neural network. However, the expense of the required instrument is a drawback of this method. The partial discharge of the arrester may also be measured online using the electromagnetic emission approach. Although the necessary hardware, such as the antenna, is simple, it should be emphasized that the analysis of the received data is highly sensitive and complicated. The leakage current has a wide range of applications in the detection of the MOSA’s condition, and the findings obtained from this measurement can be used to determine the severity of the damage or predict the remaining life of the MOSA. This method and methods that depend on measuring leakage current, such as V-I characteristics, reference voltage, and power loss, require simultaneous measurements of the voltage and current. Therefore, they are commonly performed offline in a laboratory because of the risks and problems of these simultaneous measurements in service.
Practical testing of a healthy and defective 20 kV MOSA revealed that, at a constant voltage, higher currents flow through the defective MOSA. The evaluation of MOSAs may also consider this scenario.

Funding

This research received no external funding.

Institutional Review Board Statement

Not applicable.

Informed Consent Statement

Not applicable.

Conflicts of Interest

The authors declare no conflict of interest.

References

  1. Burke, J.J.; Varneckas, V.; Chebli, E.A.; Hoskey, G. Application of MOV and gapped arresters on noneffectively grounded distribution systems. IEEE Trans. Power Deliv. 1991, 6, 794–800. [Google Scholar] [CrossRef]
  2. Das, J.C. Effects of medium voltage capacitor bank switching surges in an industrial distribution system. In Proceedings of the 1992 IEEE Conference Record of the Industrial and Commercial Power Systems Technical Conference, Pittsburgh, PA, USA, 4–7 May 1992; pp. 57–64. [Google Scholar] [CrossRef]
  3. Živanović, E.; Živković, M.; Veljković, S. Study of Breakdown Voltage Stability of Gas-Filled Surge Arresters in the Presence of Gamma Radiation. Electronics 2022, 11, 2447. [Google Scholar] [CrossRef]
  4. Gannac, Y.; Leduc, G.; Pham, C.D.; Crevenat, V. 8/20 and 10/350 Surges Behaviour of a Gas Discharge Tube According to Gas Pressure. Electr. Power Syst. Res. 2021, 197, 107302. [Google Scholar] [CrossRef]
  5. Abdul-Malek, Z.; Khavari, A.H.; Wooi, C.L.; Moradi, M.; Naderipour, A. A review of modeling ageing behavior and condition monitoring of zinc Oxide Surge Arrester. In Proceedings of the 2015 IEEE Student Conference on Research and Development (SCOReD), Kuala Lumpur, Malaysia, 13–14 December 2015; pp. 733–738. [Google Scholar] [CrossRef]
  6. Tarfulea, N.; Frigura-Iliasa, F.M.; Vatau, D.; Andea, P.; Balcu, F.; Macarie, A.C. A new algorithm for the design of metal oxide varistor surge arresters. In Proceedings of the 2016 IEEE 16th International Conference on Environment and Electrical Engineering (EEEIC), Florence, Italy, 7–10 June 2016; pp. 1–4. [Google Scholar] [CrossRef]
  7. Sabiha, N.A.; Mahmood, F.; Abd-Elhady, A.M. Failure Risk Assessment of Surge Arrester Using Paralleled Spark Gap. IEEE Access 2020, 8, 217098–217107. [Google Scholar] [CrossRef]
  8. Orille-Fernández, Á.L.; Rodríguez, S.B.; Grau Gotés, M.À. Optimization of Surge Arrester’s Location. IEEE Trans. Power Deliv. 2004, 19, 145–150. [Google Scholar] [CrossRef]
  9. Shariatinasab, R.; Vahidi, B.; Hosseinian, S.H. Statistical Evaluation of Lightning-Related Failures for the Optimal Location of Surge Arresters on the Power Networks. IET Gener. Transm. Distrib. 2009, 3, 129–144. [Google Scholar] [CrossRef]
  10. Spack-Leigsnering, Y.; Gjonaj, E.; de Gersem, H.; Weiland, T.; Giesel, M.; Hinrichsen, V. Investigation of Thermal Stability for a Station Class Surge Arrester. IEEE J. Multiscale Multiphys. Comput. Technol. 2016, 1, 120–128. [Google Scholar] [CrossRef]
  11. Ariffin, M.F. Challenges in developing surge arrester failure detection methodologies in TNB distribution network. In Proceedings of the CIRED 2009-20th International Conference and Exhibition on Electricity Distribution-Part 1, Prague, Czech Republic, 08–11 June 2009; pp. 1–4. [Google Scholar]
  12. Khodsuz, M.; Mirzaie, M. Monitoring and Identification of Metal-Oxide Surge Arrester Conditions Using Multi-Layer Support Vector Machine. IET Gener. Transm. Distrib. 2015, 9, 2501–2508. [Google Scholar] [CrossRef]
  13. Stojanović, Z.N.; Stojković, Z.M. Evaluation of MOSA Condition Using Leakage Current Method. Int. J. Electr. Power Energy Syst. 2013, 52, 87–95. [Google Scholar] [CrossRef]
  14. Christodoulou, C.A.; Avgerinos, M.V.; Ekonomou, L.; Gonos, I.F.; Stathopulos, I.A. Measurement of the Resistive Leakage Current in Surge Arresters under Artificial Rain Test and Impulse Voltage Subjection. IET Sci. Meas. Technol. 2009, 3, 256–262. [Google Scholar] [CrossRef] [Green Version]
  15. Bayadi, A.; Harid, N.; Zehar, K.; Belkhiat, S. Simulation of metal oxide surge arrester dynamic behavior under fast transients. In Proceedings of the International Conference on Power Systems Transients, New Orleans, USA, 28 September–1 October 2003. [Google Scholar]
  16. Da Silva, D.A.; de Jesus, R.C.; Pissolato, J.; Lahti, K. Partial discharge activity in distribution MOSAs due to internal moisture. In Proceedings of the 2015 International Symposium on Lightning Protection (XIII SIPDA), Balneario Camboriu, Brazil, 28 September–2 October 2015. [Google Scholar]
  17. Chrzan, K.L. Influence of Moisture and Partial Discharges on the Degradation of High-Voltage Surge Arresters. Eur. Trans. Electr. Power 2004, 14, 175–184. [Google Scholar] [CrossRef] [Green Version]
  18. Khodsuz, M.; Mirzaie, M. Evaluation of Ultraviolet Ageing, Pollution and Varistor Degradation Effects on Harmonic Contents of Surge Arrester Leakage Current. IET Sci. Meas. Technol. 2015, 9, 979–986. [Google Scholar] [CrossRef]
  19. Sundararajan, R.; Soundarajan, E.; Mohammed, A.; Graves, J. Multistress Accelerated Aging of Polymer Housed Surge Arresters Under Simulated Coastal Florida Conditions. IEEE Trans. Dielectr. Electr. Insul. 2006, 13, 211–226. [Google Scholar] [CrossRef]
  20. Heinrich, C.; Hinrichsen, V. Diagnostics and Monitoring of Metal-Oxide Surge Arresters in High-Voltage Networks-Comparison of Existing and Newly Developed Procedures. IEEE Trans. Power Deliv. 2001, 16, 138–143. [Google Scholar] [CrossRef]
  21. Lira, G.R.S.; Costa, E.G. MOSA Monitoring Technique Based on Analysis of Total Leakage Current. IEEE Trans. Power Deliv. 2013, 28, 1057–1062. [Google Scholar] [CrossRef]
  22. Lahti, K.; Kannus, K.; Nousiainen, K. Diagnostic Methods in Revealing Internal Moisture in Polymer Housed Metal Oxide Surge Arresters. IEEE Trans. Power Deliv. 2002, 17, 951–956. [Google Scholar] [CrossRef]
  23. Doorsamy, W.; Bokoro, P. Condition monitoring of metal-oxide surge arresters using leakage current signal analysis. In Proceedings of the 2018 IEEE International Conference on High Voltage Engineering and Application (ICHVE), Athens, Greece, 10–13 September 2018.
  24. Wong, K.L. Electromagnetic emission based monitoring technique for polymer ZnO surge arresters. IEEE Trans. Dielectr. Electr. Insul. 2006, 13, 181–190. [Google Scholar] [CrossRef]
  25. Dobric, G.; Stojkovic, Z.; Stojanovic, Z. Experimental Verification of Monitoring Techniques for Metal-Oxide Surge Arrester. IET Gener. Transm. Distrib. 2020, 14, 1021–1030. [Google Scholar] [CrossRef]
  26. Metwally, I.A.; Eladawy, M.; Feilat, E.A. Online Condition Monitoring of Surge Arresters Based on Third-Harmonic Analysis of Leakage Current. IEEE Trans. Dielectr. Electr. Insul. 2017, 24, 2274–2281. [Google Scholar] [CrossRef]
  27. Malek, A.; Bashir, N.; Asilah, N. Jurnal Teknologi Thermal Image and Leakage Current Diagnostic as a Tool for Testing and Condition Monitoring of ZnO Surge Arrester. J. Teknol. 2013, 64, 2180–3722. [Google Scholar]
  28. Wanderley Neto, E.T.; da Costa, E.G.; Maia, M.J.A. Artificial Neural Networks Used for ZnO Arresters Diagnosis. IEEE Trans. Power Deliv. 2009, 24, 1390–1395. [Google Scholar] [CrossRef]
  29. Lira, G.R.S.; Costa, E.G.; Almeida, C.W.D. Self-organizing maps applied to monitoring and diagnosis of ZnO surge arresters. In Proceedings of the 2010 IEEE/PES Transmission and Distribution Conference and Exposition: Latin America (T&D-LA), Sao Paulo, Brazil, 8–10 November 2010; IEEE: Piscataway, NJ, USA, 2010; pp. 659–664. [Google Scholar]
  30. Lira, G.R.S.; Costa, E.G.; Ferreira, T.v. Metal-Oxide Surge Arrester Monitoring and Diagnosis by Self-Organizing Maps. Electric Power Systems Research 2014, 108, 315–321. [Google Scholar] [CrossRef]
  31. Akbar, M.; Ahmad, M. Failure study of metal-oxide surge arresters. Electr. Power Syst. Res. 1999, 50, 79–82. [Google Scholar] [CrossRef]
  32. Gumede, M.; d’Almaine, G.F. Surge Arrester Faults and Their Causes at EThekwini Electricity. Int. J. Electr. Energy 2014, 2, 39–44. [Google Scholar] [CrossRef]
  33. Alfredo Osornio-Rios, R.; Antonino-Daviu, J.A.; de Jesus Romero-Troncoso, R. Recent Industrial Applications of Infrared Thermography: A Review. IEEE Trans. Industr. Inform. 2019, 15, 615–625. [Google Scholar] [CrossRef]
  34. Chou, Y.C.; Yao, L. Automatic Diagnosis System of Electrical Equipment Using Infrared Thermography. In Proceedings of the SoCPaR 2009-Soft Computing and Pattern Recognition, Malacca, Malaysia, 4–7 December 2009; pp. 155–160. [Google Scholar]
  35. Das, A.K.; Dey, D.; Chatterjee, B.; Dalai, S. A Transfer Learning Approach to Sense the Degree of Surface Pollution for Metal Oxide Surge Arrester Employing Infrared Thermal Imaging. IEEE Sens. J. 2021, 21, 16961–16968. [Google Scholar] [CrossRef]
  36. Bagavathiappan, S.; Lahiri, B.B.; Saravanan, T.; Philip, J.; Jayakumar, T. Infrared Thermography for Condition Monitoring—A Review. Infrared Phys. Technol. 2013, 60, 35–55. [Google Scholar] [CrossRef]
  37. Almeida, C.A.L.; Braga, A.P.; Nascimento, S.; Paiva, V.; Martins, H.J.A.; Torres, R.; Caminhas, W.M. Intelligent Thermographic Diagnostic Applied to Surge Arresters: A New Approach. IEEE Trans. Power Deliv. 2009, 24, 751–757. [Google Scholar] [CrossRef]
  38. Lee, S.; Lee, S.; Lee, B. Analysis of thermal and electrical properties of ZnO arrester block. Curr. Appl. Phys. 2010, 10, 176–180. [Google Scholar] [CrossRef]
  39. Stefenon, S.F.; Branco, N.W.; Nied, A.; Bertol, D.W.; Finardi, E.C.; Sartori, A.; Meyer, L.H.; Grebogi, R.B. Analysis of Training Techniques of ANN for Classification of Insulators in Electrical Power Systems. IET Gener. Transm. Distrib. 2020, 14, 1591–1597. [Google Scholar] [CrossRef]
  40. Raymond, W.J.K.; Illias, H.A.; Bakar, A.H.A.; Mokhlis, H. Partial Discharge Classifications: Review of Recent Progress. Measurement 2015, 68, 164–181. [Google Scholar] [CrossRef] [Green Version]
  41. Chen, L.J.; Tsao, T.P.; Lin, Y.H. New Diagnosis Approach to Epoxy Resin Transformer Partial Discharge Using Acoustic Technology. IEEE Trans. Power Deliv. 2005, 20, 2501–2508. [Google Scholar] [CrossRef]
  42. Ilkhechi, H.D.; Samimi, M.H. Applications of the Acoustic Method in Partial Discharge Measurement: A Review. IEEE Trans. Dielectr. Electr. Insul. 2021, 28, 42–51. [Google Scholar] [CrossRef]
  43. Neto, N.F.S.; Stefenon, S.F.; Meyer, L.H.; Bruns, R.; Nied, A.; Seman, L.O.; Gonzalez, G.V.; Leithardt, V.R.Q.; Yow, K.C. A Study of Multilayer Perceptron Networks Applied to Classification of Ceramic Insulators Using Ultrasound. Appl. Sci. 2021, 11, 1592. [Google Scholar] [CrossRef]
  44. Xu, J.; Kubis, A.; Zhou, K.; Ye, Z.; Luo, L. Electromagnetic Field and Thermal Distribution Optimisation in Shell-Type Traction Transformers. IET Electr. Power Appl. 2013, 7, 627–632. [Google Scholar] [CrossRef]
  45. Khodsuz, M.; Mirzaie, M. Harmonics Ratios of Resistive Leakage Current as Metal Oxide Surge Arresters Diagnostic Tools. Measurement 2015, 70, 148–155. [Google Scholar] [CrossRef]
  46. Latiff, N.A.A.; Illias, H.A.; Bakar, A.H.A.; Dabbak, S.Z.A. Measurement and Modelling of Leakage Current Behaviour in ZnO Surge Arresters under Various Applied Voltage Amplitudes and Pollution Conditions. Energies 2018, 11, 875. [Google Scholar] [CrossRef] [Green Version]
  47. Fu, Z.; Wang, J.; Bretas, A.; Ou, Y.; Zhou, G. Measurement Method for Resistive Current Components of Metal Oxide Surge Arrester in Service. IEEE Trans. Power Deliv. 2018, 33, 2246–2253. [Google Scholar] [CrossRef]
  48. Das, A.K.; Dalai, S. Recent Development in Condition Monitoring Methodologies of MOSA Employing Leakage Current Signal: A Review. IEEE Sens. J. 2021, 21, 14559–14568. [Google Scholar] [CrossRef]
  49. Abdul-Malek, Z.; Yusoff, N.; Yousof, M.F.M. Field experience on surge arrester condition monitoring—Modified Shifted Current Method. In Proceedings of the 45th International Universities Power Engineering Conference UPEC 2010, Cardiff, UK, 31 August–3 September 2010; pp. 1–5. [Google Scholar]
  50. Khodsuz, M.; Mirzaie, M.; Seyyedbarzegar, S. Metal Oxide Surge Arrester Condition Monitoring Based on Analysis of Leakage Current Components. Int. J. Electr. Power Energy Syst. 2015, 66, 188–193. [Google Scholar] [CrossRef]
  51. Khodsuz, M.; Mirzaie, M. An Improved Time-Delay Addition Method for MOSA Resistive Leakage Current Extraction under Applied Harmonic Voltage. Measurement 2016, 77, 327–334. [Google Scholar] [CrossRef]
  52. Munir, A.; Abdul-Malek, Z.; Arshad, R.N. Resistive Component Extraction of Leakage Current in Metal Oxide Surge Arrester: A Hybrid Method. Measurement 2021, 173, 108588. [Google Scholar] [CrossRef]
  53. Barannik, M.; Kolobov, V. System for Monitoring the Condition of Metal-Oxide Surge Arresters in Service. In Proceedings of the 2020 International Multi-Conference on Industrial Engineering and Modern Technologies (FarEastCon), Vladivostok, Russia, 6–9 October 2020; pp. 1–6. [Google Scholar] [CrossRef]
  54. Khodsuz, M.; dan Seyyedbarzegar, S.M. Surge Arrester Monitoring under Different Operating Conditions Using BeesANFIS. Iran. J. Electr. Electron. Eng. 2019, 1, 151–160. [Google Scholar]
  55. Silva, D.A.; Costa, E.C.M.; Franco, J.L.; Abreu, S.R.; Jesus, R.C.; Antonionni, M.; Pissolato, J. Polymer Surge Arresters: Degradation versus Electrical Performance. In Proceedings of the 2012 IEEE Electrical Power and Energy Conference, EPEC 2012, London, ON, Canada, 10–12 October 2012; pp. 63–68. [Google Scholar]
  56. Abdul-Malek, Z.; Bashir, N. Condition Monitoring of Zinc Oxide Surge Arresters. In Practical Applications and Solutions Using LabVIEW™ Software; InTech: Vienna, Austria, 2011; pp. 253–270. [Google Scholar]
  57. Seyyedbarzegar, S.M.; Mirzaie, M. Thermal Balance Diagram Modelling of Surge Arrester for Thermal Stability Analysis Considering ZnO Varistor Degradation Effect. IET Gener. Transm. Distrib. 2016, 10, 1570–1581. [Google Scholar] [CrossRef]
  58. Woodworth, J.J. ArresterFacts 027 Arrester Reference Voltage Copyright ArresterWorks. ArresterWoks: Buffalo, NY, USA, 2011. [Google Scholar]
  59. Mardira, K.P.; Saha, T.K.; Sutton, R.A. Investigation of diagnostic techniques for metal oxide surge arresters. IEEE Trans. Dielectr. Electr. Insul. 2005, 12, 50–59. [Google Scholar] [CrossRef]
  60. He, J.; Zeng, R.; Chen, S.; Tu, Y. Thermal Characteristics of High-Voltage Whole-Solid-Insulated Polymeric ZnO Surge Arrester. IEEE Power Eng. Rev. 2008, 22, 62. [Google Scholar] [CrossRef]
  61. Seyyedbarzegar, S.M.; Mirzaie, M. Heat Transfer Analysis of Metal Oxide Surge Arrester under Power Frequency Applied Voltage. Energy 2015, 93, 141–153. [Google Scholar] [CrossRef]
  62. Miller, D.R.; Woodworth, J.J.; Daley, C.W. Watts loss of polymer housed surge arresters in a simulated Florida coastal climate. IEEE Trans. Power Deliv. 1999, 14, 940–947. [Google Scholar] [CrossRef]
  63. IEC 60099-4; Surge Arresters: Part 4: Metal-Oxide Surge Arresters without Gaps for a.c. Systems. 2nd ed. IEC: Geneva, Switzerland, 2004.
  64. Abb, A.B. High Voltage Surge Arresters-Buyer’s Guide, Ludvika, Sweden, June 2009. Available online: http://www.abb.com/product/se/9AAC710009.aspx (accessed on 18 October 2022).
Figure 1. Thermal image of a MOSA with surface pollution in a laboratory.
Energies 15 08091 g001
Figure 2. Neural network structure for implementing the diagnostic technique.
Energies 15 08091 g002
Figure 3. The experimental setup for electrical partial discharge with a sample of its outcome.
Energies 15 08091 g003
Figure 4. Electromagnetic emission setup.
Energies 15 08091 g004
Figure 5. The experimental setup for the leakage-current measurement in a laboratory.
Energies 15 08091 g005
Figure 6. An example of capacitive, resistive, and total leakage currents.
Energies 15 08091 g006
Figure 7. V-I characteristics of healthy and degraded MOSAs.
Energies 15 08091 g007
Figure 8. The experimental setup for the lightning impulse voltage test in a laboratory.
Energies 15 08091 g008
Figure 9. Advantages and disadvantages of MOSA diagnostic methods.
Energies 15 08091 g009
Table 1. Comparison of papers related to MOSA diagnostic and condition monitoring.
References[22][11][23][20][24][25][26][16][27]This Paper
Leakage current
Thermal image------
Partial discharge------
Resistive current----
V-I characteristic------
Power loss----
Reference voltage------
Electromagnetic--------
Table 2. Comparison of properties, advantages, and disadvantages of MOSA diagnostic methods in different papers.
ReferencePropertiesAdvantageDisadvantage
[37]Uses thermovision to detect arrester failure and the probability of a fault.
Employs a digital image processing technique based on the watershed transform, and uses the neuro-fuzzy network.
A non-destructive procedure; a decision-making instrument for identifying surge arrester faults.
In addition to normal and faulty conditions, the surge arrester includes the following intermediate conditions: light and suspicious.
If the parameters of a thermogram alter drastically, the tool may not produce reliable data.
The thermogram’s placement should be properly specified.
[16]After immersion testing, it observes the partial discharge and leakage current on eight surge arresters.It assesses the behavioral relationship between internal humidity and partial discharge and MOSA degradation.The measurement of partial discharge was less accurate than power loss.
The electrical partial discharge measurements are particularly susceptible to external noise.
[24]Utilizes the electromagnetic emission method to identify partial discharge and lightning arrester surface flaws.As a diagnostic technique, the WVD analysis can be employed with the use of a signal processing algorithm.
It has a wireless connection and a small and inexpensive antenna.
Since there may be other electromagnetic signals present, data collecting with this method is highly challenging and is susceptible to errors.
[50]Analyzes leakage currents to assess the condition of the arrester.It creates a database of medium- and high-voltage arresters with varying functioning conditions.
It uses signal processing in MATLAB and the simulation of the leakage current in ATP-EMTP to verify its analysis.
The extraction result of resistive and capacitive components of the leakage current may be unreliable, and online testing is difficult.
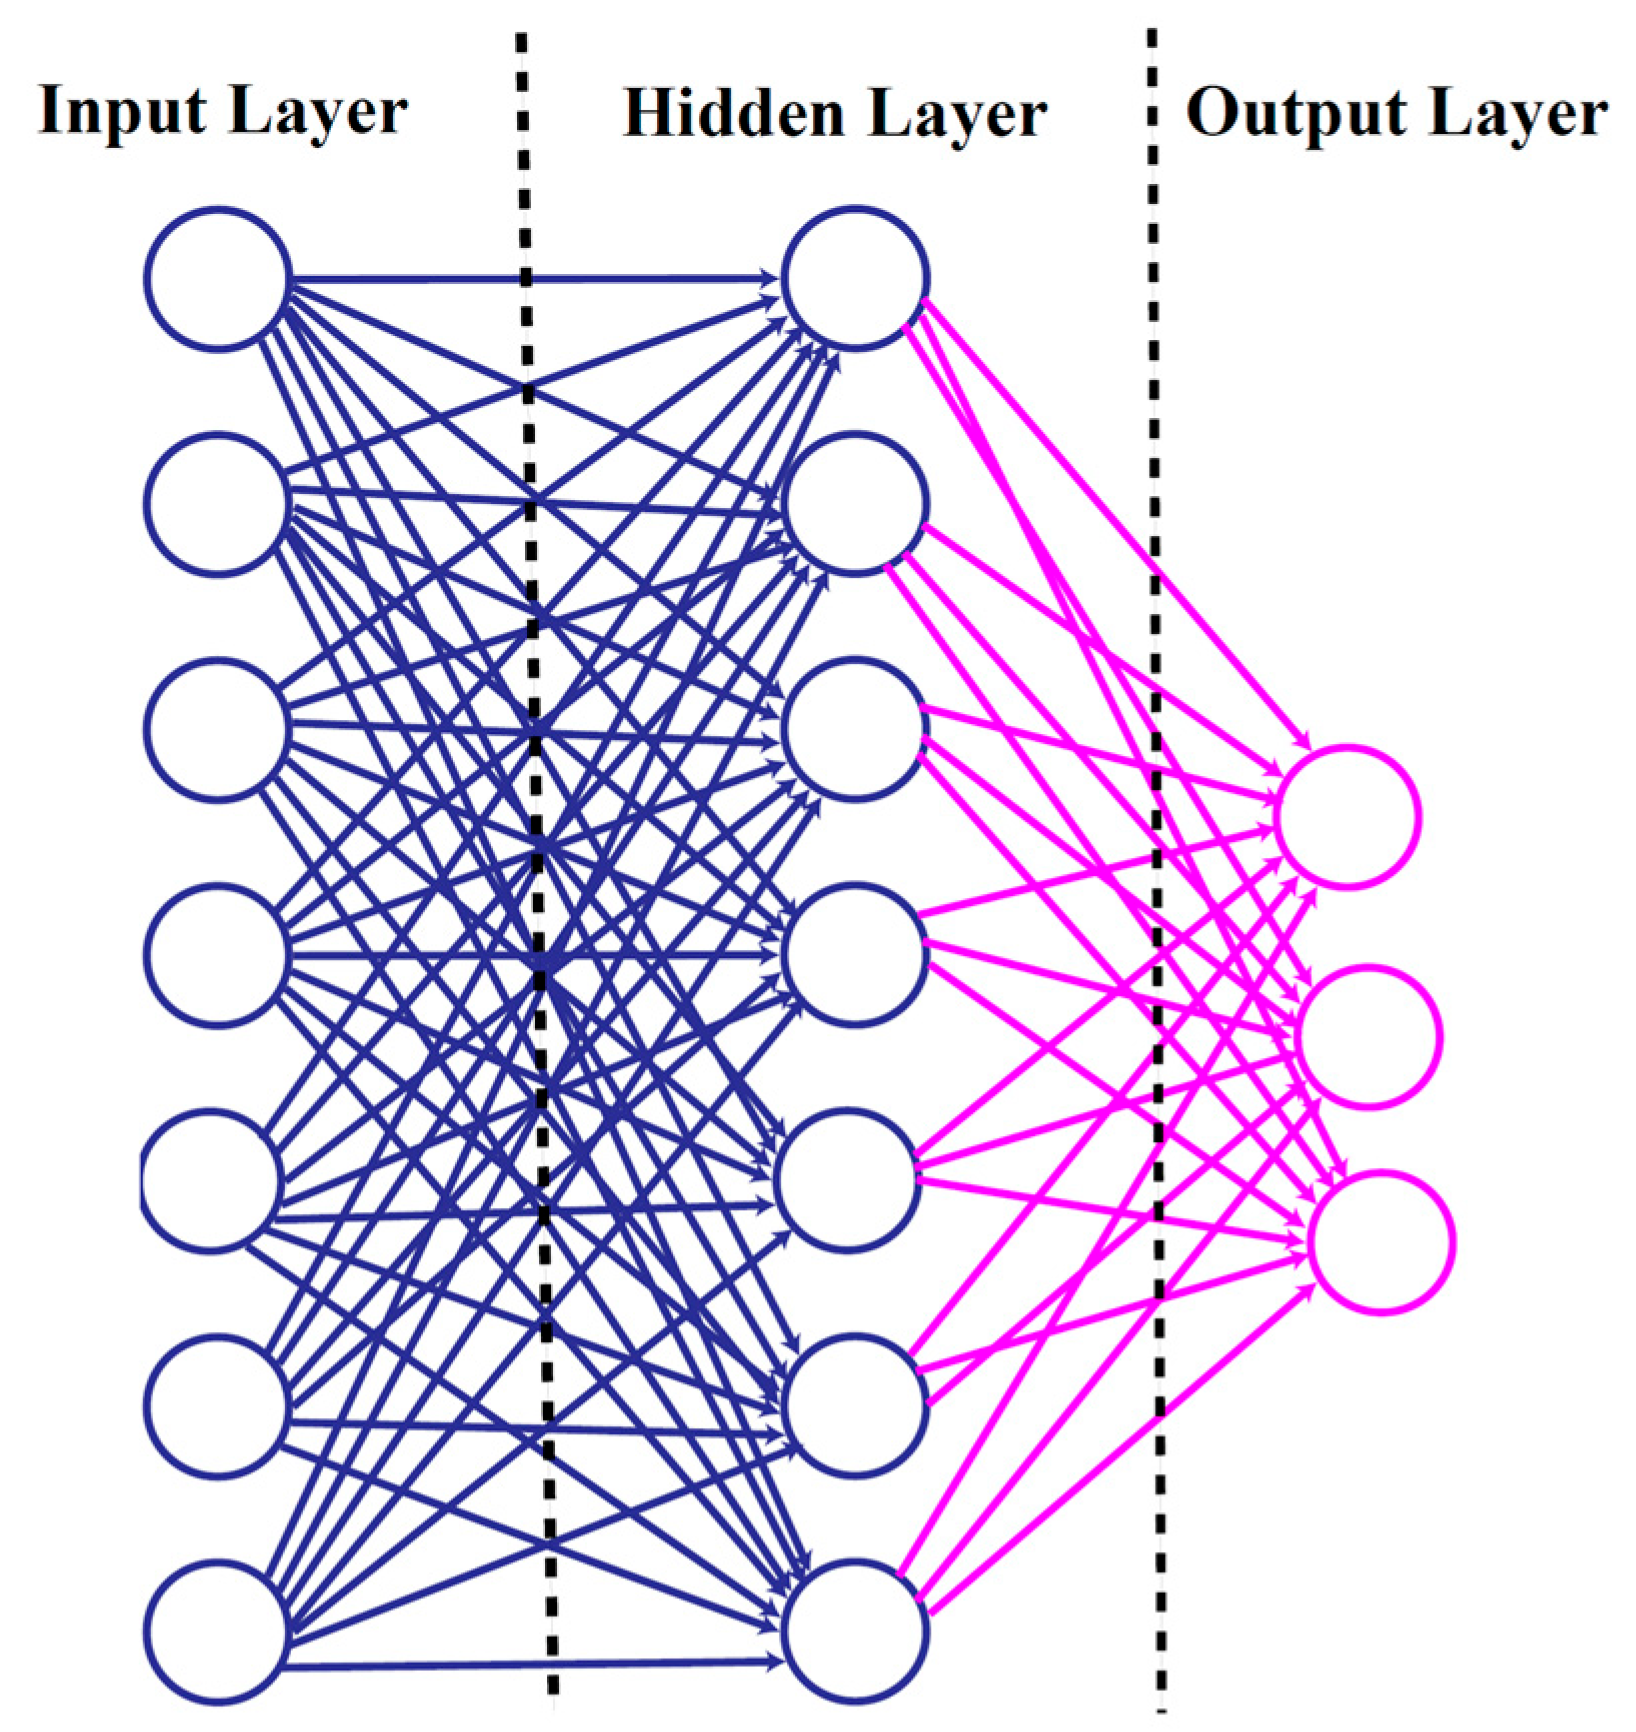
[12]Classifies arresters using experimental tests and the multi-layer support vector machine method (SVM).The classifier performs exceptionally well regarding training speed and reliability.
It can categorize samples into some categories.
The SVM cannot detect the error of specific information; it can only categorize samples into some categories.
The classification performance is heavily dependent on the MOSA parameters chosen; the algorithm cannot choose the MOSA parameters automatically.
[13]The MOSA’s condition assessment utilizes a leakage current analysis technique at the operating condition.The applicability of specific indicators for evaluating the MOSA’s condition was assessed.
There has been a suggestion for a solution to reduce the impact of voltage harmonics and fluctuation on the result of the leakage current analysis.
The difficulty of simultaneous current and voltage measurements at the network and higher harmonics may make tests invalid.
Publisher’s Note: MDPI stays neutral with regard to jurisdictional claims in published maps and institutional affiliations.

