Article

Developing AI/ML Based Predictive Capabilities for a Compression Ignition Engine Using Pseudo Dynamometer Data

1
DEVCOM Army Research Laboratory, 2800 Powder Mill Road, Adelphi, MD 20783, USA
2
Department of Chemistry and Life Science, United States Military Academy, Bldg. 753, West Point, NY 10996, USA
*
Author to whom correspondence should be addressed.
These authors contributed equally to this work.
Energies 2022, 15(21), 8035; https://doi.org/10.3390/en15218035
Submission received: 21 September 2022 / Revised: 16 October 2022 / Accepted: 19 October 2022 / Published: 28 October 2022
(This article belongs to the Section F5: Artificial Intelligence and Smart Energy)

Abstract

:
Energy and power demands for military operations continue to rise as autonomous air, land, and sea platforms are developed and deployed with increasingly energetic weapon systems. The primary limiting capability hindering full integration of such systems is the need to effectively and efficiently manage, generate, and transmit energy across the battlefield. Energy efficiency is primarily dictated by the number of dissimilar energy conversion processes in the system. After combustion, a Compression Ignition (CI) engine must periodically continue to inject fuel to produce mechanical energy, simultaneously generating thermal, acoustic, and fluid energy (in the form of unburnt hydrocarbons, engine coolant, and engine oil). In this paper, we present multiple sets of Shallow Artificial Neural Networks (SANNs), Convolutional Neural Network (CNNs), and K-th Nearest Neighbor (KNN) classifiers, capable of approximating the in-cylinder conditions and informing future optimization and control efforts. The neural networks provide outstanding predictive capabilities of the variables of interest and improve understanding of the energy and power management of a CI engine, leading to improved awareness, efficiency, and resilience at the device and system level.

1. Introduction

Development and deployment of semi-autonomous and autonomous based vehicles are vital to the Army’s modernization priorities and expected to offer the warfighter with new capabilities that help them to operate at the tactical edge. Energy and power demands for systems can be low, however the aggregation of multiple platforms will require substantial energy and power. This will strain the energy and power supplies on the battlefield, increasing the probability that military operations will become energy constrained. Hybridization of a vehicles’ powertrain is likely the most efficient and effective methodology to bolster the military’s operational prowess and provide near-term warfighter benefits, enabling their systems to be more mission effective and efficient.
Internal Combustion Engines (ICEs) are used as the primary or secondary source of power generation for traditional and hybridized vehicles, respectively, and are unlikely to be phased out long-term. Currently, there are no safe alternative fuel sources with comparable energy density to fossil fuels. Traditional vehicle powertrain efficiency is primarily dictated by the engine, while fossil fuels have a relatively high energy density, typical gasoline or diesel-based engine are between 25 % and 45 % efficient, meaning 75 % to 55 % of the energy contained within the fuel is considered to be unusable or waste energy, commonly referred to as exergy destruction. According to Bourhis and Leduc [1], recovering energy/exergy wasted within the diesel engine and powertrain could reasonably lead to a 15 % or 10 % increase in energy/exergy efficiency for a gasoline engine or diesel engine, respectively.
The bulk of the exergetic losses are a direct result of the thermodynamic processes that govern the engines cycle, i.e., Otto, Diesel, or Brayton to name a few. Effective and efficient use of standard or hybridized vehicle powertrains ultimately requires a detailed understanding of the energy and exergy-based characterizations of the engine, electric motors, generators, and the aggregation of the powertrain. It was for this reason that we sought to develop a set of Artificial Intelligence (AI) and Machine Learning (ML) based predictive capabilities to approximate the behavior of an ICE, specifically a Compression Ignition (CI) engine.
It is prohibitively expensive to install laboratory grade sensors on and within the engine to be used in combination with dynamometers for developing characteristic engine maps. Using a set of pseudo engine dynamometer-based datasets generated from GT-Power, we developed multiple sets of Artificial Neural Networks (ANNs) capable of approximating the in-cylinder conditions of a CI engine. The remainder of this section is arranged as follows: (1) a general synopsis of AI/ML is discussed, (2) followed by a discussion of energy and exergy-based energy management policies for various vehicle powertrains, and (3) a conclusion section highlighting some notable technical literature dedicated to developing and deploying AI/ML in regards to engine modeling and control.

1.1. Artificial Intelligence and Machine Learning

Generally there are two different types of AI/ML based algorithms: shallow and deep artificial neural networks. The terms shallow and deep generally refer to the density of the hidden layers as defined within the different neural network’s architectures. Shallow neural networks were historically used to define networks with very few numbers of hidden neural networks (neurons), while deep neural networks would have far greater number of hidden neurons exceeding 75–100. Deep neural networks often included additional more exotic alternative types of signal routing including skip connections, dropout layers, and sequence layers to name a few. Omitting the terminology of shallow or deep, there are then various commonly discussed types of AI/ML based architectures to include but not limited to feedforward Shallow Artificial Neural Networks (SANNs) [2], Nonlinear Autoregressive with External Input Neural Networks (NARXs) [3], Recurrent Neural Networks (RNNs) [4], Residual Neural Networks (ResNets) [5], Convolutional Neural Network (CNNs) [6], Multi-Layer Perceptron (MLP) [7], and various other types of classifiers.
The algorithm selection is an important first step in generating AI/ML based algorithms. Each of the dissimilarly defined neural network architectures were developed for various applications, such as classifying images, time-series prediction, and sequence-to-sequence image predictions. The primary goal for developing AI/ML is to ultimately replace computationally expensive processes with lightweight computationally efficient algorithms which approximate the behavior of a system. To achieve this, the AI/ML algorithm must have a target feature and a set of input features. The target feature is what we desire to predict, the input features are features which must in some way relate back to the target feature. If there are no direct correlations between the target and input feature selected, the neural network may be unable to converge, and performance of the network could be limited. With both the target and input feature selected, the neural networks must be trained, this is primarily where the term machine learning is derived from, i.e., the process used to train the artificial intelligence.
There are four application areas of learning/training: online, offline, transfer, and reinforcement learning. Online learning is the most difficult. An algorithm is selected and trained concurrently to the operation of a system. As a result, this type of learning has low training data requirements. Offline learning is the most common type of training where large, correlated sets of data are used for training of the algorithms. Transfer learning is a combination of both online and offline learning. For transfer learning, a general set of algorithms are first trained to solve one problem. The trained algorithms are then used to solve a second problem which is similar to the first problem. The knowledge leveraged from the first problem is transferred to solve the second problem. Transfer learning can be achieved by first training an algorithm offline, and then retrained or adapted once online, as the online training model is likely to be different than the offline training model. The final type of learning is reinforcement learning, where regions of the algorithm’s operation are assessed and weighted such that when training begins, the neural network will learn the desired target by understanding the operation of the algorithm subject to violating the previously set regions. This type of training/learning falls somewhere in-between offline and transfer learning in terms of training data requirements.
Aside from the learning methodology, there are two separate types of learning-based algorithms: supervised and unsupervised. In supervised learning, an engineer or scientist uses their operational understanding to first select the intended AI/ML algorithm and subsequently selects the set of input features required to generate a predictor capable of predicting the desired set of target features. The algorithm’s training is supervised by the engineer or scientist, guided by their engineering prowess. Conversely, for unsupervised learning, the algorithm and target selection are specifically defined. The user may also define a set of general inputs which can be used for development of the AI/ML algorithms to generate the desired prediction. During the learning/training process, the algorithm will determine which input features should remain to predict the desired set of target features, and which are unnecessary and should be omitted.

1.2. Applied Artificial Intelligence and Machine Learning: Powertrain

Du et al. [8] developed a deep Reinforcement Learning (RL) based EMS for a series hybrid tracked-type vehicle. The authors developed a new RL method termed Dyna-H which included a deep RL based algorithm that used Q-Learning (DQL). The “Q-learning algorithm is a widely used model-free reinforcement learning algorithm. It corresponds to the Robbins–Monro stochastic approximation algorithm applied to estimate the value function of Bellman’s dynamic programming equation.” [9]. This new algorithm was then compared to a more traditional Dynamic Programming (DP) based energy management strategy. The RL based algorithm was able to converge more rapidly than the DQL method, this led to lower fuel consumption. It was also observed that the RL based method had better adaptability capabilities, validated through simulation using alternative drive cycles. Similarly, Lian et al. [10] used RL based algorithms to formulate an EMS but chose to focus on a cross-type transfer learning approach as opposed to reinforcement learning. These authors also chose to analyze three separate hybrid vehicle architectures to include a power-split bus, a series hybrid vehicle, and a series-parallel bus. The selected set of algorithms were originally developed for a hybrid vehicle powertrain emulating that of a Toyota Prius. The pre-trained algorithms were then applied to the alternative hybrid vehicle architectures and adapted through the use of transfer learning. On average, the authors noted a 70 % difference from the baseline with respect to convergence efficiency, i.e., transfer learning can be used to increase algorithm flexibility and applicability for systems which lie outside of the original training dataset, a known issue encountered with developing AI/ML based algorithms. Additional technical works which sought to use AI/ML for a series hybrid vehicle powertrains include [11,12,13].
Hybrid vehicle powertrains typically require more sophisticated and complex control algorithms. With complexity comes high computational demand, so many researchers have begun branching out to use reduced order modeling techniques coupled with AI/ML to develop more efficient or effective EMS based algorithms. Liu et al. [14] developed an EMS using velocity predictions and RL. Fuzzy encoding and nearest neighbor algorithms were deployed to predict the vehicle’s velocity and then combined with a finite-state Markov chain algorithm to identify probabilistic power demand transition conditions. Reinforcement learning was then applied to identify the optimal control behavior which minimized value stream impacts for the vehicle, namely fuel consumption and computational complexity. The results indicate that AI/ML based predictive capabilities can reduce fuel consumption and computational time when compared to a shortsighted DP algorithm. Additional technical works which sought to use AI/ML for a parallel hybrid vehicle powertrain include [15,16,17,18].
Similarly, Zhang et al. [19] chose to develop an EMS based strategy for an electric vehicle’s super-capacitor also known as an ultra-capacitor. The EMS was developed by employing wavelet transforms, artificial neural networks, and fuzzy logic. Wavelet transforms were used to identify which high frequency characteristics of the battery’s operation were better suited to be serviced by the super-capacitor, however such an analysis is not suitable for use in real-time. The artificial neural networks were then used to replicate the characteristic behavior of the wavelet transform, specifically the low frequency power demand for the battery. The neural networks were than combined with the fuzzy logic controller to regulate low frequency power demand, while the high-speed transient response was regulated by the super-capacitor. The system was simulated and validated through hardware implementation. Additional technical works which sought to use AI/ML for pure electrical vehicle powertrains are relatively sparse largely due to lack of infrastructure, and sufficient battery technology permitting comparable recharge duration and range requirements for automobiles. Some additional technical articles of interest which focus on development of AI/ML for purely electric based vehicles include [20,21,22].

1.3. Applied Artificial Intelligence and Machine Learning: Engine

Garg et al. [23] provided a recent review of AI/ML efforts to characterize engine performance and promote efficient control. Although there are a number of outstanding contributions in the literature, Garg notes that there are still many areas that need attention, particularly in areas where the models are complex and non-linear. From the work by Garg, it appears that most of the literature is focused on steady-state conditions, calibration, air flow, and fuel mixtures using a variety of AI/ML methods. This work seeks to model and gain insight for future use into an area that until now, appears to be missing from the literature; this manuscript focuses on using select neural networks to provide dynamic models of non-linear conditions within the cylinder(s) that will facilitate further accuracy in modeling, optimization, and control.

2. Modeling

For the foreseeable future, many if not all of the field-able military vehicles will possess some form of an ICE, primarily due to the fact that there are no low form factor energy storage capabilities which have comparable power density to traditional liquid fuels. Hybridization of a vehicles’ powertrain perpetuates the need to understand the energy and power requirements more accurately such that a vehicles’ performance may be optimized and controlled more effectively and efficiently. In order to sufficiently understand and characterize the performance of a vehicle, engineers and scientists usually devote vast amounts of time for simulating and modeling the complex non-linear dynamics of the vehicle’s powertrain, specifically the engine. Prototypes are then built and tested using dynamometers.
The remainder of this section has been broken down into two subsections. First, we will highlight the different engine configurations under investigation. Secondly, we will discuss the engine maps developed from a GT-Power based simulation. “GT-Power is the industry standard engine performance software package, used by all major engine manufacturers and vehicle OEMs. GT-Power is used to predict engine performance quantities such as power, torque, airflow, volumetric efficiency, fuel consumption, turbocharger performance and matching, and pumping losses, to name just a few.” [24]. The software utilizes non-linear multi-dimensional Navier–Stokes equations to predict the complex, nonlinear engine performance.

2.1. Compression Ignition Engine Configuration

Pseudo-dynamometer engine maps were constructed from a GT-Power based-engine model implemented by Clemson University researchers as part of a Cooperative Agreement (CA) established by the Ground Vehicle Systems Center (GVSC). Inter-agency collaborative research efforts allowed our research group to obtain quasi-steady state engine maps representing that of a 3-, 4-, 6-, and 8-cylinder in-line turbo-charged CI engine, emulating an 85, 125, 275, and 475 HP engine.
A dynamometer is an electrical mechanical system used to characterize the performance of an engine in a laboratory setting separate from the vehicle, such that the engines’ capability may be accurately characterized. Dynamometers must also include the respective thermal fluid-based coolant, exhaust, and intake components. The output shaft of the engine is connected to the input of the dynamometer, capable of measuring speed and torque produced by the engine. Additional laboratory grade sensors are also included at various locations in and around the engine. Once connected and configured, the engine may be operated at various speed and subjected to various engine torques or various operating conditions. The final result is then multiple multi-dimensional lookup tables that characterize the performance of the engine with respect to standard engine performance metrics, usually engine speed, torque, crank angle, and throttle or fuel index. It is expensive to mount and install laboratory grade sensors and time consuming, which is one of the reasons we sought to use pseudo-dynamometer data. The term pseudo-dynamometer refers to the fact that we have multiple multi-dimensional lookup tables for multiple engine configurations which are similar to data obtained from a laboratory engine-dynamometer experiment. The only major difference is the dataset is derived from GT-Power (engine-based simulation package).
The engine maps were contained in multiple three-dimensional matrices, arranged as a function of the crank angle degrees (CAD) array of length N, the steady state engine speed array of length M, and the power index/indices array of length K. For readers not intimately familiar with engine modeling and simulation, a power index is roughly equivalent to a Wide Open Throttle (WOT) condition, strictly speaking is only applicable for a Spark Ignition (SI) engine. The maximum power of an SI engine occurs where the maximum intake of air and fuel are injected into the engine, which occurs when the throttle valve is fully open, i.e., wide open. CI engines do not have a throttle valve, instead a power index sometimes referred to as a power ratio is used to maximize the generated power of an engine. By altering the power index, the amount of fuel being injected relative to the amount of air being pumped by the engine is controlled allowing the engine to produce more or less power. A WOT condition for a CI engine is when the maximum amount of fuel is injected relative to the total amount of air being pumped by the cylinders. A simplified approximation of the CI engine diagram has been provided in Figure 1 where numbered nodes represent relative sensor locations where engine state information were measured: (1) represents the input to the turbo charger compressor, (2) represents the output of the turbo charger compressor which feed the air cooler, (3) is the intake manifold, (4) represents the in-cylinder conditions, (5) represents the output manifold conditions the drives the turbo charger turbine, (6) represents the output of the turbo charger turbine, (7) represents the crank shaft, (8) represents the rigid shaft connecting the turbo charger compressor and turbine, and (9) represents the conditions of the engine block. A complete list of each of the sensor measurements have been provided in Appendix A.

2.2. Compression Ignition Engine Maps

The engines under investigation were four-stroke engines, for every two full rotations of the crank shaft, each of the cylinders will have completed one full cycle which is subdivided into four strokes including the (1) suction or charging stroke, (2) the compression stroke, (3) expansion or working/power stroke, and (4) the exhaust stroke. Each engine-data set contained multiple sets of three-dimensional matrices which were arranged as a function of the crank angle degree vector (Equation (1)), the fuel index (Equation (2)), and the steady state engine speed (Equation (3)). Examples of the three-dimensional matrices are not explicitly shown within the main body of the technical report; a small subset of the three-dimensional matrices can be visually observed within Appendix B.
θ = 109 108 107 610
η = 5.0 15.6 26.1 36.7 47.2 57.8 68.3 78.9 89.4 100.0
ω e = 700 1000 4000

3. Algorithm Development and Experimentation

Modern day IC engines are fundamentally governed by the thermodynamic laws and principles described by a set of chemical reactions and formulas of combustion. Tight coupling of combustion equations and thermodynamics gives rise to highly non-linear and computationally expensive dynamic equations which are difficult to develop and validate. High-powered software packages such as Gamma Technologies GT-Power/Suite, Riccardo Wave, Fluent, and Fire to name a few have been developed and are capable of constructing and simulating the complex non-linear dynamic equations of the engines or vehicles’ powertrain. The software packages are computationally expensive and depending on the model fidelity, not suitable for real-time operation. It is for this reason that we sought to develop a set of predictive algorithms based on AI/ML which can predict the current or perhaps future states of the engine, thereby enabling energy awareness regarding the operation of the engine. Lookup table approximations can be developed from engine dynamometer data; however, the interpolated data points are not guaranteed to abide by the thermodynamic laws or principles. Using AI/ML algorithms should permit such predictive algorithms to be routed within the physical world and thus are more likely to abide by the thermodynamic laws and principles, making AI/ML based algorithms potentially more extensible and realistic.

3.1. Input Feature Selection

General engine performance is primarily dictated by the geometrical configuration of the engine as defined by multiple static parameters including the bore, stroke, crank angle, connecting rod length, the clearance volume, and the number of cylinders. More detailed engine performance analysis is governed by dynamic input conditions such as fuel and air mixtures, pressure, temperature, altitude, fuel injection duration, fuel injection timing, cylinder firing order, and engine crank angle position. There are of course many other parameters which can further impact performance of the engine. In an effort to develop accurate and robust, yet computationally efficient, AI/ML based algorithms this study focuses on a subset of the possibly important sets of conditions which dictate performance of the engine. We selected forty-five separate input features including; (1) through (33) to include the past and future values of the crank angle θ as shown in Equation (4), (34) the power index ranging between zero and one-hundred η , (35) the engine speed ω e , (36) the atmospheric temperature T a , (37) the atmospheric pressure P a , (38) the occupied volume of the cylinder as a function of the crank angle V ( θ ) , (39) the occupied area of the cylinder as a function of the crank angle A ( θ ) , (40) the rated power of the engine divided by the total number of engine cylinders termed the per-cylinder rated power P c y l , (41) the rated power of the engine P r a t e d , (42) the rated engine speed ω r a t e d , (43) the number of cylinders N c y l , (44) the total displaced volume of the engine V d i s , and (45) the bore length L b .
θ ( t 40 ) ( 1 ) θ ( t 35 ) ( 2 ) θ ( t 10 ) ( 7 ) θ ( t 9 ) ( 8 ) θ ( t + 10 ) ( 27 ) θ ( t + 15 ) ( 28 ) θ ( t + 40 ) ( 33 )
We selected our input features iteratively using trial and error, and engineering intuition. Our goal was to generate AI/ML that could predict various engine states in near-real-time or real-time, with a limited amount of sensor data. As an example, in-cylinder pressure measurements are not standard on many if not all production vehicles, as such using the in-cylinder sensor data as an input is likely to be problematic if implemented on a real system. Thus, when selecting our input features, we chose to use input features which are specific to the engine configuration including bore length, number of cylinders or rated power of the engine. We also chose input features that describe the motion of the piston and therefore the engine states (suction/charging, compression, expansion, and exhaust). This allows us to predict the engine states without the need to have direct access to the engine’s sensor measurements, with exception of engine speed which relates back to the crank angle. Having various sensor measurements could likely improve performance of the AI/ML, however the absence of the sensor measurements is likely to significantly degrade performance of the AI/ML. Thus, if sensor measurements are used, it should reasonably be considered that the sensor is considered to be included on standard production vehicles.

3.2. Target Feature Selection

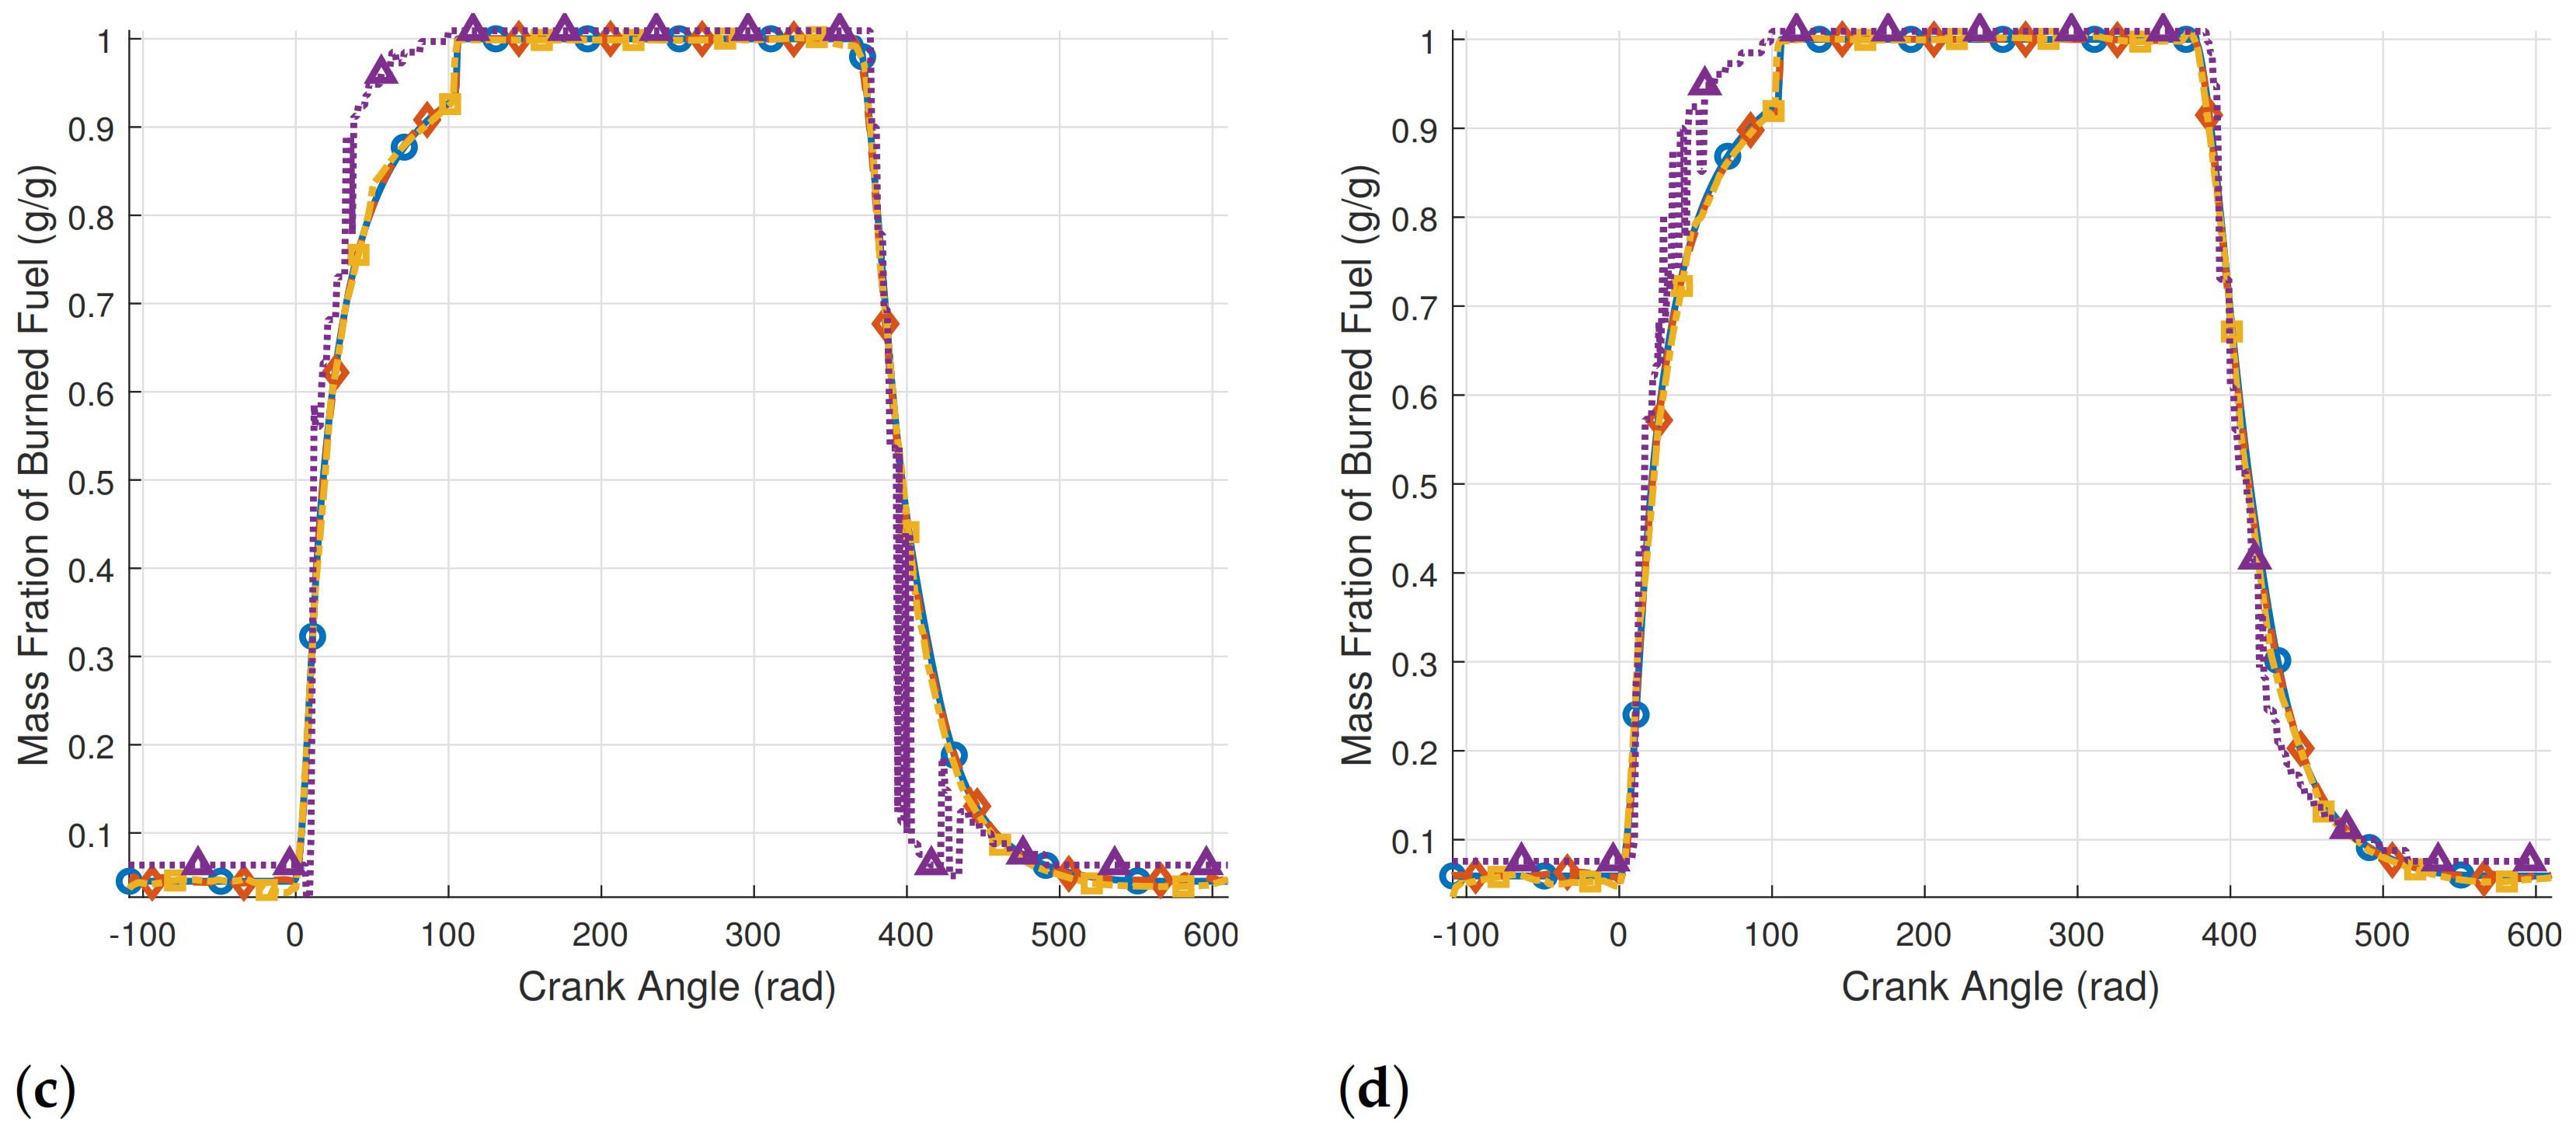
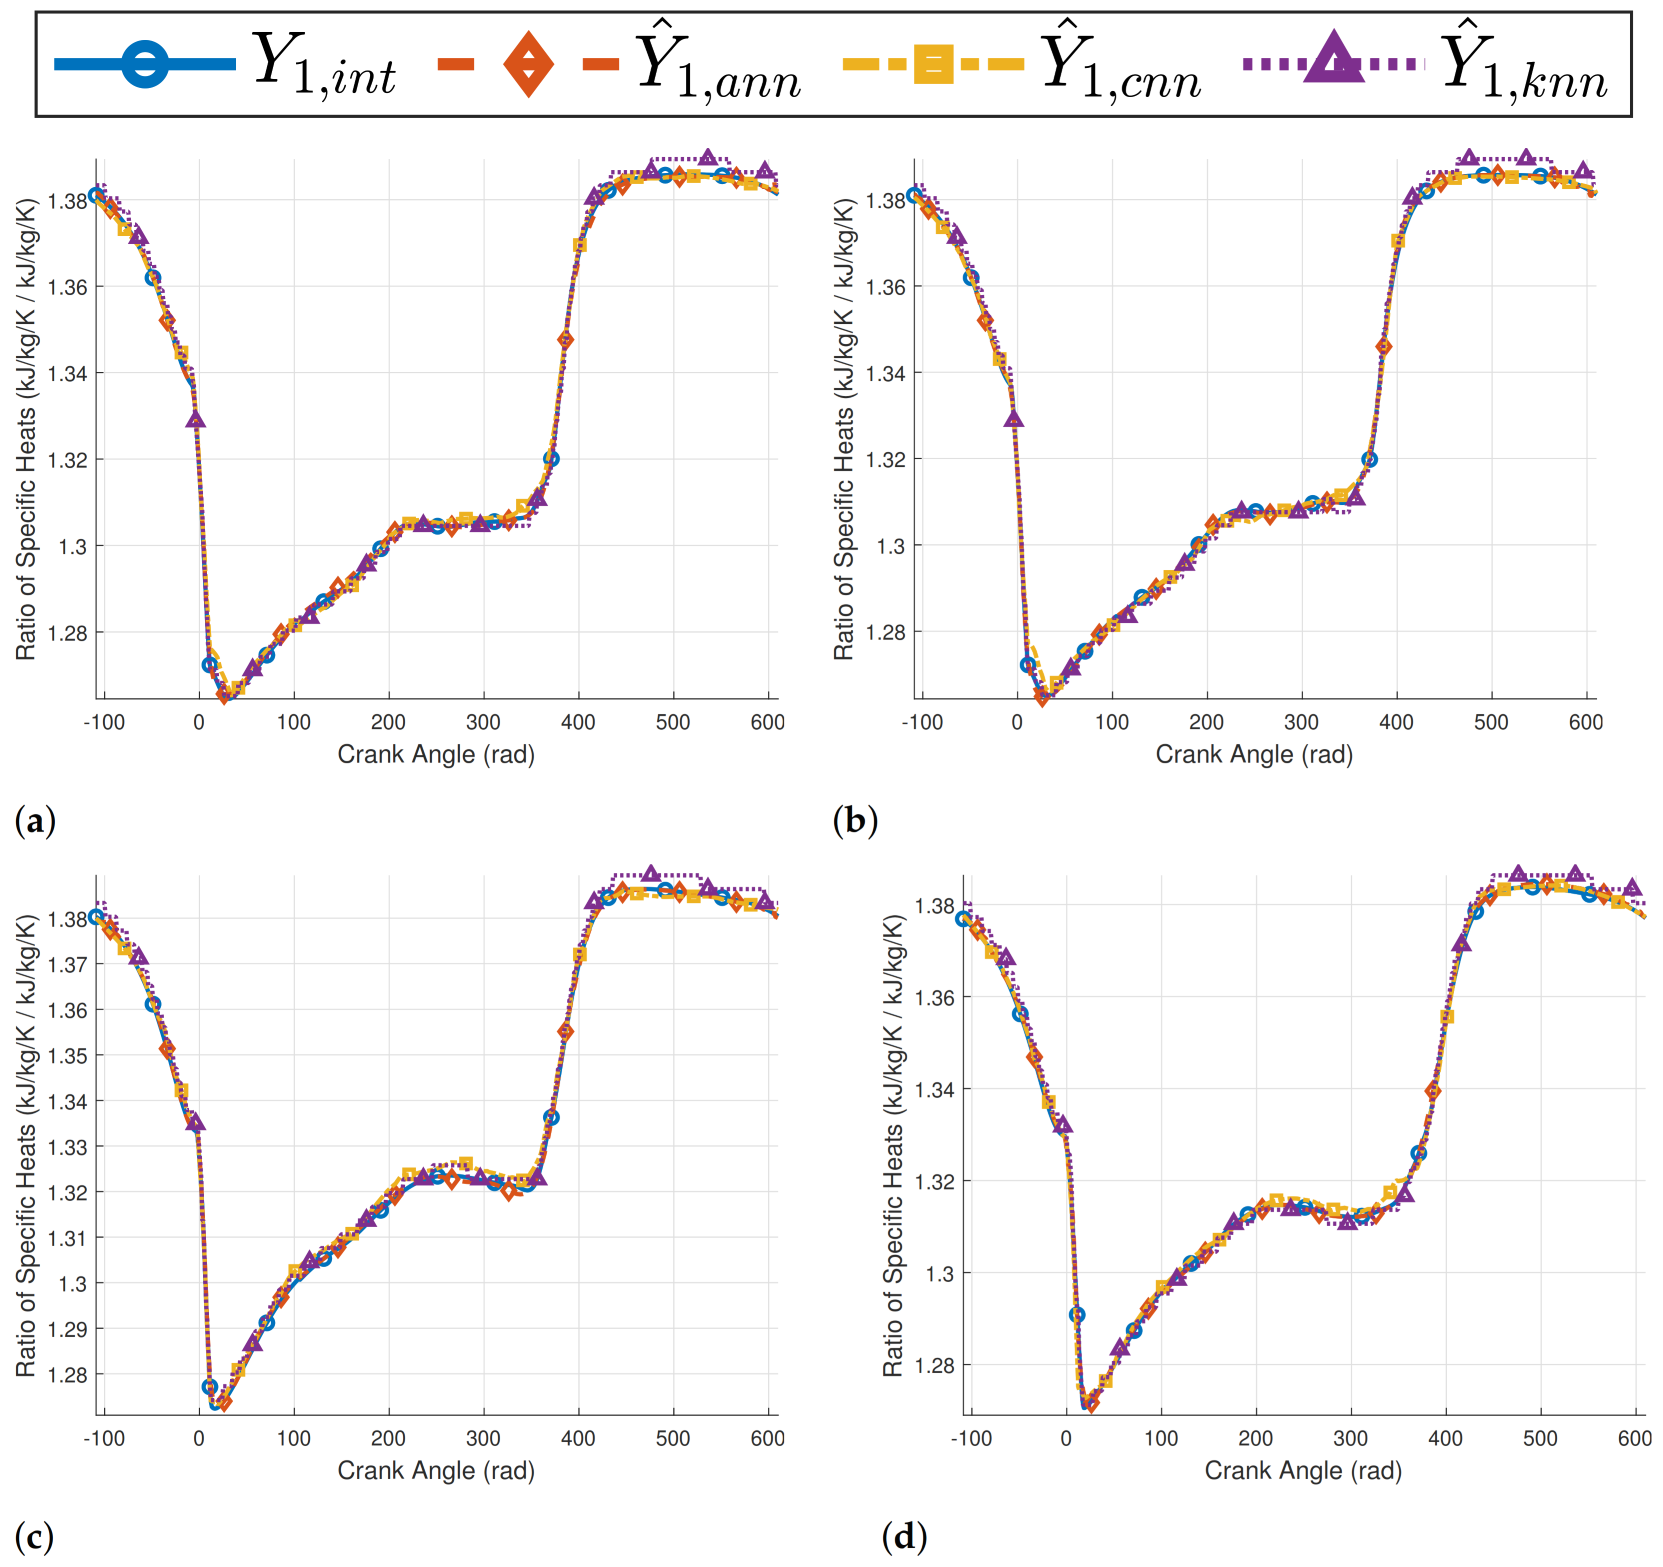
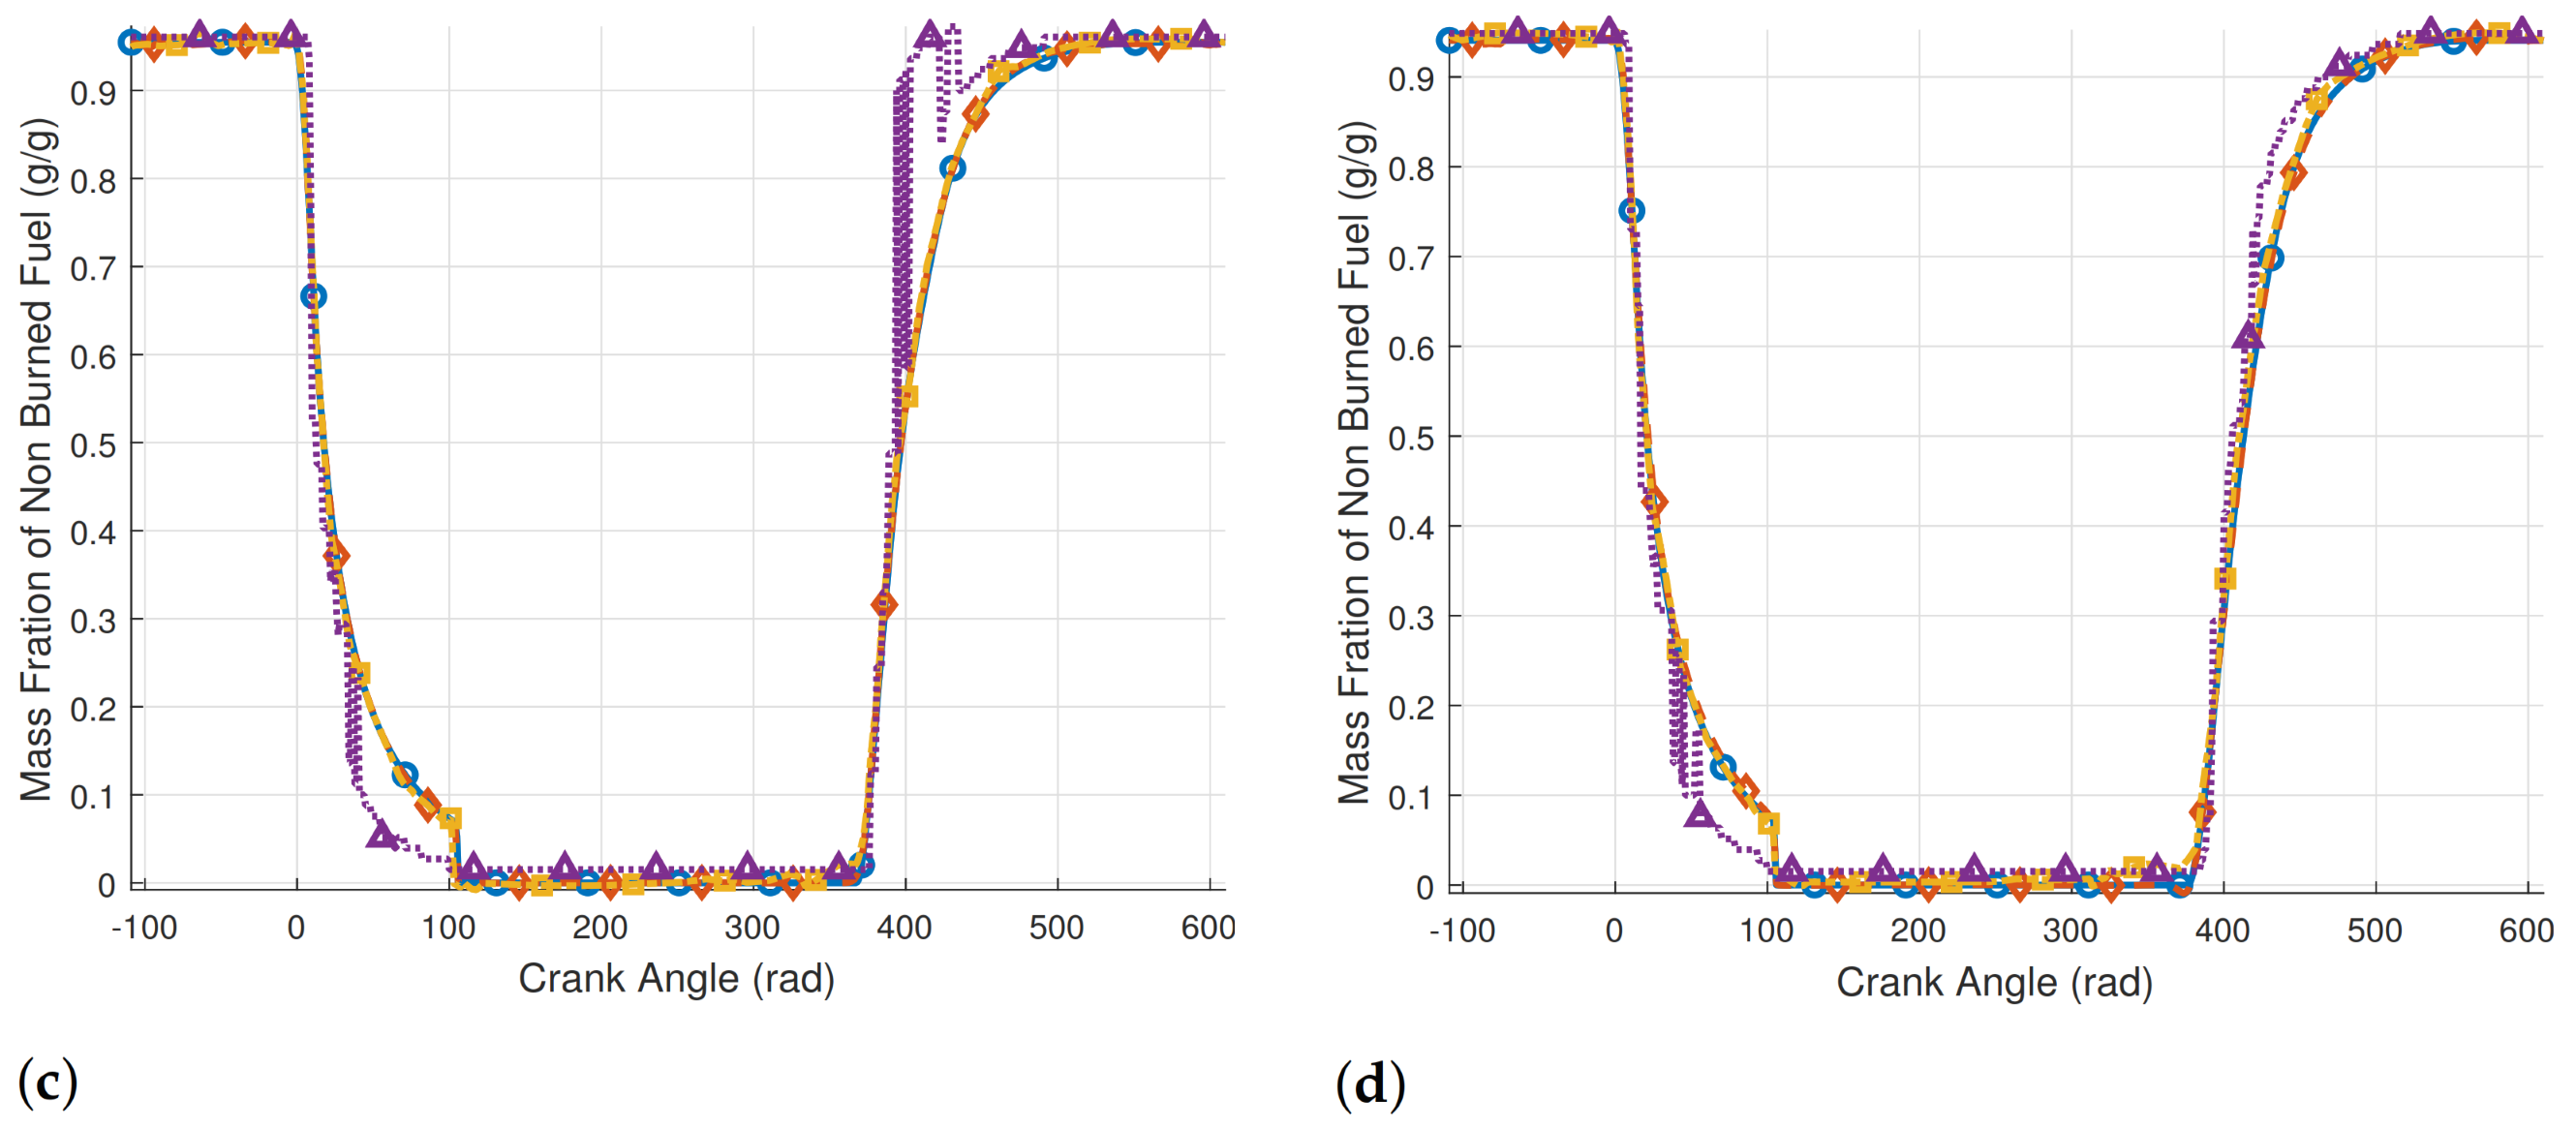
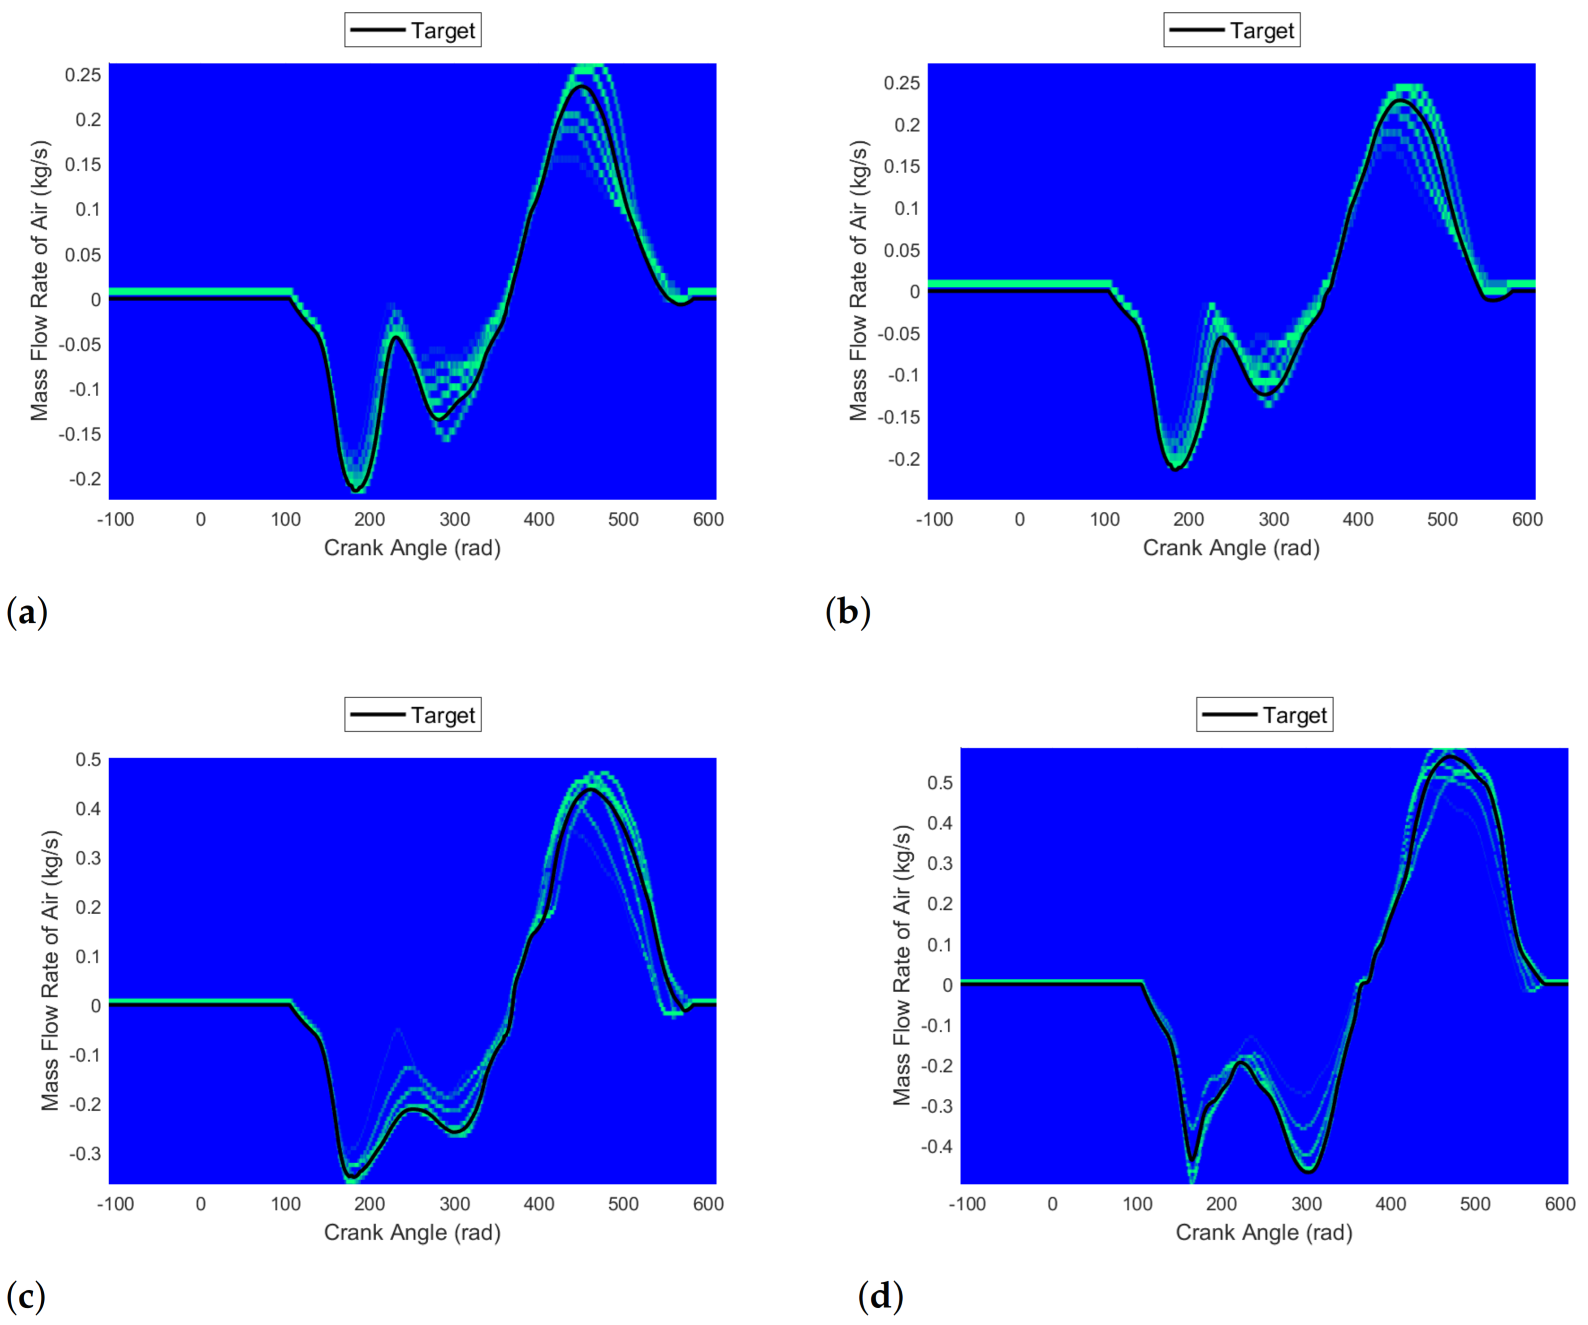
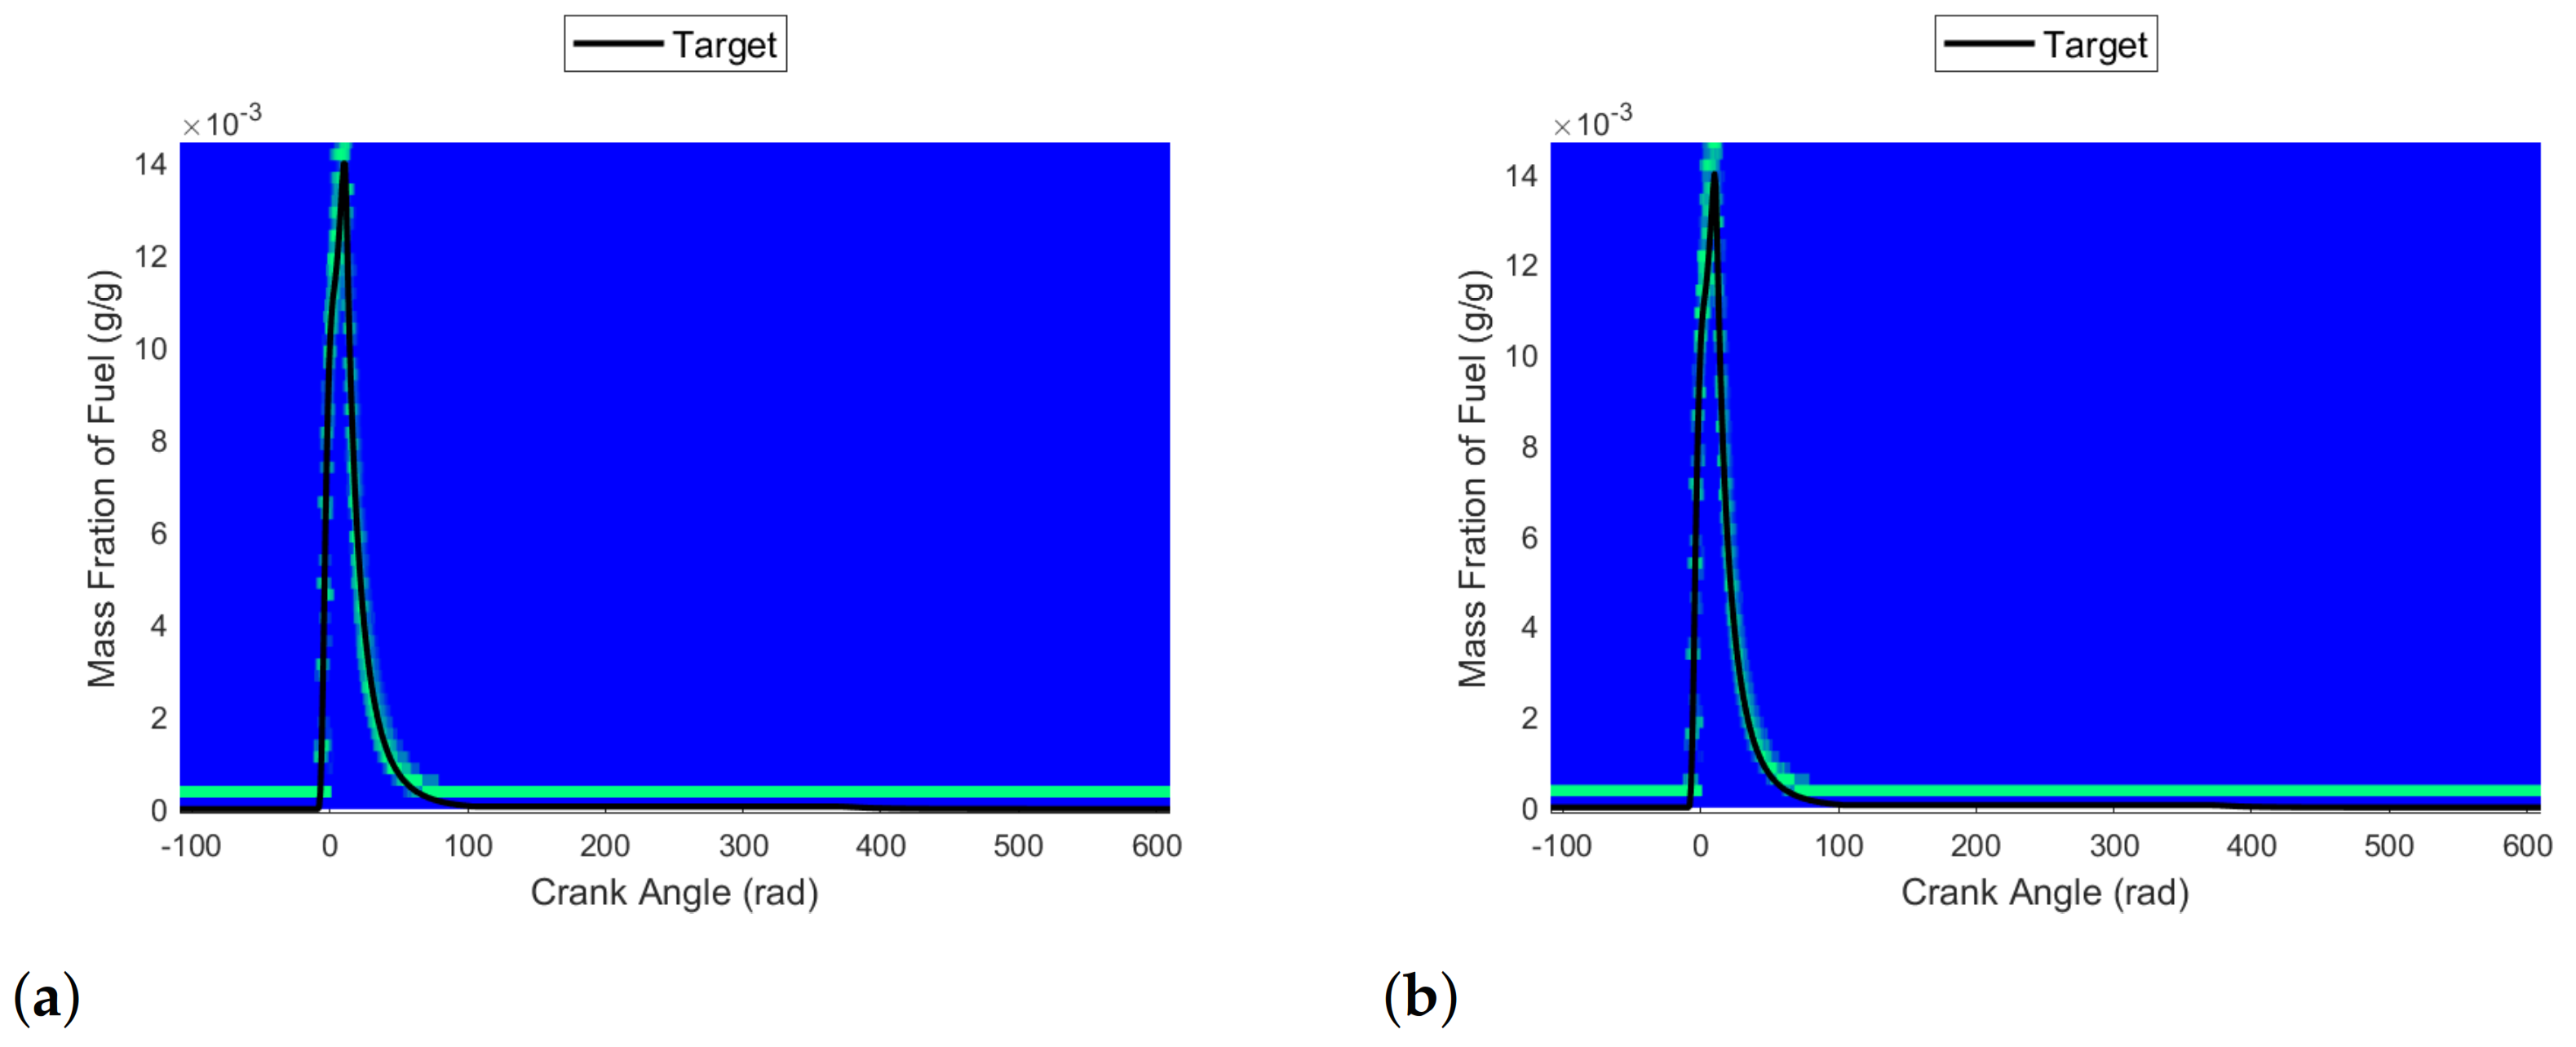
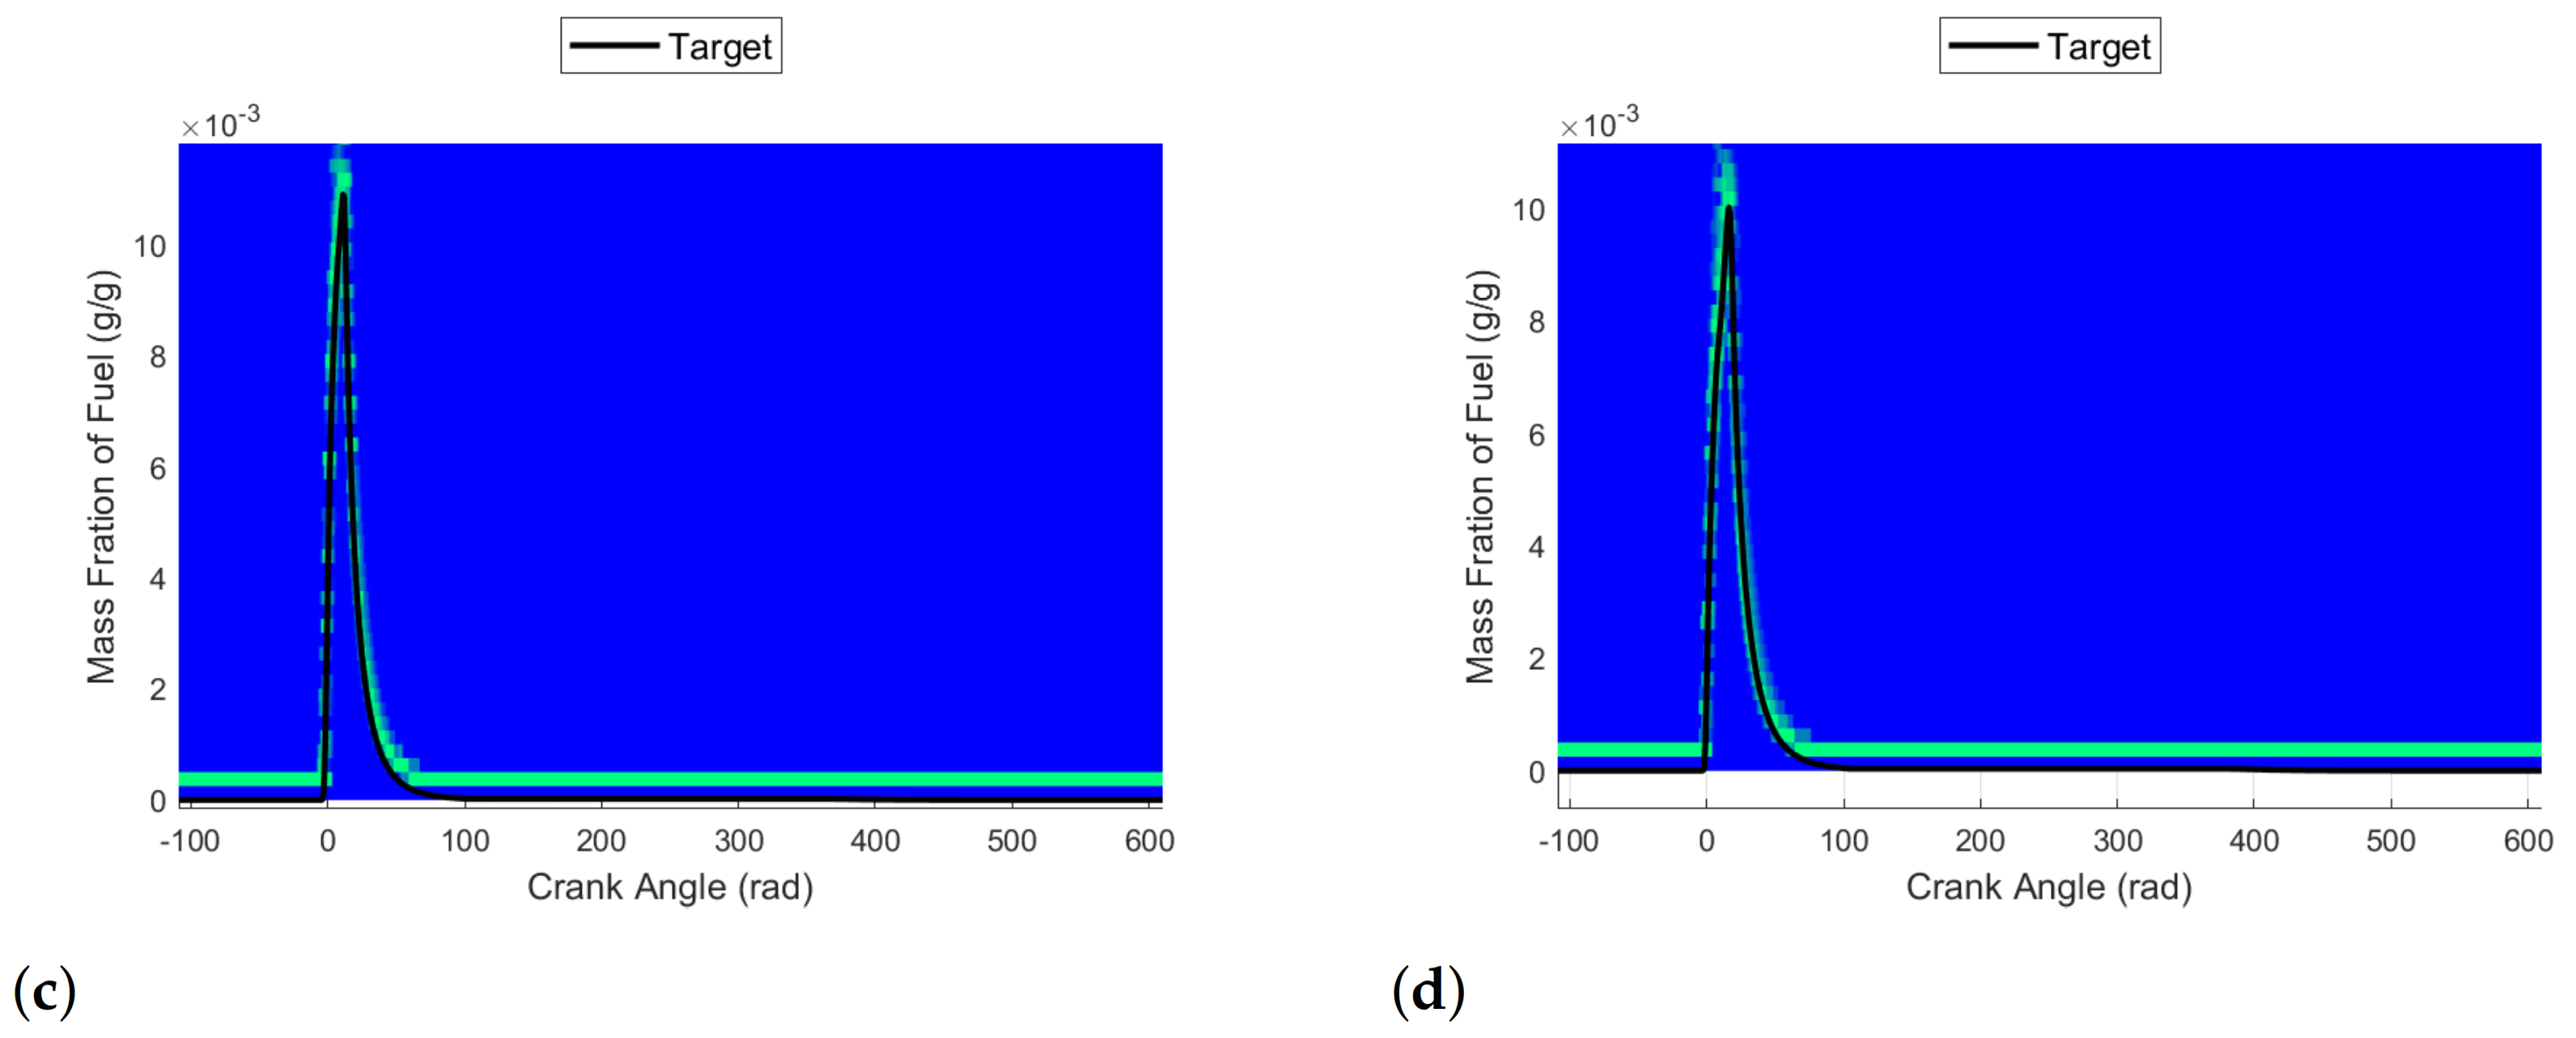
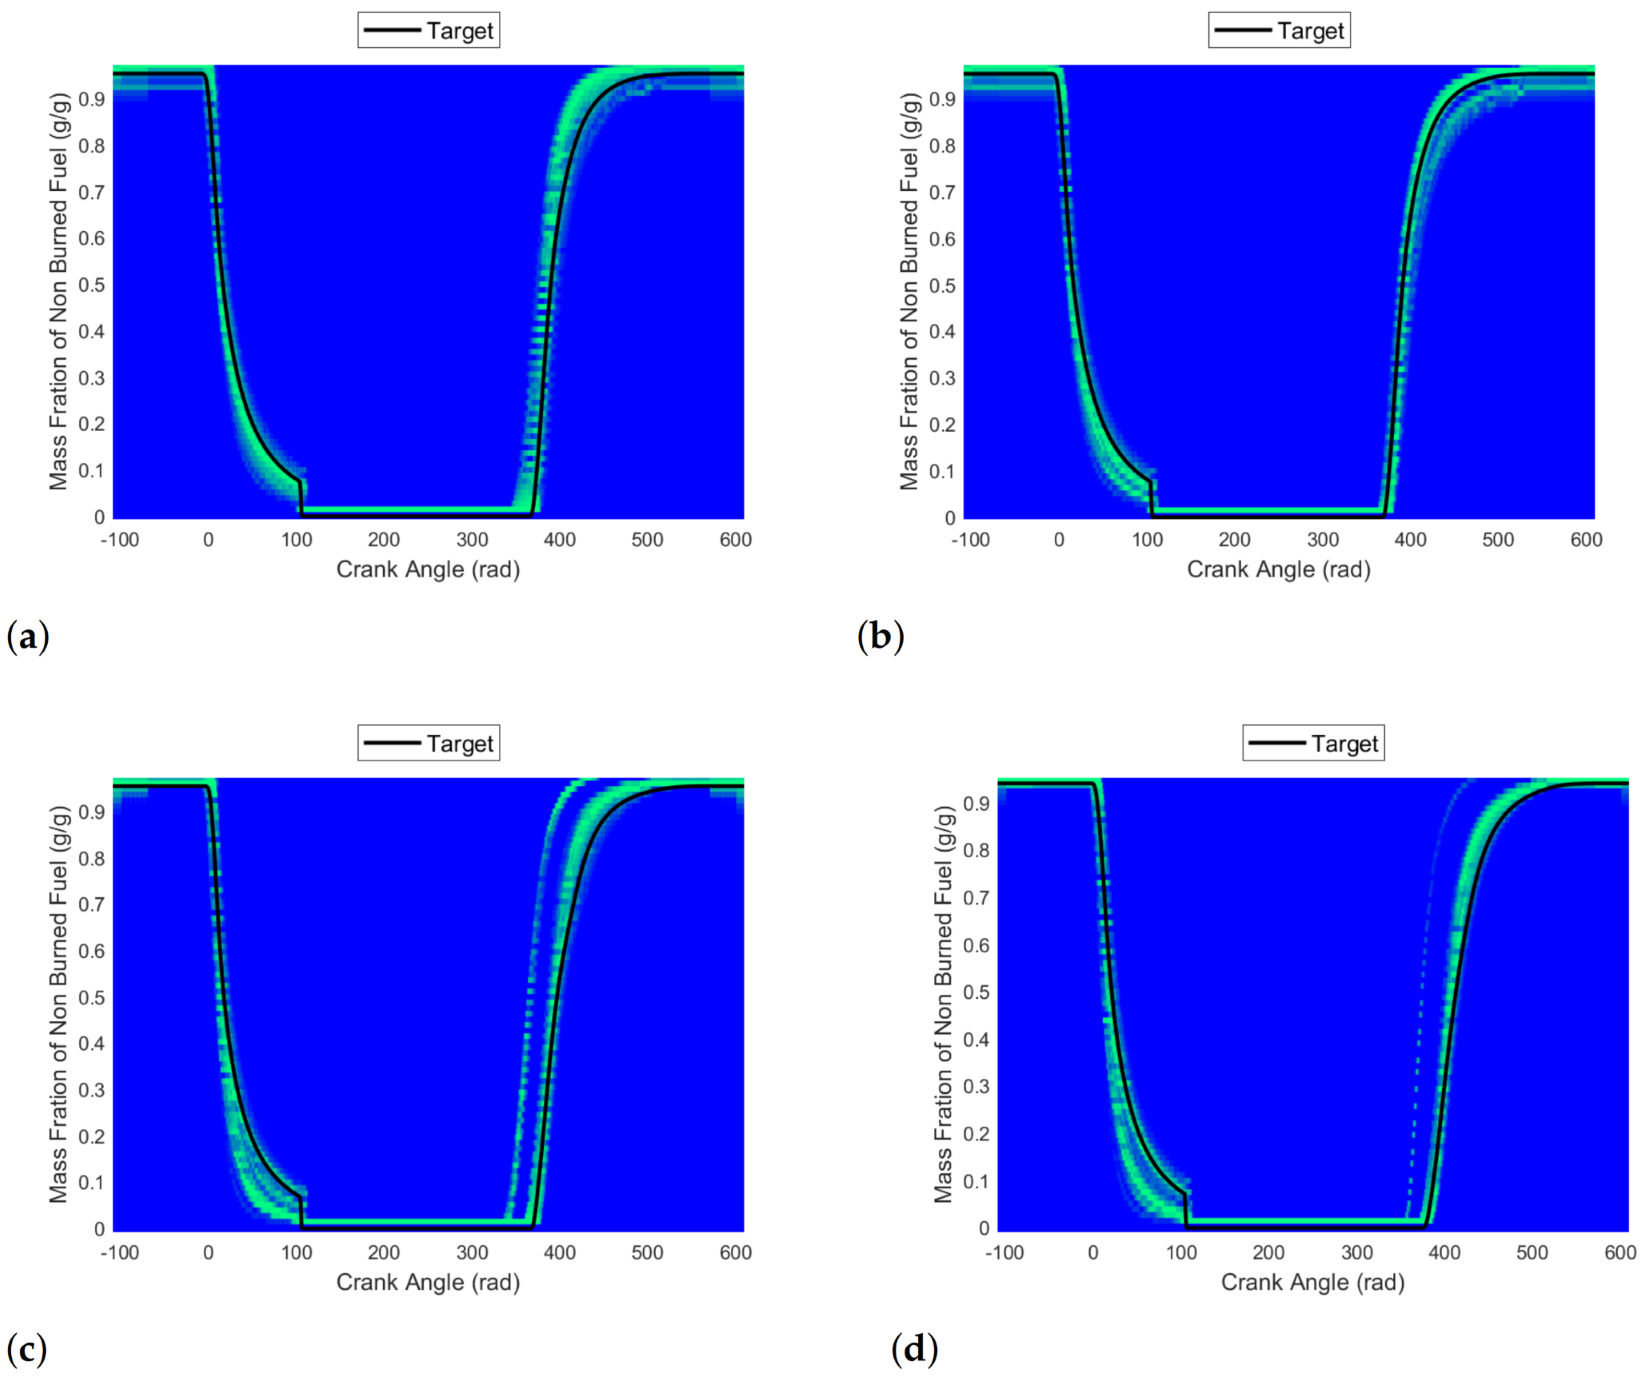
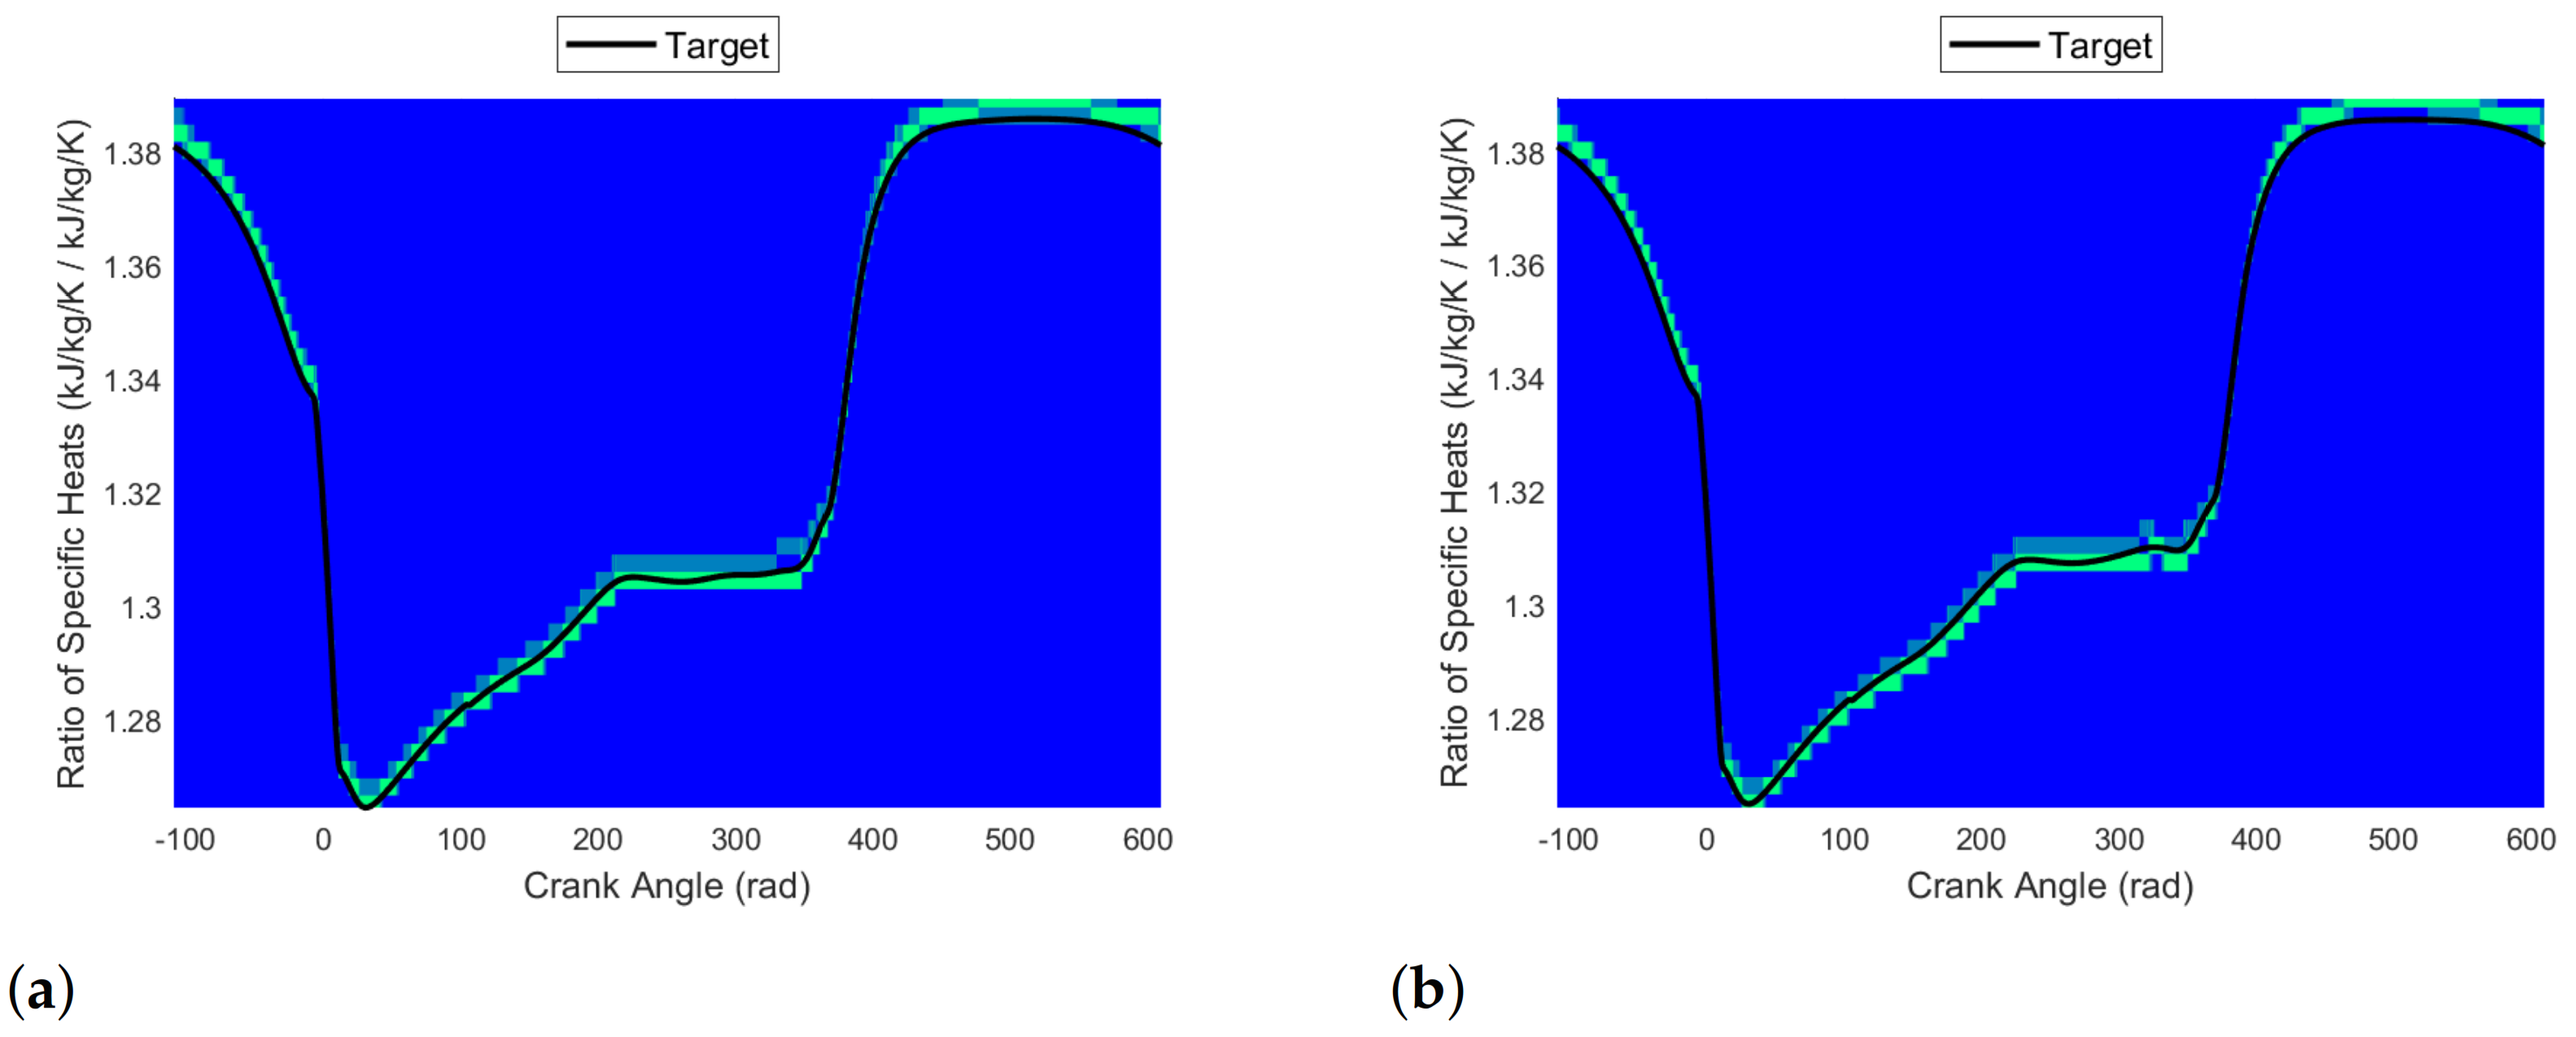
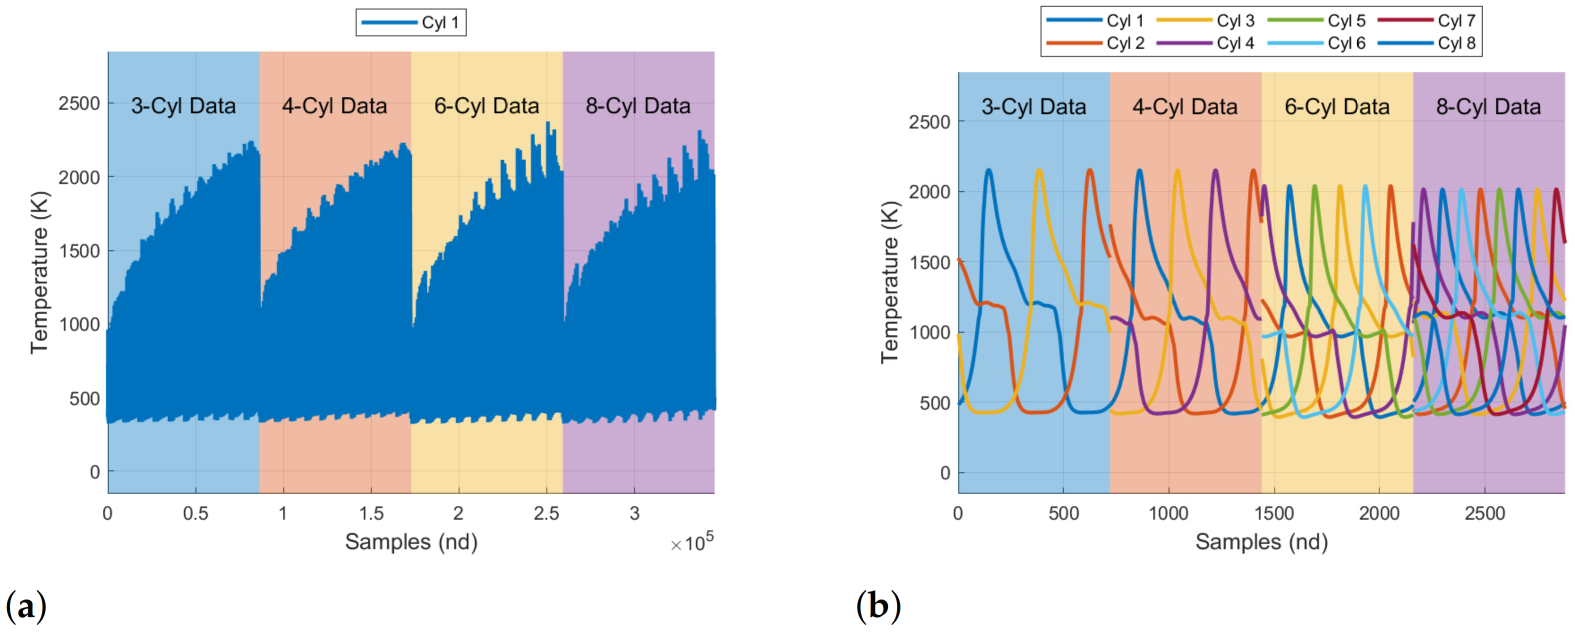
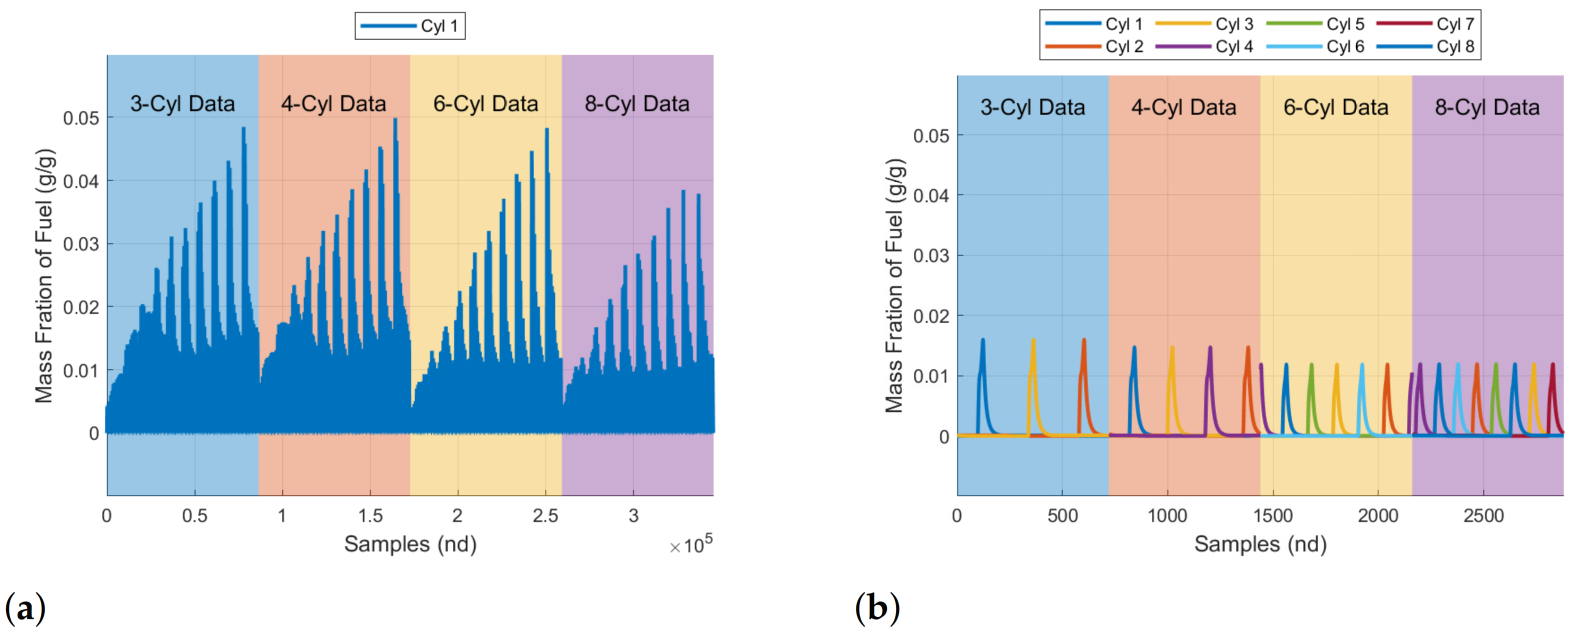
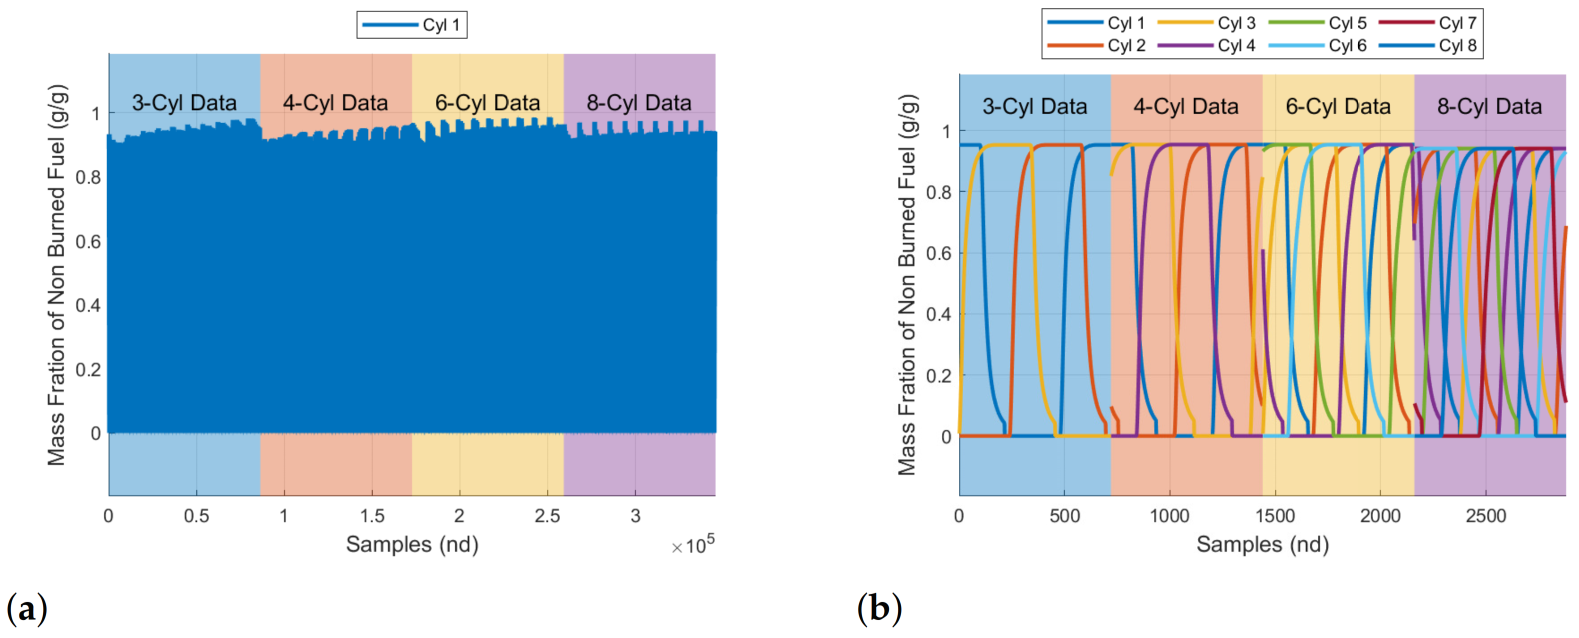
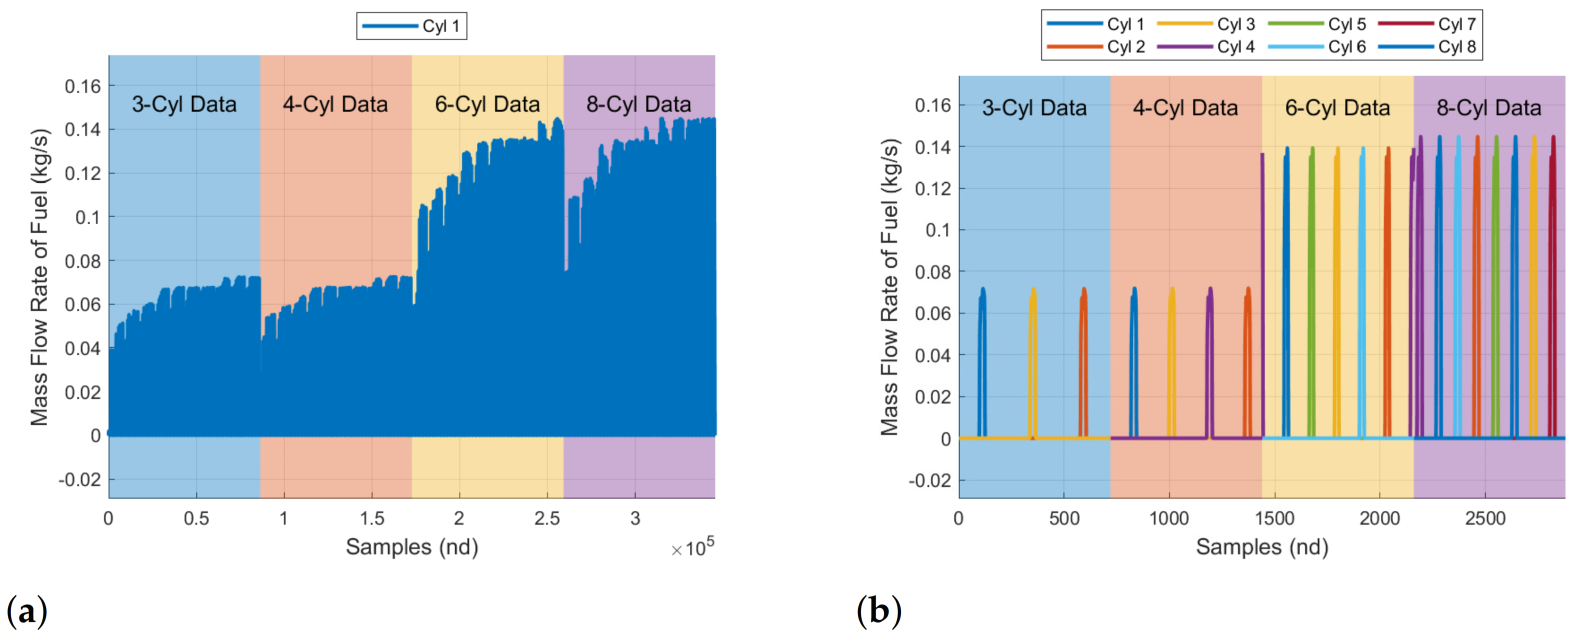
Motion of the engine’s cylinders is produced by combustion of the air and fuel. As such, our features selected for prediction include the in-cylinder (1) pressure, (2) temperature, (3) gamma which represents the ratio of the specific heat at constant volume to the ratio of specific heat at constant pressure, (4) mass fraction of fuel, (5) mass fraction of the unburned nonfuel, (6) the mass fraction of burned fuel, (7) the mass flow rate of fuel into the cylinders, and (8) the mass flow rate of air into the cylinders. Examples of each of the eight target features have been shown in Figure 2, Figure 3, Figure 4, Figure 5, Figure 6, Figure 7, Figure 8 and Figure 9. Because each of the engine variants have a different number of cylinders, we only used the first cylinder data as targets for training. All other cylinder data was reserved for future testing. Additional engine speeds and fuel indices that were not explicitly defined within the datasets were also used for further testing of the algorithms.

3.3. Feature Normalization

When developing a set of AI/ML algorithms it is common practice to normalize input and target features. In this way the hope is that the normalization process can lead to a more extensible set of algorithms which can be applied to a broader set of testing data. This is an active area of research, and as such, there are no right or wrong ways of normalizing. As an example, when modeling three phase AC motors/generators, it is common to use per unit normalizations; such normalization helps to reduce the dimensionality of the non-linear dynamic behaviors of the phase voltage, currents, and fluxes, reducing the model complexity. Normalization methods that reduce the dimensionality are expected to be more widely applicable for data which lies outside the training datasets. Prior to developing many of our predictive algorithms, we explored the use of two separate normalization methods including (1) the z-score [25] and (2) Buckingham π normalization [26].
Z-score normalization is the most common form of normalization in which the mean and standard deviation are used to transform data such that it is normalized. Buckingham π normalization is an alternative method which could be used to normalize a set of features, heavily utilized for preforming dimensional analysis within computational fluid dynamics simulations or experiments. Normalization methods such as Buckingham π that reduce dimensionality can be an incredibly powerful normalization routine for AI/ML based algorithms. This assumes that the input and target features can be representable by a set of base parameters. Prior to developing a large number of the predictive algorithms in this study, two sets of SANNs were developed to predict or estimate the in-cylinder conditions of the 6-cylinder engine. We used the first cylinder of the 3-cylinder, 4-cylinder and 8-cylinder engine data as the training features and tested the algorithms on a testing dataset which included the data from the 6-cylinder engine. The results had indicated that neither algorithms could predict the desired target feature correctly, however, the predictions generated by the Buckingham π were similar in magnitude to the target, conversely the z-score normalization led to predictions that were at least one or two orders of magnitude from the target.
In order to utilize the Buckingham π normalization methodology, a dimensionality analysis was first performed. In so doing, we were then able to select a set of base parameters which could be utilized as a recurrent set. The recurrent set reduces the dimensionality of the data and enables all the input or target features once normalized to be normalized in reference to parameters unique to each individual engine. The recurrent set of parameters used for normalizations included (1) the atmospheric temperature of 273.15 K, (2) the rated speed of the engine of 3600 rpm, (3) the bore length, and (4) the amount of power generated as a function of the total number of cylinders, computed to be the rated power of the engine divided by the total number of engine cylinders. All input and target features where then normalized with respect to the recurring set of parameters.

3.4. Algorithm Selection

There are many different types of algorithms that can be used for generating a set of artificial neural networks capable of predicting both linear and non-linear time series, including SANNs, NARX networks, LSTMNs, RNNs, ResNets, CNNs, Classifiers, and Multi-Layer Perceptron to name a few. Such algorithms are capable of being used in real-time or near-real time operation for generating predictions.
SANNs are the most simplistic form of a neural network. Input features are passed to one or more hidden layers populated with multiple neurons. A neuron is a mathematical construct that is meant to emulate a biological neuron. Every input feature is multiplied by a weighting matrix and summed with a bias forming a linear relationship. The final resultant of this summation is then passed through an activation function, the activation function is a nonlinear function that transforms the linear relationship to a non-linear relationship. The output of each hidden layer is then fed forward to each subsequent neural network hidden layer. The final hidden layer is succeeded by a final activation layer which is typically a simple linear regression layer. These types of networks are well suited for supervised learning, where the data that is learned may be sequential nor time dependent. However, depending on the input features, the network can be made to learn time dependencies. These types of neural networks are well suited to learn both linear and non-linear behaviors. The primary deficiency is that the network has no memory and thus is considered to be unintelligent. It can provide accurate predictions, but if it does not, it is hard to troubleshoot the lack of accuracy. These networks have limited understanding between how the inputs directly lead to the desired predictions and are prone to overfitting.
NARX networks are an alternative form of feed forward neural network. There are two main differences between NARX networks and SANNs. First, NARX networks possess two different types of inputs: (1) the same input as a SANN and (2) the predicted target feature, i.e., feedback. The other major difference is both inputs are passed through a memory function. The memory function makes these neural networks slightly more computationally complex than SANNs. The neural networks are well suited for learning sequential and time dependent data series resulting from the presence of the memory and feedback. This type of function is capable of learning both linear and non-linear trends and has the same deficiencies as the SANNs, but the only major difference is it is naturally well suited for time series predictions.
LSTMNs are a form of a recurrent neural network (RNN). For this type of neural network, the inputs are typically passed to a sequential layer, permitting sequences to be passed directly to the neural network layers. The output of the sequence layer is then passed to multiple LSTMN layers which have forget, update, and output states. These states allow the neural network to learn long-term dependencies between time steps. The output of LSTMN layers may then be passed to additional LSTMN layers. LSTMNs can also include drop out layers in which portions of the output are dropped based on a learning rate. This enables different layers to learn different time dependencies of the target features. The final hidden neural network layer can then be a fully connected layer and linear regression layer. Alternatively, the final neural network layer can be concluded by a Softmax layer followed by a classification layer. This makes the neural network well suited for learning non-linear time series and sequential relationships for time series prediction or for image classification. The primary deficiency of this type of neural network is it suffers from vanishing gradients resulting in significant prediction degradation. LSTMNs can be coupled with drop out layers to help remove the vanishing gradient, but the network may still suffer performance degradation.
Recurrent neural networks (RNNs) possess many of the same functionalities that LSTMNs provide. An RNN simply means the output is fed as a secondary input back into the neural network. The network has memory states, which makes it equally well suited for sequential time series predictions and sequential classification. The primary deficiencies for this type of neural network is that it cannot account for future inputs to make decisions and it also suffers from both vanishing and exploding gradients. Data can grow exponentially during training, which means these neural networks can have severe convergence related issues.
Residual neural networks (ResNets) are very similar to SANNs, in that they are primarily made up of feedforward neural network paths. The primary difference between ResNets and ordinary SANNs is ResNets possess double or triple layer skip connections. Skip connections can bypass individual neural network layers. The residual layers can be made to accept arrays as inputs. These neural networks may also possess layers that reshape or reorient the data. These types of neural networks are often used for classification type problems. If they have multiple parallel skips, the networks may be classified as a DenseNet. These neural networks avoid issues with vanishing gradients which can plague other types of neural networks like LSTMSNs. ResNets are commonly used for image classification. Similar to RNNs, the networks suffer from exploding or vanishing gradients. They are not well suited for long sequence predictions and have slow and complex training processes.
Convolutional neural networks (CNN) are very well suited for image classification. They can have one dimensional or multi-dimensional convolution layers. A convolution layer contains a filter or kernel. In this layer a filter or kernel slides across an array and elementwise multiplication between the inputs is computed and summed into a single pixel. This operation is repeated across the full width and height of the convolutional layer. The output of this layer can then be passed to other convolution layers, pooling layers or globally averaging layers. This type of neural network is commonly used for image analysis and classification and can be made to complete non-linear or linear time series predictions. Primary deficiencies include significantly slower operation resulting from pooling. The training process usually takes significant time and requires large datasets to converge significantly and yield sufficiently accurate predictive capabilities.
There are many different types of neural networks and each type of neural network was created to replace more simplistic neural network variants and overcome various neural network deficiencies. Because the authors have had success with the LSTMNs and SANNs in the past [27], the decision was made to continue to develop and deploy such algorithms here. We also choose to develop deep artificial neural networks in the form of CNNs and Kth nearest neighbor classifiers. Both feedforward SANNs and LSTMNs are considered to be “unintelligent”, in that once they have been trained, they will always provide a set of predictions. Whether the predictions that are generated by the algorithms are reasonable becomes exceedingly difficult to understand. This is especially true when the algorithm is deployed on alternative data sets which may exist outside of the training dataset. Alternative forms of neural networks and classifiers such as the K-th Nearest Neighbor (KNNs) classifier generate a prediction based on some statistical measure of the provided set of input features, based on its training data. For this reason, we also chose to develop several KNN classifiers. Information pertaining to the selected architecture for each of the eight neural networks generated for the KNNs, CNNs, and ANNs are provided in Appendix C of this report.

3.5. Algorithm Experimentation

Once the AI/ML algorithms were trained, they were saved to separate data files. The ANNs and KNNs were saved to MATLAB specific data files, while the CNNs were saved to Python hierarchical data files. Each file contains the final set of weights and biases obtained through the learning or training of the AI/ML, which is required to invoke the neural network. Most if not all of the software packages that implement AI/ML also save the completed AI/ML algorithm as a specialized data structure. The data structure will usually contain the weights and biases in addition to custom modules or functions that enable the AI/ML to be invoked, analyzed, visualized, or modified. For this particular research effort, we preformed two separate experiments with the trained AI/ML including the Single-Point Operational Conditions experiment and the Multi-Point Operational Conditions experiment. All AI/ML algorithms were trained to predict the in-cylinder engine states with respect to crank angle degrees, steady state engine speed, and throttle or fuel index. The data ranges for each of the three variables are shown in Equations (1)–(3).
In the case of the Single-Point Operational Conditions experiment, we picked a set of engine operating conditions which were implicitly but not explicitly defined within the training dataset. This is very important as AI/ML developed for one dataset may have significantly degraded performance when applied to an alternative dataset if the alternative dataset is vastly different than the training dataset. With the set of operating points specified, we constructed a multi-dimensional array. The array must be of consistent size to the individual neural network architecture as shown in Appendix C. Further, the multi-dimensional array must be structured in the same way in which the the neural network was trained. It is common practice to develop scripts for training and testing the AI/ML to ensure input features are consistently and dependably formed. Once the multi-dimensional array was formed and normalized as described previously, the prediction function or module of the AI/ML may be invoked, resulting in the desired AI/ML prediction. Both the ANN and the KNN were invoked using this methodology. For the most part, the CNN is also invoked using a similar methodology. The only major difference is the input feature matrix had to be exported to a compatible data file format which could be imported into Python; MATLAB specific data files are not supported outside of MATLAB.
In the case of the Multi-Point Operational Conditions experiment, we used the same approach outlined for the aforementioned Single-Point Operational Conditions experiment. The only difference was we had to specify multiple sets of engine conditions that sufficiently spanned the throttle/fuel index and steady state engine speed. The selected operating conditions were both implicitly and explicitly defined within the training dataset. This required multiple multi-dimensional input array matrices be constructed. Again, the multi-dimensional array could then be passed to the AI/ML and subsequently invoked to produce the neural network predictive response. The results of this experiment as will be seen subsequently will be visually observable using contour plots. The contour plots will visually demonstrate the response of the neural network subject to engine speed and torque. Two separate types of contour plots were generated including the single degree of freedom (1DOF) and the two degree of freedom (2DOF) neural network responses. The 1DOF contour plot results were generated using each of the neural network configurations and then plotted with respect to the engine speed and torque as defined within the original GT-Power engine datasets. Similarly, the 2DOF contour plot results were also generated using each of the neural network configurations and then plotted with respect to the engine speed as defined within the original GT-Power engine datasets. Dissimilarly, the engine torque was computed using an Equation (Appendix B) and the resulting in-cylinder pressure responses.

4. Results

For this work, we focused on developing a set of artificial neural networks capable of approximating the non-linear in-cylinder conditions of a CI engine. As discussed above, there were eight separate target features of interest, and three dissimilar AI/ML based artificial neural networks architectures developed. Each engine-data set then contained multiple sets of three-dimensional matrices as described previously. This section is subdivided into two additional sections; the first section labeled as Single-Point Operational Conditions will show a subset of the results which highlight each individual artificial neural networks architecture’s ability to predict in-cylinder temperature, pressure, mass flow rate of air, and mass flow rate of fuel traces for each of the four engines assuming the engine was to operate at 75 % fuel index at 3600 rpm. The second section labeled as Multi-Point Operational Conditions will present a subset of the results which highlight each individual artificial neural network architecture’s ability to predict in-cylinder temperature, pressure, mass flow rate of air, and mass flow rate of fuel at a specific crank angle degree of 24 , which will vary as a function of the engine speed and torque (various fuel indices and engine speed operational points). In both sections, we will utilize look-up tables to interpolate between engine operating conditions not expressly measured assumed to the theoretical targets which the artificial neural networks should predict.

4.1. Single-Point Operational Conditions

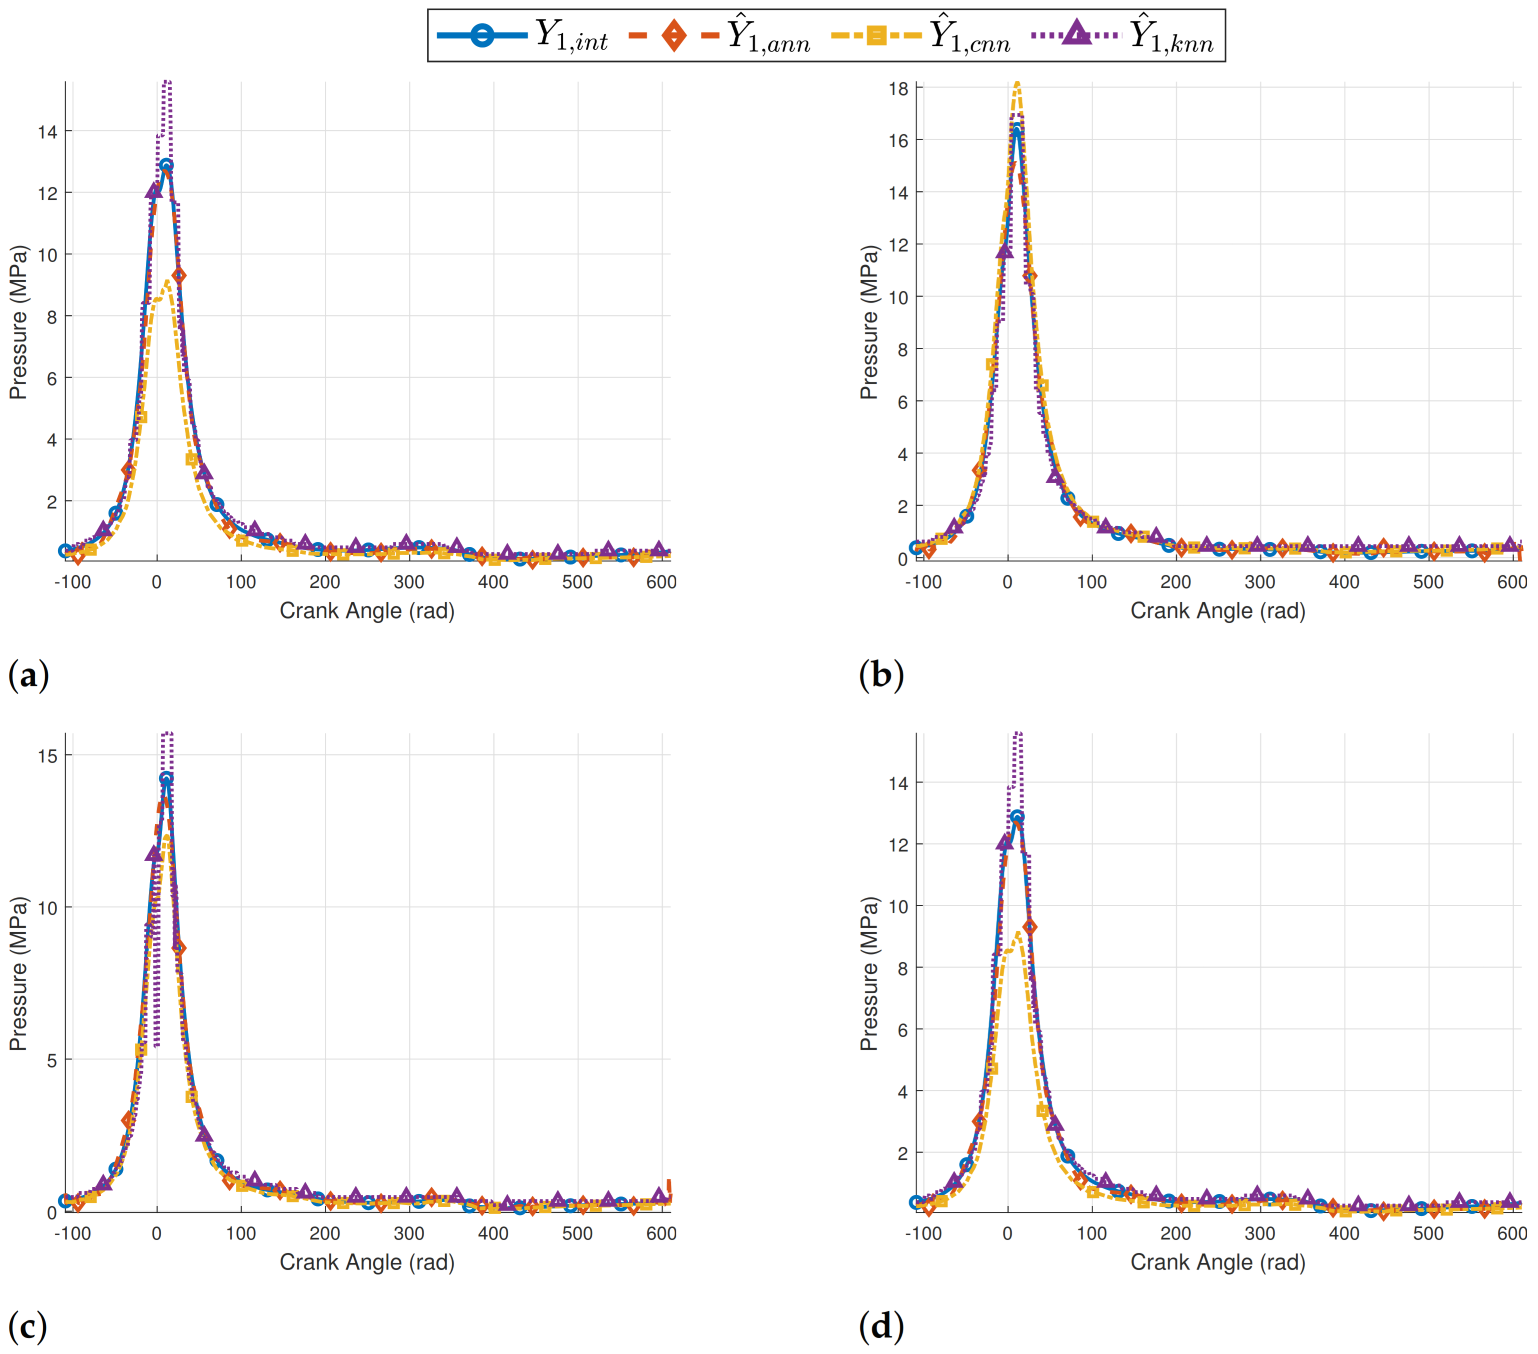
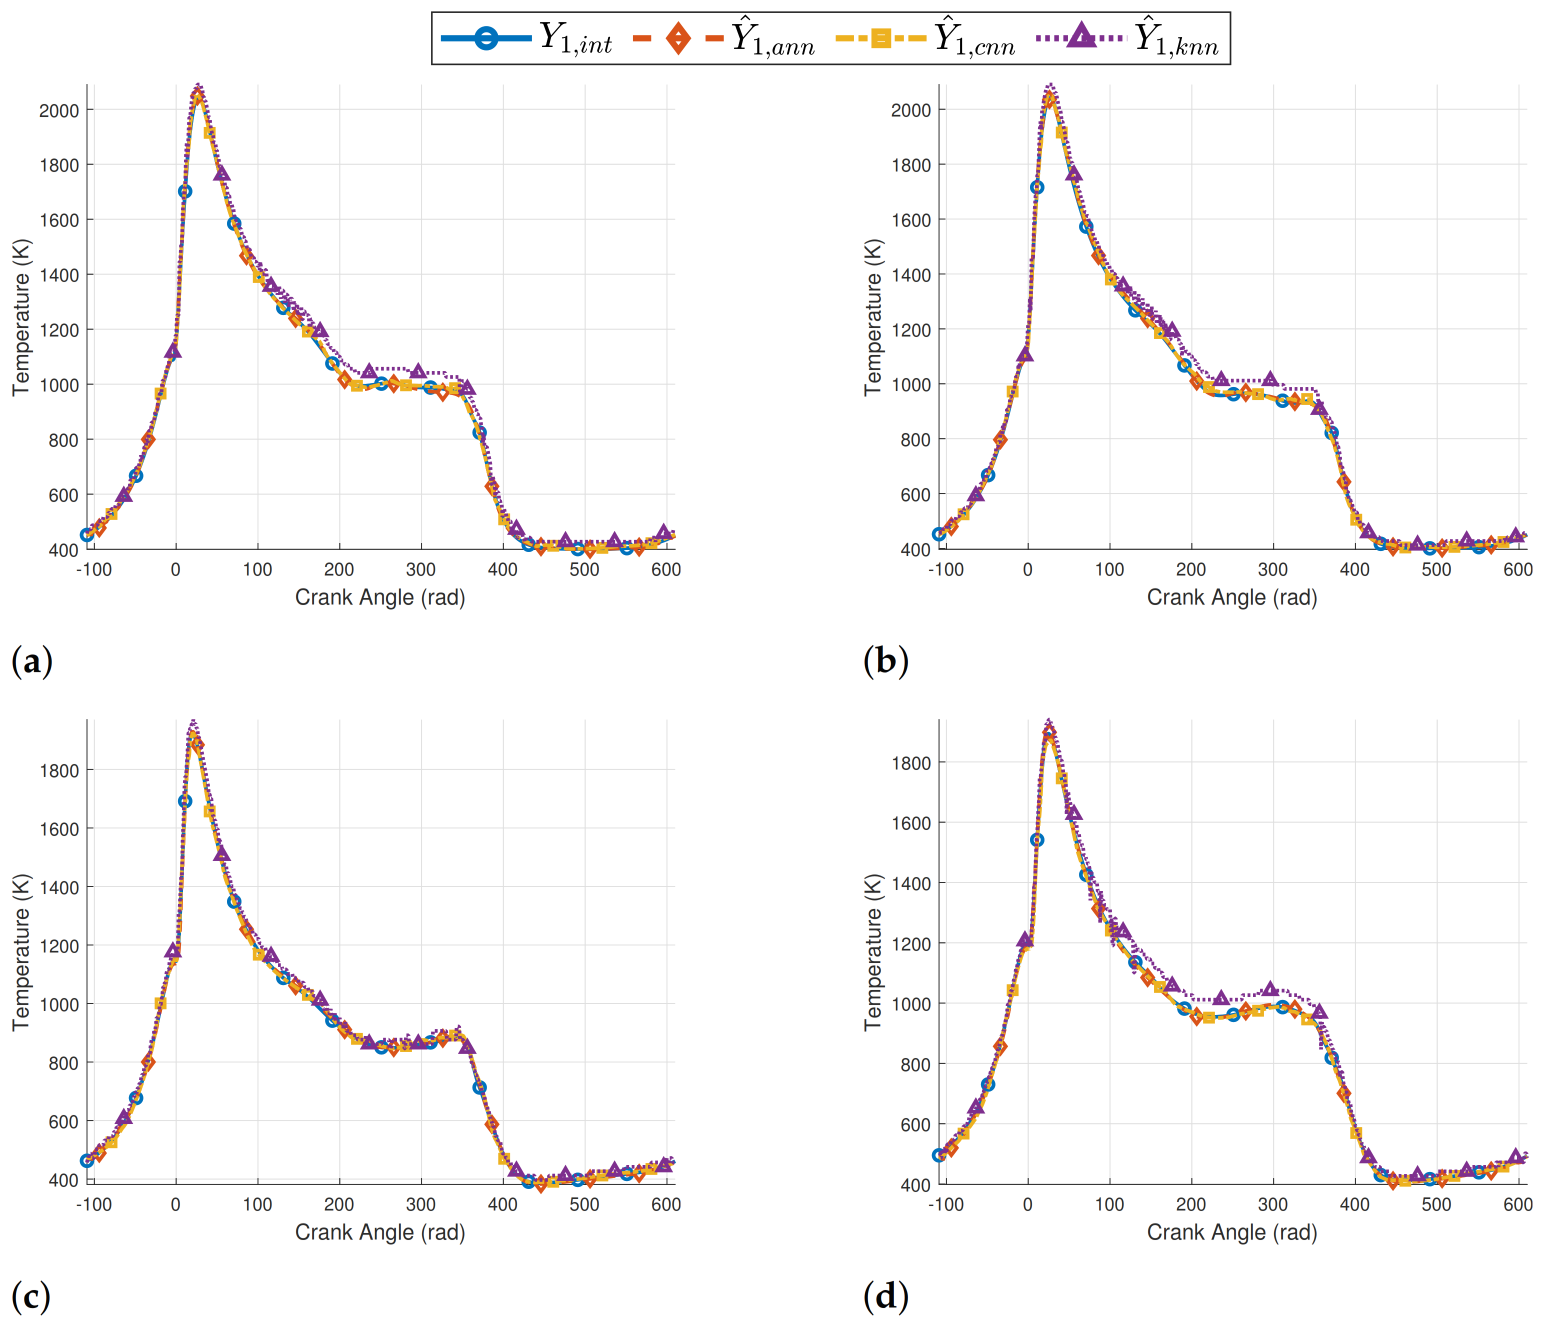
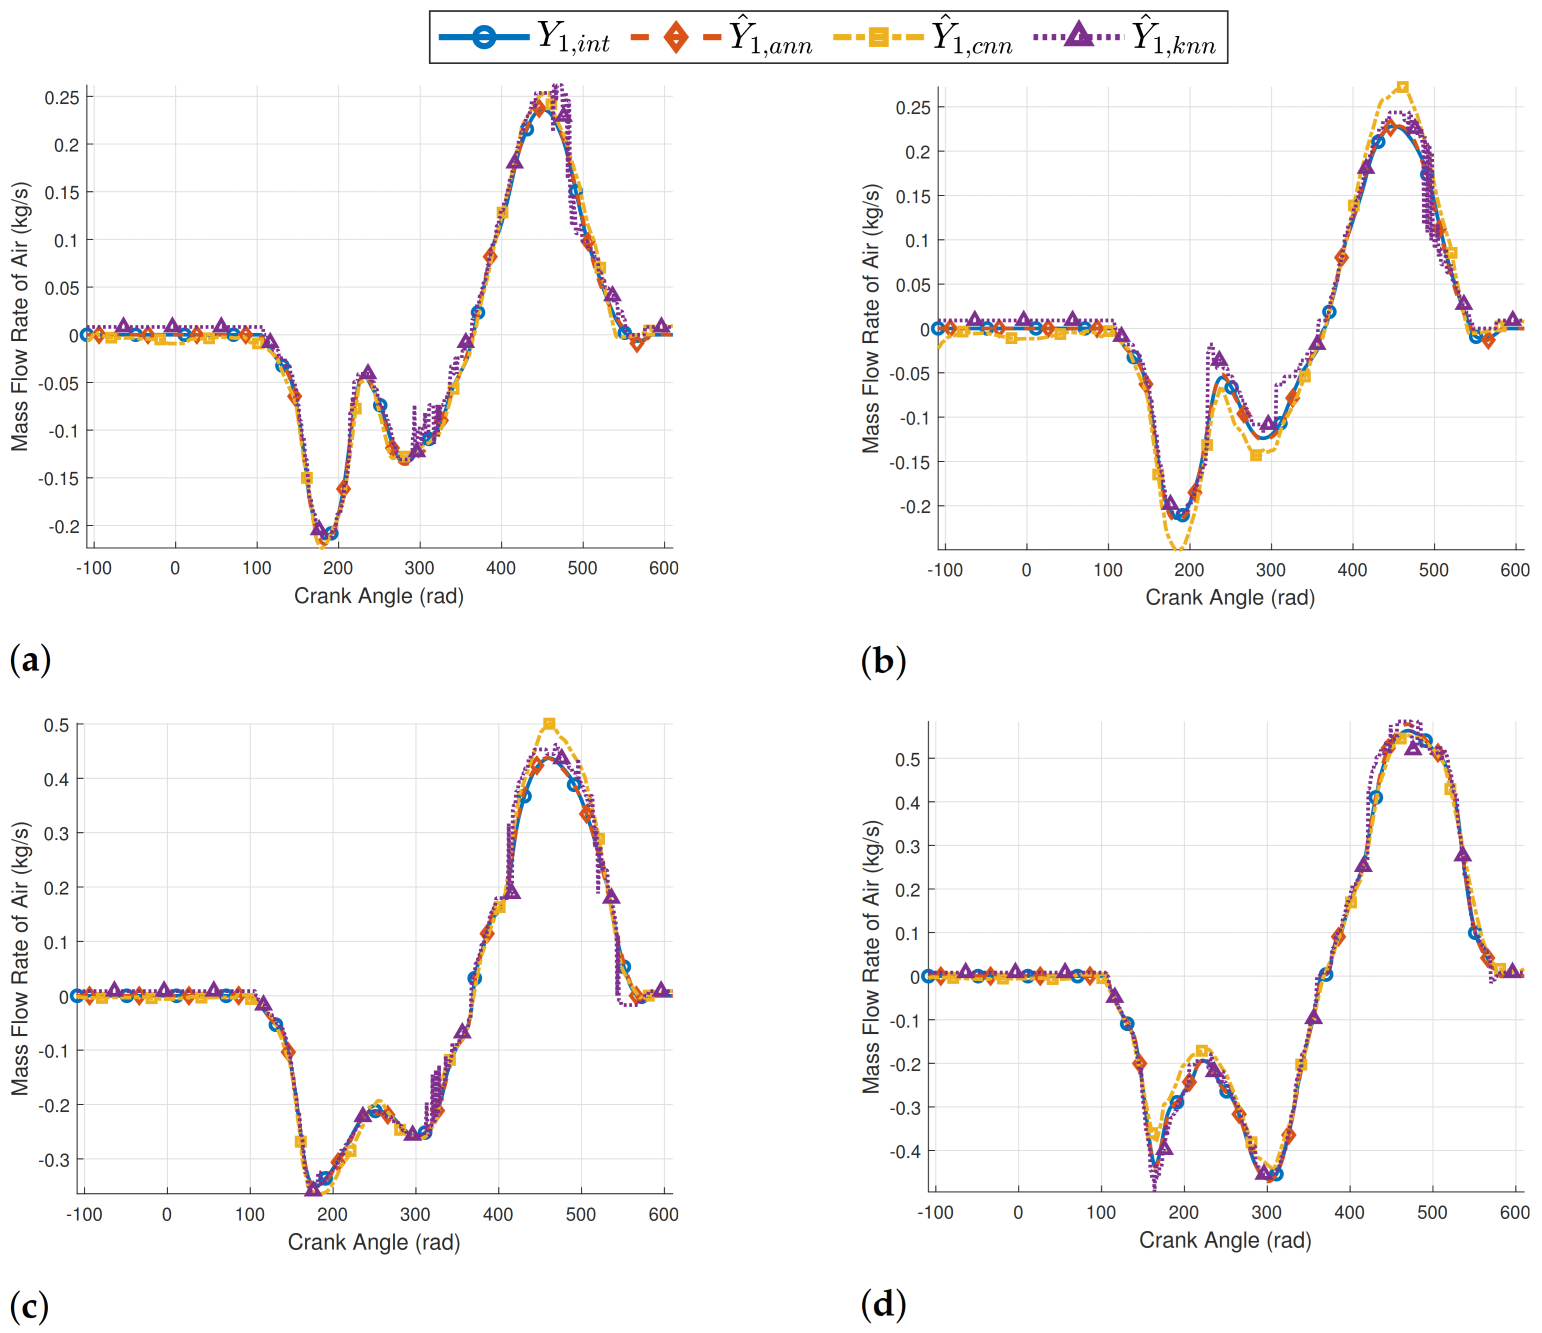
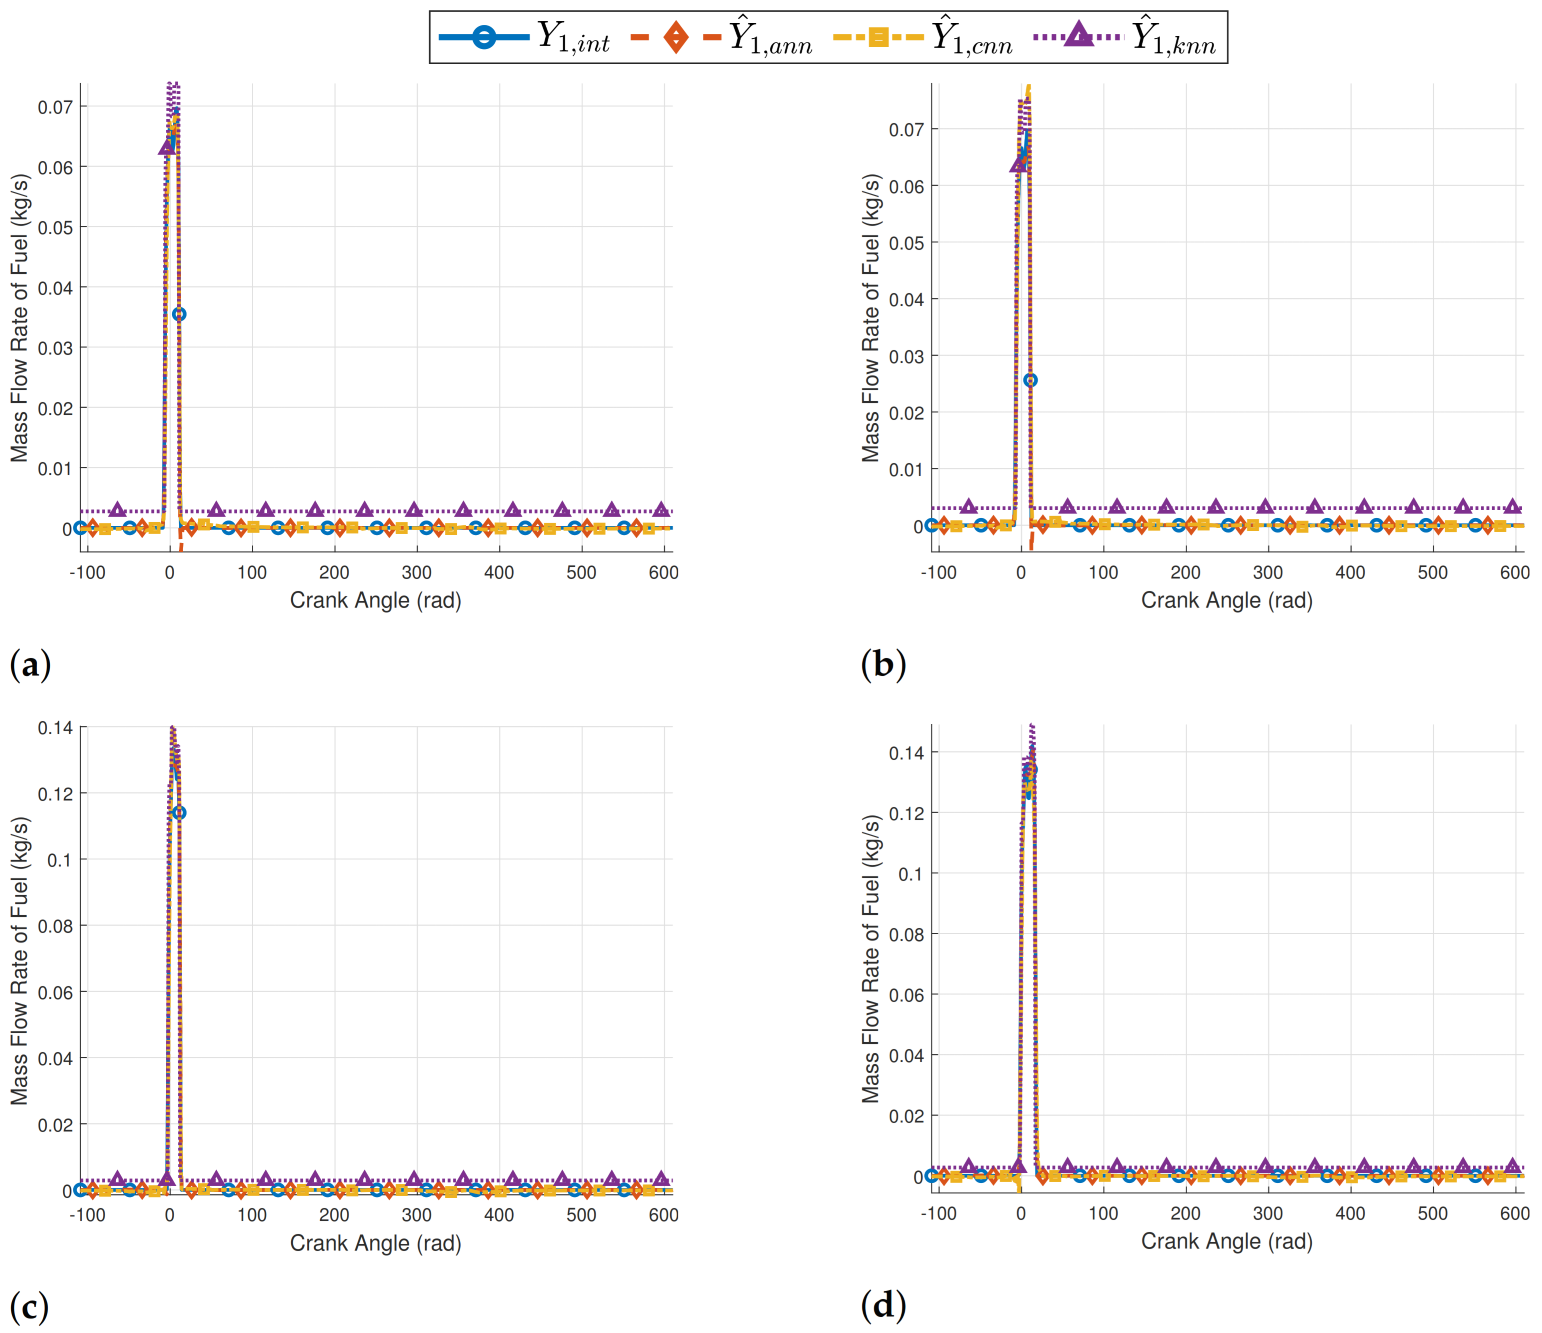
The four dominate sets of conditions that impact the performance of the engine include in-cylinder pressure (Figure 10), temperature (Figure 11), mass flow rate of air (Figure 12), and mass flow rate of fuel (Figure 13). The subsequent figures will contain four separate trajectories including the linearly interpolated operating conditions of the engine Y 1 , i n t , the SANN/ANN prediction Y ^ 1 , a n n , the CNN prediction Y ^ 1 , c n n , and the most probable KNN prediction Y ^ 1 , k n n . The trajectories as shown within this section were generated assuming that the engine was expected to operate at 75 % fuel index at 3600 rpm. The data as contained within the three-dimensional matrices did not explicitly include these operating points, which is why this operating point was used for preliminary testing. Appendix D contains all additional figures that illustrate the neural network’s ability to predict the four remaining in-cylinder target conditions as defined by the sensor measurements tables shown in Appendix A.
Figure 10, Figure 11, Figure 12 and Figure 13 contains four separate visualizations which compare the response of the ANN, CNN, and KNN to the linearly interpolated engine response for each of the four engine configurations. The top most visualizations include the 3- and 4-cylinder engine responses, while the bottom most visualizations contain the 6- and 8-cylinder engine responses. Each visualization then contains four separate trajectories: (1) a solid blue line with circular markers represents the linearly interpolated engine response, (2) a dashed red line with diamond markers represents the ANN prediction response, (3) a dashed yellow line with square markers represents the CNN prediction response, and (4) a dashed purple line with triangular markers represents the KNN prediction response.
Figure 10 demonstrates the predictive capability of the ANN, CNN, and KNN to predict the in-cylinder pressure at 75 % fuel index at 3600 rpm for one complete cycle of the engine. Visually it can be observed that the ANN yields the most accurate prediction, followed by the KNN and CNN. This can be mathematically observed from analysis of Table 1, Table 2, Table 3 and Table 4. The CNN performs the best for the 4- and 6-cylinder engine and noticeably undershoots for the 3- and 8-cylinder engine. The area in which the AI/ML is prone to having the most problem providing accurate predictions occurs in the neighborhood of peak pressure. Peak pressure is determined by fuel injection timing and duration and the resulting load, thus it makes since that the neural networks are expected to have difficulty around peak pressure. Recall, the integral of pressure with respect volume is work, so being able to accurately predict in-cylinder pressure directly impacts our ability to analyze energy and exergy of the engine throughout the various engine strokes.
Figure 11 demonstrates the predictive capability of the ANN, CNN, and KNN to predict the in-cylinder temperature at 75 % fuel index at 3600 rpm for one complete cycle of the engine. Visually it can be observed that the ANN yields the most accurate prediction, followed by the CNN and the KNN. This can be mathematically observed from analysis of Table 1, Table 2, Table 3 and Table 4. The KNN has the worst performance of all three neural networks. It performs well for the 6-cylinder engine and has a noticeable offset for the 3-, 4-, and 8-cylinder engine. Dissimilarly to the pressure responses, an offset becomes apparent after peak temperature was observed. Both the ANN and CNN produce indistinguishable responses. In-cylinder temperature directly relates to the exergetic efficiency of the engine as it transmits heat to the engine block, which then must be managed by the engine coolant loops.
Figure 12 demonstrates the predictive capability of the ANN, CNN, and KNN to predict the in-cylinder mass flow rate of air at 75 % fuel index at 3600 rpm for one complete cycle of the engine. Visually it can be observed that the ANN yields the most accurate prediction, followed by the CNN and the KNN. This can be mathematically observed from analysis of Table 1, Table 2, Table 3 and Table 4. The CNN appears to perform the best for the 3-cylinder engine, and in various locations within the 4-, 6-, and the 8-cylinder the CNN over or undershoots the target. The KNN seems to provide a consistent prediction, but there are some notable areas where the prediction response deviates from the target. The reason this occurs is because the KNN was unable to distinguish the target feature from the input features for the dissimilar engine parameters and conditions observed.
Figure 13 demonstrates the predictive capability of the ANN, CNN, and KNN to predict the in-cylinder mass flow rate of fuel at 75 % fuel index at 3600 rpm for one complete cycle of the engine. Visually it can be observed that the ANN yields the most accurate prediction, followed by the CNN and the KNN. This can be mathematically observed from analysis of Table 1, Table 2, Table 3 and Table 4. Both the CNN and KNN seem to have some issue around the peak mass flow rate of fuel for the 3- and 4-cylinder engine. The only other major difference observed is for the KNN. The KNN does not seem to be able to sufficiently classify that mass flow rate of fuel near zero. Aside from this fact, all neural networks provide a sufficient prediction to characterize the mass flow rate of fuel for the selected condition.
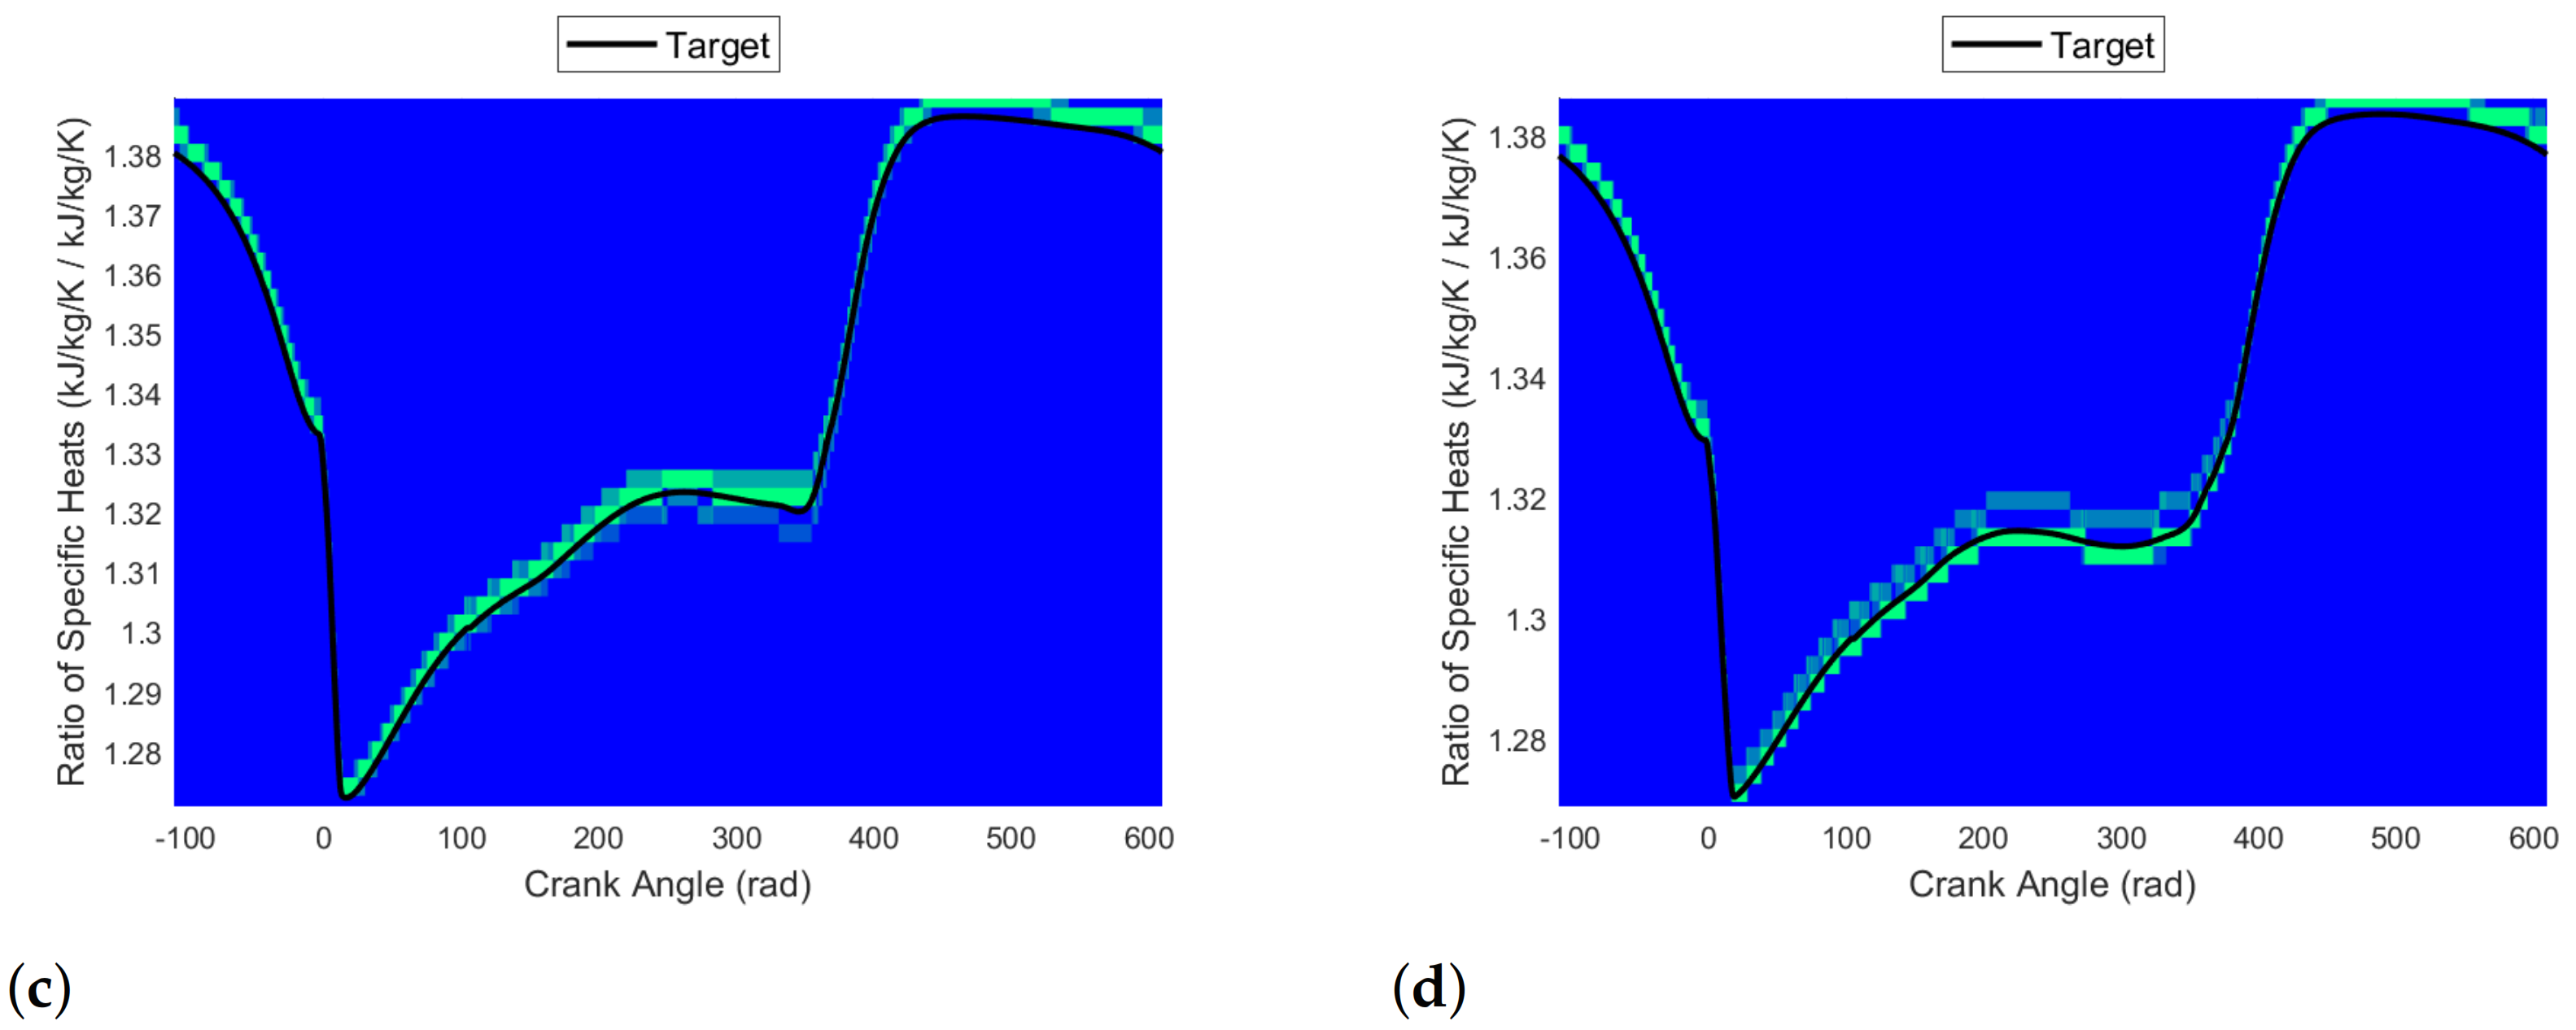
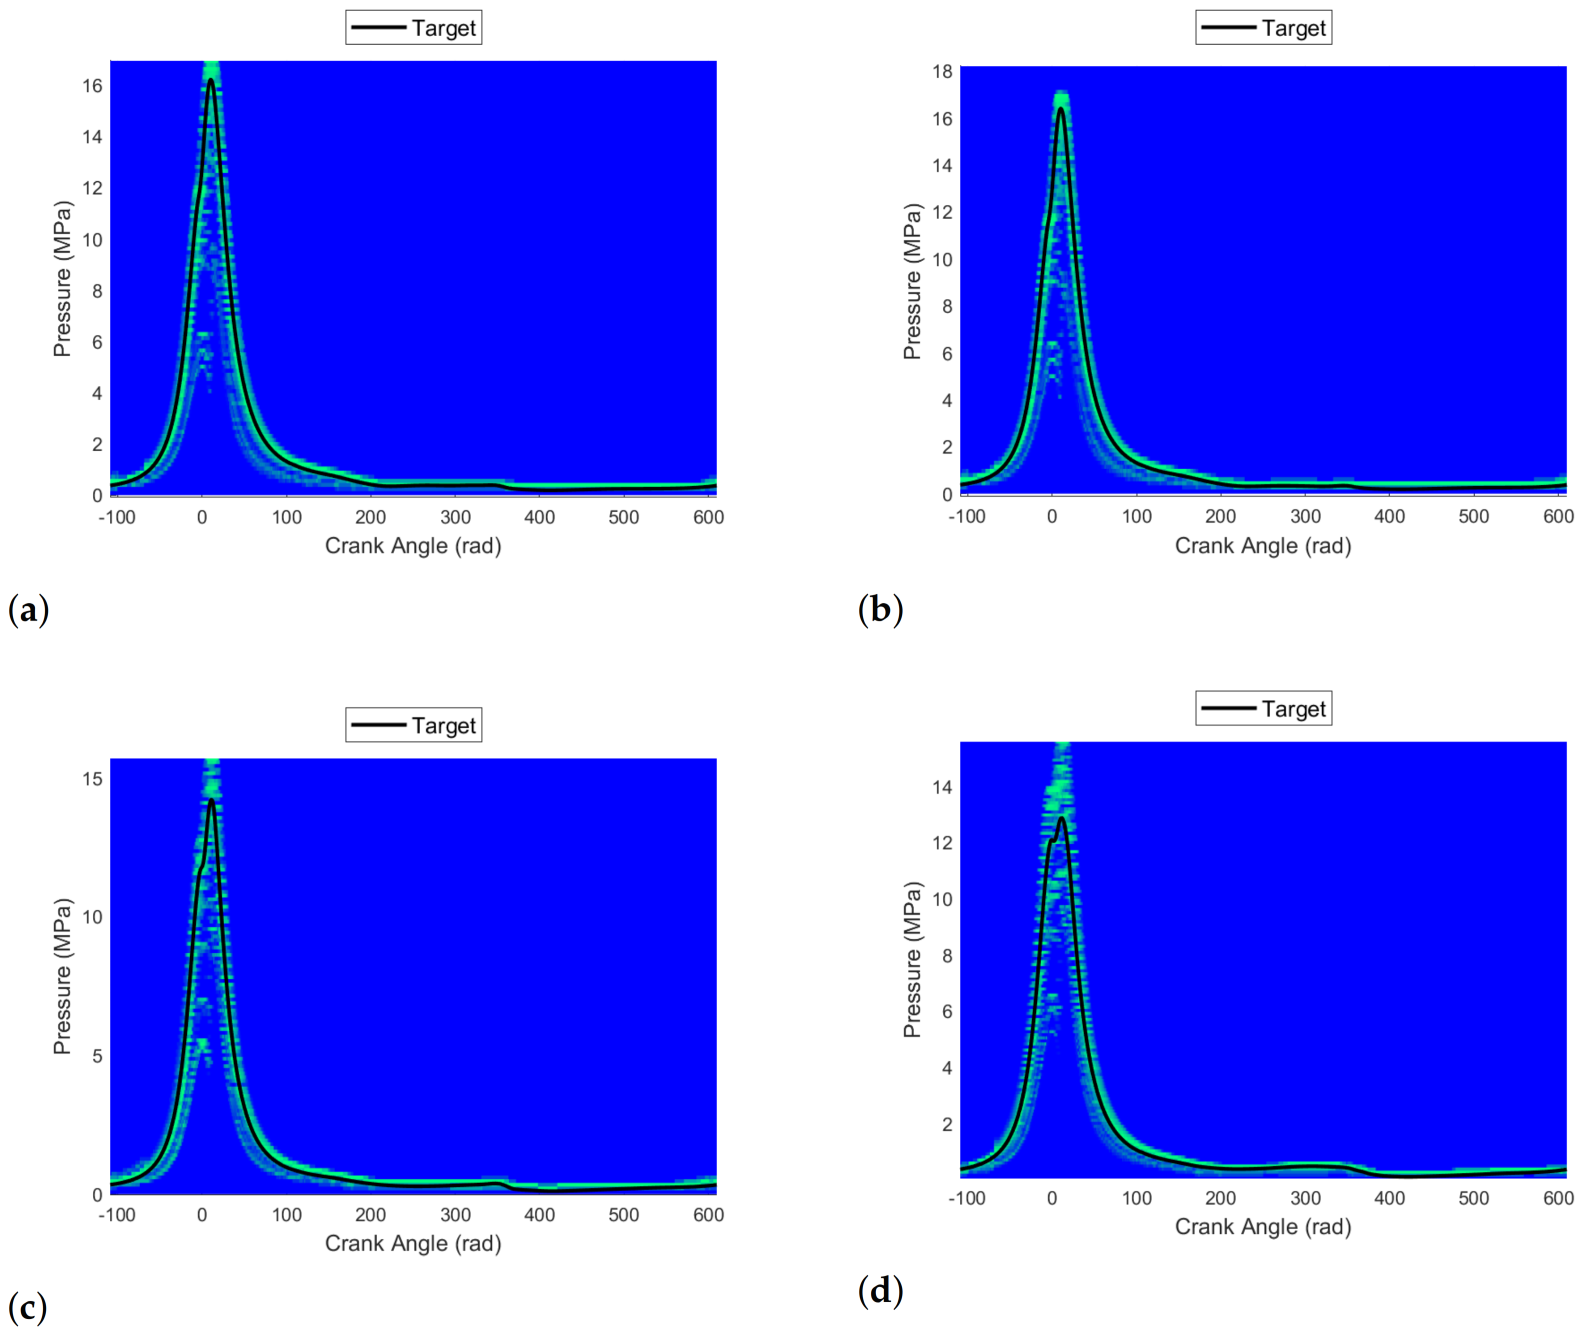
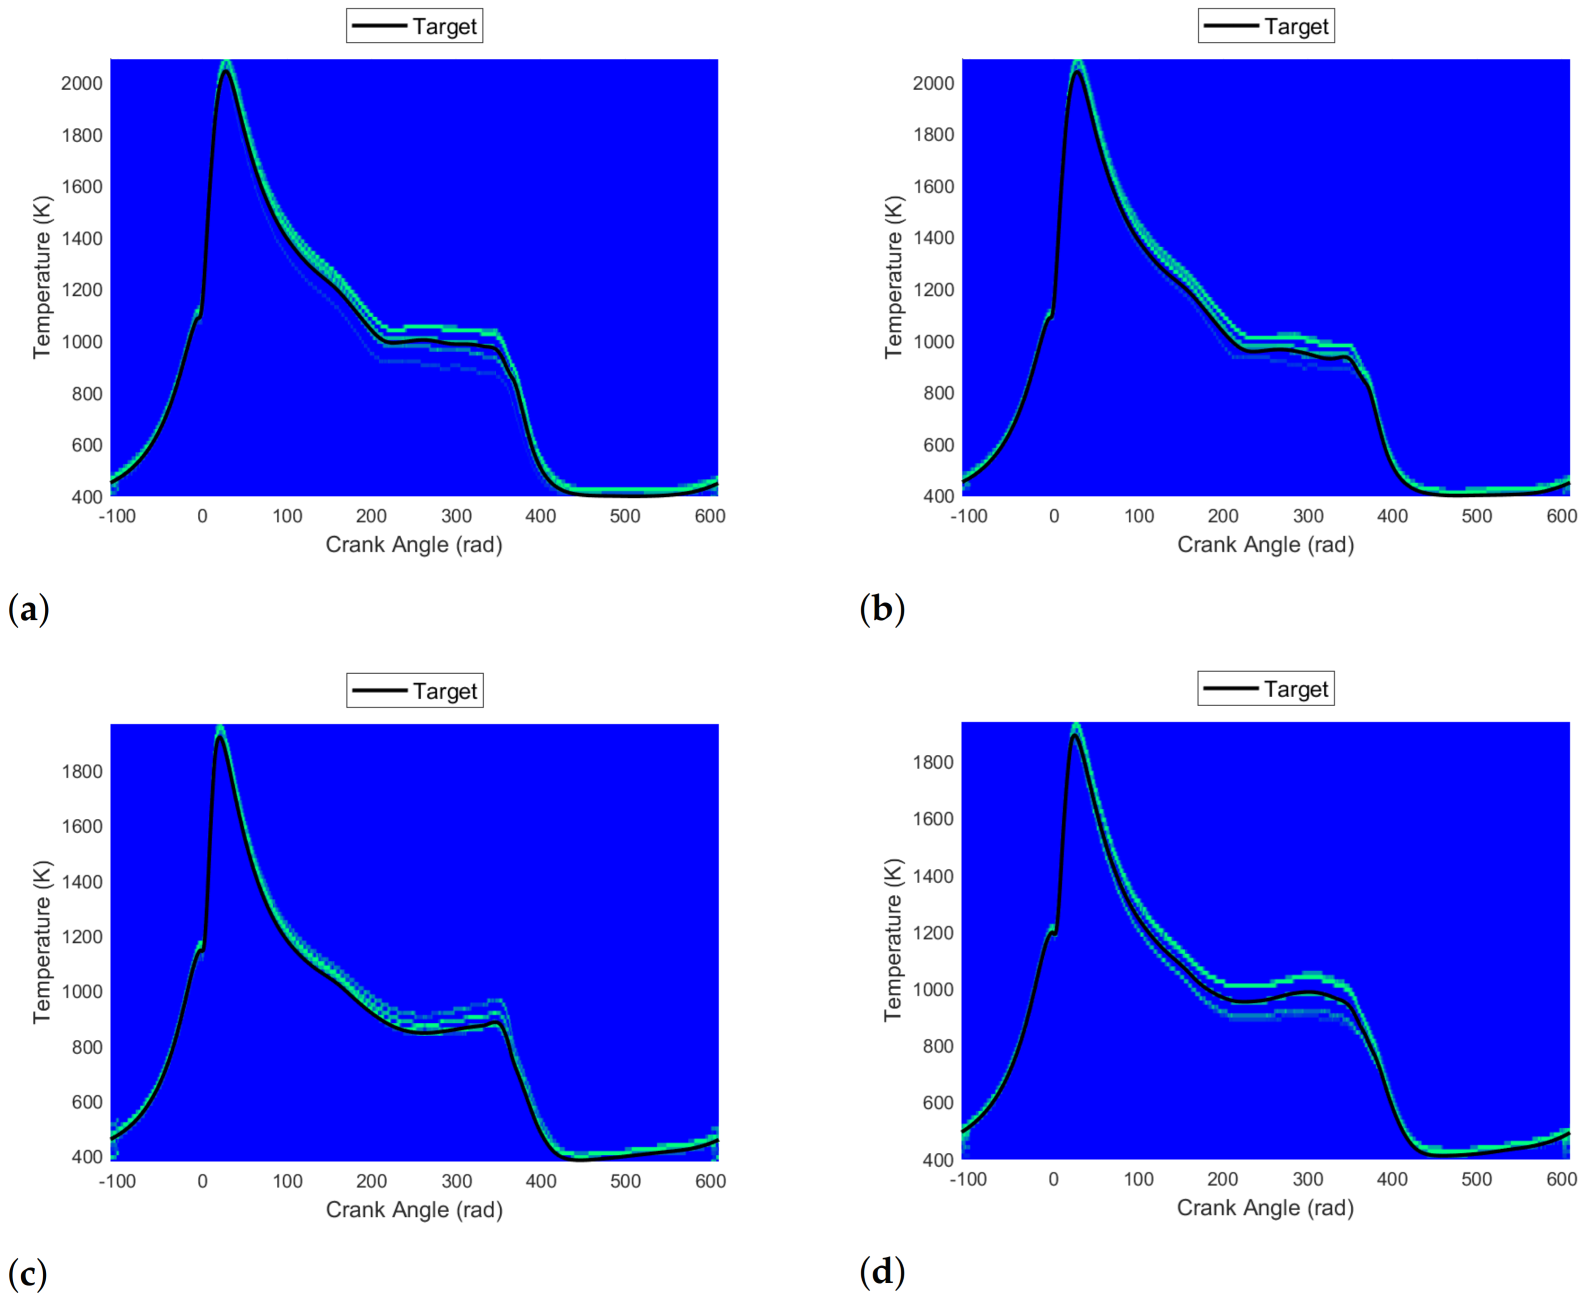
The KNN is a type of classifier, and its prediction will be determined by the posterior probability. “In Bayesian statistics, the posterior probability of a random event or an uncertain proposition is the conditional probability given the relevant evidence or background” [28], i.e., based on the information used to train the neural network. When a KNN is invoked, it will output a prediction and a probability vector of each unique class occurring. One can then begin to understand not only what the prediction may be, but a range of applicability in which one would expect the prediction to occur within, again this based on the training data. If a testing dataset is then substantially different from the training dataset this type of neural network should help illuminate the fact that perhaps the neural networks prediction is no longer applicable, or simply the testing data extends outside of the bounds of the training data. To highlight the complete response of the KNN, the in-cylinder pressure and temperature response resulting from the KNN were generated in (Figure 14 and Figure 15) using shaded regions where the light green color indicates high probability of occurring, while dark blue indicates a relatively low probability of occurring. A black trajectory was also included within the figure, the trajectory represents the represents the linearly interpolated engine response.
Figure 14 demonstrates the predictive capability of the KNN to predict the in-cylinder pressure at 75 % fuel index and 3600 rpm for one complete cycle of the engine. Recall the light green color indicates high probability of occurring, while dark blue indicates a relatively low probability of occurring. It can be observed that the KNN is visually highlighting other potential areas in which pressure was observed to have occurred based on the training data. What this shows is that KNN may be sufficient to provide accurate predictions. More importantly, it demonstrates a visual interpretation of the training data set, which can be used to interpret the applicability of the ANN or CNN responses. The visualization can be used to assess if the tested set of conditions lie outside of the training dataset, or if the resulting prediction exists outside what was been previously observed.
Figure 15 demonstrates the predictive capability of the KNN to predict the in-cylinder temperature at 75 % fuel index and 3600 rpm for one complete cycle of the engine. Recall the light green color indicates high probability of occurring, while dark blue indicates a relatively low probability of occurring. As with the pressure response, the KNN is able to provide accurate predictions and demonstrate a visual interpretation of the training data set, which can be used to interpret the applicability of other AI/ML based algorithms.
As mentioned previously, the SANNs, LSTMNs, and CNNs are considered to be unintelligent. They will always produce a prediction, with no relevant information about the accuracy unless additional target features or metrics are applied. The KNN however will provide not only a prediction, but some measure of the perceived accuracy of the prediction and other possible conditions occurring via the posterior probability. Figure 14 and Figure 15 demonstrate one interpretation of the perceived prediction space. The dark shaded blue coloration indicates relatively low probability of occurring, while the light green coloration indicates the highest probability of occurring. The shaded region as generated for the KNN interestingly shows various other regions in which the selected in-cylinder conditions could potently occur within, based on the KNN’s past memory, i.e., the training data. Therefore, the total response of the KNN also enables us to observe the potential solution space of the in-cylinder conditions. Once can also observe that even if the KNN response as observed within Figure 12 and Figure 13 is incorrect (most probably prediction), the shaded KNN response can help to indicate other applicable regions in which the in-cylinder conditions are likely to occur based on past information, which could potentially be used as a diagnostic measure to indicate that either the engine is malfunctioning or deteriorating, or perhaps the new testing dataset is now significantly different than the training dataset. In that case, the neural network is perhaps no longer able to yield predictions which are accurate, and more care should be used if the predictions are being relied upon for control purposes. Analysis of Figure 10, Figure 11, Figure 12 and Figure 13 would seem to indicate that the SANN outperform all of the other neural networks.
For each of the four engines we evaluated the resulting neural network performance function (Mean Squared Error (MSE)) as shown in Table 2, Table 3 and Table 4. The look-up table interpolated response is used as the theoretical engine response and used to compute the MSE of the resulting neural network prediction. Analysis of the figures and the tables would indicate that for the specific set of operating points, the SANNs appear to have the best performance, followed closely by CNNs and the KNNs. Although LSTMNs were employed during this study as well, many of the LSTMNs failed to sufficiently converge to yield accurate predictions due to our desired set of input features. We expect that by changing the input features, LSTMNs could in fact be generated. For the particular set of operating conditions, the SANNs, CNN, and KNNs are sufficient to generate seemingly accurate predictions which reasonably approximate the desired in-cylinder conditions. Interestingly, of the four sets of in-cylinder conditions shown within the section, the in-cylinder condition which showed the greatest sensitivity to yielding accurate predictions was that of the in-cylinder pressure conditions. This is an unfortunate finding because the generated work of the engine varies as a function of the pressure and volume, which in turn is directly related to the indicated, brake, and aggregate torque generated by the engine. This should also be no surprise as the in-cylinder pressure can vary widely depending on the injection timing and amount of fuel/air injected into the cylinders. The SANN again had the better performance across the board for all engine variants, followed by the KNN. The CNN worked well for both the 3- and 4-cylinder engines but showed somewhat significant degradation of predictions when applied to the 6- and 8-cylinder engines.

4.2. Multi-Point Operational Conditions

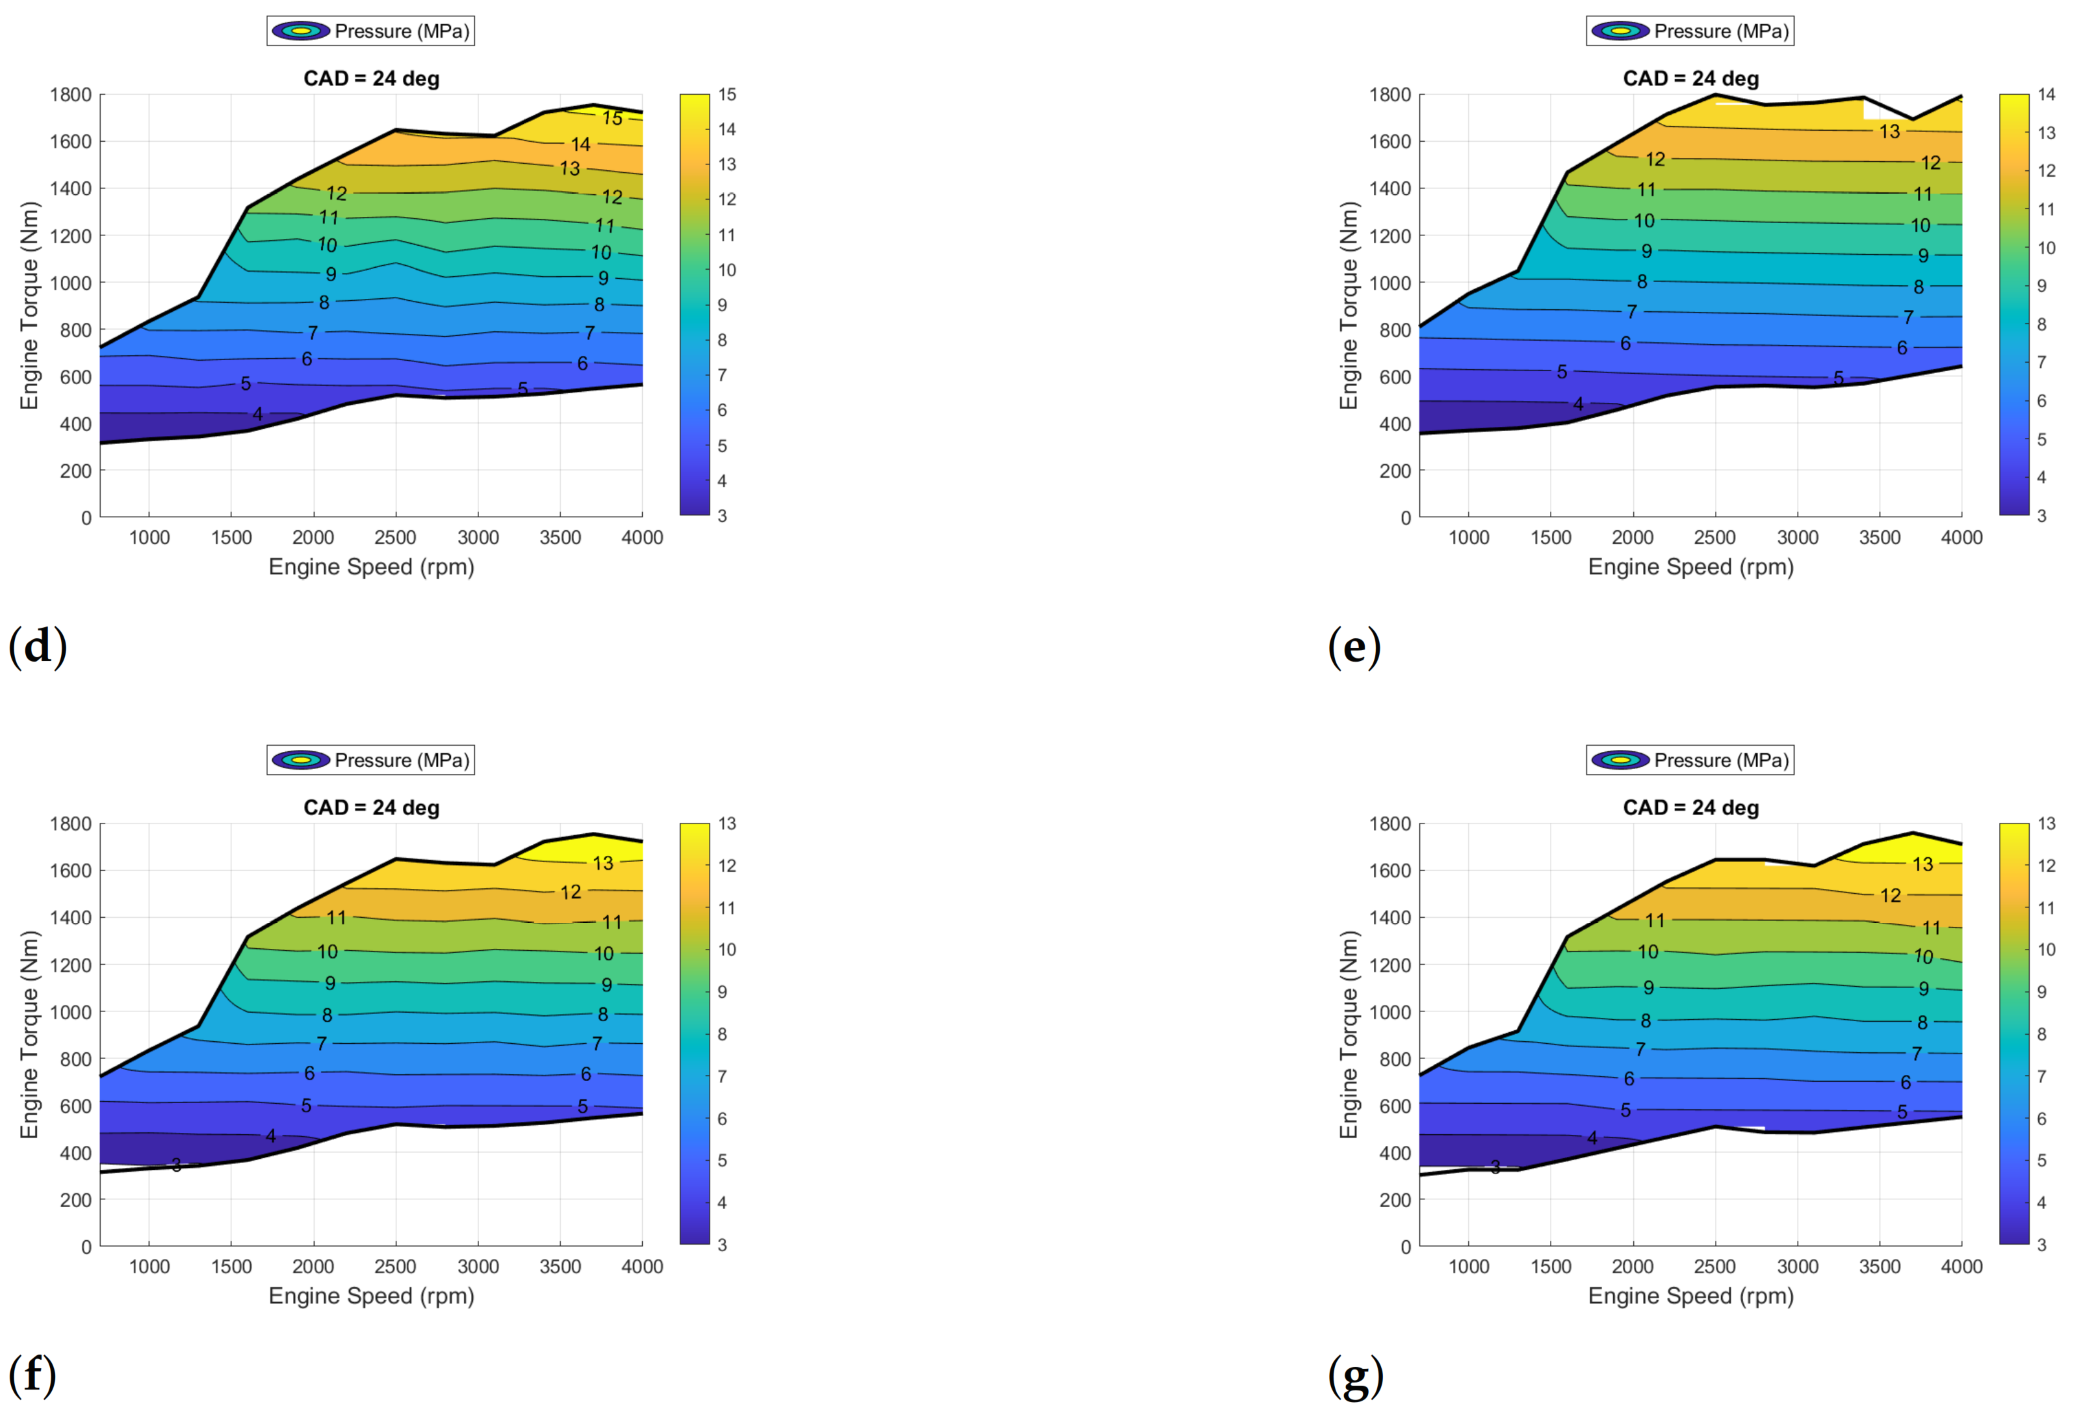
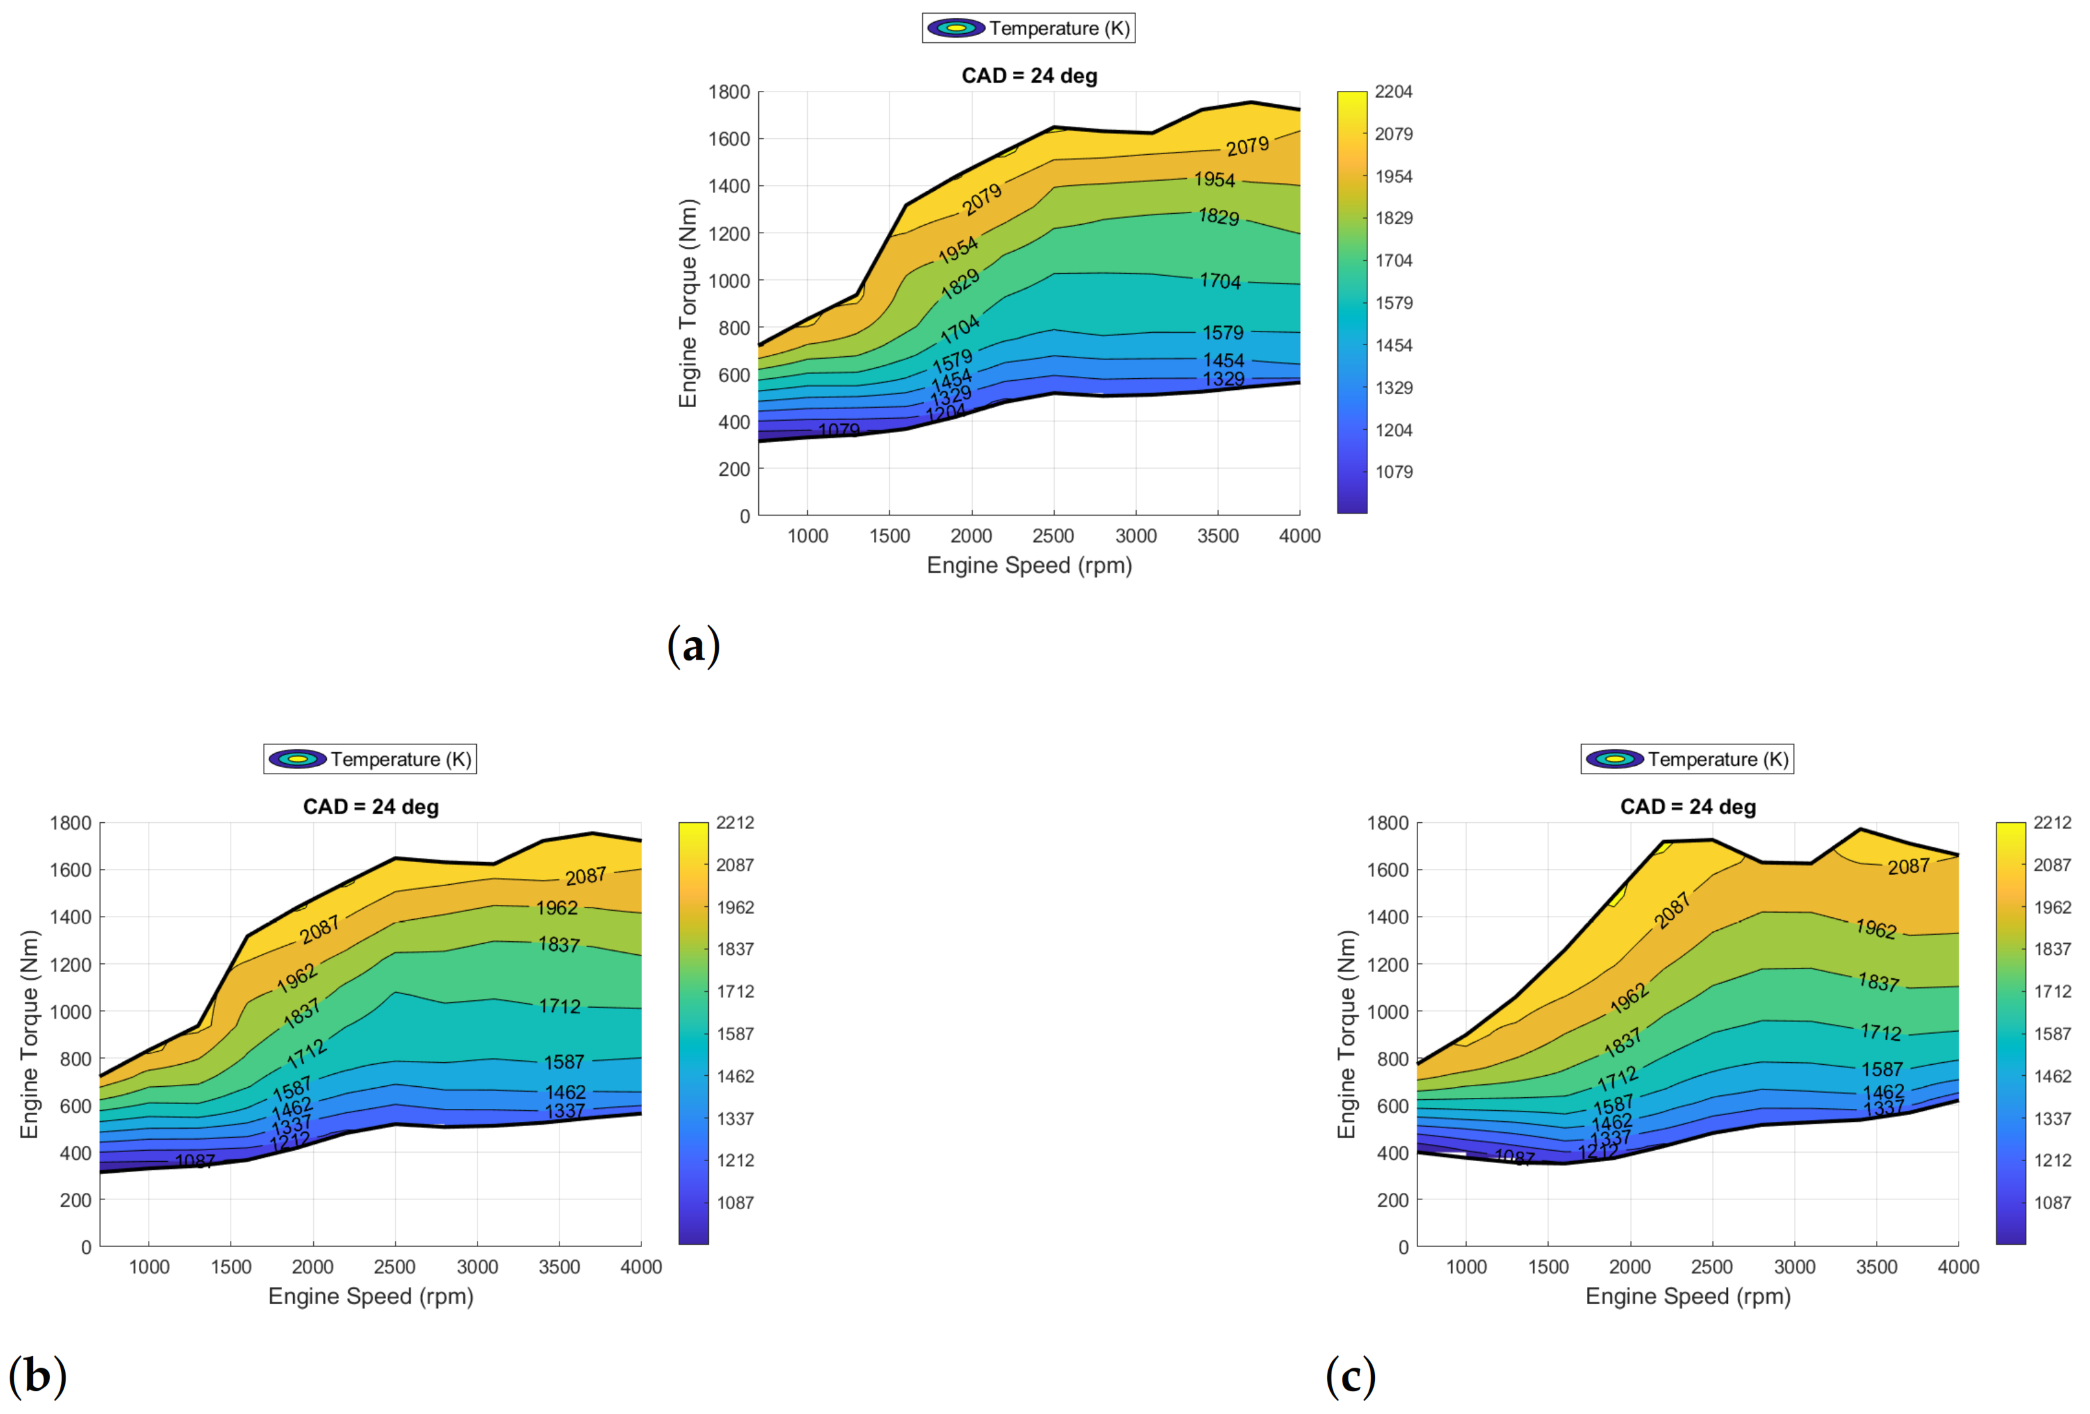
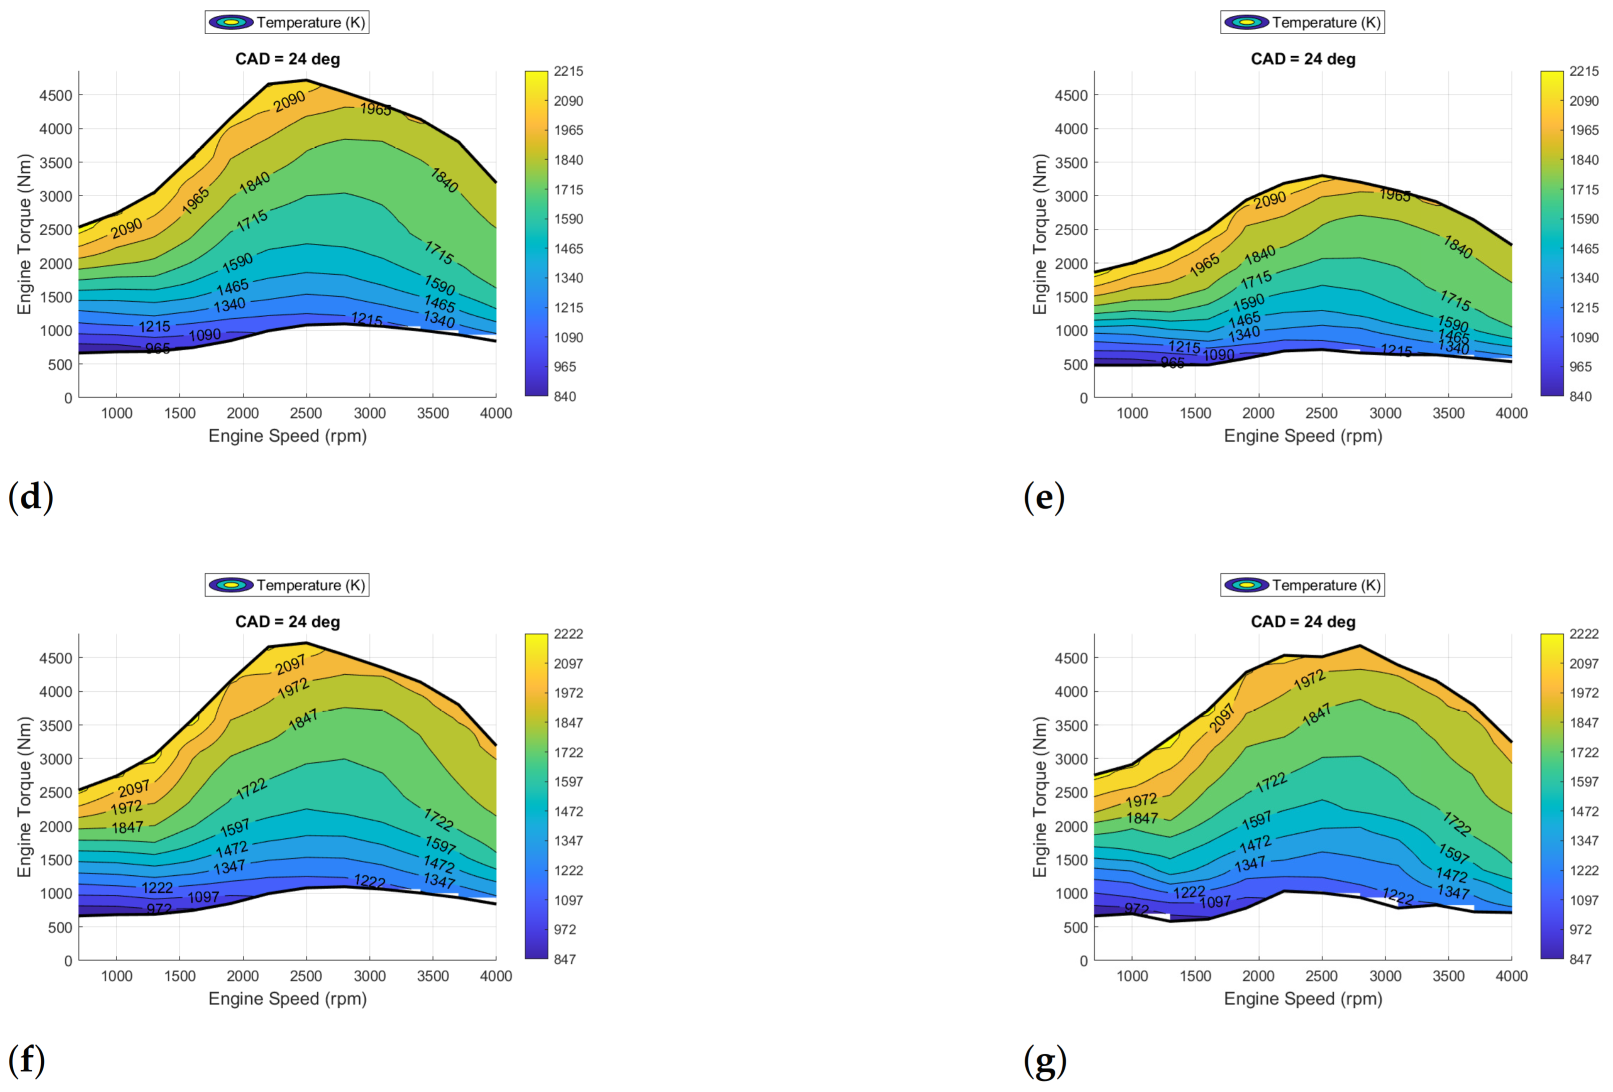
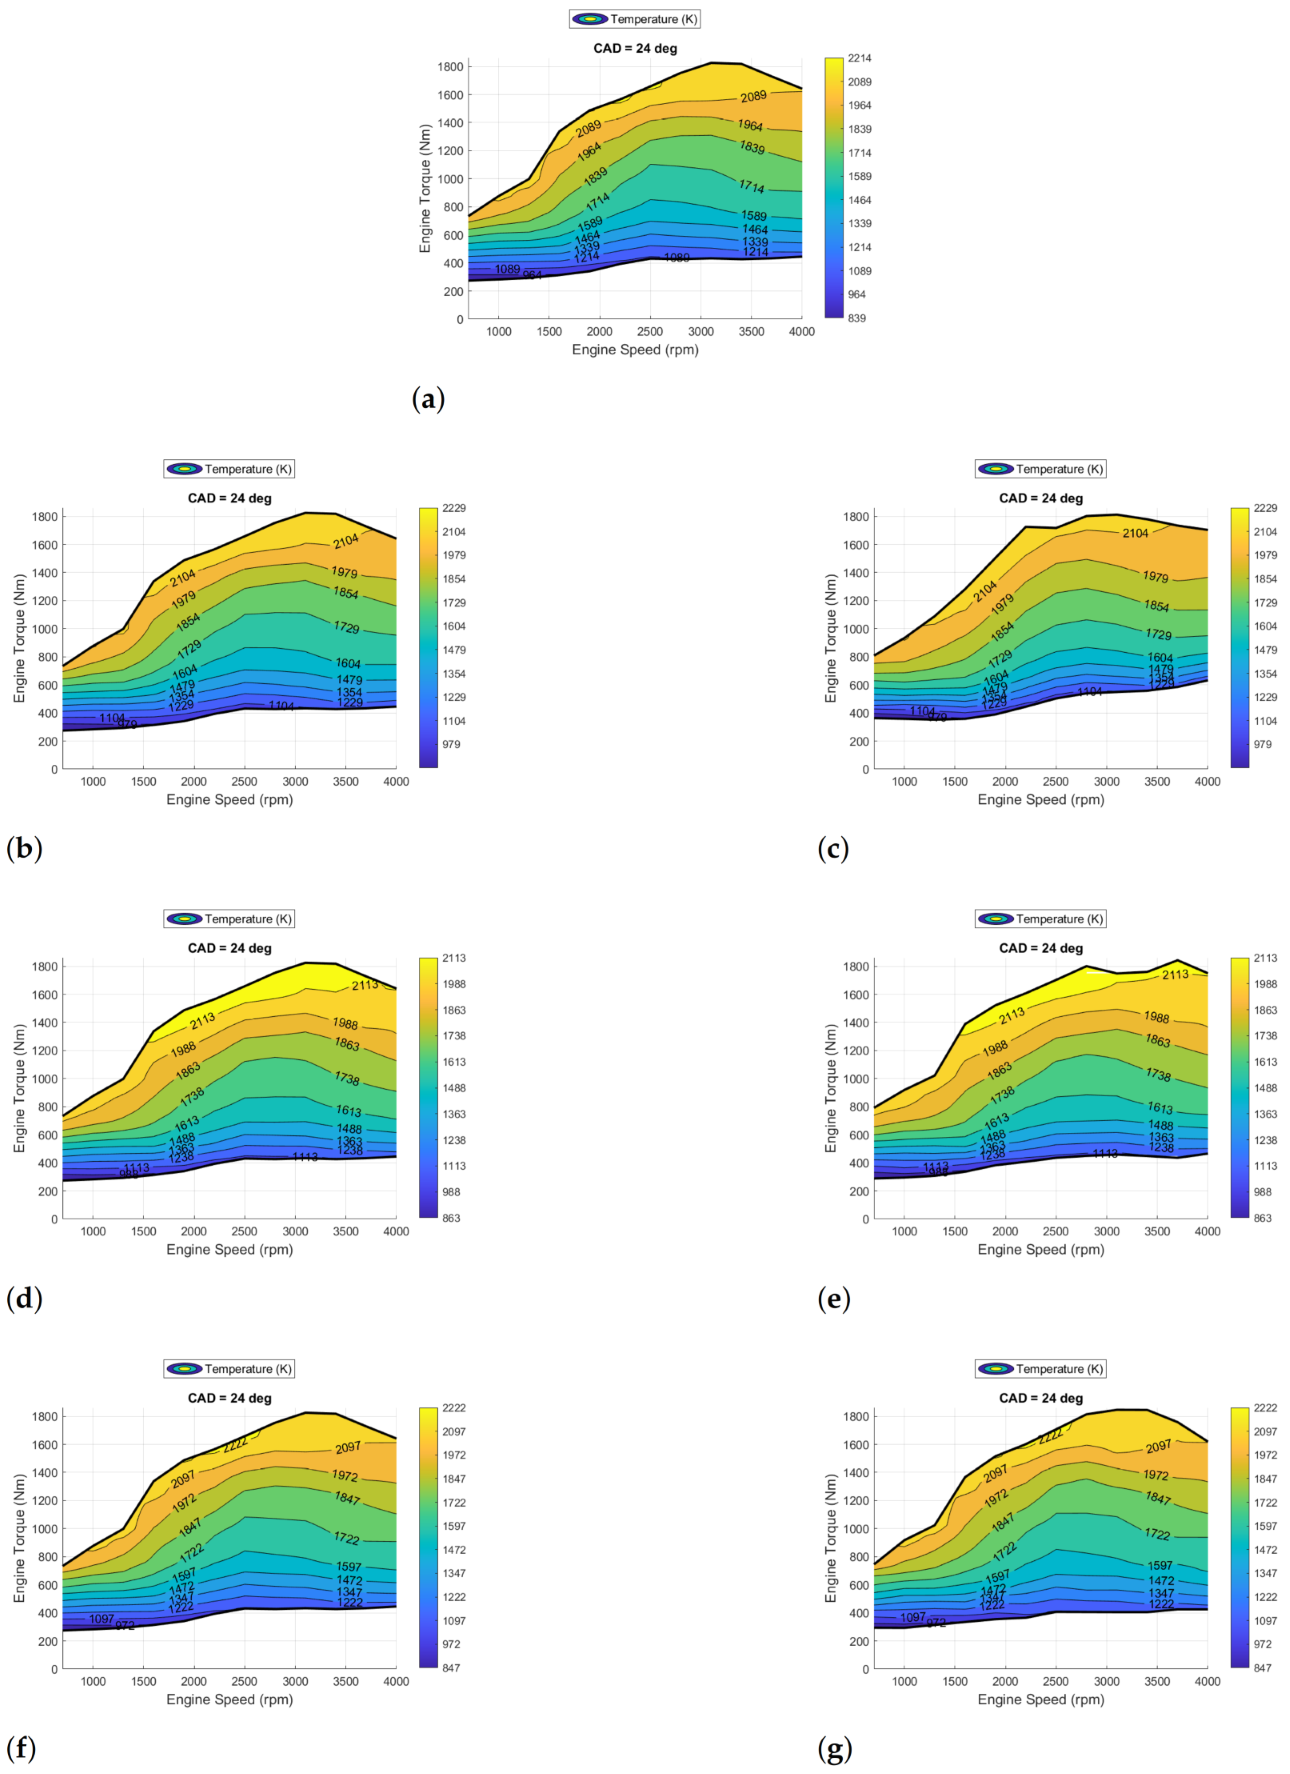
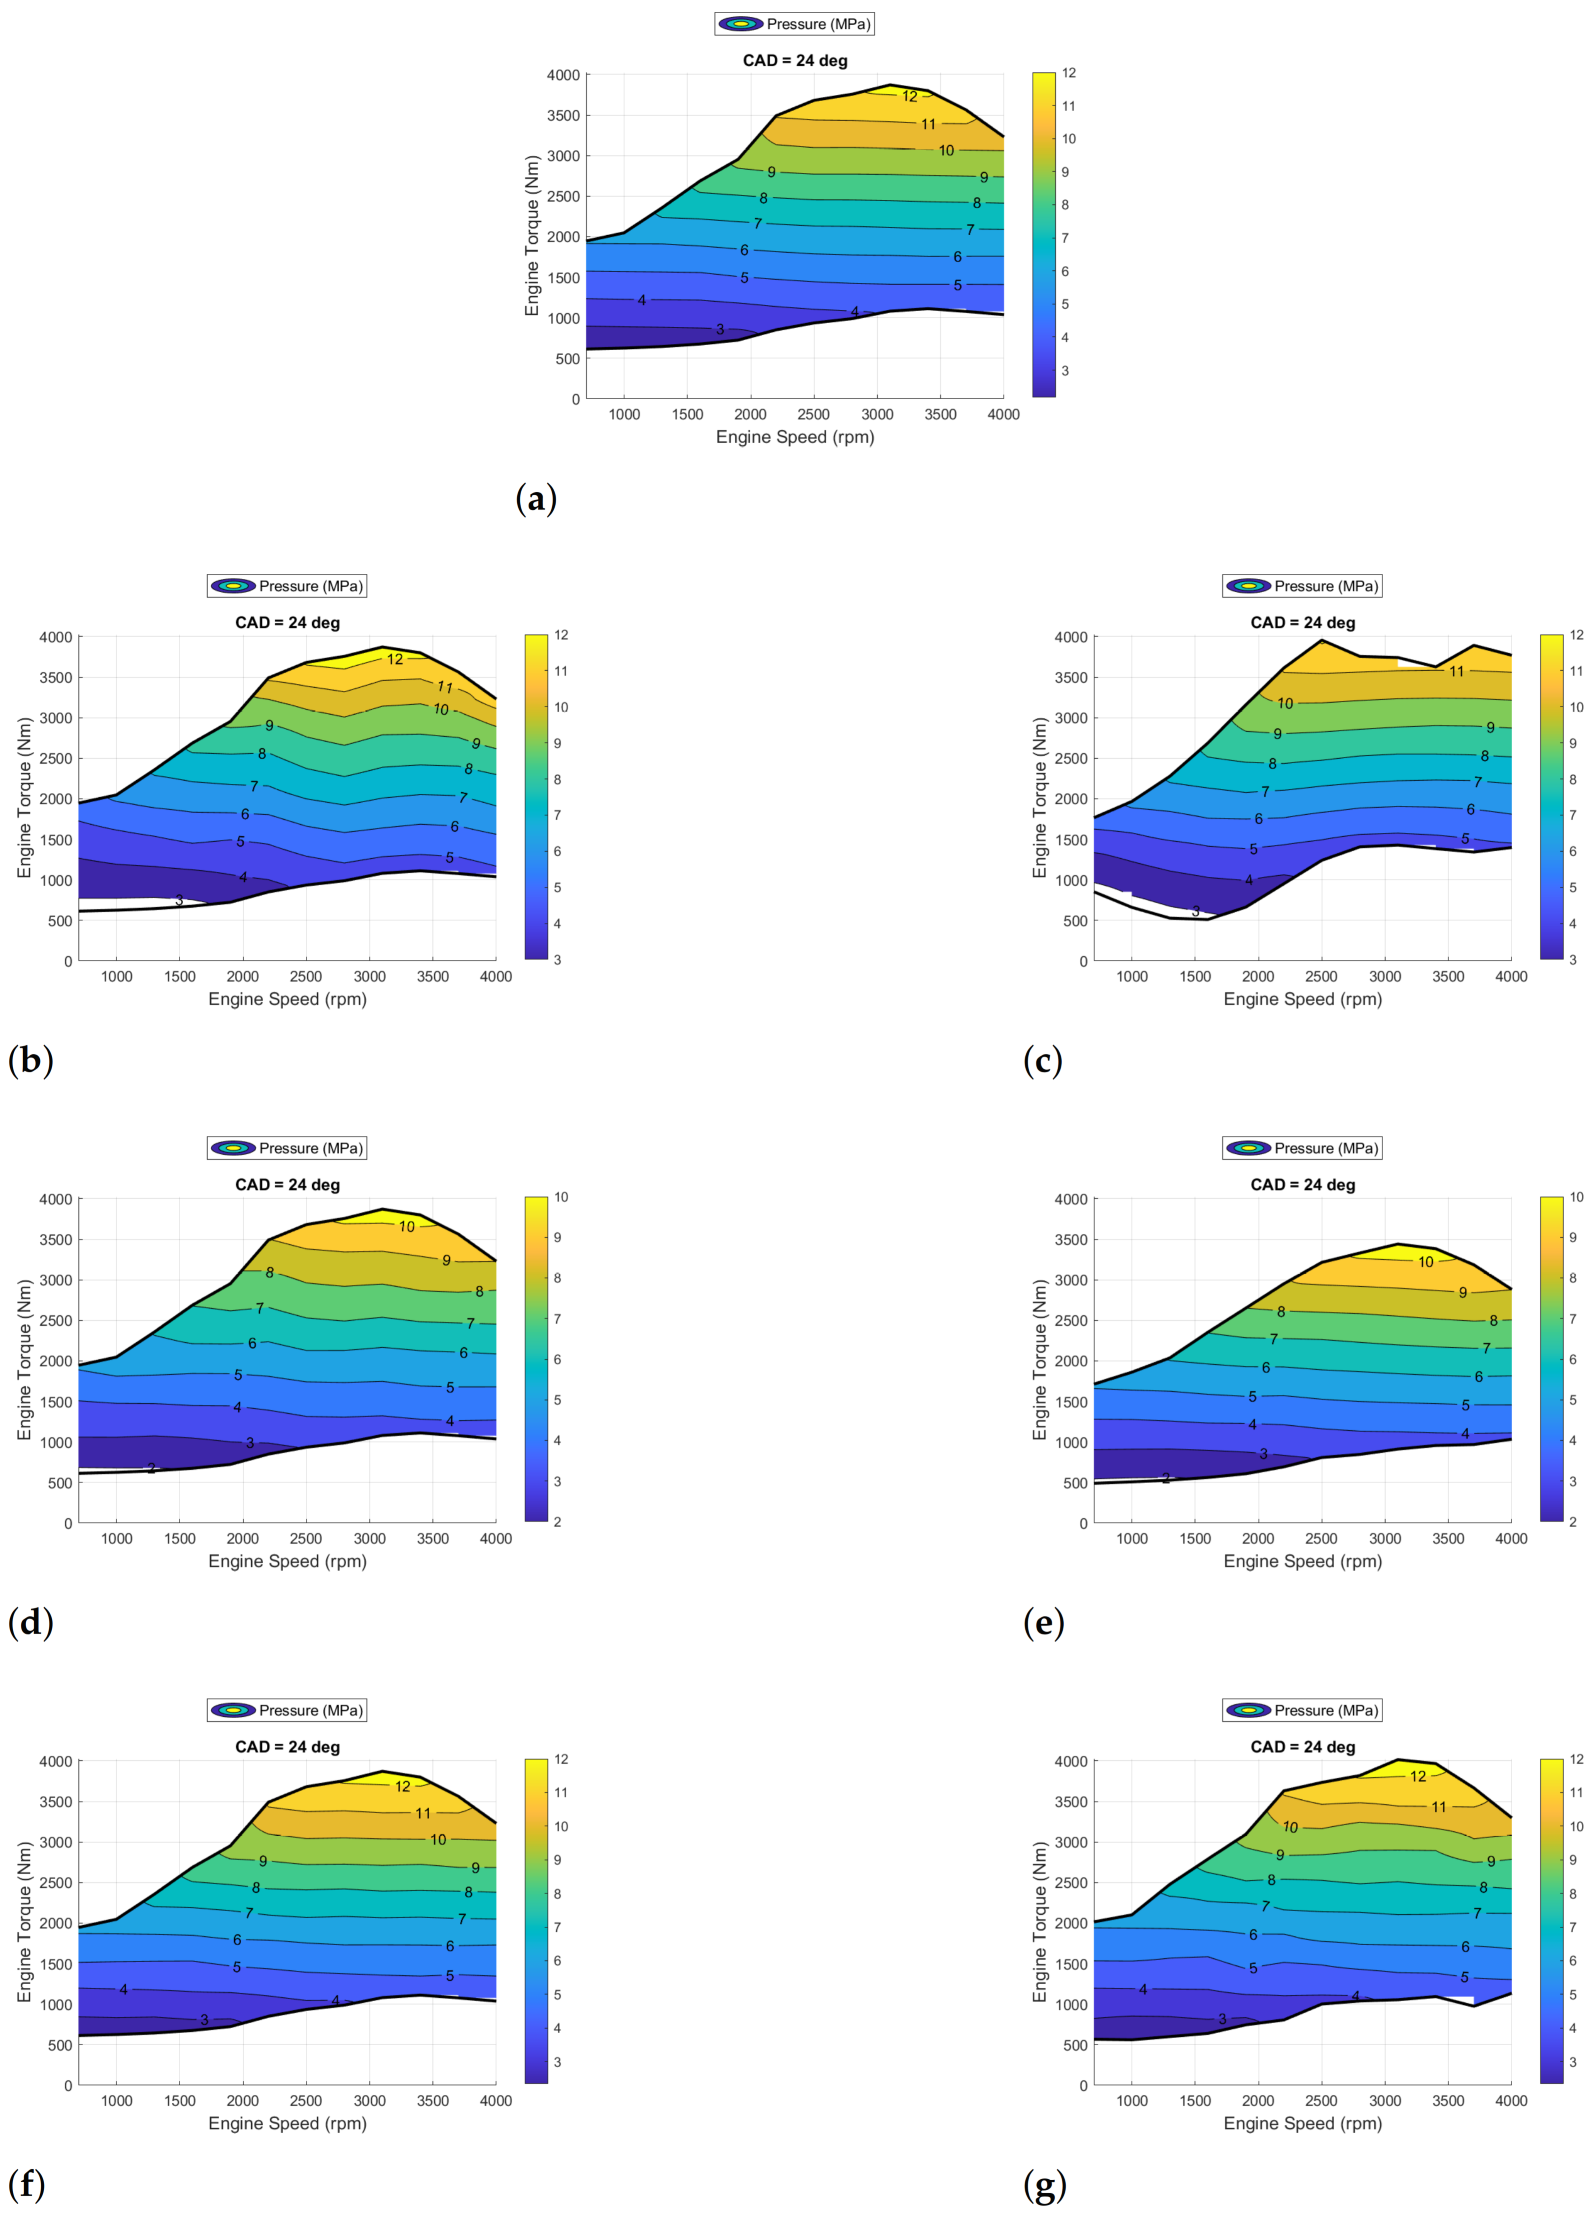
The previous set of results illustrated the performance of the ANNs, CNNs, and KNNs, for a single set of operating points for the duration of one engine cycle. In order to fully test the predictive capabilities of the neural networks and their robustness, we used the neural networks to predict a wider range of operational conditions of the engine. Multi-point three dimensional maps were then generated using the neural networks for a single crank angle degree state of 24 and various engine speeds, and various throttle or fuel indices conditions, resulting in Figure 16, Figure 17, Figure 18 and Figure 19 contain the pressure and temperature contours for each of the 3-cyl and 6-cyl engine variants, while the 4-cyl and 8-cyl engine variant contours are included in Appendix D.
Each figure will have seven sub-figures, the first figure is the contour plot illustrating the response of the lookup-table, presumed to be the true response of the engine. The remaining six sub-figures then contain two separate responses for the ANN, CNN, and KNN, termed the single degree of freedom (1 DOF) or two degree of freedom (2 DOF) neural network responses. The single degree of freedom response (left most set of sub-figures) illustrates the response of the neural network subject to the originally defined engine brake torque. This was completed such that we could observe the response of the neural network to solely predict the desired in-cylinder condition, i.e., pressure or temperature. This assumption is not strictly correct, because the brake torque is directly related to the in-cylinder conditions. In-cylinder pressure will dictate the engine torque. Because we have predictive capabilities to estimate the in-cylinder pressure, we can also estimate the resulting engine torque using the brake engine torque equation. Thus, the two degree of freedom response (right most set of sub-figures) illustrates not only the predicted in-cylinder condition, but it also includes an estimation of engine’s brake torque. The two degree of freedom response will then have two sources of error, the torque prediction, and the in-cylinder condition prediction, providing a better realization of the neural networks responses to predict dissimilar in-cylinder conditions.
Figure 16 demonstrates the predictive capability of the ANN, CNN, and KNN for the multi-point operational conditions for the in-cylinder pressure for the 3-cylinder engine. Figure 16a contains the look-up interpolated engine response, while Figure 16b,d,f contain the single degree of freedom (1DOF) contours for the ANN, CNN, and KNN, respectively. For the 1DOF results, upper and lower torque limits were preserved when compared to Figure 16a. Visually, the CNN and KNN appear to preserve the shape and magnitude of the contours. The shape of the contours produced by the ANN is similar but has noticeable differences regarding the magnitude of the contours and the relative location in which they appear. Similarly, Figure 16c,e,g contain the two degree of freedom (2DOF) contours for the ANN, CNN, and KNN, respectively. In this case the KNN appears to produce the most accurate response to predict both the magnitude and shape of the contour, followed by the CNN, and then the ANN. Both the ANN and the CNN response is noticeably different. This results from inaccurate pressure predictions, which are then compounded to estimate engine torque.
Figure 17 demonstrates the predictive capability of the ANN, CNN, and KNN for the multi-point operational conditions for the in-cylinder temperature for the 3-cylinder engine. Figure 17a contains the look-up interpolated engine response, while Figure 17b,d,f contain the single degree of freedom (1DOF) contours for the ANN, CNN, and KNN, respectively. For the 1DOF results, upper and lower torque limits were preserved when compared to Figure 17a. Visually, the ANN, CNN, and KNN all produce responses which preserve the shape of the contour. In regard to the magnitude of the contour, the KNN preforms the best, followed by the CNN and the ANN. Similarly, Figure 17c,e,g contain the two degree of freedom (2DOF) contours for the ANN, CNN, and KNN, respectively. Again, the KNN appears to produce the most accurate response to predict both the magnitude and shape of the contour, followed by the CNN, and then the ANN. The ANN response is noticeably different. Both the ANN and the CNN response are noticeably different, resulting from inaccurate pressure predictions, which are then compounded to estimate engine torque.
Figure 18 demonstrates the predictive capability of the ANN, CNN, and KNN for the multi-point operational conditions for the in-cylinder pressure for the 6-cylinder engine. Figure 18a contains the look-up interpolated engine response, while Figure 18b,d,f contain the single degree of freedom (1DOF) contours for the ANN, CNN, and KNN, respectively. For the 1DOF results, upper and lower torque limits were preserved when compared to Figure 18a. Visually, the CNN, KNN, and ANN appear to preserve the shape and magnitude of the contours for this particular engine variant. Similarly, Figure 18c,e,g contain the two degree of freedom (2DOF) contours for the ANN, CNN, and KNN, respectively. The KNN appears to produce the most accurate response to predict both the magnitude and shape of the contour, followed by the CNN, and then the ANN. The ANN response is noticeably different, this results from inaccurate pressure predictions, which are then compounded to estimate engine torque.
Figure 19 demonstrates the predictive capability of the ANN, CNN, and KNN for the multi-point operational conditions for the in-cylinder temperature for the 6-cylinder engine. Figure 18a contains the look-up interpolated engine response, while Figure 18b,d,f contains the single degree of freedom (1DOF) contours for the ANN, CNN, and KNN, respectively. For the 1DOF results, upper and lower torque limits were preserved when compared to Figure 18a. Visually, the CNN, KNN, and ANN appear to preserve the shape and magnitude of the contours for this particular engine variant. Similarly, Figure 18c,e,g contain the two degree of freedom (2DOF) contours for the ANN, CNN, and KNN, respectively. In this case, the CNN appears to the most accurate algorithm at predicting both the magnitude and shape of the contour, followed by the KNN and then the ANN. The ANN response is noticeably different, resulting from inaccurate pressure predictions, which are then compounded to estimate engine torque.
Analysis of Figure 16, Figure 17, Figure 18 and Figure 19 seem to indicate that KNN produces the most accurate in-cylinder pressure and temperature predictions when considering the single degree of freedom response, followed closely by the CNN, and that of the ANN. Of the two conditions shown (pressure and temperature), all variations of the temperature estimates produced by the KNN, CNN, and ANN produce sufficiently accurate predictions regardless of the engine type. Many of the pressure estimates produced by the KNNs, CNN, and ANN produce sufficiently accurate predictions for the 3- and 4-cylinder engines. The CNN and ANN variants appear to underestimate the in-cylinder conditions for the larger engine variants including the 6- and 8-cylinder engines. The 4-cylinder and 8-cylinder engine variant figures are provided in Appendix D. This only appears to apply to the in-cylinder pressure conditions, in-cylinder temperature conditions appear to be sufficiently predicted by any of the KNN, CNN or ANN algorithms.
The single degree of freedom responses illustrated the resulting behavior of the neural network to predict the in-cylinder condition, which omitted the fact that in-cylinder pressure and brake torque are related. When considering the two degree of freedom responses, we see once again that the KNN response appears to be the most accurate, followed by the CNN and the ANN. The KNN is perhaps the most notable of the predictive algorithms generated as it produces the most accurate looking in-cylinder condition for temperature and pressure. Further, the KNN seems to retain a close approximation to that of the look-up table response for the resulting brake torque which is because the KNN produced the most seemingly accurate in-cylinder predictions. The CNN and ANN seem to be able to produce sufficiently accurate predictions, however, prediction errors within the CNN and ANN pressure neural networks cause similar but more noticeably different brake torque estimates altering the general shape of the contours. The KNN preserves more of the shape of the pressure trajectory across all ranges of fuel indices and engine speeds resulting in closer approximation to in-cylinder pressure, temperature, and brake torque.

5. Conclusions and Future Work

This study demonstrates that reasonably accurate in-cylinder predictions can be generated by effectively employing various neural network algorithms including Kth Nearest Neighbor classifiers (KNNs), Convolutional Neural Networks (CNNs), and Shallow Artificial Neural Networks (SANNs). The KNN algorithms showed the most promising results to predict in-cylinder conditions, followed by the CNN, and the ANN. LSTMNs were also developed, but they failed to sufficiently converge and produce accurate results. We expect that by altering the input features, the LSTMN algorithms could be improved to result in comparable performance to the KNN, CNN, and ANN. The neural networks as shown in this report were capable of producing reasonably accurate predictions for the in-cylinder pressure, temperature, gamma (the ratio of the specific heat at constant volume to the ratio of specific heat at constant pressure), mass fraction of fuel, mass fraction of the unburned nonfuel, the mass fraction of burned fuel, the mass flow rate of fuel into the cylinders, and the mass flow rate of air into the cylinders.
We expect that the algorithms can be further improved by altering the selected set of input features to include past time histories of data. None of the algorithms presented within this document relied upon the current in-cylinder conditions as input features, but rather general information pertaining to the motion of the piston or crank angle position, throttle or fuel index, engine speed, and multiple features which relate back to engine including piston bore, number of cylinders, rated power of the engine, and the estimated power produced by a single cylinder of the engine. This is an encouraging result because it means that the algorithms developed can not only reconcile the current set of in-cylinder conditions, but they could also be used to forecast the future conditions of the engine by appropriately setting the required set of input features. This is an important conclusion because most production vehicles lack sufficient sets of in-cylinder sensors. This means the neural networks can be used to characterize in-cylinder conditions and estimate the conditions, which in-turn can be used in combination with control algorithms to understand the potential implications of subjecting the engine to various operational conditions.
Future work will continue to develop such algorithms for the engine, fully characterizing in-cylinder conditions, such that we can use the algorithms to conduct an exergy-based analysis of the engines. Research has shown that using exergy-based optimization and control-based algorithms can likely be used to further improve performance of an engine when compared to ordinary energy-based solutions. We also intend to explore near-real-time or real-time training of the pseudo dynamometer-based engine data using the more detailed crank angle resolved model to be included with a more complete vehicle architecture; this is consistent with autonomous UGVs, UAVs, USVs, and some mid or full-sized military vehicle variants.
Military platforms typically contain platform specific features and capabilities, some of which may represent a significant security concern. As a result, one may not be able to obtain sufficiently reasonably accurate energy and exergy flow characterizations for various vehicles or engine variants. This work will proceed by utilizing high-powered computational software packages such as MATLAB/Simulink, GT-Power, or Riccardo Wave to generate platform specific training data which will permit the development of training data used to develop our set of AI/ML based algorithms. Once developed, they can be adapted to an individual vehicle or engine variant through the deployment of near-real-time or real-time training. Such capabilities will enable development of energy awareness, making it possible to then optimize the performance of the platform, thus providing the warfighter with new and more effective and efficient capabilities that better satisfy the commanders intent and reduce the cognitive burden to manage dissimilar assets.

Author Contributions

Conceptualization, R.J., T.Y.K. and C.J.; methodology, R.J., E.M., E.G. and C.J.; software, R.J.; validation, R.J., E.M., E.G., S.R. and C.J.; formal analysis, R.J. and T.Y.K.; investigation, R.J.; resources, C.J.; data curation, R.J.; writing—original draft preparation, R.J., S.R. and C.J.; writing—review and editing, R.J., S.R. and C.J.; visualization, C.J.; supervision, C.J.; project administration, C.J.; funding acquisition, C.J. All authors have read and agreed to the published version of the manuscript.

Funding

This research received no external funding.

Acknowledgments

The authors of this technical article would like to acknowledge our external collaborators at the Combat Capabilities Development Command (CCDC) Ground Vehicle Systems Center (GVSC) including Denise Rizzo and Matthew Castanier. We would also like to acknowledge our external collaborators at Clemson University’s Research Ground including Benjamin Lawler and Dan Egan for constructing the GT-Power models and simulating the various engine configurations forming the engine maps used in this research effort and those to come. We would also like to thank Brandon Hencey of the Air Force Research Laboratory (AFRL) in Dayton, OH for providing their technical expertise regarding AI/ML and general engineering practices which helped to develop predictive algorithms which we believe can be used to develop more extensible and applicable AI/ML based algorithms.

Conflicts of Interest

The authors declare no conflict of interest.

Abbreviations

Definitions
θ Crank Angle
θ Vector of Crank Angle Values
η Fuel Index/Throttle
ω e Engine Speed
ω e Vector of Engine Speed Values
L b Bore Length
L s Stroke Length
L l Connecting Rod Length
L a Crank Radius Length
p ( θ ) Piston Position as a Function of Crank Angle
V c Clearance Volume
V ( θ ) Piston Volume as a Function of Crank Angle
V d Maximum Displacement
N c y l Total Number of Cylinders
r c Compression Ratio
ϕ ˙ ( t ) Angular Velocity of Engine
ϕ ¨ ( t ) Angular Acceleration of Engine
J e q Engine Inertia
B e q Engine Damping
τ b r a k e Brake Torque
τ l o a d Load Torque
Φ c y l i In-cylinder Pressure
θ ( t 40 ) 40 Proceeding Crank Angle at time t
θ ( t 35 ) 35 Proceeding Crank Angle at time t
θ ( t 10 ) 10 Proceeding Crank Angle at time t
θ ( t 9 ) 9 Proceeding Crank Angle at time t
θ ( t + 10 ) 10 After Crank Angle at time t
θ ( t + 40 ) 40 After Crank Angle at time t
T a Atmospheric Temperature
P a Atmospheric Pressure
A ( θ ) Piston Surface Area as a Function of Crank Angle
P c y l Per-Cylinder Rated Engine Power
P r a t e d Rated Engine Power
ω r a t e d Rated Engine Speed
V d i s Total Displayed Volume
Y 1 , i n t Lookup Table Interpolated Engine State for Cylinder 1
Y ^ 1 , a n n ANN Predicted Engine State for Cylinder 1
Y ^ 1 , c n n CNN Predicted Engine State for Cylinder 1
Y ^ 1 , k n n KNN Predicted Engine State for Cylinder 1
Acronyms
AFRLAir Forces Research Laboratory
AIArtificial Intelligence
ARLArmy Research Laboratory
BDCBottom Dead Center
CNNConvolutional Neural Network
CADCrank Angle Degree
CCDCCombat Capabilities Development Command
CICompression Ignition
DPDynamic Programming
EMSEnergy Management Strategy
GVSCGround Vehicle System Center
HEMTTHeavy Expanded Mobility Tactical Truck
ICEInternal Combustion Engine
KNNKth Nearest Neighbor
LSTMNLong-Short Term Memory Network
MLMachine Learning
ResNetResidual Neural Network
RNNRecurrent Neural Network
RPMRevolution per Minute
SANNShallow Artificial Neural Network
SMETSquad Multipurpose Equipment Transport
TDCTop Dead Center
UAVUnmanned Ariel Vehicle
UGVUnmanned Ground Vehicle
USVUnmanned Surface Vehicle

Appendix A

A complete list of each of the sensor measurements as obtained from the individual nodes as shown in Figure 1 of the GT-Power based engine datasets are provided in Table A1 and Table A2.
Table A1. The sensor list pertaining to the inlet conditions of the compressor, the outlet conditions of the compressor which are the inlet conditions to the air chiller, the outlet conditions of the air chiller which are the intake manifold conditions, and the condition in each of the engine cylinders.
SensorDescriptionSignal NameUnitsVariable NameSize
N/AN/ACrank Angle DegreesdegCAD [ N , 1 ]
P1Inlet ConditionsPressurekPaP1_pres [ N , M , K ]
TemperatureKP1_temp [ N , M , K ]
Gamma kJ kg K / kJ kg K P1_gamma [ N , M , K ]
Mass Fraction Unburned Airg/gP1_ubAir [ N , M , K ]
Mass Fraction Unburned Vapor Fuelg/gP1_ubVapFuel [ N , M , K ]
Mass Fraction Unburned Liquid Fuelg/gP1_ubLiqFuel [ N , M , K ]
Mass Fraction Unburned Otherg/gP1_ubOther [ N , M , K ]
Mass Fraction Burned Gasg/gP1_bGas [ N , M , K ]
EnthalpykJ/kgP1_enth [ N , M , K ]
Mass Flow Ratekg/sP1_mdot [ N , M , K ]
P2Inlet Conditions of Air ChillerPressure k P a P2_pres [ N , M , K ]
TemperatureKP2_temp [ N , M , K ]
Gamma kJ kg K / kJ kg K P2_gamma [ N , M , K ]
Mass Fraction Unburned Airg/gP2_ubAir [ N , M , K ]
Mass Fraction Unburned Vapor Fuelg/gP2_ubVapFuel [ N , M , K ]
Mass Fraction Unburned Liquid Fuelg/gP2_ubLiqFuel [ N , M , K ]
Mass Fraction Unburned Otherg/gP2_ubOther [ N , M , K ]
Mass Fraction Burned Gasg/gP2_bGas [ N , M , K ]
EnthalpykJ/kgP2_enth [ N , M , K ]
Mass Flow Ratekg/sP2_mdot [ N , M , K ]
P3Intake ManifoldPressurekPaP3_pres [ N , M , K ]
TemperatureKP3_temp [ N , M , K ]
Gamma kJ kg K kJ kg K P3_gamma [ N , M , K ]
Mass Fraction Unburned Airg/gP3_ubAir [ N , M , K ]
Mass Fraction Unburned Vapor Fuelg/gP3_ubVapFuel [ N , M , K ]
Mass Fraction Unburned Liquid Fuelg/gP3_ubLiqFuel [ N , M , K ]
Mass Fraction Unburned Otherg/gP3_ubOther [ N , M , K ]
Mass Fraction Burned Gasg/gP3_bGas [ N , M , K ]
EnthalpykJ/kgP3_enth [ N , M , K ]
Mass Flow Ratekg/sP3_mdot [ N , M , K ]
P4In-cylinder ConditionsPressure k P a P4_cyl#_pres [ N , M , K ]
TemperatureKP4_cyl#_temp [ N , M , K ]
Gamma kJ kg K / kJ kg K P4_cyl#_gamma [ N , M , K ]
Mass Flow Fuelkg/sP4_cyl#_mdotFuel [ N , M , K ]
Mass Fraction Unburned Non Fuelg/gP4_cyl#_ubNonFuel [ N , M , K ]
Mass Fraction Fuelg/gP4_cyl#_fuel [ N , M , K ]
Mass Fraction Burned Fuelg/gP4_cyl#_burned [ N , M , K ]
Mass Flow Ratekg/sP4_cyl#_mdotAir [ N , M , K ]
Table A2. The sensor list pertaining to the exhaust conditions of the cylinders, i.e., the exhaust manifold, the inlet conditions to the turbine, the outlet conditions of the turbine, the resulting conditions of the crank case, the turbo charger conditions, and the engine block conditions.
SensorDescriptionSignal NameUnitsVariable NameSize
P5Exhaust Manifold ConditionsPressurekPaP5_pres [ N , M , K ]
TemperatureKP5_temp [ N , M , K ]
Gamma kJ kg K / kJ kg K P5_gamma [ N , M , K ]
Mass Fraction Unburned Airg/gP5_ubAir [ N , M , K ]
Mass Fraction Unburned Vapor Fuelg/gP5_ubVapFuel [ N , M , K ]
Mass Fraction Unburned Liquid Fuelg/gP5_ubLiqFuel [ N , M , K ]
Mass Fraction Unburned Otherg/gP5_ubOther [ N , M , K ]
Mass Fraction Burned Gasg/gP5_bGas [ N , M , K ]
EnthalpykJ/kgP5_enth [ N , M , K ]
Mass Flow Ratekg/sP5_mdot [ N , M , K ]
P6Exhaust OutletPressurekPaP6_pres [ N , M , K ]
TemperatureKP6_temp [ N , M , K ]
Gamma kJ kg K / kJ kg K P6_gamma [ N , M , K ]
Mass Fraction Unburned Airg/gP6_ubAir [ N , M , K ]
Mass Fraction Unburned Vapor Fuelg/gP6_ubVapFuel [ N , M , K ]
Mass Fraction Unburned Liquid Fuelg/gP6_ubLiqFuel [ N , M , K ]
Mass Fraction Unburned Otherg/gP6_ubOther [ N , M , K ]
Mass Fraction Burned Gasg/gP6_bGas [ N , M , K ]
EnthalpykJ/kgP6_enth [ N , M , K ]
Mass Flow Ratekg/sP6_mdot [ N , M , K ]
P7Shaft ConditionsOutput Brake TorqueNmP7_torqBrake [ N , M , K ]
Output Indicated TorqueNmP7_torqIndicated [ N , M , K ]
Output Brake and Crank TorqueNmP7_torqBrakePlusCrank [ N , M , K ]
Engine SpeedNmP7_rpm [ N , M , K ]
P8Turbo ChargerTurbo Charger Shaft TorqueNmP8_torq [ N , M , K ]
Turbo Charger Shaft SpeedrpmP8_rpm [ N , M , K ]
P9Engine BlockWall TemperatureKwallTemp [ M , K ]

Appendix B

A representative figure demonstrating the resultant of the crank angle resolved model is provided in Figure A1. Additional figures have also been provided which visually highlights a small subset of the data contained within the lookup tables used within the crank angle resolved model.
Figure A1. Crank resolved engine speed, in-cylinder pressure and temperature speed trace at 3600 rpm.
Energies 15 08035 g0a1
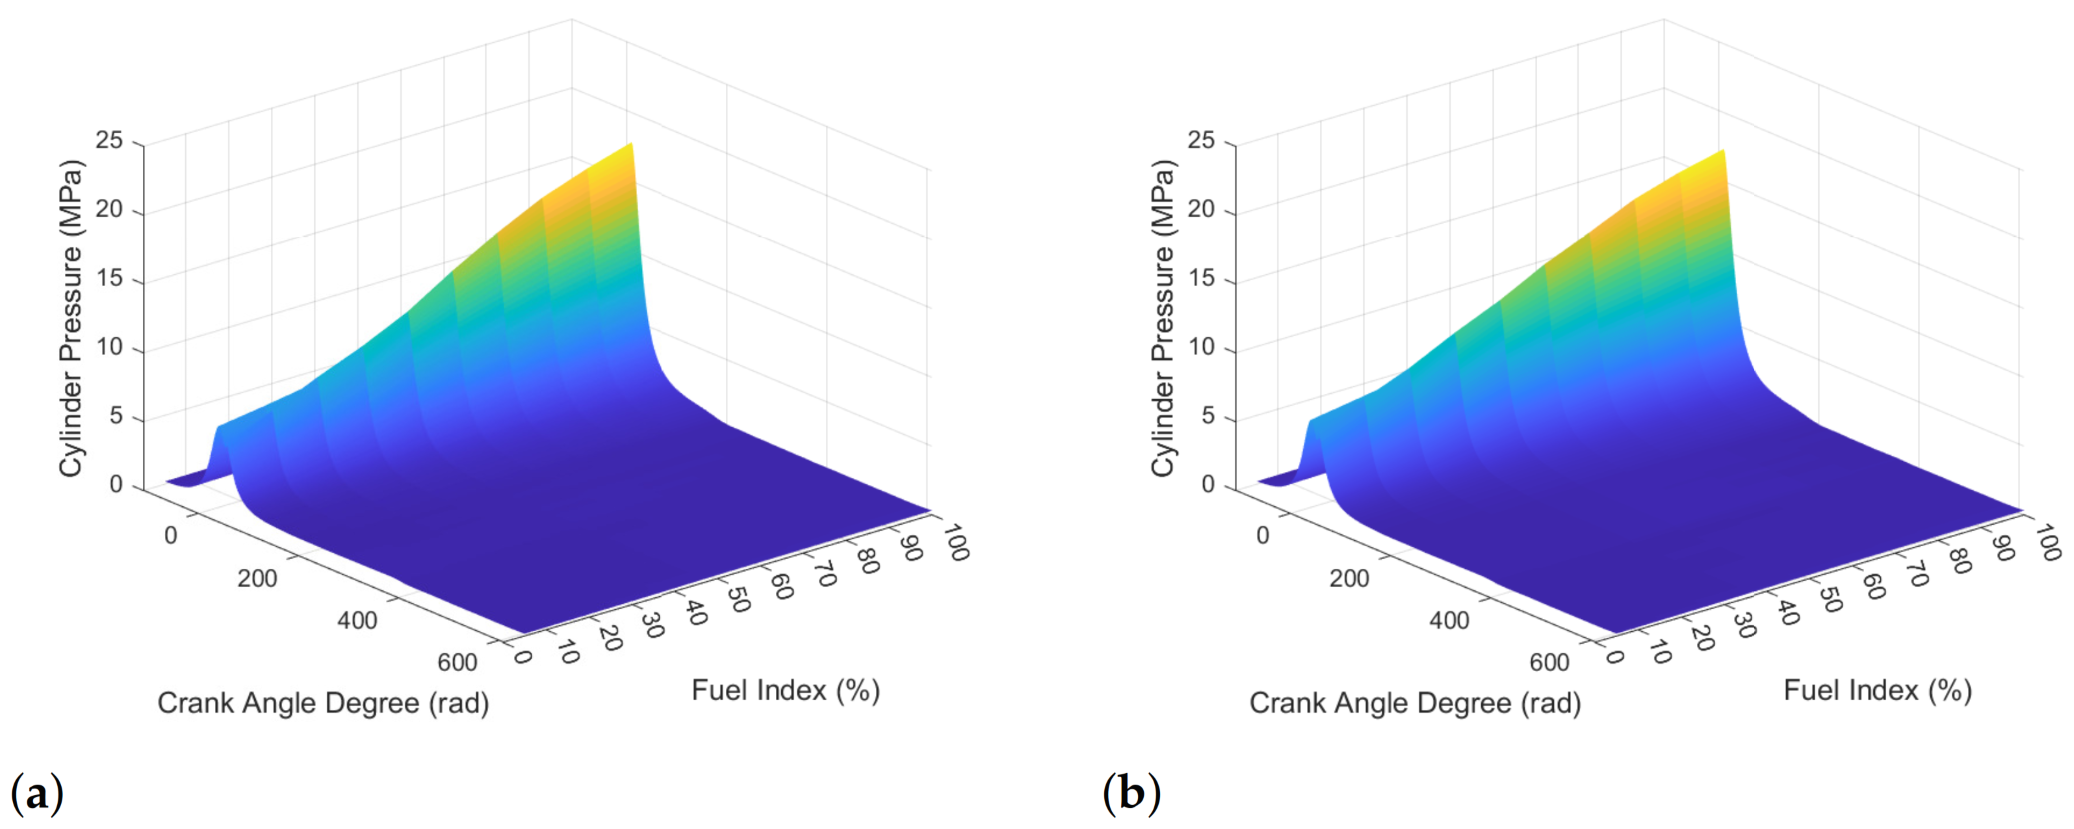
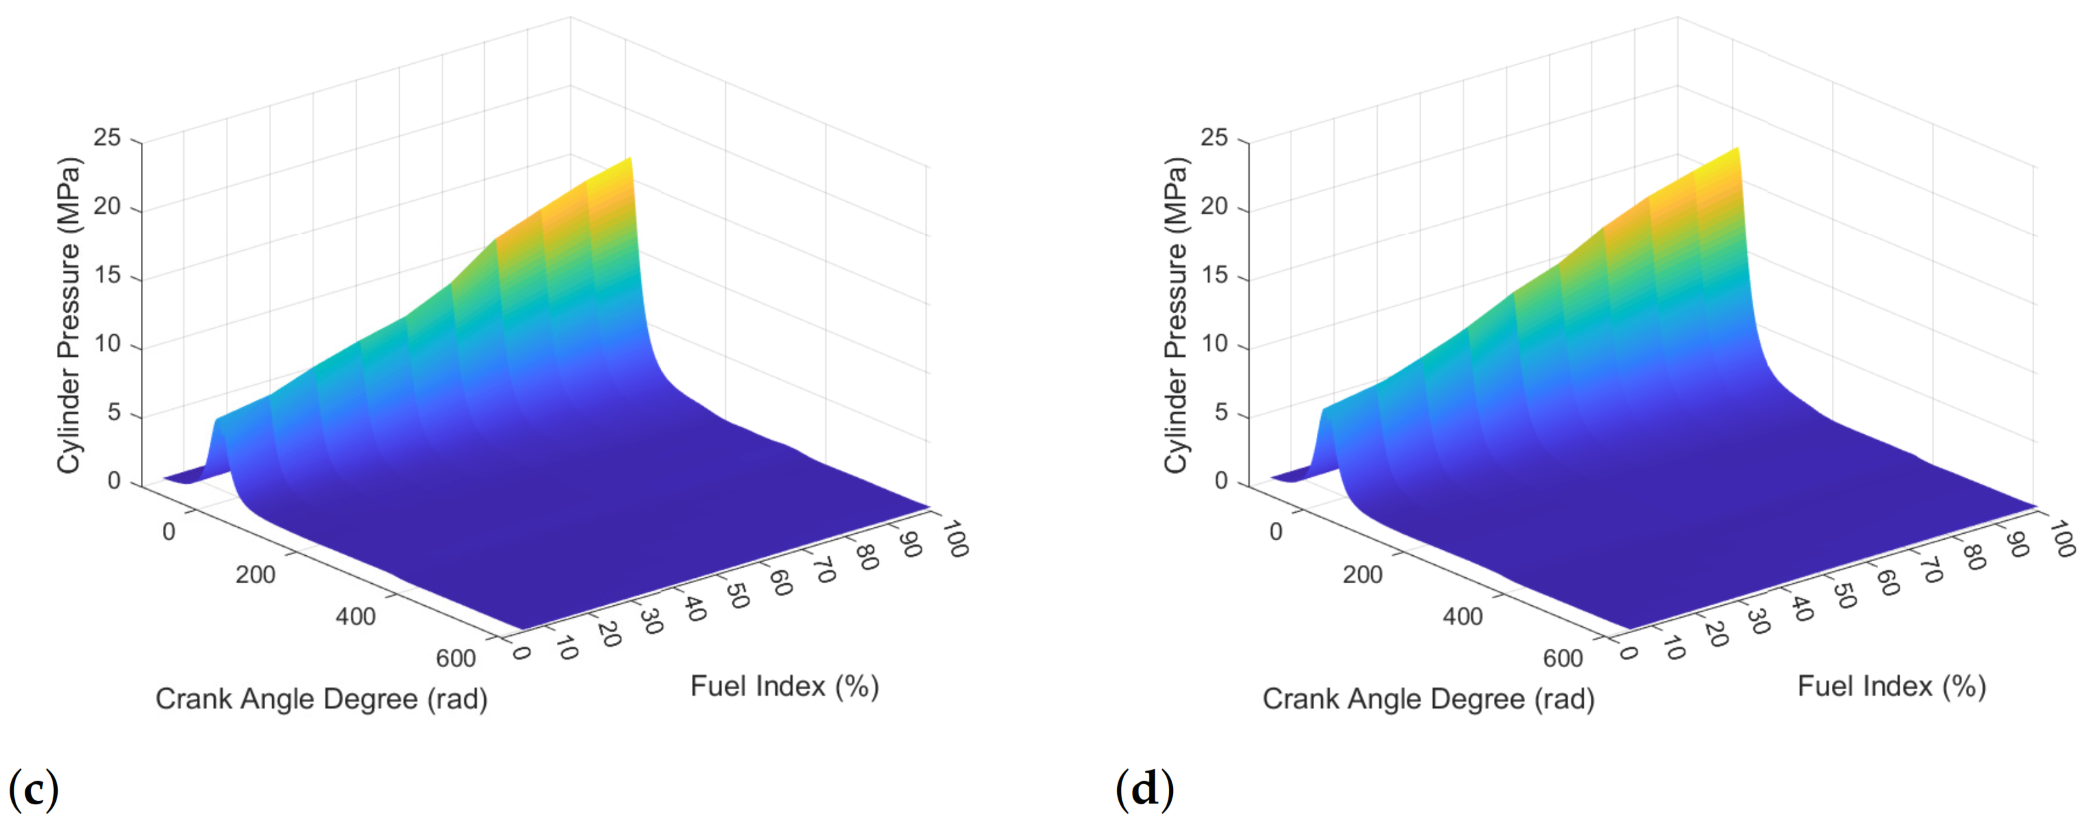
Figure A2. The three-dimensional pressure map for the first cylinder of the engine at 2200 rpm and various crank angles and fuel indices for a: (a) 3-Cylinder 85 HP engine, (b) 4-Cylinder 125 HP engine, (c) 6-Cylinder 275 HP engine, and (d) 8-Cylinder 475 HP engine.
Energies 15 08035 g0a2aEnergies 15 08035 g0a2b
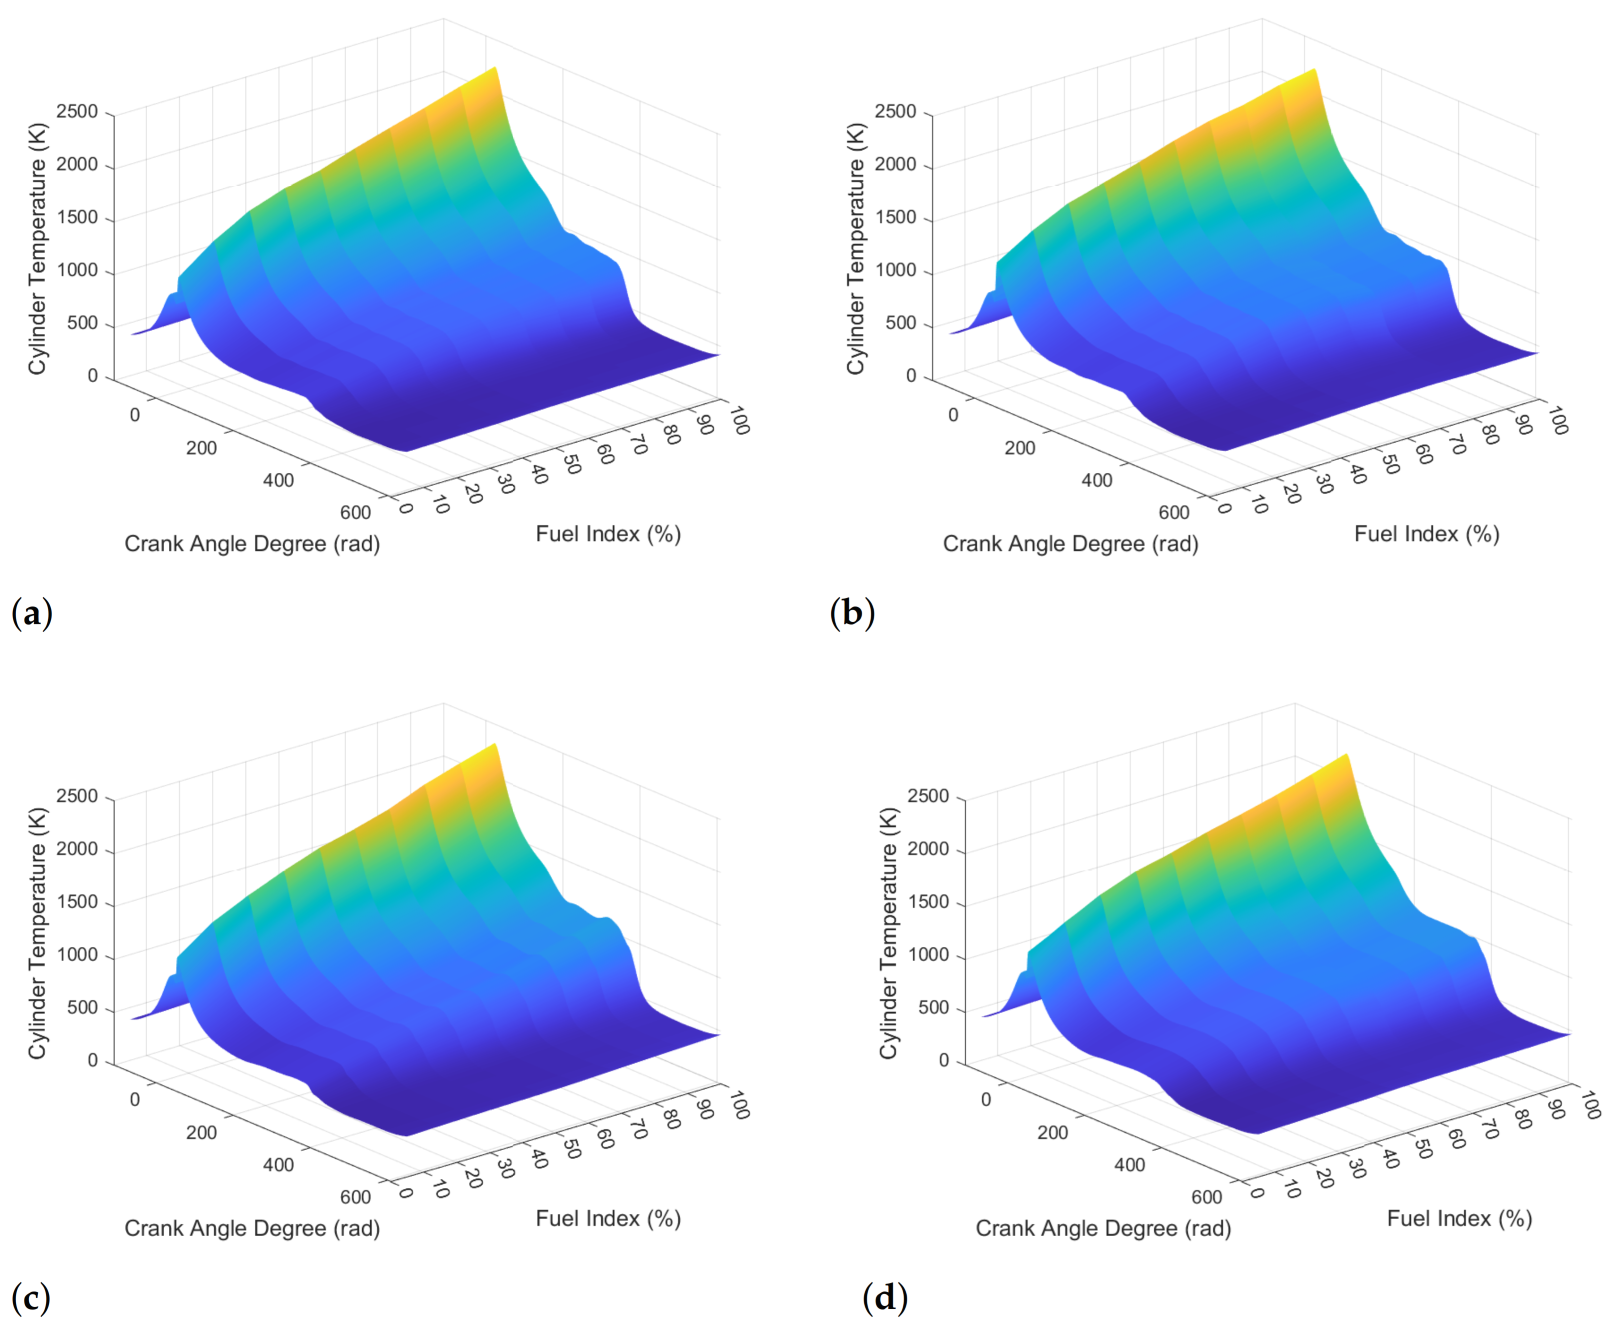
Figure A3. The three-dimensional temperature map for the first cylinder of the engine at 2200 rpm and various crank angles and fuel indices for a: (a) 3-Cylinder 85 HP engine, (b) 4-Cylinder 125 HP engine, (c) 6-Cylinder 275 HP engine, and (d) 8-Cylinder 475 HP engine.
Energies 15 08035 g0a3
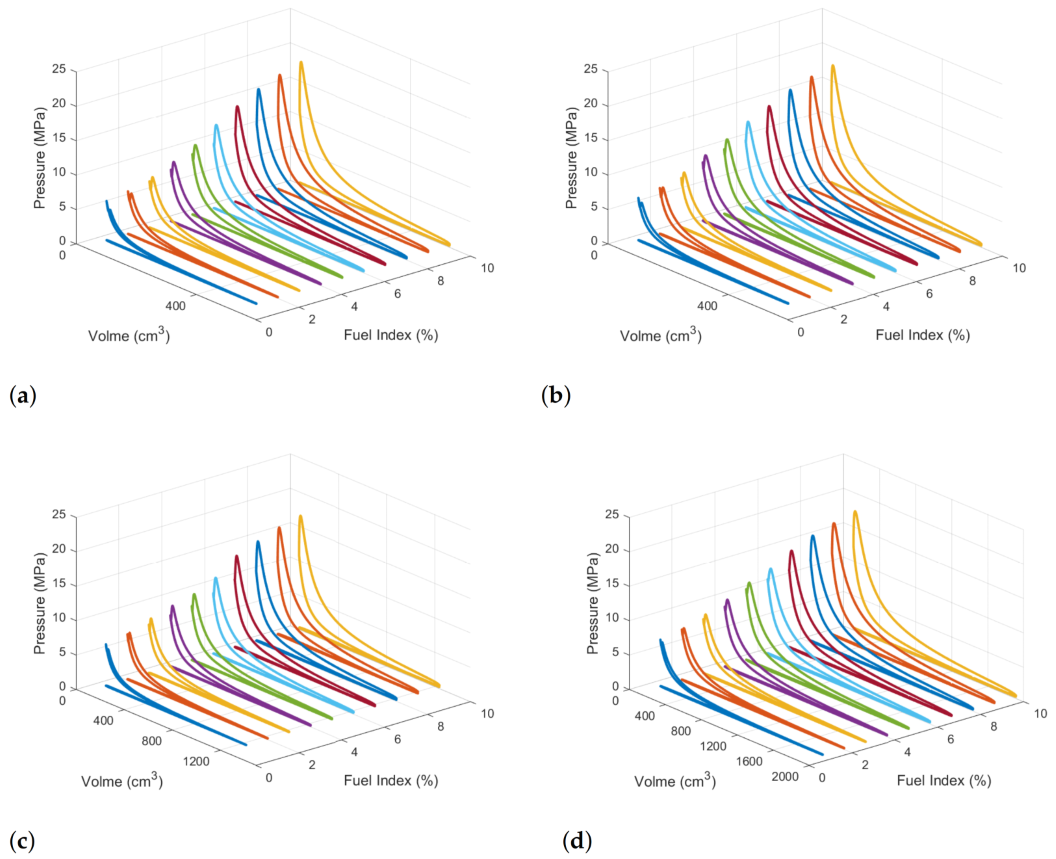
Figure A4. The three-dimensional Diesel Cycle for the first cylinder of the engine at 2200 rpm and various crank angles and fuel indices for a: (a) 3-Cylinder 85 HP engine, (b) 4-Cylinder 125 HP engine, (c) 6-Cylinder 275 HP engine, and (d) 8-Cylinder 475 HP engine.
Energies 15 08035 g0a4
Brake torque, i.e., the torque generated by the motion of the piston as a result of the combustion processes of the engine can then be modeled using Equation (A1). This equation can be used to approximate brake torque of the engine. This equation does not include any inertial based terms, thus when used it is likely to over-approximate the brake torque. To account for this, we amended Equation (A1) forming Equation (A2) to include a scaling factor α and a bias β .
τ b r a k e = i = 1 N c y l Φ c y l i L a π L b 2 N c y l sin ( θ ) + 2 L a L l sin ( θ ) 2 1 L a 2 L l 2 s i n ( θ ) 2
The scale factor is computed by first computing the amplitude of the brake torque as defined in the three-dimensional matrices. Equation (A1) is then used to compute the estimated brake torque. The amplitude of the estimated brake torque is then observed, using the two amplitudes, a scale factor was computed which resulted in both brake torque trajectories having the same relative amplitude. There is likely to be a bias between the two trajectories; the initial point of each brake torque trajectory is then used to compute the bias. By applying the scale factor and bias in this way to Equation (A2), the in-cylinder pressure trajectories can be used directly to compute brake torque. In a perfect scenario where the neural networks perfectly replicated the in-cylinder conditions, the neural network should produce identically equal brake torque estimations to those observed within the three-dimensional matrices using the scaling and bias correction factors, computed from analysis of the pseudo-dynamometer engine data. Equation (A2) was used to compute brake torque for the Multi-Point Operational Conditions two degree of freedom (2 DOF) neural network responses.
τ b r a k e = α · i = 1 N c y l Φ c y l i L a π L b 2 N c y l sin ( θ ) + 2 L a L l sin ( θ ) 2 1 L a 2 L l 2 s i n ( θ ) 2 + β

Appendix C

Additional information pertaining to the selected AI/ML architecture and software package used to develop and deploy the AI/ML are provided within the subsequent subsections of this appendix.

Appendix C.1. Artificial Neural Network

Eight separate Artificial Neural Network (ANNs) were developed for this research effort, more detailed information regarding the architecture of each ANN is provided in Figure A5 and Figure A6, information regarding the configuration of each ANN is then provided in Table A3.
The AI/algorithms were developed using MATLAB/Simulink’s Deep Learning Toolbox, specifically using Neural Network Fitting application in which two-layered feed-forward neural networks can be generated. We used the application to generate a comprehensive training script to reduce training workflow. Data as defined in pseudo-dynamometer datasets was imported, concatenated, normalized, and used to develop and evaluate the AI/ML algorithms.
Figure A5. Artificial Neural Network Configuration 1.
Energies 15 08035 g0a5
Figure A6. Artificial Neural Network Configuration 2.
Energies 15 08035 g0a6
Table A3. The selected neural network configuration parameters used to construct the ANNs.
Input Feature ListRecurrent Feature ListTarget Feature ListHidden Layer Size
θ ( t 40 ) , θ ( t 35 ) , θ ( t 30 ) , θ ( t 25 ) , θ ( t 20 ) , P c y l , ω r a t e d , L b , N c y l , T a P4_cyl1_burned [ 15 25 15 10 ]
θ ( t 15 ) , θ ( t 10 ) , θ ( t 9 ) , θ ( t 8 ) , θ ( t 7 ) , P4_cyl1_fuel [ 15 25 15 10 ]
θ ( t 6 ) , θ ( t 5 ) , θ ( t 4 ) , θ ( t 3 ) , θ ( t 2 ) , P4_cyl1_gamma [ 15 25 15 10 ]
θ ( t 1 ) , θ ( t ) , θ ( t + 1 ) , θ ( t + 2 ) , θ ( t + 3 ) , P4_cyl1_mdotAir [ 15 25 15 10 ]
θ ( t + 4 ) , θ ( t + 5 ) , θ ( t + 6 ) , θ ( t + 7 ) , θ ( t + 8 ) , P4_cyl1_mdotFuel [ 15 25 15 10 ]
θ ( t + 9 ) , θ ( t + 10 ) , θ ( t + 15 ) , θ ( t + 20 ) , P4_cyl1_pres [ 25 ]
θ ( t + 25 ) , θ ( t + 30 ) , θ ( t + 35 ) , θ ( t + 40 ) , η , ω e , P4_cyl1_temp [ 15 25 15 10 ]
T a , P a , V ( θ ) , A ( θ ) , P c y l , P r a t e d , ω r a t e d , N , V d i s , L b P4_cyl1_ubNonFuel [ 15 25 15 10 ]

Appendix C.2. Convolutional Neural Network

Eight separate Convolutional Neural Networks (CNNs) were developed for this research effort, more detailed information regarding the architecture of each ANN is provided in Figure A7, information regarding the configuration of each ANN is then provided in Table A4.
The AI/algorithms were developed using Python’s tensor flow package. Data as defined in pseudo-dynamometer datasets was imported into MATLAB/Simulink, concatenated, normalized, and then exported to Microsoft Excel document files. Anaconda/Spyder was then used to develop a custom Python script to import data contained in the Excel document files and train the AI/ML. A secondary script was then created to simulate the trained AI/ML, and then export a similar Excel document file which could be imported into MATLAB/Simulink.
Figure A7. Convolutional Neural Network Configuration.
Energies 15 08035 g0a7
Table A4. The selected neural network configuration parameters used to construct the CNNs.
Input Feature ListRecurrent Feature ListTarget Feature ListArchitecture
θ ( t ) , η , P c y l , ω r a t e d , L b , N c y l , T a P4_cyl1_burned U x

Conv 1 D ( 10 , kernel_size = 5, strides = 2, activation = relu, padding = same)

Conv 1 D ( 20 , kernel_size = 5, strides = 2, activation = relu, padding = same)

Conv 1 D ( 30 , kernel_size = 5, strides = 2, activation = relu, padding = same)

Global Averaging Pool

Dense

Linear Activation Layer

Y x
ω e , T a P4_cyl1_fuel
P a , V ( θ ) , P4_cyl1_gamma
A ( θ ) , P c y l , P4_cyl1_mdotAir
P r a t e d , P4_cyl1_mdotFuel
ω r a t e d , P4_cyl1_pres
N , V d i s , P4_cyl1_temp
L b P4_cyl1_ubNonFuel

Appendix C.3. Kth Nearest Neighbor Classifier
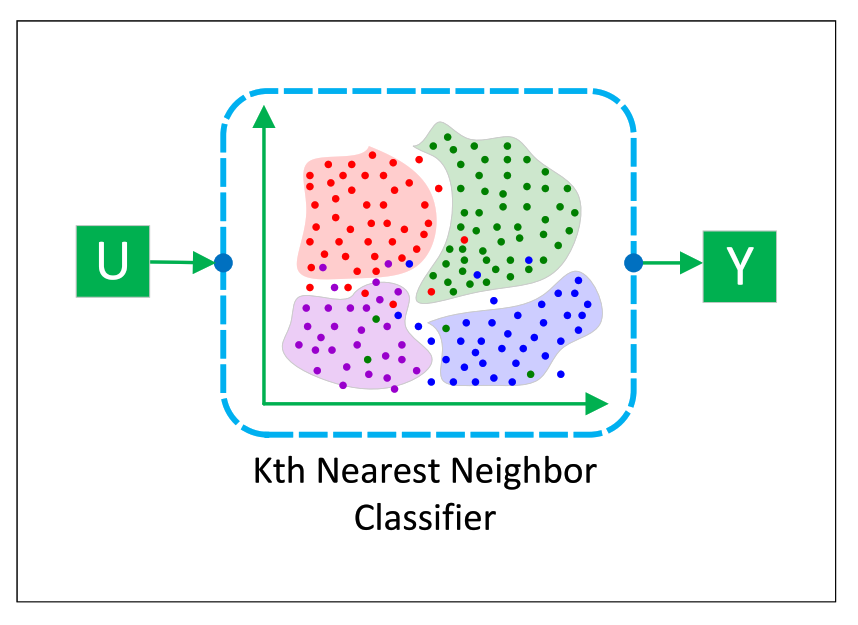
Eight separate Kth Nearest Neighbor (KNN) Classifiers were developed for this research effort, more detailed information regarding the architecture of each ANN is provided in Figure A8, information regarding the configuration of each ANN is then provided in Table A5.
The AI/algorithms were developed using MATLAB/Simulink’s Statistics and Machine Learning Toolbox. As was done for the ANN or CNN, data as defined in pseudo-dynamometer datasets was imported into MATLAB/Simulink, concatenated, normalized. Prior to training the network, the normalized target features were discretized into between 50 and 200 unique data categories or labels. Once trained the network will identify the category or label with the highest probability of occurring. The KNN also outputs the probability of the other categories or labels occur which enables the heat map response of the KNN to be observed.
Figure A8. Kth Nearest Neighbor Classifier Configuration.
Energies 15 08035 g0a8
Table A5. The selected neural network configuration parameters used to construct the KNNs.
Input Feature ListRecurrent Feature ListTarget Feature ListNumber of Nearest Neighbors
θ ( t 40 ) , θ ( t 35 ) , θ ( t 30 ) , θ ( t 25 ) , θ ( t 20 ) , P c y l , ω r a t e d , L b , N, T a P4_cyl1_burned150
θ ( t 15 ) , θ ( t 10 ) , θ ( t 9 ) , θ ( t 8 ) , θ ( t 7 ) , P4_cyl1_fuel75
θ ( t 6 ) , θ ( t 5 ) , θ ( t 4 ) , θ ( t 3 ) , θ ( t 2 ) , P4_cyl1_gamma5
θ ( t 1 ) , θ ( t ) , θ ( t + 1 ) , θ ( t + 2 ) , θ ( t + 3 ) , P4_cyl1_mdotAir25
θ ( t + 4 ) , θ ( t + 5 ) , θ ( t + 6 ) , θ ( t + 7 ) , θ ( t + 8 ) , P4_cyl1_mdotFuel15
θ ( t + 9 ) , θ ( t + 10 ) , θ ( t + 15 ) , θ ( t + 20 ) , P4_cyl1_pres150
θ ( t + 25 ) , θ ( t + 30 ) , θ ( t + 35 ) , θ ( t + 40 ) , η , ω e , P4_cyl1_temp15
T a , P a , V ( θ ) , A ( θ ) , P c y l , P r a t e d , ω r a t e d , N c y l , V d i s , L b P4_cyl1_ubNonFuel150

Appendix D

This appendix contains the complete list of results collected from the Single-Point Operational Conditions experiment or the the Multi-Point Operational Conditions experiment for completeness of the study.

Appendix D.1. Additional Single-Point Operational Conditions Figures

The complete set of neural network responses for each of the eight target features for each of the four engines as applied to each individual engine cylinder in regards to the single-point operational conditions have been provided in Figure A9Figure A12.
Figure A9. The in-cylinder mass fraction of burned fuel traces for the: (a) 3-cylinder, (b) 4-cylinder, (c) 6-cylinder, and (d) 8-cylinder engine.
Energies 15 08035 g0a9aEnergies 15 08035 g0a9b
Figure A10. The mass fraction of fuel traces for the: (a) 3-cylinder, (b) 4-cylinder, (c) 6-cylinder, and (d) 8-cylinder engine.
Energies 15 08035 g0a10
Figure A11. The in-cylinder ratio of specific heat traces for the: (a) 3-cylinder, (b) 4-cylinder, (c) 6-cylinder, and (d) 8-cylinder engine.
Energies 15 08035 g0a11
Figure A12. The mass fraction of the unburned nonfuel traces for the: (a) 3-cylinder, (b) 4-cylinder, (c) 6-cylinder, and (d) 8-cylinder engine.
Energies 15 08035 g0a12aEnergies 15 08035 g0a12b
Figure A13. The in-cylinder mass flow rate of air probability map for the: (a) 3-cylinder, (b) 4-cylinder, (c) 6-cylinder, and (d) 8-cylinder engine.
Energies 15 08035 g0a13
Figure A14. The in-cylinder mass flow rate of fuel probability map for the: (a) 3-cylinder, (b) 4-cylinder, (c) 6-cylinder, and (d) 8-cylinder engine.
Energies 15 08035 g0a14
Figure A15. The in-cylinder mass fraction of fuel probability map for the: (a) 3-cylinder, (b) 4-cylinder, (c) 6-cylinder, and (d) 8-cylinder engine.
Energies 15 08035 g0a15aEnergies 15 08035 g0a15b
Figure A16. The in-cylinder mass fraction of burned fuel probability map for the: (a) 3-cylinder, (b) 4-cylinder, (c) 6-cylinder, and (d) 8-cylinder engine.
Energies 15 08035 g0a16
Figure A17. The in-cylinder mass fraction of the unburned nonfuel probability map for the: (a) 3-cylinder, (b) 4-cylinder, (c) 6-cylinder, and (d) 8-cylinder engine.
Energies 15 08035 g0a17
Figure A18. The in-cylinder mass fraction of the ratio of specific heat probability map for the: (a) 3-cylinder, (b) 4-cylinder, (c) 6-cylinder, and (d) 8-cylinder engine.
Energies 15 08035 g0a18aEnergies 15 08035 g0a18b

Appendix D.2. Additional Multi-Point Operational Conditions Figures
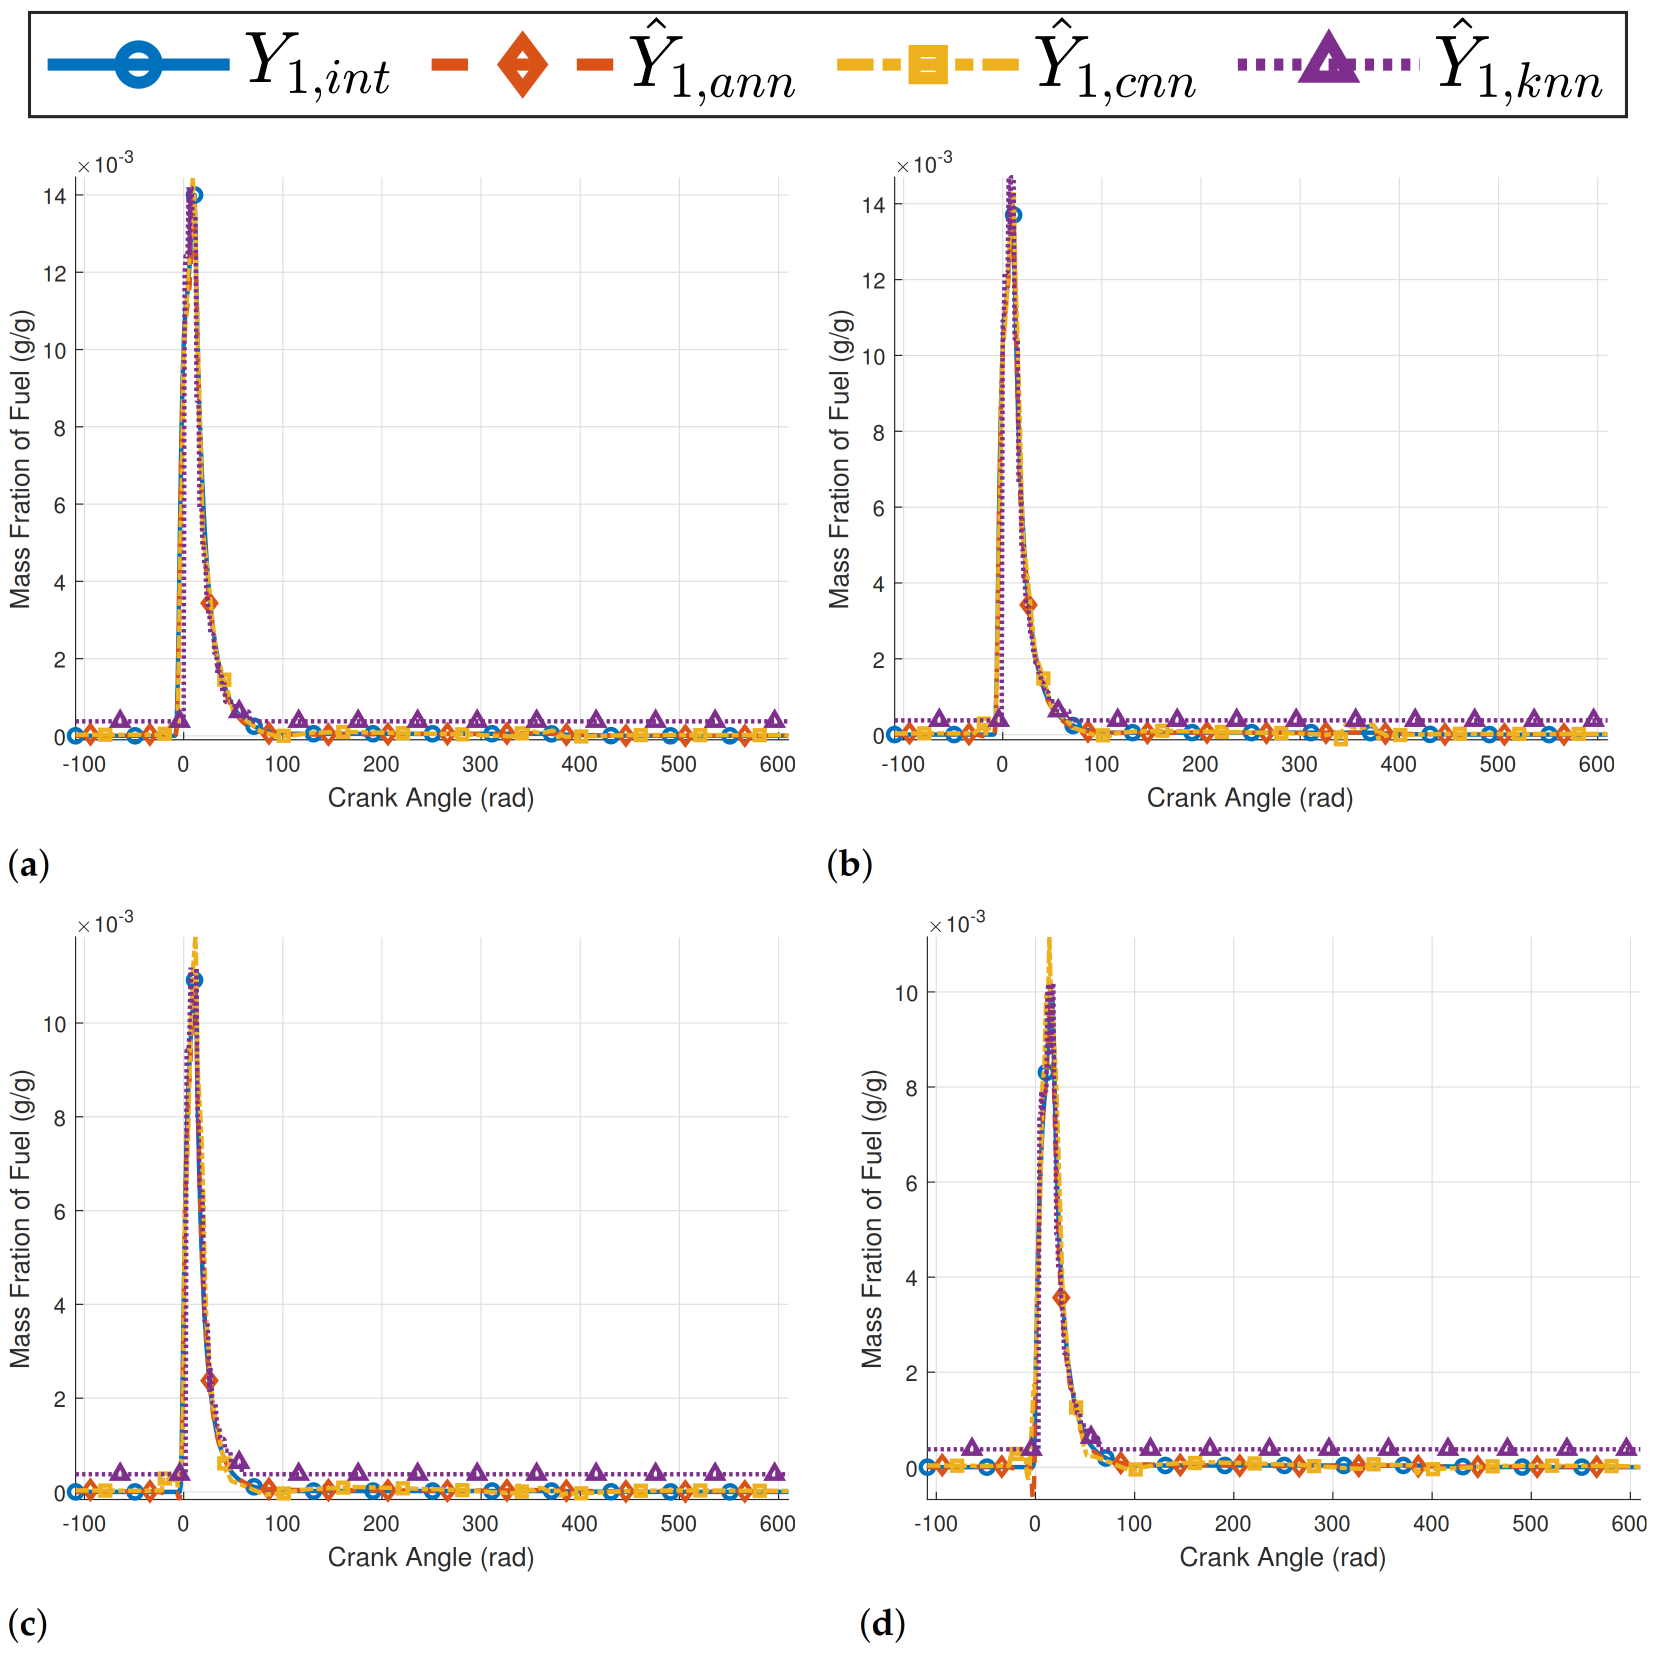
The main body of the technical document highlighted the multi-point operational conditions experiment results related to the 3-cylinder and 6-cylinder engine. Thus, the 4-cylinder and 8-cylinder engine multi-point operational conditions figures were included within this section of the appendix for reference.
Figure A19. The in-cylinder pressure response for the 4-cylinder engine under varying neural networks and degrees of freedom: (a) look-up table, (b) 1 DOF ANN, (c) 2 DOF ANN, (d) 1 DOF CNN, (e) 2 DOF CNN, (f) 1 DOF KNN, and (g) 2 DOF KNN.
Energies 15 08035 g0a19aEnergies 15 08035 g0a19b
Figure A20. The in-cylinder temperature response for the 4-cylinder engine under varying neural networks and degrees of freedom: (a) look-up table, (b) 1 DOF ANN, (c) 2 DOF ANN, (d) 1 DOF CNN, (e) 2 DOF CNN, (f) 1 DOF KNN, and (g) 2 DOF KNN.
Energies 15 08035 g0a20aEnergies 15 08035 g0a20b
Figure A21. The in-cylinder pressure response for the 8-cylinder engine under varying neural networks and degrees of freedom: (a) look-up table, (b) 1 DOF ANN, (c) 2 DOF ANN, (d) 1 DOF CNN, (e) 2 DOF CNN, (f) 1 DOF KNN, and (g) 2 DOF KNN.
Energies 15 08035 g0a21aEnergies 15 08035 g0a21b
Figure A22. The in-cylinder temperature response for the 8-cylinder engine under varying neural networks and degrees of freedom: (a) look-up table, (b) 1 DOF ANN, (c) 2 DOF ANN, (d) 1 DOF CNN, (e) 2 DOF CNN, (f) 1 DOF KNN, and (g) 2 DOF KNN.
Energies 15 08035 g0a22aEnergies 15 08035 g0a22b

References

  1. Bourhis, G.; Leduc, P. Energy and exergy balances for modern diesel and gasoline engines. Oil Gas Sci. Technol.—Revue l’Institut Français du Pétrole 2010, 65, 39–46. [Google Scholar] [CrossRef] [Green Version]
  2. Reed, R.; Marks, R.J., II. Neural Smithing: Supervised Learning in Feedforward Artificial Neural Networks; MIT Press: Cambridge, MA, USA, 1999. [Google Scholar]
  3. Billings, S.A. Nonlinear System Identification: NARMAX Methods in the Time, Frequency, and Spatio-Temporal Domains; John Wiley & Sons: Hoboken, NJ, USA, 2013. [Google Scholar]
  4. Medsker, L.R.; Jain, L. Recurrent neural networks. Des. Appl. 2001, 5, 64–67. [Google Scholar]
  5. Yue, B.; Fu, J.; Liang, J. Residual recurrent neural networks for learning sequential representations. Information 2018, 9, 56. [Google Scholar] [CrossRef] [Green Version]
  6. Kim, P. Convolutional neural network. In MATLAB Deep Learning; Apress: Berkeley, CA, USA, 2017; pp. 121–147. [Google Scholar]
  7. Riedmiller, M.; Lernen, A. Multi Layer Perceptron; Machine Learning Lab Special Lecture; University of Freiburg: Freiburg im Breisgau, Germany, 2014; pp. 7–24. [Google Scholar]
  8. Du, G.; Zou, Y.; Zhang, X.; Liu, T.; Wu, J.; He, D. Deep reinforcement learning based energy management for a hybrid electric vehicle. Energy 2020, 201, 117591. [Google Scholar] [CrossRef]
  9. Katselis, D. Lecture 10: Q-Learning, Function Approximation, Temporal Difference Learning; University of Illinois at Urbana-Champaign: Champaign, IL, USA, 2019. [Google Scholar]
  10. Lian, R.; Tan, H.; Peng, J.; Li, Q.; Wu, Y. Cross-Type Transfer for Deep Reinforcement Learning Based Hybrid Electric Vehicle Energy Management. IEEE Trans. Veh. Technol. 2020, 69, 8367–8380. [Google Scholar] [CrossRef]
  11. Natsheh, E.M. Hybrid Power Systems Energy Management Based on Artificial Intelligence. Ph.D. Thesis, Manchester Metropolitan University, Manchester, UK, 2013. [Google Scholar]
  12. Li, Y.; He, H.; Peng, J.; Wang, H. Deep Reinforcement Learning-Based Energy Management for a Series Hybrid Electric Vehicle Enabled by History Cumulative Trip Information. IEEE Trans. Veh. Technol. 2019, 68, 7416–7430. [Google Scholar] [CrossRef]
  13. Li, Y.; He, H.; Peng, J.; Wu, J. Energy management strategy for a series hybrid electric vehicle using improved deep Q-network learning algorithm with prioritized replay. DEStech Trans. Environ. Energy Earth Sci. 2018, 978, 1–6. [Google Scholar] [CrossRef]
  14. Liu, T.; Hu, X.; Li, S.E.; Cao, D. Reinforcement Learning Optimized Look-Ahead Energy Management of a Parallel Hybrid Electric Vehicle. IEEE/ASME Trans. Mechatron. 2017, 22, 1497–1507. [Google Scholar] [CrossRef]
  15. Hu, X.; Liu, T.; Qi, X.; Barth, M. Reinforcement Learning for Hybrid and Plug-In Hybrid Electric Vehicle Energy Management: Recent Advances and Prospects. IEEE Ind. Electron. Mag. 2019, 13, 16–25. [Google Scholar] [CrossRef] [Green Version]
  16. Gu, B.; Rizzoni, G. An adaptive algorithm for hybrid electric vehicle energy management based on driving pattern recognition. In Proceedings of the ASME International Mechanical Engineering Congress and Exposition, Chicago, IL, USA, 5–10 November 2006; Volume 47683, pp. 249–258. [Google Scholar]
  17. Kamal, E.; Adouane, L. Intelligent energy management strategy based on artificial neural fuzzy for hybrid vehicle. IEEE Trans. Intell. Veh. 2017, 3, 112–125. [Google Scholar] [CrossRef]
  18. Moreno, J.; Ortúzar, M.E.; Dixon, J.W. Energy-management system for a hybrid electric vehicle, using ultracapacitors and neural networks. IEEE Trans. Ind. Electron. 2006, 53, 614–623. [Google Scholar] [CrossRef]
  19. Zhang, Q.; Wang, L.; Li, G.; Liu, Y. A real-time energy management control strategy for battery and supercapacitor hybrid energy storage systems of pure electric vehicles. J. Energy Storage 2020, 31, 101721. [Google Scholar] [CrossRef]
  20. Jane, R.S.; James, C.; Kim, T. Using AI-ML to develop energy and exergy flow characterizations for multi-domain operations. In Proceedings of the Artificial Intelligence and Machine Learning for Multi-Domain Operations Applications III. International Society for Optics and Photonics, Online, 12–17 April 2021; Volume 11746, p. 1174628. [Google Scholar]
  21. Hu, X.; Li, S.E.; Yang, Y. Advanced machine learning approach for lithium-ion battery state estimation in electric vehicles. IEEE Trans. Transp. Electrif. 2015, 2, 140–149. [Google Scholar] [CrossRef]
  22. Chiş, A.; Lundén, J.; Koivunen, V. Reinforcement learning-based plug-in electric vehicle charging with forecasted price. IEEE Trans. Veh. Technol. 2016, 66, 3674–3684. [Google Scholar]
  23. Garg, P.; Silvas, E.; Willems, F. Potential of Machine Learning Methods for Robust Performance and Efficient Engine Control Development. IFAC-PapersOnLine 2021, 54, 189–195. [Google Scholar] [CrossRef]
  24. Gamma Technologies, LLC. GT-POWER Engine Simulation Software. Available online: https://www.gtisoft.com/ (accessed on 2 February 2022).
  25. Crewson, P. Applied statistics handbook. AcaStat Softw. 2006, 1, 103–123. [Google Scholar]
  26. Evans, J.H. Dimensional analysis and the Buckingham Pi theorem. Am. J. Phys. 1972, 40, 1815–1822. [Google Scholar] [CrossRef]
  27. Jane, R.; Kim, T.Y.; Glass, E.; Mossman, E.; James, C. Tailoring Mission Effectiveness and Efficiency of a Ground Vehicle Using Exergy-Based Model Predictive Control (MPC). Energies 2021, 14, 6049. [Google Scholar] [CrossRef]
  28. Wikipedia. Posterior Probability. 2021. Available online: https://en.wikipedia.org (accessed on 2 February 2022).
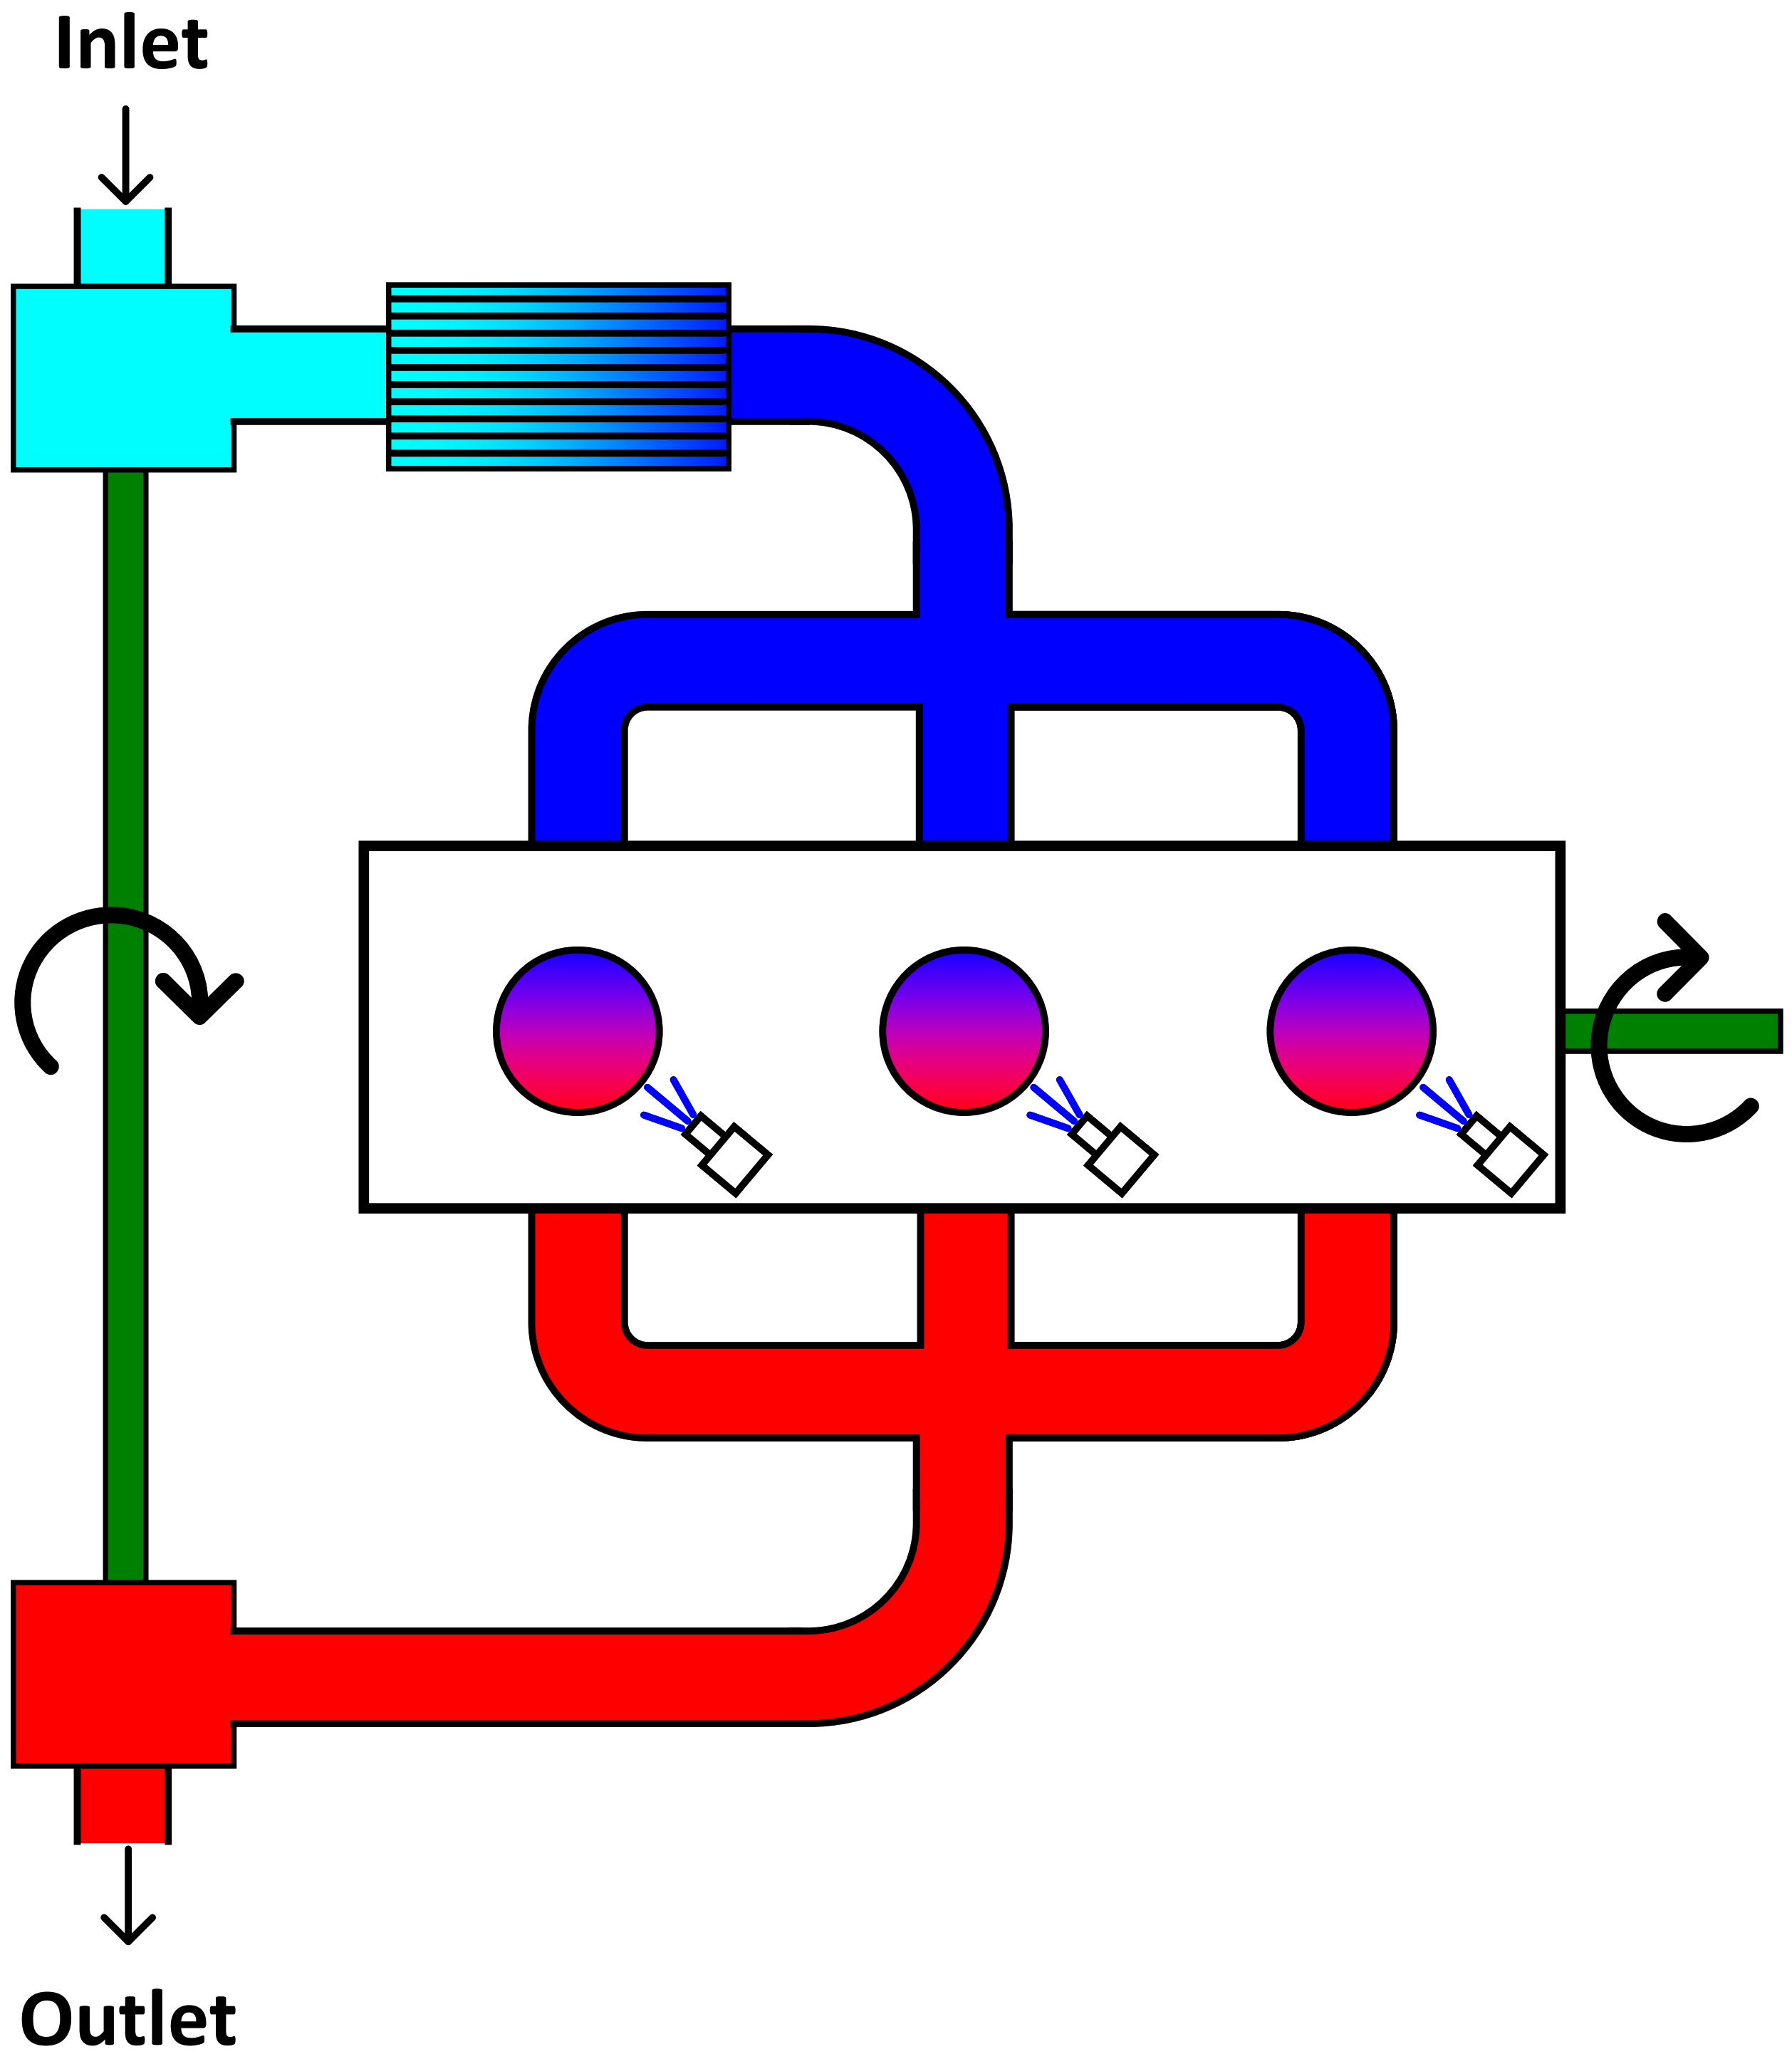
Figure 1. Simplified CI engine fluid map of the 4-cylinder 125 HP engine variant.
Energies 15 08035 g001
Figure 2. In-cylinder pressure target features: (a) pressure trace for each of the four engines and (b) pressure trace for each of the four engine variants at 4000 rpm and 100 % fuel index.
Energies 15 08035 g002
Figure 3. In-cylinder temperature target features: (a) temperature trace for each of the four engines and (b) temperature trace for each of the four engine variants at 4000 rpm and 100 % fuel index.
Energies 15 08035 g003
Figure 4. The in-cylinder ratio of specific heat target features: (a) ratio of specific heat trace for each of the four engines and (b) ratio of specific heat trace for each of the four engine variants at 4000 rpm and 100 % fuel index.
Energies 15 08035 g004
Figure 5. The in-cylinder mass fraction of fuel target features: (a) mass fraction of fuel trace for each of the four engines and (b) mass fraction of fuel trace for each of the four engine variants at 4000 rpm and 100 % fuel index.
Energies 15 08035 g005
Figure 6. The in-cylinder mass fraction of the unburned nonfuel target features: (a) mass fraction of the unburned nonfuel for each of the four engines and (b) mass fraction of the unburned nonfuel for each of the four engine variants at 4000 rpm and 100 % fuel index.
Energies 15 08035 g006
Figure 7. The in-cylinder mass fraction of burned fuel target features: (a) mass fraction of burned fuel trace for each of the four engines and (b) mass fraction of burned fuel for each of the four engine variants at 4000 rpm and 100 % fuel index.
Energies 15 08035 g007
Figure 8. The in-cylinder mass flow rate of fuel target features: (a) mass flow rate of fuel for each of the four engines and (b) mass flow rate of fuel for each of the four engine variants at 4000 rpm and 100 % fuel index.
Energies 15 08035 g008
Figure 9. The in-cylinder mass flow rate of air target features: (a) mass flow rate of air trace for each of the four engines and (b) mass flow rate of air for each of the four engine variants at 4000 rpm and 100 % fuel index.
Energies 15 08035 g009
Figure 10. The in-cylinder pressure traces for the: (a) 3-cylinder engine, (b) 4-cylinder engine, (c) 6-cylinder engine, and (d) 8-cylinder engine.
Energies 15 08035 g010
Figure 11. The in-cylinder temperature traces for the: (a) 3-cylinder engine, (b) 4-cylinder engine, (c) 6-cylinder engine, and (d) 8-cylinder engine.
Energies 15 08035 g011
Figure 12. The mass flow rate of air trace for the: (a) 3-cylinder engine, (b) 4-cylinder engine, (c) 6-cylinder engine, and (d) 8-cylinder engine.
Energies 15 08035 g012
Figure 13. The mass flow rate of fuel trace for the: (a) 3-cylinder engine, (b) 4-cylinder engine, (c) 6-cylinder engine, and (d) 8-cylinder engine.
Energies 15 08035 g013
Figure 14. The in-cylinder pressure probability map for the: (a) 3-cylinder engine, (b) 4-cylinder engine, (c) 6-cylinder engine, and (d) 8-cylinder engine.
Energies 15 08035 g014
Figure 15. The in-cylinder temperature probability map for the: (a) 3-cylinder engine, (b) 4-cylinder engine, (c) 6-cylinder engine, and (d) 8-cylinder engine.
Energies 15 08035 g015
Figure 16. The in-cylinder pressure response for the 3-cylinder engine with varying neural networks and degrees of freedom: (a) Look-up Table, (b) 1 DOF ANN, (c) 2 DOF ANN, (d) 1 DOF CNN, (e) 2 DOF CNN, (f) 1 DOF KNN, and (g) 2 DOF KNN.
Energies 15 08035 g016
Figure 17. The in-cylinder temperature response for the 3-cylinder engine with varying neural networks and degrees of freedom: (a) Look-up Table, (b) 1 DOF ANN, (c) 2 DOF ANN, (d) 1 DOF CNN, (e) 2 DOF CNN, (f) 1 DOF KNN, and (g) 2 DOF KNN.
Energies 15 08035 g017
Figure 18. The in-cylinder pressure response for the 6-cylinder engine with varying neural networks and degrees of freedom: (a) Look-up Table, (b) 1 DOF ANN, (c) 2 DOF ANN, (d) 1 DOF CNN, (e) 2 DOF CNN, (f) 1 DOF KNN, and (g) 2 DOF KNN.
Energies 15 08035 g018
Figure 19. The in-cylinder temperature response for the 6-cylinder engine with varying neural networks and degrees of freedom: (a) Look-up Table, (b) 1 DOF ANN, (c) 2 DOF ANN, (d) 1 DOF CNN, (e) 2 DOF CNN, (f) 1 DOF KNN, and (g) 2 DOF KNN.
Energies 15 08035 g019
Table 1. Evaluation of the neural network performance function as applied to the 3-cylinder engine. The look-up table interpolated response is used as the theoretical engine response and used to compute the mean squared error of the resulting neural network prediction. Most favorable values (smallest) are shown in green.
Mean Squared Error (MSE)
VariableANNCNNKNN
P4 _ c y l 1 _ p r e s 3.5700 × 10 2 2.0613 × 10 3 1.8283 ×   10 1
P 4 _ c y l 1 _ t e m p 3.2881 ×   10 1 4.8308 ×   10 1 1.5617 ×   10 3
P 4 _ c y l 1 _ g a m m a 5.6820 ×   10 7 2.0810 ×   10 6 4.1623 ×   10 6
P 4 _ c y l 1 _ m d o t A i r 6.2206 ×   10 6 7.1954 ×   10 5 1.9456 ×   10 4
P 4 _ c y l 1 _ m d o t F u e l 2.8999 ×   10 7 9.4247 ×   10 7 1.1196 ×   10 5
P 4 _ c y l 1 _ u b N o n F u e l 1.0925 ×   10 5 1.2275 ×   10 4 1.9477 ×   10 3
P 4 _ c y l 1 _ f u e l 8.1833 ×   10 9 2.3117 ×   10 8 5.9120 ×   10 7
P 4 _ c y l 1 _ b u r n e d 1.9412 ×   10 5 4.9126 ×   10 5 1.6713 ×   10 3
Table 2. Evaluation of the neural network performance function as applied to the 4-cylinder engine. The look-up table interpolated response is used as the theoretical engine response and used to compute the mean squared error of the resulting neural network prediction. Most favorable values (smallest) are shown in green.
Mean Squared Error (MSE)
VariableANNCNNKNN
P4 _ c y l 1 _ p r e s 4.1816 ×   10 2 1.7304 ×   10 1 1.8825 ×   10 1
P 4 _ c y l 1 _ t e m p 3.2321 ×   10 1 7.3844 ×   10 1 1.4113 ×   10 3
P 4 _ c y l 1 _ g a m m a 3.2068 ×   10 7 1.7228 ×   10 6 5.2345 ×   10 6
P 4 _ c y l 1 _ m d o t A i r 5.8979 ×   10 6 3.5265 ×   10 4 2.6663 ×   10 4
P 4 _ c y l 1 _ m d o t F u e l 3.0218 ×   10 7 2.3667 ×   10 6 1.1989 ×   10 5
P 4 _ c y l 1 _ u b N o n F u e l 6.1963 ×   10 6 5.5871 ×   10 5 1.1168 ×   10 3
P 4 _ c y l 1 _ f u e l 4.1992 ×   10 9 2.3577 ×   10 8 4.6409 ×   10 7
P 4 _ c y l 1 _ b u r n e d 9.3972 ×   10 6 3.3866 ×   10 5 1.5608 ×   10 3
Table 3. Evaluation of the neural network performance function as applied to the 6-cylinder engine. The look-up table interpolated response is used as the theoretical engine response and used to compute the mean squared error of the resulting neural network prediction. Most favorable values (smallest) are shown in green.
Mean Squared Error (MSE)
VariableANNCNNKNN
P4 _ c y l 1 _ p r e s 2.9740 ×   10 2 1.7859 ×   10 1 4.0121 ×   10 1
P 4 _ c y l 1 _ t e m p 2.8046 ×   10 1 5.7238 ×   10 1 5.9782 ×   10 2
P 4 _ c y l 1 _ g a m m a 3.2783 ×   10 7 2.8521 ×   10 6 5.1191 ×   10 6
P 4 _ c y l 1 _ m d o t A i r 8.2437 ×   10 6 4.3717 ×   10 4 4.4307 ×   10 4
P 4 _ c y l 1 _ m d o t F u e l 5.0835 ×   10 7 1.8659 ×   10 6 1.9803 ×   10 5
P 4 _ c y l 1 _ u b N o n F u e l 7.5972 ×   10 6 7.1091 ×   10 5 5.1877 ×   10 3
P 4 _ c y l 1 _ f u e l 2.0736 ×   10 9 5.3221 ×   10 8 2.6519 ×   10 7
P 4 _ c y l 1 _ b u r n e d 1.3971 ×   10 5 5.1253 ×   10 5 5.3425 ×   10 3
Table 4. Evaluation of the neural network performance function as applied to the 8-cylinder engine. The look-up table interpolated response is used as the theoretical engine response and used to compute the mean squared error of the resulting neural network prediction. Most favorable values (smallest) are shown in green.
Mean Squared Error (MSE)
VariableANNCNNKNN
P 4 _ c y l 1 _ p r e s 2.4989 ×   10 2 8.9454 ×   10 1 1.8696 ×   10 1
P4 _ c y l 1 _ t e m p 3.8406 ×   10 1 6.6977 ×   10 1 1.4447 ×   10 3
P 4 _ c y l 1 _ g a m m a 3.8753 ×   10 7 1.8690 ×   10 6 4.6453 ×   10 6
P 4 _ c y l 1 _ m d o t A i r 1.7736 ×   10 5 4.6630 ×   10 4 4.2817 ×   10 4
P 4 _ c y l 1 _ m d o t F u e l 5.5587 ×   10 7 3.2369 ×   10 6 1.8104 ×   10 5
P 4 _ c y l 1 _ u b N o n F u e l 1.3654 ×   10 5 1.2100 ×   10 4 1.6471 ×   10 3
P 4 _ c y l 1 _ f u e l 8.1720 ×   10 9 4.6813 ×   10 8 1.9948 ×   10 7
P 4 _ c y l 1 _ b u r n e d 1.2606 ×   10 5 8.1151 ×   10 5 1.9376 ×   10 3
Publisher’s Note: MDPI stays neutral with regard to jurisdictional claims in published maps and institutional affiliations.