Article

Research on Risk Assessment and Suppression Measures for Ice-Shedding on 500 kV Compact Overhead Lines

1
Electric Power Research Institute of Guizhou Power Grid Co., Ltd., Guiyang 550002, China
2
School of Electric Power, South China University of Technology, Guangzhou 510641, China
*
Author to whom correspondence should be addressed.
Energies 2022, 15(21), 8005; https://doi.org/10.3390/en15218005
Submission received: 10 October 2022 / Revised: 24 October 2022 / Accepted: 26 October 2022 / Published: 28 October 2022
(This article belongs to the Topic High Voltage Engineering)

Abstract

:
Overhead line ice-shedding causes line breakage and results in electrical faults occurring between transmission lines, which seriously affects the safe operation of the power grid. In this paper, a risk assessment method for ice-shedding on 500 kV compact overhead lines is proposed. Two ratios were used to assess the discharge risk and mechanical failure risk of a line. A 500 kV compact overhead line in southern China was taken as an example, the proposed risk assessment method was used to carry out a risk assessment of the ice-shedding line with an ice thickness of 15 mm, and the suppression effects of different spacer arrangement schemes on the ice-shedding line were analyzed. The results showed that the impact coefficient of the conductor reached 1.88, the maximum jump height of the lower phase conductor reached 22.596 m, and the interphase clearance of the conductor decreased sharply when the lower phase conductor of 500 kV case line underwent full-span ice-shedding synchronously. The ice-shedding line displayed both a discharge risk and a mechanical failure risk. When interphase spacers were installed at L/3 from both ends of the span for the upper-left phase and the lower phase, the upper-right phase, and the lower phase, the impact coefficient of the line became 1.76, which was lower than the recommended value of 1.8; there was no mechanical failure risk; and the maximum jump height became 10.266 m. This study verified the effectiveness of this spacer arrangement scheme.

1. Introduction

Ice accidents have caused huge economic losses to many countries around the world. For the past 40 years, the available data show that accidents such as damage to hardware and collapses of transmission towers due to ice-shedding on transmission lines have occurred in Hubei, Hunan, Guizhou, Jiangxi, Yunnan, and Xinjiang, in China [1,2,3,4]. Ice-shedding of transmission lines refers to the phenomenon in which the ice coating of transmission lines in an ice area falls off under natural conditions and causes up-and-down vibration of the conductors. Therefore, it is greatly important to accurately assess the risk of ice-shedding on high-voltage overhead lines, and to implement fast and effective suppression measures to prevent severe ice accidents [5,6,7,8,9].
Scholars have carried out simulations and experimental research on the dynamic response of line ice-shedding. Morgan et al. studied the mechanical response characteristics of ice-shedding lines under different ice-shedding conditions by building an experimental model of transmission lines [10,11,12,13]. Liu et al. analyzed the dynamic responses of a tower-line system under different ice-shedding conditions through simulation tests based on 1000 kV UHV conventional overhead lines [14]. Xie et al. took a 220 kV conventional transmission line as an engineering prototype, designed a scaled model of a tower-line system, and studied the mechanical characteristics of ice-shedding lines under different ice-shedding conditions [15]. Zhou et al. analyzed the influence of wind speed, ice thickness, span, and other factors on the tension of an ice-shedding conductor by establishing a finite element simulation model of transmission line [11,16]. Lou et al. took a 500 kV conventional transmission line as their research object to study the influence of the wind attack angle, wind speed, etc., on the tension of an ice-shedding conductor [17,18]. Si et al. took a UHVDC transmission line as their research object to study the influence of ice-shedding loads on the dynamic response of the key tension plate [19]. Some scholars have also studied the suppression measures of ice-shedding on transmission lines. Kollar et al. studied the influence of spacer spacing on conductor jump height, and concluded that the maximum jump height and maximum tension of ice-shedding conductor showed roughly a power function relationship with ice thickness and spacer spacing [11,20]. Yang et al. took a 500 kV conventional positive isosceles-triangular overhead line as an example to analyze the suppressive effect of triangular interphase spacers [21]. Cui et al. studied the changes in the dynamic tension and jump height of an eight-bundled conductor under different spacer arrangements and provided the optimal arrangement scheme [22]. On the whole, few studies have been conducted on the ice-shedding characteristics of 500 kV compact overhead lines.
In terms of line icing risk assessments, the relevant research has focused mainly on conductor galloping and insulator icing flashover [23,24]. There is a lack of research on the risk assessment of transmission-line ice-shedding, and flashover and short circuit accidents caused by ice-shedding are particularly common. Therefore, it is of great importance to study the risk assessment and suppression measures for the ice-shedding of overhead lines.
In this study we propose a risk assessment method for the ice-shedding of 500 kV compact overhead lines. Two ratios were introduced to assess the discharge risk of the line and the mechanical failure risk of the line. Taking a 500 kV compact overhead line in southern China as an example, the proposed risk assessment method was used to carry out a risk assessment of the ice-shedding line with an ice thickness of 15 mm. Changes in the jump height and tension under different spacer arrangement schemes were analyzed, and the optimal spacer arrangement scheme was obtained, which provided a reference for the prevention of transmission line ice-shedding.

2. Risk Assessment Method for a Transmission Line under Ice-Shedding Conditions

After ice-shedding of the transmission line, the tension at the end of the line will change, resulting in unbalanced tension, causing deflection of the insulator and even damage to the hardware. At the same time, with the increase in the line jump height, the interphase clearance will change, which may lead to discharge. Therefore, in order to assess the mechanical failure and discharge risks of conductors after ice-shedding, a risk assessment method that uses the impact coefficient and gap breakdown voltage to carry out risk assessments of ice-shedding lines is proposed in this paper. Figure 1 shows the risk assessment flow chart for the ice-shedding of transmission lines.
Firstly, the finite element simulation model of a transmission line was established, and the jump height dice and the dynamic tension under different ice-shedding modes were obtained via simulation analysis. Secondly, the minimum interphase clearance dmin and impact coefficient kf of transmission lines after ice-shedding were calculated. Then, the discharge voltage Uf corresponding to dmin was obtained based on the gap AC discharge characteristic curve and compared with the maximum operating voltage Umax between different phases to assess the discharge risk of the ice-shedding line. The impact coefficient of the ice-shedding line was compared with the recommended value, and the mechanical risk of the ice-shedding line was assessed. Finally, the risk assessment results for ice-shedding transmission lines were obtained.
The first step in the risk assessment process requires the establishment of a finite element simulation model. The second and third steps are described in detail below.
Umax is the maximum operating voltage between different phases, Uf is the discharge voltage under different gaps, and kf is the impact coefficient of the ice-shedding conductor. The discharge voltage calculation formula under different gaps is [25]:
U f = k r U 50 %
where kr is the environmental effect coefficient, of which the value is 0.8 under the icing conditions of the line, and U50% is the voltage with a 50% breakdown probability proposed in the project.
According to the Code for the Design of 110 kV~750 kV Overhead Transmission Lines [25], the critical flashover voltage U50% value (kV) and the gap distance L1 (m) have the discharge characteristics shown in Figure 2. U50% can be obtained according to the gap distance between different phases. The value P1 = Umax/Uf is calculated. The greater the value, the greater the discharge risk of the line. If the ratio P1 is greater than 1, the line may discharge.
Meng et al. proposed that the impact coefficient of the static longitudinal unbalanced tension, converted into dynamic longitudinal unbalanced tension, could be 1.8, based on a large number of calculations [26]. The static longitudinal unbalanced tension is the difference between the tension of the icing conductor and the tension of the conductor after ice-shedding. The dynamic longitudinal unbalanced tension is the difference between the tension of the icing conductor and the minimum tension of the conductor after ice-shedding. The impact coefficient kf is the ratio of the dynamic longitudinal unbalanced tension to the static longitudinal unbalanced tension. The value P2 = kf/1.8 is calculated. The greater the value, the more likely it is that the hardware will be damaged. If the ratio P2 is greater than 1, there is a possibility of mechanical failure.
The substitution of P1 and P2 into the risk assessment table of an ice-shedding line is shown in Table 1. When 0 ≤ P1 < 1 and 0 ≤ P2 < 1, the assessment result for the ice-shedding line is “No risk”. When 1 ≤ P1 and 0 ≤ P2 < 1, the assessment result for the ice-shedding line is “No mechanical failure risk, risk of discharge”. When 0 ≤ P1 < 1 and 1 ≤ P2, the assessment result for the ice-shedding line is “No discharge risk, risk of mechanical failure”. When 1 ≤ P1 and 1 ≤ P2, the assessment result for the ice-shedding line is “Risk of discharge and mechanical failure”.

3. Finite Element Model of Transmission Line

3.1. Conductor-Insulator String Finite Element Model

A transmission line is a physical system with a complex structure, including key components such as the conductor and the insulator string. The establishment of a finite element simulation model of transmission lines can fully and intuitively reflect the stress characteristics of transmission lines. By ignoring the secondary part of the transmission line, a finite element model of the conductor-insulator string was established in the finite element software according to the structural characteristics and connection mode of the conductor and the insulator string. The boundary conditions of the conductor-insulator string coupling system were as follows: the suspension point of the conductor was fixed, the joint of the line unit and the suspension insulator string unit were the same node, and the suspension insulator and the conductor were rigidly connected.

3.2. Ice Load Simulation

The ice-coating shape of the transmission line is different in natural conditions. In the engineering calculations, it is often calculated as a ring-shaped ice coating. The ice coating is evenly distributed along the conductor, and a uniform ice load is applied to simulate the actual icing of the conductor.
In this study, the equivalent concentrated mass method was used to simulate the ice load. The equivalent concentrated mass method involves applying loads on each point of the line at a certain interval by sectioning the line and decomposing the side load into the point load, so that the total load on the line is the same as the side load before equivalence. In the calculation of ice-shedding, the uniform icing on the conductor is converted into a series of uniformly distributed concentrated masses, which are applied to the conductor as external loads at equal intervals. For different ice-shedding mechanisms, different amounts and positions of loads are used for simulations. Assuming that the conductor is cylindrical, regardless of the influence of ice density and ice stiffness on the calculation of the icing jump, the icing mass per unit conductor can be calculated using the following formula [27]:
F b = 1 4 π ρ ice [ ( d + 2 b ) 2 d 2 ]
where Fb is the icing mass per unit length of the transmission line (kg/m), ρice is the density of the ice (taking ρice = 900 kg/m3), d is the diameter of the conductor (m), and b is the thickness of the ice (m).
In order to simulate different icing conditions of the line and ice-shedding modes, according to the span of the transmission line, the line is loaded in sections, that is, an l point load is arranged. The mass of each concentrated load is calculated as follows [27]:
F i c e = F b S l
where Fice is the load mass of a single point (kg) and S is the conductor length (m).
The simplification of split conductors needs to satisfy the principle of an equal cross-sectional area of the conductor and an equal ice mass quality. The equivalent single-conductor diameter and ice thickness are [28]:
D = n d
B = n b
where D is the equivalent single-conductor diameter, B is the equivalent ice thickness, d is the diameter of a split sub-conductor, b is the ice thickness of the split sub-conductor, and n is the split number. As shown in Figure 3, the split conductor is equivalent to a single conductor.

3.3. Initial Shape Analysis of the Conductor

The distance between the two adjacent suspension points of the conductor is large, so the stiffness of the conductor can be ignored, that is, it is assumed that the conductor only bears the tension but not the bending moment. Then, under the action of initial stress and self-gravity, the initial shape of the conductor is catenary in theory. In the finite element analysis of transmission lines, the initial shape of conductors should be determined first, that is, the shape-finding analysis of conductors should be conducted. In this study, the basic principle of conductor shape finding was as follows: creating a finite element model of the conductor at the catenary position, using actual material properties and real constants, setting a small initial strain, and applying the self-weight load. The finite element model was updated step-by-step with the horizontal tension of the rope as the convergence condition. The final result was the initial deformation of the conductor under the self-weight load, so as to determine the stress distribution and geometric structure of the conductor under the self-weight load.
During the flow process of natural wind, its direction and speed are random, with strong randomness and mutation. It is difficult to simulate the impact of actual natural wind on the tension and jump height of an ice-shedding line in simulation experiments. Yang et al. [29] studied the influence of ice thickness, height difference, and wind speed on the unbalanced tension of a high transmission tower and the dynamic tension of a conductor. They found that the influence of wind speed was very small. Therefore, in this study we did not consider the influence of wind load, and analyzed the changes in tension and jump height in the absence of wind.

4. Case Analysis of a 500 kV Compact Overhead Line

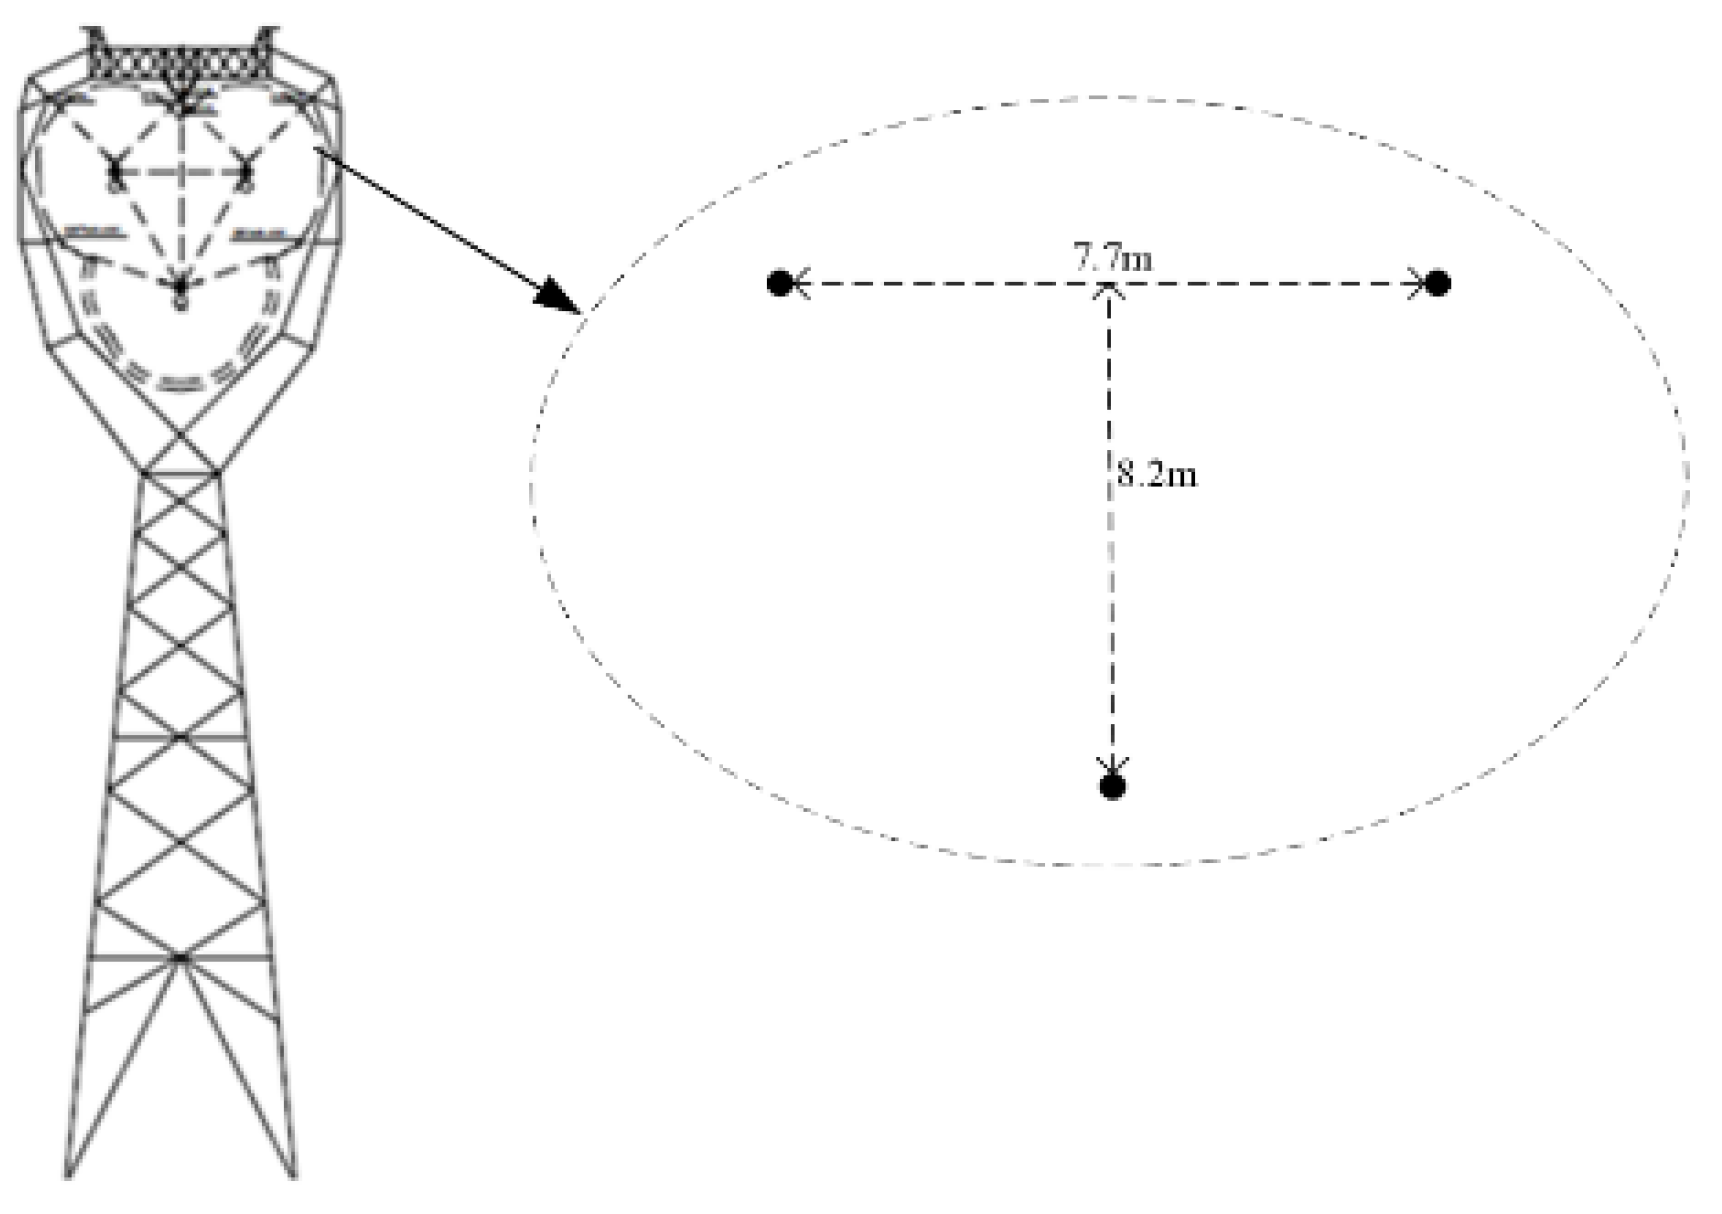
4.1. Engineering Background and Design Parameters

In this study, we took a 500 kV compact transmission line in southern China as the research object. The transmission line passed through a 15 mm ice area with an altitude range of 2000–2500 m. In winter, the transmission line was severely iced, and ice-shedding under natural conditions easily caused the line to jump. A compact isosceles inverted triangle layout was adopted in the three-phase overhead line, and a schematic diagram of the layout is shown in Figure 4.
The conductor type used in this 15 mm ice area was a 6-split JL/G1A-300/40 steel-cored aluminum stranded wire, and a line section diagram is shown in Figure 5. The span and height difference are 763 m and 128.1 m, respectively. The physical parameters of the conductor are shown in Table 2.
The 500 kV transmission line was taken as an example, and the finite element model of the conductor-insulator string was established using finite element software, as shown in Figure 6.

4.2. Changes in Jump Height and Tension under Ice-Shedding Conditions

Considering the severe icing conditions under the designated ice thickness, we assumed that the ice thickness b of the transmission line was 15 mm, the equivalent conductor diameter D was 58.54 mm, and the equivalent ice thickness B was 36.74 mm. In this study, three phase lines were arranged in an inverted triangle. The upper-left phase and the upper-right phase underwent ice-shedding, and the interphase clearance increased. However, the interphase clearance would decrease when the lower phase underwent ice-shedding. If the minimum interphase clearance can meet the requirements of safe electrical clearance under extreme working conditions, it can meet these requirements under other working conditions. Therefore, in this study we only simulates the ice-shedding response of the lower phase conductor when full-span synchronous ice-shedding occurred, and the upper-left phase and upper-right phase did not undergo ice-shedding. The ice-shedding rate was 100%. The ice-shedding rate refers to the ratio of ice-shedding thickness to the conductor icing thickness.
The changes in the dynamic tension of the transmission line were obtained via the modeling and simulation of the 500 kV compact transmission line. The tension simulation results are shown in Figure 7. The simulation results showed that the tension of the icing conductor was 280 kN, and the dynamic tension of the conductor after ice-shedding decreased sharply to only 40 kN, which was far less than the conductor tension before ice-shedding. Moreover, the static tension of the conductor after ice-shedding was less than half of the static tension of the icing conductor, and the conductor tension gradually stabilized at 110 kN after ice-shedding. We calculated that the dynamic unbalanced tension of the conductor was 320 kN and the static unbalanced tension was 170 kN. The maximum jump height of the lower phase conductor was 22.596 m. The lower phase conductor underwent ice-shedding, resulting in a sharp reduction in interphase clearance.

4.3. Calculation Method of Minimum Interphase Clearance

The maximum ice jump height of the conductor in the horizontal plane is expressed as dice, and the formula for calculating the minimum interphase clearance dmin after the conductor ice-shedding is shown in Equation (6). The spacing calculation diagram is shown in Figure 8.
d min = { d h 2 + ( d l d ice ) 2 d ice < d l d h d ice d l
where dh is the horizontal distance between the upper-left phase and the lower phase, dl is the vertical distance between the upper-left phase and the lower phase, and dice is the jump height of the lower phase conductor. The minimum value dmin of interphase clearance was 3.85 m.

4.4. Risk Assessment of Ice-Shedding Line

According to Chinese standards [25], the maximum operating voltage of a 500 kV transmission line is 550 kV, and the maximum operating phase voltage is as follows:
U max = 550 × 2 = 777.82   kV
The maximum working voltage Umax between lines was 1347 kV. According to Figure 2, the discharge voltage Uf was 1039 kV at this gap distance, and the value of P1 was 1.3, which indicates that the ice-shedding phase (phase C) and icing phase (phase A and B) of the 500 kV compact transmission line were likely to discharge. At this time, the impact coefficient kf of the line during ice-shedding reached 1.88, which exceeds the recommended value of 1.8, and there was thus a risk of mechanical failure. Therefore, it was necessary to study suppression measures in response to ice-shedding.

5. Analysis of the Effects of Suppression Measures for an Ice-Shedding Transmission Line

5.1. Arrangement Schemes of Interphase Spacers

Four spacer arrangement schemes were adopted in this study. The specific arrangement schemes of interphase spacers are shown in Table 3, where L is the span length. Scheme 1 involved installing a set of interphase spacers at the center of the span for the upper-left phase and the lower phase. Scheme 2 involved installing two sets of interphase spacers at L/3 from both ends of the span for the upper-left phase and the lower phase, the upper-right phase, and the lower phase, respectively. Scheme 3 involved installing a set of interphase spacers at the center of the span for the upper-left phase and the upper-right phase, and installing two sets of interphase spacers at L/4 from both ends of the span for the upper-left phase and the lower phase, the upper-right phase, and the lower phase, respectively, giving a total of three sets of interphase spacers. Scheme 4 involved installing two sets of interphase spacers at 2L/5 from both ends of the span for the upper-left phase and the upper-right phase, and installing two sets of interphase spacers at L/4 from both ends of the span for the upper-left phase and the lower phase, the upper-right phase, and the lower phase, respectively. A total of four sets of interphase spacers were installed.
The specific layout of interphase spacers is shown in Figure 9.
The physical parameters of the interphase spacers are shown in Table 4. The spacers could be simulated by beam elements.

5.2. Influence of Interphase Spacers on Conductor Ice-Shedding

In this study, we simulated the ice-shedding response of conductor-spacer system under conditions in which the lower phase conductor underwent ice-shedding. The jump height and tension changes of the ice-shedding conductor under different arrangement schemes of interphase spacers were analyzed. When the lower phase line underwent ice-shedding, due to the existence of interphase spacers, the iced conductors of the other two phases transmitted the force along the spacers to the ice-shedding conductors. That is, when the conductor jumped upwards, in addition to overcoming the influence of its gravity, the force exerted by other phase conductors on the ice-shedding conductors should also be overcome.
The decreasing jump heights of the ice-shedding conductor under different interphase spacer arrangements are shown in Table 5 and Figure 10. It can be seen in Table 5 and Figure 10 that the jump heights of ice-shedding conductor were greatly reduced after the interphase spacers were arranged on the system, and the maximum reduction percentage reached 54.57%. Among these, the best effect was gained by arranging two sets of interphase spacers according to Scheme 2, whereas the inhibition effect of Scheme 1 was relatively poor, with a reduction of 38.13%. However, when the number of spacers was increased to 3 or 4 sets, the conductor with a span of 763 m was divided into more and more pieces, and the system became prone to the problem of sub-span oscillation, and this was not conducive to the effect of spacer inhibition. For example, when four sets of interphase spacers were arranged in Scheme 4, the conductor’s jump height was only reduced by 30.51%. After the interphase spacers were arranged according to Scheme 2, the dynamic tension changes of the lower phase conductor during ice-shedding were simulated and analyzed. Figure 11 shows the dynamic tension change curve of the ice-shedding conductor after the spacers were arranged according to Scheme 2.
It can be seen in Figure 7 and Figure 11 that the amplitude of the dynamic tension curve of the ice-shedding conductor was similar to that of the icing conductor after the introduction of a spacer arrangement, and the curve trend was basically the same. When the lower phase conductor underwent full-span synchronous ice-shedding, the tension of the icing conductor was greater than that of the ice-shedding conductor, which was due to the energy consumption of the ice-shedding conductor, which caused the conductor to jump upwards. When the ice-shedding was completed, the tension of the ice-shedding conductor differed greatly from that of the icing conductor. When the ice-shedding conductor gradually changed from a jumping state to a stationary state, the tension of the ice-shedding conductor was 90 kN. After the spacer is arranged and installed according to Scheme 2, the impact coefficient kf became 1.76. At this time, there was no risk of mechanical failure for the transmission line. The reason for this is that other icing phase conductors were connected with the ice-shedding conductors through spacers in the process of ice-shedding. At this time, the energy generated by the falling off of ice during ice-shedding flowed between three-phase conductors, not just the ice-shedding conductor.
According to the results acquired after the installation of interphase spacers in the project, when the line span was not large, two sets of interphase spacers were generally installed. When the line span was large, four sets of interphase spacers were generally installed. The spacer was generally installed at 1/3 or 1/4 of the line span. For the typical lines studied in this paper, according to the construction design specifications, a transmission line with a span of 600 m–800 m can be generally arranged with interphase spacers according to Scheme 2. This study has verified the effectiveness of this arrangement scheme.

6. Discussion

In this paper, a risk assessment method for the ice-shedding of 500 kV compact overhead lines was proposed. Two ratios were introduced to assess the discharge risk of a line and mechanical failure risk of a line. Considering the current lack of research on risk assessments for transmission line ice-shedding, and the fact that flashover and short circuit accidents caused by ice-shedding are particularly common, the assessment method presented in this study has the potential for application in the rapid assessment of mechanical and electrical risks.
A 500 kV compact overhead line in southern China was taken as an example, and the proposed risk assessment method was used to carry out risk assessments of the ice-shedding line. We considered severe ice conditions (b = 15 mm) and the changes in the tension and jump height of the conductor were measured. We found that the impact coefficient was greater than the recommended value and the interphase clearance of the conductor decreased sharply when the lower phase conductor of the 500 kV case line underwent full-span ice-shedding synchronously. The ice-shedding line exhibited both a discharge risk and a mechanical failure risk. Four interphase spacer arrangement schemes were examined, and their suppression effects were analyzed. The optimal spacer arrangement scheme was obtained, which also met the installation requirements of the project and the design specifications of the line. This study thus verified the effectiveness of this spacer arrangement scheme.
In future studies, we may need to consider the combination of online monitoring and risk assessments. Future studies should also include the extensive practical usage of the proposed risk method and the economic cost involved in the application of the proposed method [30].

7. Conclusions

A risk assessment method for the ice-shedding of 500 kV compact overhead lines was proposed. Taking a 500 kV compact overhead line in southern China as an example, the proposed risk assessment method was used to carry out risk assessments of an ice-shedding line with an ice thickness of 15 mm, and the suppression effects of different spacer arrangement schemes on the ice-shedding line were analyzed.
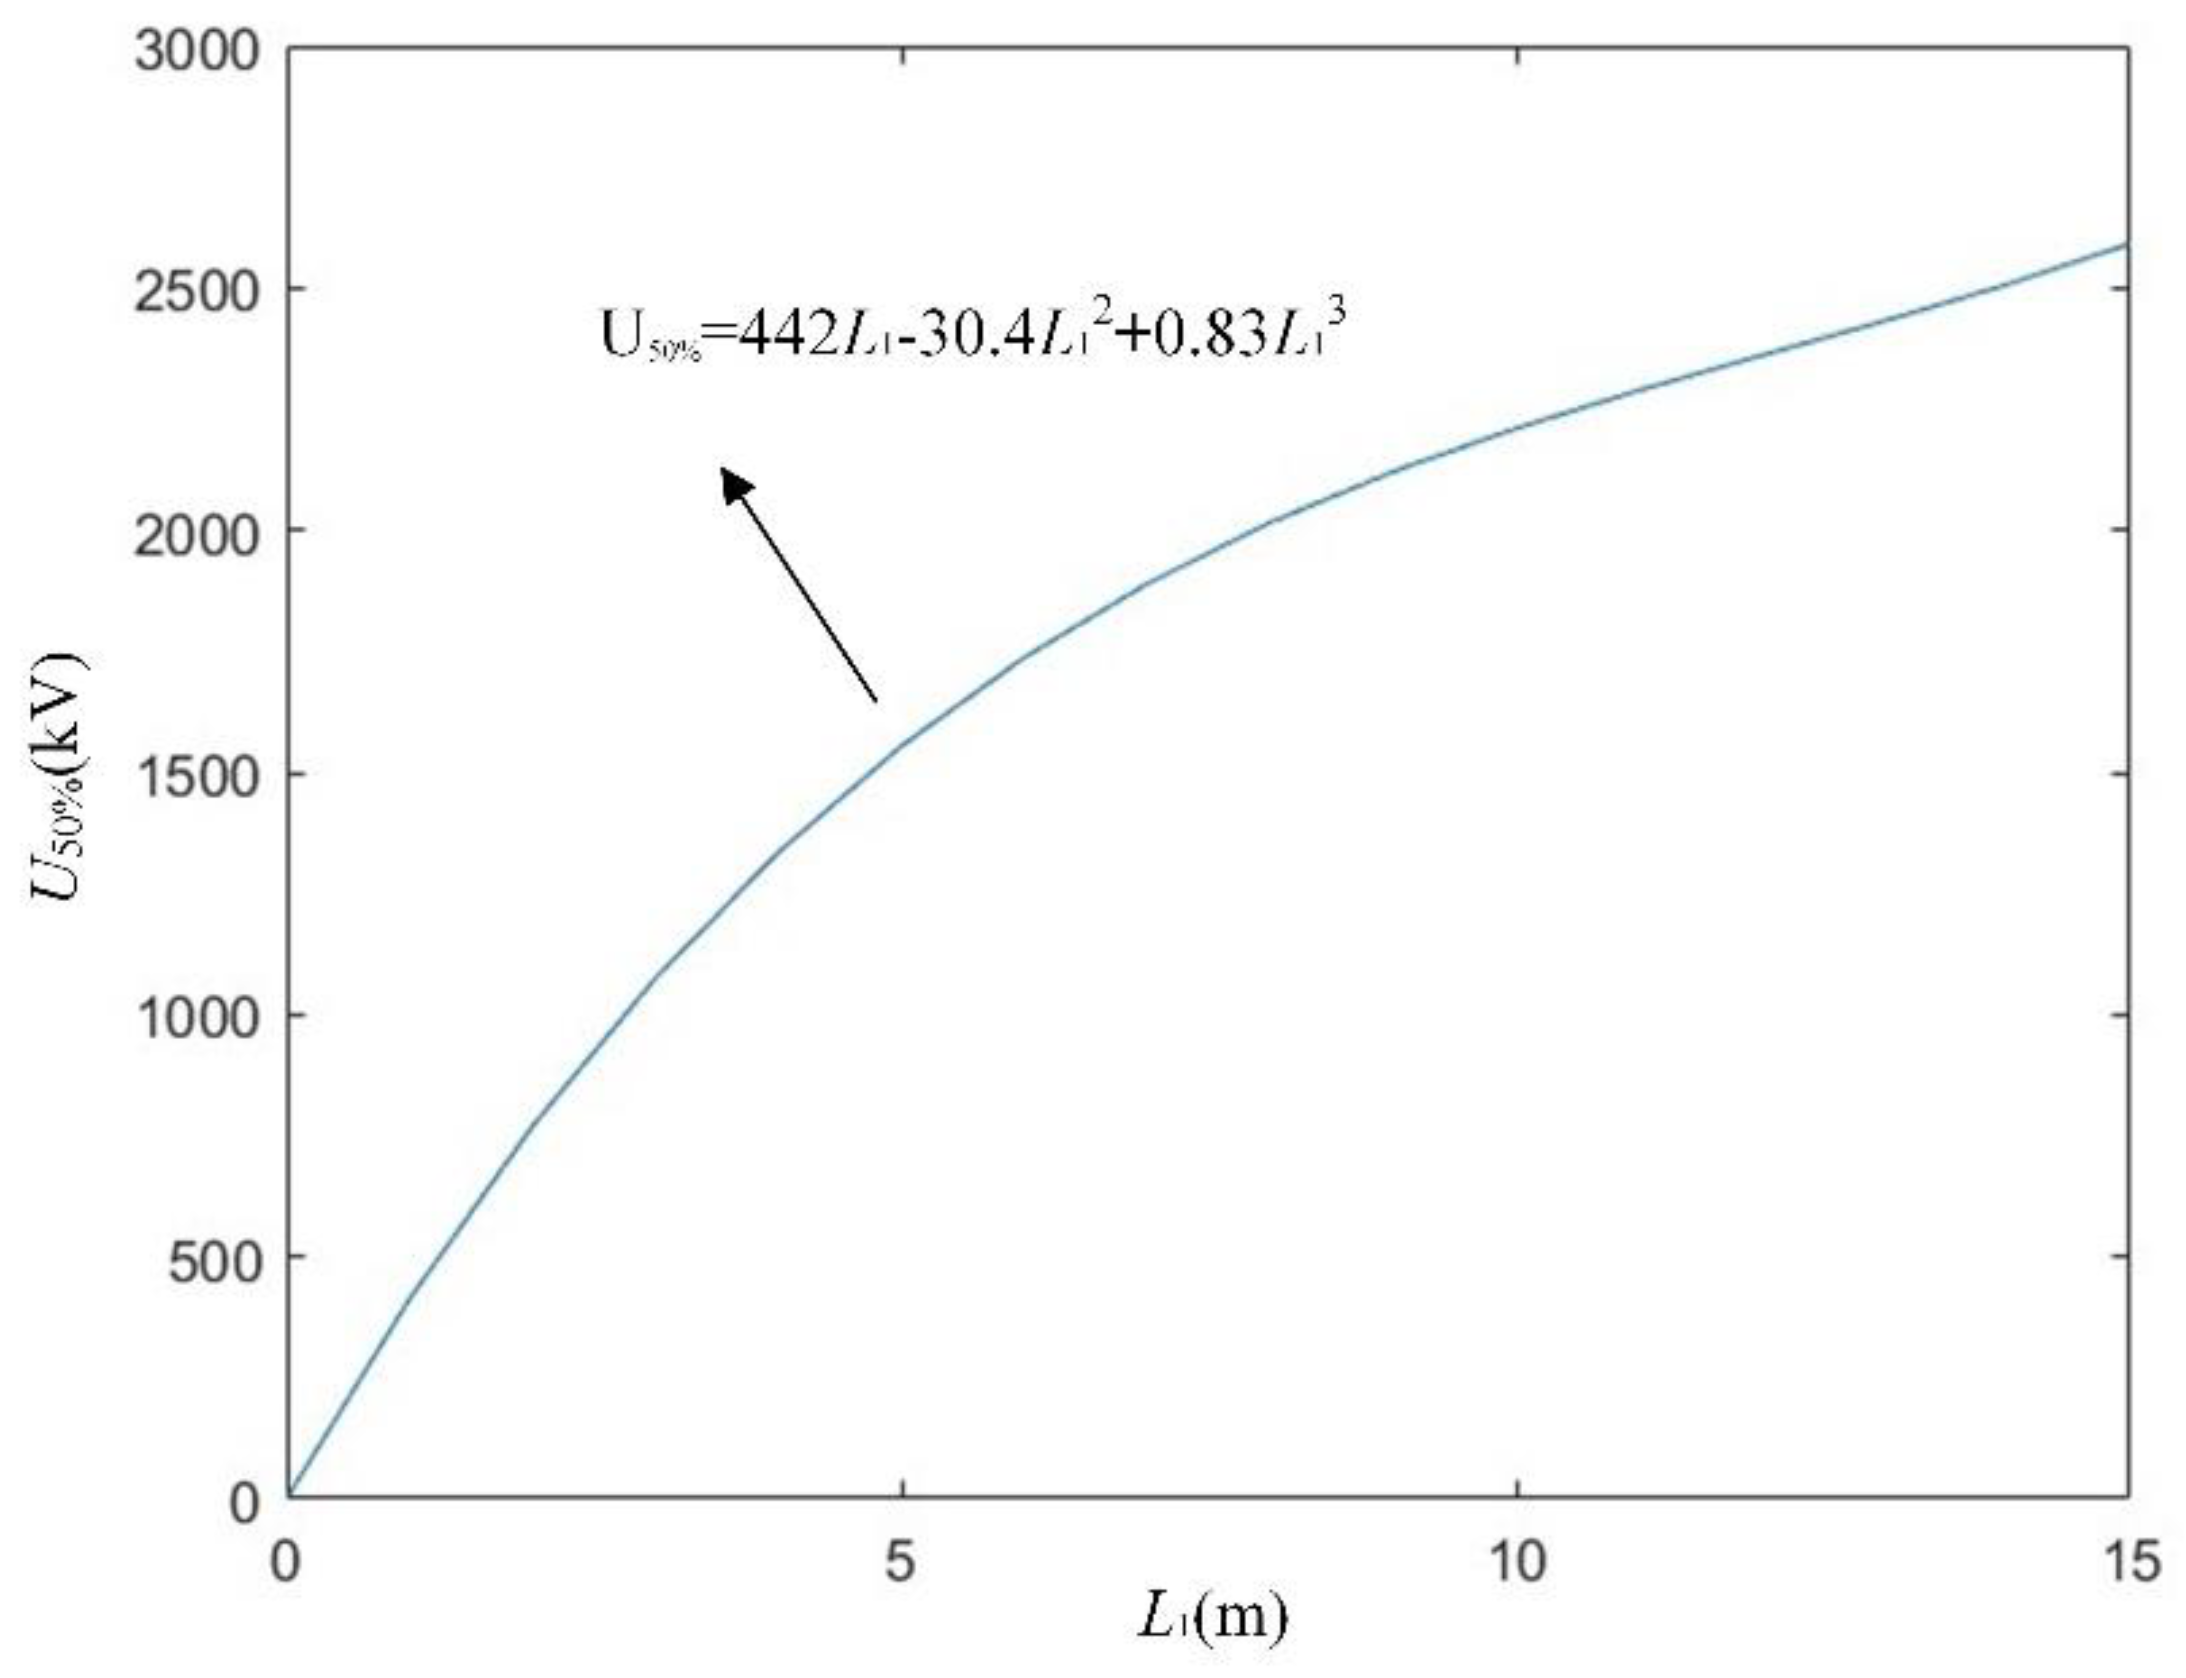
  • The specific steps involved in the risk assessment method proposed in this paper are as follows: Firstly, the jump height and dynamic tension of lines under different ice-shedding modes were obtained according to finite element simulation. Secondly, the minimum interphase clearance and impact coefficient of transmission lines after ice-shedding were calculated. Then, according to the obtained minimum interphase clearance, the discharge voltage of the corresponding minimum gap was obtained based on the gap AC discharge characteristics curve. The ratio (P1) of the maximum operating voltage for different phases to the discharge voltage was used to analyze the possibility of discharge. The ratio (P2) of the impact coefficient of the ice-shedding line to the recommended value was used to analyze the mechanical failure risk of the line during ice-shedding. Finally, the risk assessment results of the ice-shedding lines were obtained by combining P1 and P2. The assessment method proposed in this paper has potential for the rapid assessment of mechanical and electrical risks.
  • The impact coefficient was greater than the recommended value and the interphase clearance of the conductor decreased sharply when the lower phase conductor of the 500 kV case line underwent full-span ice-shedding synchronously. The ice-shedding line exhibited the possibility of discharge and a mechanical failure risk. Therefore, it is essential to take measures to suppress ice-shedding.
  • The best suppression effect was observed when two sets of spacers were installed for the upper-left phase and the lower phase, the upper-right phase, and lower the phase at L/3 from both ends of the span. The impact coefficient of the line became 1.76, which is less than the recommended value of 1.8, there was no mechanical failure risk, and the maximum jump height was 10.266 m. This arrangement scheme was consistent with the installation requirements of spacers in the project and the design specifications of the line. This study thus verified the effectiveness of this arrangement scheme.
  • In subsequent studies, we may consider combining the proposed risk assessment method with online monitoring of icing transmission lines and carry out the extension and practical usage of the proposed method.

Author Contributions

Y.W. and Y.C. conceived and designed the simulation experiments; Y.W., Y.C., J.W. and X.M. analyzed the data; Y.W., H.H. and L.Y. supervised the work and contributed to the interpretation of the results; Y.C. wrote the paper under the guidance of Y.W., J.W., X.M., H.H. and L.Y. All authors have read and agreed to the published version of the manuscript.

Funding

Key core technology research project of China Southern Power Grid Corporation (066600KK52190063); Basic and Applied Basic Research Fund of Guangdong Province (2019A1515012122).

Conflicts of Interest

The authors declare no conflict of interest.

References

  1. Zhang, J.; Li, X.T.; Zhang, B.; Xu, Y.B.; Zhou, W.W.; Jiang, Y.; Liu, M.Y. Analysis on icing and ice-shedding accidents of 750 kV lines in Xinjiang. Zhejiang Electr. Power. 2020, 39, 58–62. [Google Scholar]
  2. Yang, L.; Hu, Z.H.; Nian, L.P.; Hao, Y.P.; Li, L.C. Prediction on freezing fraction and collision coefficient in ice accretion model of transmission lines using icing mass growth rate. IET Gener. Transm. Distrib. 2022, 16, 364–375. [Google Scholar] [CrossRef]
  3. Lu, J.Z.; Xie, P.K.; Jiang, Z.L.; Fang, Z.; Wu, W. Voltage distribution and flashover performance of 220 kV composite insulators under different icing conditions. Energies 2018, 11, 632. [Google Scholar] [CrossRef] [Green Version]
  4. Hao, Y.P.; Wei, J.; Jiang, X.L.; Yang, L.; Li, L.C.; Wang, J.K.; Li, H.; Li, R.H. Icing condition assessment of in-service glass insulators based on graphical shed spacing and graphical shed overhang. Energies 2018, 11, 318. [Google Scholar] [CrossRef] [Green Version]
  5. Cui, F.J.; Liu, X.J.; Zhang, S.X.; Zhou, A.Q.; Huo, B. The impact of interphase spacers on galloping control of three-phase iced eight-bundled transmission lines: An experimental study. IEEE Trans. Power Deliv. 2021, 36, 371–382. [Google Scholar] [CrossRef]
  6. Jiang, X.L.; Jiang, F.Y.; Wang, Q.L.; Luo, B.; Han, X.B. Prediction of rime accretion on transmission line based on optimal time step model. Trans. China Electrotech. Soc. 2018, 33, 4408–4418. [Google Scholar]
  7. Rui, X.M.; Ji, K.P.; Li, L.; McClure, G. Dynamic response of overhead transmission lines with eccentric ice deposits following shock soads. IEEE Trans. Power Deliv. 2017, 32, 1287–1294. [Google Scholar] [CrossRef]
  8. Zafeiropoulou, M.; Mentis, I.; Sijakovic, N.; Terzic, A.; Fotis, G.; Maris, T.I.; Vita, V.; Zoulias, E.; Ristic, V.; Ekonomou, L. Forecasting Transmission and Distribution System Flexibility Needs for Severe Weather Condition Resilience and Outage Management. Appl. Sci. 2022, 12, 7334. [Google Scholar] [CrossRef]
  9. Chen, L.Z.; Li, C.G.; Xin, Z.; Nie, S.R. Simulation and risk assessment of power system with cascading faults caused by strong wind weather. Int. J. Electr. Power Energy Syst. 2022, 143, 108462. [Google Scholar] [CrossRef]
  10. Morgan, V.T.; Swift, D.A. Jump height of overhead-line conductors after the sudden release of ice loads. IEE Proc. 1964, 111, 1736–1746. [Google Scholar] [CrossRef]
  11. Kollár, L.E.; Olqma, O.; Farzaneh, M. Natural wet-snow shedding from overhead cables. Cold Reg. Sci. Technol. 2010, 60, 40–50. [Google Scholar] [CrossRef] [Green Version]
  12. Huang, G.Z.; Yan, B.; Wen, N.; Wu, C.; Li, Q. Study on Study on jump height of transmission lines after ice-shedding by reduced-scale modeling test. Cold Reg. Sci. Technol. 2019, 165, 102781. [Google Scholar] [CrossRef]
  13. Huang, G.Z.; Yan, B.; Guo, Y.J.; Zhang, B.; Wu, G.N. Experimental study on dynamic response characteristics of isolated-span transmission lines after ice-shedding. High Volt. 2022, 1–13. [Google Scholar] [CrossRef]
  14. Liu, C.C.; Shen, M.Q.; Zhang, Y.; Qi, X.H. Ice-shedding vibration model test of long span transmission tower line system. Hydropower Energy Sci. 2013, 31, 191–195. [Google Scholar]
  15. Xie, Z.X.; Li, D.; Huang, W.; Liu, S. Experimental study on dynamic characteristics of tower line system during ice-shedding. J. Appl. Mech. 2017, 3, 855–861. [Google Scholar]
  16. Zhou, Y.; Niu, S.J.; Gao, Z.X.; Zhou, Y.H.; Yang, J.L. Research to the influence factors on shedding processes of three-types icing. Cold Reg. Sci. Technol. 2018, 155, 300–307. [Google Scholar] [CrossRef]
  17. Lou, W.J.; Zhang, Y.L.; Xu, H.W.; Huang, M.F. Jump height of an iced transmission conductor considering joint action of ice-shedding and wind. Cold Reg. Sci. Technol. 2022, 199, 103576. [Google Scholar] [CrossRef]
  18. Lou, W.J.; Zhang, Y.L.; Xu, H.W. Dynamic tension and parameter influence analysis of transmission line ice-shedding considering ice wind coupling. High Volt. 2022, 48, 1052–1059. [Google Scholar]
  19. Si, J.J.; Zhou, L.X.; Zhu, K.J.; Zhao, H.Y.; Liu, B.; Rui, X.M.; Liu, S.C. Dynamic Response of Tension Plate for UHVDC Transmission Lines Under Ice-shedding Loads. CSEE J. Power Energy Syst. 2022, 8, 952–962. [Google Scholar]
  20. Kollár, L.E.; Farzaneh, M.; Van Dyke, P. Modeling Ice-shedding Propagation on Transmission Lines with or without Interphase Spacers. IEEE Trans. Power Deliv. 2013, 28, 261–267. [Google Scholar] [CrossRef] [Green Version]
  21. Yang, F.L.; Yang, J.B.; Fu, D.J.; Han, J.K. Dynamic response analysis of tower-line system during ice-shedding. J. Vib. Eng. Technol. 2010, 23, 86–92. [Google Scholar]
  22. Cui, F.J.; Liu, X.J.; Zhang, S.X.; Zhou, A.Q.; Huo, B. Study on the influence of interphase spacers on ice-shedding of three-phase iced eight-bundled transmission lines. Cold Reg. Sci. Technol. 2020, 174, 103043. [Google Scholar] [CrossRef]
  23. Xie, Y.Y.; Xue, Y.S.; Wen, F.S.; Dong, C.Y.; Zhao, J.H. Spatio temporal assessment of the impact of ice disaster on transmission line failure rate. Power Syst. Autom. 2013, 37, 32–41. [Google Scholar]
  24. Xie, Y.Y.; Xue, Y.S.; Wang, H.H.; Xu, T.S.; Dong, C.Y.; Jin, X.C. Online time-space early warning of lightning strike failure probability of power grid. Power Syst. Autom. 2013, 37, 44–51. [Google Scholar]
  25. GB 50545-2010; Code for Design of 110kV~750kV Overhead Transmission Lines. China Planning Press: Beijing, China, 2010.
  26. Meng, X.B.; Wang, L.M.; Hou, L.; Fu, G.J.; Sun, B.Q. Dynamic characteristics of conductor deicing jump of UHV transmission line. J. Tsinghua Univ. (Nat. Sci. Ed.) 2010, 50, 1631–1636. [Google Scholar]
  27. Feng, Z.H.; Yang, L.; Hao, Y.P.; Li, L.C. Influence of suspension span ratio on dynamic response of transmission line to ice-shedding. Guangdong Electr. Power 2020, 33, 125–130. [Google Scholar]
  28. Niu, B.; Wang, C.W.; Liang, W. Study on the Application of Anti ice-shedding Fault Measures for 220 kV Double Circuit Transmission Lines. Shanxi Electr. Power 2020, 223, 46–48. [Google Scholar]
  29. Yang, F.L.; Yang, J.B.; Zhang, Z.F. Unbalanced tension analysis for UHV transmission towers in heavy icing areas. Cold Reg. Sci. Technol. 2012, 70, 132–140. [Google Scholar] [CrossRef]
  30. Ekonomou, L.; Fotis, G.; Maris, T.I. Cost related optimum design method for overhead high voltage transmission lines. Eur. Trans. Electr. Power 2008, 18, 437–447. [Google Scholar] [CrossRef]
Figure 1. Risk assessment flowchart.
Energies 15 08005 g001
Figure 2. AC discharge characteristics of the conductor gap.
Energies 15 08005 g002
Figure 3. Equivalent conductor diagram.
Energies 15 08005 g003
Figure 4. Schematic diagram of the three-phase overhead line layout.
Energies 15 08005 g004
Figure 5. Sectional diagram of the transmission line.
Energies 15 08005 g005
Figure 6. Conductor-insulator string finite element model.
Energies 15 08005 g006
Figure 7. Dynamic tension changes at the end of the conductor.
Energies 15 08005 g007
Figure 8. Spacing calculation diagram.
Energies 15 08005 g008
Figure 9. Diagram of the arrangement schemes of interphase spacers.
Energies 15 08005 g009
Figure 10. Jump heights of ice-shedding conductors under different arrangement schemes.
Energies 15 08005 g010
Figure 11. Dynamic tension at the end of the ice-shedding conductor under Scheme 2.
Energies 15 08005 g011
Table 1. Transmission line risk assessment in the case of ice-shedding.
P1 = Umax/UfP2 = kf/1.8Risk Assessment Results
0 ≤ P1 < 10 ≤ P2 < 1No risk
1 ≤ P10 ≤ P2 < 1No mechanical failure risk, risk of discharge
0 ≤ P1 < 11 ≤ P2No discharge risk, risk of mechanical failure
1 ≤ P11 ≤ P2Risk of discharge and mechanical failure
Table 2. Physical parameters of the conductor.
JL/G1A-300/40Numerical Value
Calculated cross section (mm2)338.99
Outer diameter (mm)23.9
Unit weight (kg/km)1131
Calculated pull-off force (kN)92,360
Coefficient of elasticity (N/mm2)73,000
Split number6
Poisson’s ratio0.3
Table 3. Layout schemes of interphase spacers.
Serial NumberA−CInstallation PositionB−CInstallation PositionA−BInstallation Position
1oneL/2----
2oneL/3one2L/3--
3oneL/4one3L/4oneL/2
4oneL/4one3L/4two2L/5, 3L/5
Table 4. Physical parameters of interphase spacers.
Density (kg/m3)Sectional Area (mm)Young’s Modelus (GPa)Poisson’s Ratio
202130410.3
Table 5. Jump heights of ice-shedding conductors under different interphase spacer arrangements.
Arrangement SchemeMaximum Jump Height (m)Reduction Percentage
No spacer22.596-
Scheme 1 13.98138.13%
Scheme 2 10.26654.57%
Scheme 3 10.40253.97%
Scheme 4 15.70230.51%
Publisher’s Note: MDPI stays neutral with regard to jurisdictional claims in published maps and institutional affiliations.

