Article

X-ray and Synchrotron FTIR Studies of Partially Decomposed Magnesium Borohydride

1
Department of Mathematics and Physics, University of Stavanger, P.O. Box 8600, NO-4036 Stavanger, Norway
2
Department of Science and High Technology and INSTM, Università degli Studi dell’Insubria, Via Valleggio 9, I-22100 Como, Italy
3
Department for Hydrogen Technology, Institute for Energy Technology, P.O. Box 40, NO-2027 Kjeller, Norway
*
Author to whom correspondence should be addressed.
Current affiliation: Nuclear Material and Engineering (NuME) Group, Department of Applied Physics, Aalto University, Otakaari 1, 02150 Espoo, Finland.
Current affiliation: Center for Quantum Spintronics, Department of Physics, Norwegian University of Science and Technology (NTNU), NO-7491 Trondheim, Norway.
Energies 2022, 15(21), 7998; https://doi.org/10.3390/en15217998
Submission received: 31 August 2022 / Revised: 10 October 2022 / Accepted: 19 October 2022 / Published: 27 October 2022
(This article belongs to the Special Issue Metal Hydrides and Oxyhydrides for Energy-Related Applications)

Abstract

:
Magnesium borohydride (Mg(BH4)2) is an attractive compound for solid-state hydrogen storage due to its lucratively high hydrogen densities and theoretically low operational temperature. Hydrogen release from Mg(BH4)2 occurs through several steps. The reaction intermediates formed at these steps have been extensively studied for a decade. In this work, we apply spectroscopic methods that have rarely been used in such studies to provide alternative insights into the nature of the reaction intermediates. The commercially obtained sample was decomposed in argon flow during thermogravimetric analysis combined with differential scanning calorimetry (TGA-DSC) to differentiate between the H2-desorption reaction steps. The reaction products were analyzed by powder X-ray diffraction (PXRD), near edge soft X-ray absorption spectroscopy at boron K-edge (NEXAFS), and synchrotron infrared (IR) spectroscopy in mid- and far-IR ranges (SR-FTIR). Up to 12 wt% of H2 desorption was observed in the gravimetric measurements. PXRD showed no crystalline decomposition products when heated at 260–280 °C, the formation of MgH2 above 300 °C, and Mg above 320 °C. The qualitative analysis of the NEXAFS data showed the presence of boron in lower oxidation states than in (BH4). The NEXAFS data also indicated the presence of amorphous boron at and above 340 °C. This study provides additional insights into the decomposition reaction of Mg(BH4)2.

1. Introduction

Hydrogen is the energy that fuels the sun and other stars. With the potential of low-carbon production from renewable energies, and with the largest energy content by weight among chemical fuels, hydrogen is considered to be one of the most likely pillars for future economies [1,2]. At the same time, being the lightest and the least dense amongst the fuels, hydrogen gas requires significant compressing for storage and transportation. Currently, molecular hydrogen is mostly stored in liquid and pressurized forms that brings about issues of energy losses, safety risks, and expensive composite storage tanks. The idea of solid-state hydrogen storage is a lucrative alternative to overcome the challenges [3,4,5,6,7,8]. In this storage method, hydrogen is chemically incorporated in a lattice of a compound with the volumetric hydrogen densities often higher than those in liquid molecular hydrogen (71 g∙L−1). Most of these compounds are stable at room temperature (RT) and above, thus bypassing the need for cryocooling. Moreover, they can be formed at pressures lower than those currently utilized in the hydrogen storage tanks (350–700 bar).
In this context, magnesium borohydride (Mg(BH4)2) is recognized as an attractive hydrogen storage compound due to its high hydrogen content (14.9 wt%, 82–147 gH2/L), and relatively low H2 release temperature that has the potential to be further reduced. In particular, experiments show that the decomposition onset of Mg(BH4)2 requires temperatures of at least 200 °C in order to break the rather strong B-H bonds [9,10]. However, H-D isotopic exchange studies have shown that the B-H bond in Mg(BH4)2 can be perturbed at temperatures as low as around 100 °C and pressure of 3 bar H2 [11,12].
The decomposition reaction of Mg(BH4)2 suggests multiple steps with amorphous intermediate reaction products [13,14,15,16,17,18,19]. Mg(BH4)2 exists in multiple phase polymorphs. If the decomposition starts from the γ-phase, for example, as in the present work, two phase transitions between 145–215 °C are observed prior to decomposition [20]. At temperatures between 215–330 °C, the first hydrogen desorption is observed with the production of amorphous B-H species. In the next stage, the formation of crystalline MgH2 takes place between 340–355 °C, which is then followed by the formation of (i) amorphous boron (B) at a temperature between 355–372 °C and (ii) MgB2 from 372–420 °C. As suggested by Guo et al. [13], the undesirable by-product diborane can form at about 280 °C along with various amorphous B-H species and desorbed H2 that can interact with each other in multiple steps during the decomposition reaction. Most studies indicate an approximately correct theoretical weight loss for the completely decomposed Mg(BH4)2, except for decomposition in a high dynamic vacuum [18], that rules out the stochiometric release of undesirable borane gaseous products. Some researchers suggest the formation of MgB12H12 [21] and similar higher borane compounds that would hinder rehydrogenation and reversibility, although these have not been observed consistently. The formation of Mg(B3H8)2 was also suggested [9,22]. However, for most alkali- and alkaline-earth borohydrides, the triborane, B3H8, decomposes to borohydride, BH4, and not vice versa [23]. It was found that the presence of an additional hydrogen source, such as MgH2, is essential for the selective BH4 → B3H8 reaction. In the absence of MgH2, Mg(B3H8)2 does form, but in lower amounts. A recent theoretical study accessed thermodynamic stabilities and the intrinsic strengths of various intermediates in the decomposition of borohydrides, emphasizing their decisive role in hydrogenation and dehydrogenation reactions [24]. Thus, the decomposition pathway of Mg(BH4)2 has been extensively studied through the past decade, adding knowledge of its hydrogen storage properties. The consensus on the decomposition pathway and the nature of the decomposition products has not been reached.
Rehydrogenation of completely decomposed Mg(BH4)2 requires high temperature (<400 °C), high H2 pressure (950 bars), and long reaction time (72 h) and yields > 11 wt% of H2 [25]. However, the decomposed Mg(BH4)2 at the step of the amorphous intermediates can be rehydrogenated at comparatively lower temperatures between 250 and 285 °C, pressure of 120 bar H2, and shorter reaction times. In this case, about 3 wt% can be cycled for at least three cycles [19]. This amount is lower than the weight loss observed for the decomposition step in this temperature range. One of the reasons behind the incomplete rehydrogenation at this step might be the formation of several decomposition products, only some of them being reversible back to Mg(BH4)2. The formation of MgO at the expense of Mg(BH4)2 might also be responsible for the reduced reversibility [26]. Therefore, to enhance the release of H2 on reversibility, it is important to understand the nature of the intermediate amorphous reaction products.
Decomposition and rehydrogenation reactions in hydrides have been typically studied with diffraction techniques in combination with thermogravimetric and calorimetric studies (TGA-DSC). The first method is an excellent approach that allows us to determine the phase composition and crystal structure of the crystalline phases in the samples. In situ studies, in particular at synchrotron radiation facilities, allow for the following changes with sub-minute time resolution in wide temperature and hydrogen pressure ranges. The TGA-DSC methods allow us to differentiate between various thermally induced events, for example, phase transitions, melting, and decomposition steps, and to evaluate the amount of released gaseous products as well as to assess the thermodynamic and kinetic aspects of the reactions. This combination of the two is, however, not usually sufficient to characterize the reactions with amorphous intermediates. Thus, other techniques, in particular various spectroscopies combined with DFT calculations, have been applied for additional structural characterization of the decomposition of Mg(BH4)2 and similar compounds. Vibrational spectroscopies, such as Raman scattering, Fourier-transformed infrared (FTIR) and inelastic neutron scattering (INS), identify molecular bonds and lattice vibrations. The majority of the FTIR studies on Mg(BH4)2 report the data in the mid-infrared (mid-IR) region as summarised by us earlier [10]. Vitillo et al. also presented far-infrared (far-IR) data at room temperature [18]. Pure Mg(BH4)2 exhibits well-defined and described IR spectra. The ex situ mid-infrared measurements of the amorphous decomposition products showed broad features in the B-H bending and stretching regions partially leading to inconclusive results [18,19,26]. Measurements at lower temperatures might reduce thermal effects and narrow the absorption bands. Our attempts to access these phases with in situ (and ex situ) Raman spectroscopy revealed strong fluorescence of the samples with 532 nm [20], but also with 457, 633, and 785 nm laser wavelengths (unpublished results). X-ray absorption spectroscopy (XAS) is also a suitable tool to study the local order around a chosen element. XAS has, at times, been applied to follow the local structure of additive, catalysts and dopants in Mg(BH4)2 upon H2 desorption and absorption reactions [19,27]. In this case, the elements of interest are mostly transition metals, and hard X-rays are employed with rather simple experimental set-ups and good quality results. XAS measurements at B K-edge of the decomposition phases of Mg(BH4)2 and other borohydrides are scarce, although they could shed more light onto the local structure of boron anions in hydrogenation and dehydrogenation reaction products. The reason for this is the use of soft X-rays and an ultra-high vacuum for the most typical experimental setups, posing notable experimental challenges. In addition, Mg(BH4)2 is air-sensitive and special care must be taken in order to not introduce contamination during the sample preparation and transfer or into the measurements. Ray et al. have studied the H2 adsorption reaction in MgB2 with B K-edge XAS but found only direct formation of BH4 anions, which is certainly not the case of the reverse dehydrogenation reaction [28]. In the subsequent work, the team investigated the decomposition of Mg(BH4)2 with B K-edge XAS and concluded that γ-Mg(BH4)2 followed multiple reaction pathways in both the dehydrogenation and rehydrogenation processes [29]. Sahle et al. [30] employed inelastic X-ray scattering at the B and Mg edges for in situ studies of Mg(BH4)2 decomposition. They observed the formation of reaction intermediate(s) at 300 °C upon hydrogen release without the occurrence of stable boron compounds such as amorphous boron or MgB12H12. Higher boranes and MgH2 were found between 300 °C and 400 °C with the boron atoms in similar electronic states to that in B12H12 anions, with subsequent decomposition into the constituting elements afterwards.
The described knowledge gaps in the nature of boron-based amorphous intermediates prompted the current study. In this work, the reaction products formed at different reaction steps during the partial decomposition of γ-Mg(BH4)2 in the temperature range 240–400 °C have been studied by using combined thermogravimetric analysis and differential scanning calorimetry (TGA-DSC), powder X-ray diffraction (PXRD), and synchrotron-based in situ FTIR (SR-FTIR) and X-ray absorption spectroscopy (XAS), in order to identify the intermediate reaction products in the decomposition reaction of γ-Mg(BH4)2. We measured these samples with SR-FTIR in the mid-IR and far-IR regions at cryogenic temperatures with the aim of solving the problem of peak broadening in the RT FTIR spectra and enable comparison of the results with the theoretically predicted spectral modes of various BxHy clusters [18,24]. The far-IR spectra of H3BO3 (boric acid) are reported here, to the best of our knowledge, for the first time and can be used as a reference for future studies in the related compounds. X-ray absorption spectra are expected to shed more light on the local structure of boron atoms in the intermediate decomposition phases of Mg(BH4)2.

2. Materials and Methods

Commercial gamma magnesium borohydride (γ-Mg(BH4)2) (Sigma-Aldrich, Sigma-Aldrich, St. Louis, MO, USA, 95%) was used to prepare the samples.
Amorphous boron powder (B) (purity >95%, sigma-Aldrich), boric anhydride (B2O3,) (>99.98, Sigma-Aldrich), magnesium boride powder (MgB2) (>99%, boric acid (H3BO3) (ACS reagent, >99.5%, Sigma-Aldrich), and lithium borohydride (LiBH4) (>90%, Sigma-Aldrich) were used as references.
Thermogravimetric analysis combined with differential scanning calorimetry (TGA-DSC): partially decomposed samples of Mg(BH4)2 were obtained by heating the as received compound at different decomposition temperatures between 240–400 °C in the instrument for thermogravimetric analysis combined with differential scanning calorimetry TGA/DSC 3+ from Mettler Toledo. The samples were heated at 5 °C/min up to the required temperature and then left to decompose isothermally until no weight loss was observed. The experiments were carried out in Ar flow of 200 mL per minute in alumina (Al2O3) crucibles with pierced lids. The sample was filled into crucibles inside a glove box and transferred into the TGA-DSC that was placed outside the glove box within a few seconds.
Powder X-ray diffraction (PXRD) data were collected at a Bruker D8 Advance diffractometer with copper X-ray source of wavelength (λ) 1.5418 Å. The samples were sealed in glass capillaries whilst inside an Ar atmosphere, and measured in the range 2ϴ = 11–60° with a constant rotation rate of 120 rpm. Data were collected in steps of 0.01° with 0.2 s per step.
Synchrotron X-ray absorption spectroscopy (XAS) data were collected at the dipole magnet RGBL beamline at the Helmholtz-Zentrum Berlin für Materialien und Energie synchrotron radiation facility (Berlin, Germany). The samples were loaded onto stainless-steel sample holders covered by indium tape inside the Ar-filled glove box. Then, they were transferred into the measurement chamber without contact with air. The measurements were performed in an ultra-high vacuum, in total electron yield (TEY) mode. The samples were measured at 45° to the X-ray beam, in 160–260 eV range with 0.4–0.5 eV resolution and 10 s per step.
The experimental values were obtained as the total electron yield (TEY). Incident flux, I0, was obtained from the measurements of reference Au foil: (i) the measured TEY from the Au foil was normalized to the ring current, (ii) the TEY Au signal was normalized to the absorption cross-section of gold:
f l u x ( I 0 ) = T E Y ( A u ) { r i n g   c u r r e n t } · σ a A u
Once ( I 0 ) was obtained, the total absorption cross-section for the sample ( σ a s a m p l e ) was calculated by dividing the normalized TEY of the sample to the ring current by the incident f l u x ( I 0 ) as given below:
σ a s a m p l e = T E Y ( S a m p l e ) { r i n g   c u r r e n t   s a m p l e } · f l u x ( I 0 )
Next, the absorption cross-section for each sample was modified by subtracting the user-defined background by taking some points from the pre-edge and the post-edge region of the spectrum. The intensity of the spectrum thus obtained was then normalized between [0, 1] to get the final spectrum.
Synchrotron Fourier-transformed infrared spectroscopy (SR-FTIR) were performed at IRIS beamline of the the Helmholtz-Zentrum Berlin für Materialien und Energie synchrotron radiation facility (Berlin, Germany). A first set of mid-IR and far-IR spectra was recorded in the temperature range RT-10 K on: (i) two reference materials: H3BO3 and Mg(BH4)2; and (ii) Mg(BH4)2 decomposed at 260 °C and 280 °C. The samples were diluted in CsI for the mid-IR measurements and in wax for the far-IR measurements. The mid-IR spectra were obtained with the globular source of a Bruker Vertex instrument whereas a synchrotron beam was used to record the far-IR spectra. Every spectrum was obtained with a spectral resolution of 4 cm−1 averaging 1024 scans. All the pellets have been prepared in a MBraun glove box where the level of water and O2 were kept <0.5 ppm and <1.5 ppm, respectively, during use but exposed to air for a short time while transferring them to the cryostat.

3. Results

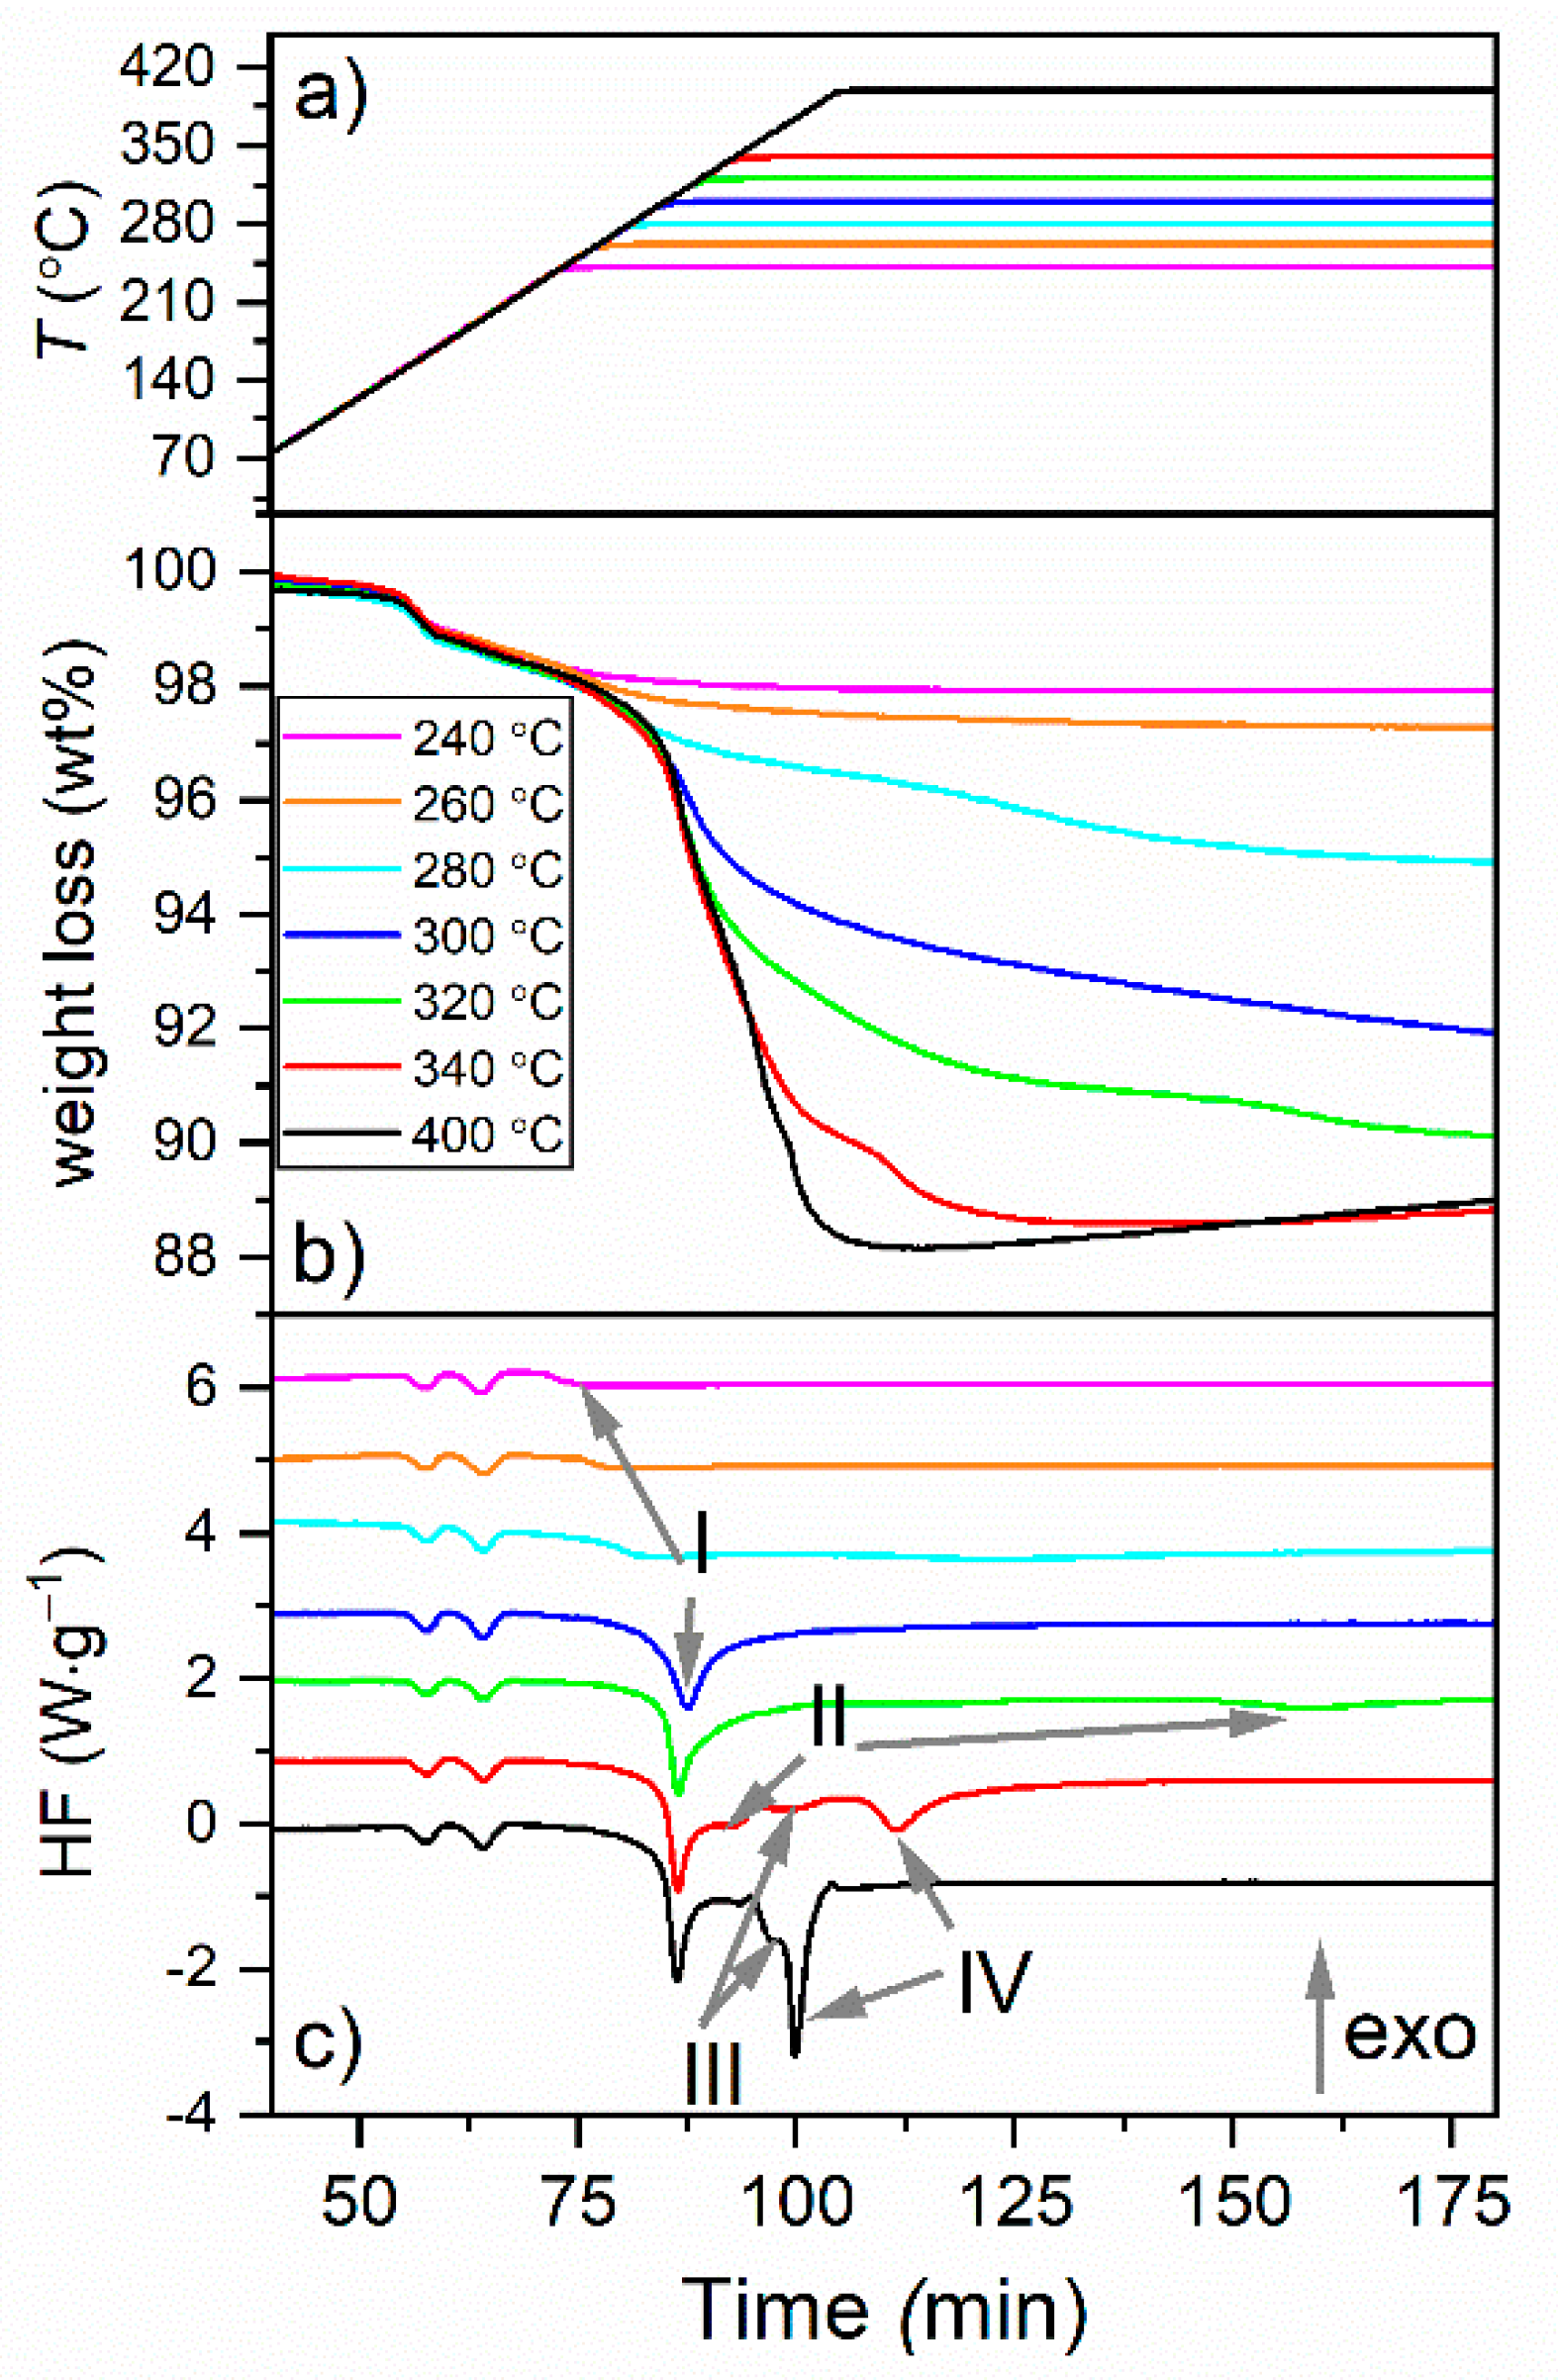
3.1. TGA-DSC Analysis of Decomposition of γ-Mg(BH4)2

The TGA-DSC profiles of the γ-Mg(BH4)2 decomposition in Ar flow are presented in Figure 1 and indicate the following:
The weight losses distinctively indicate several reaction steps in the decomposition reactions (Figure 1a).
  • Some weight loss, ~0.5 wt%, occurred between RT and the phase-transition temperature region (Tons = 152 °C).
  • ~0.8 wt% occurred during the two phase transitions at 163 and 196 °C.
  • The number of the reaction steps is the same for the 240 °C and 260 °C isotherms. The DSC profiles of these reactions show the onset of the first decomposition reaction peak (I). This peak is more pronounced in the 280 °C isotherm and is complete in the 300 °C isotherm. Thus, similar reaction products can be expected after the decomposition at 240 and 260 °C, and slightly different at 280 °C. These reaction products decompose as shown by the strong exothermic peak at 305 °C. Moreover, since a larger weight loss was observed at 260 °C than that at 240 °C, we could expect the presence of Mg(BH4)2 in the latter sample due to the incomplete decomposition reaction at this step. The final weight loss for reaction step I was, thus, observed as 8.8% after decomposition at 300 °C for 5 h when the step was complete.
  • The DSC profile of the isotherm obtained at 320 °C shows the onset of yet another peak (II). The weight loss at this temperature was larger (9.9 vs. 8.8% than that at 300 °C) Thus, the reaction products are expected to be somewhat different after the 320 °C isotherm.
  • Between 320 and 340 °C, the reaction step II was completed, and two new reactions corresponding to the thermal events III and IV occurred where the latter one was incomplete. The reaction step IV was completed during the decomposition at 400 °C. Thus, yet another and different reaction products can be expected after the decomposition after 340 and 400 °C.
  • The most significant weight losses occurred during the decomposition at 300 and 340 °C. These should correspond to the formation and decomposition of MgH2.
  • The decomposition at 400 °C was not complete as it resulted in 12 wt% weight loss compared to the 14.9 wt% of the theoretical content of H2. A significant release of borane gases is, thus, not expected because it would correspond to larger weight losses with respect to the theoretical value. As all MgH2 was decomposed at this stage, the remaining hydrogen might be trapped in higher borane intermediates.
  • Some isotherms showed weight gain at elevated temperatures. This could likely be related to oxygen contamination and formation of MgO. For these isotherms, the weight loss values (summarized in Table 5) refer to the maximum observed values.
  • The TGA-DSC results are discussed in Section 4 after the analysis of the decomposition phases obtained at each of the steps.

3.2. PXRD Analysis of the Reaction Products

The powder X-ray diffraction patterns of the starting and decomposed samples, recorded ex situ, are shown in Figure 2. The results reveal the absolute prevalence of γ-Mg(BH4)2 in the starting material, presence of ht-Mg(BH4)2 after the 240 °C isotherm [20], but no crystalline phases after decomposition at 260 °C. MgH2 appeared at 300 °C, though traces can be distinguished already after 280 °C, and decomposed into Mg after 320 and 340 °C. In addition, MgO was observed in the patterns of the samples treated at and above 320 °C. A broad background that might be related to amorphous phases was observed in some of the patterns.

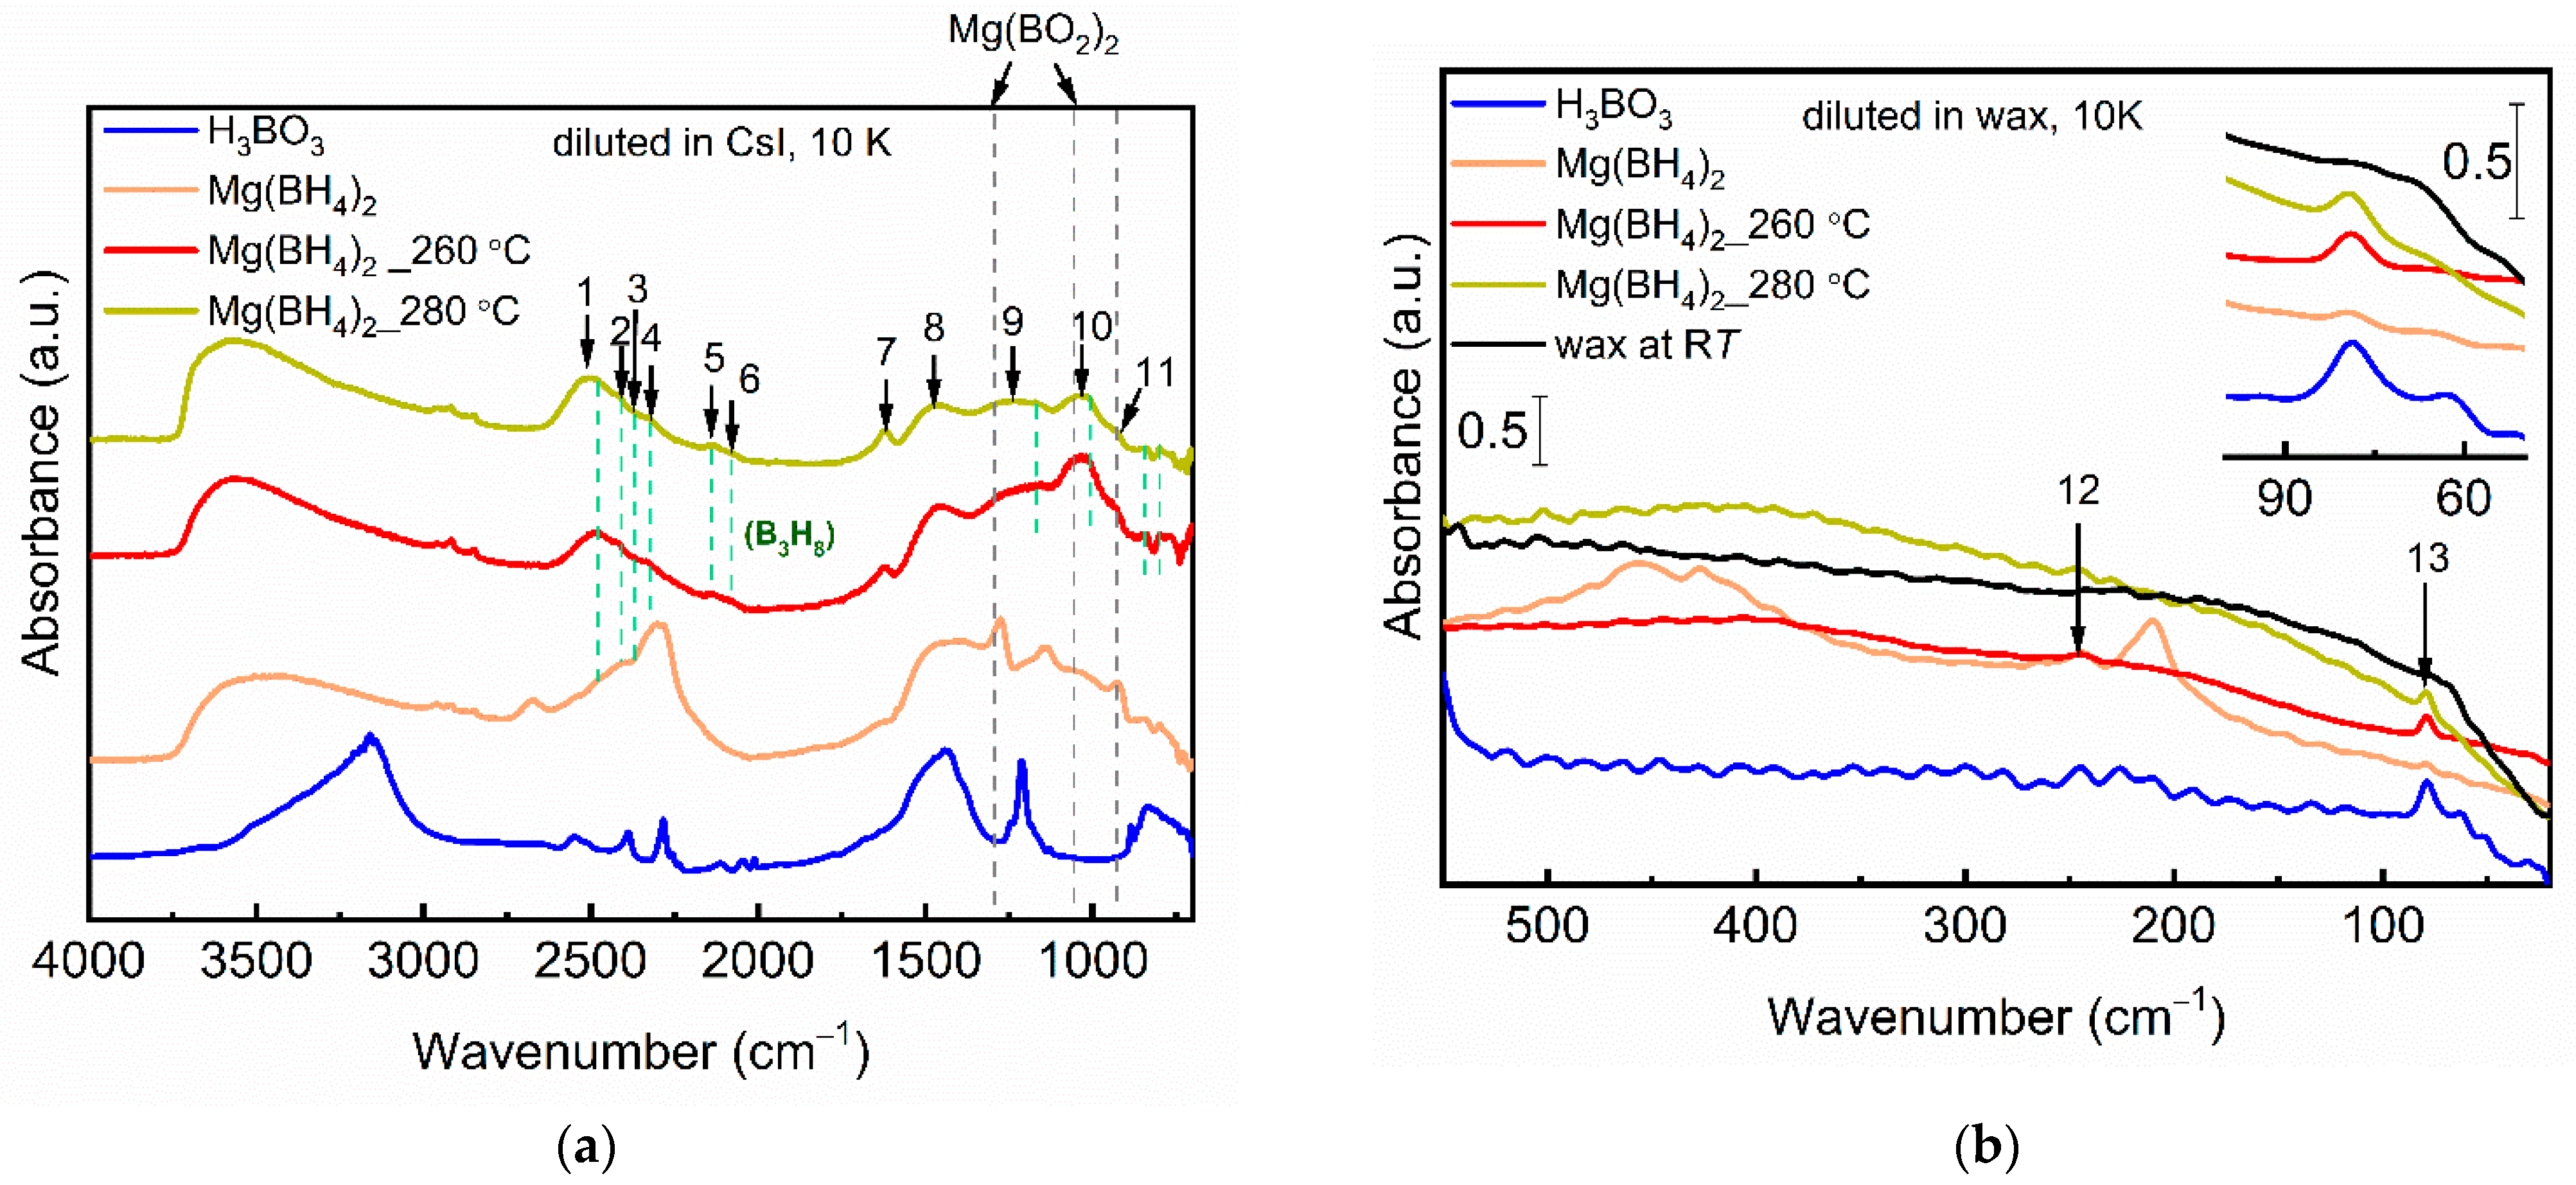
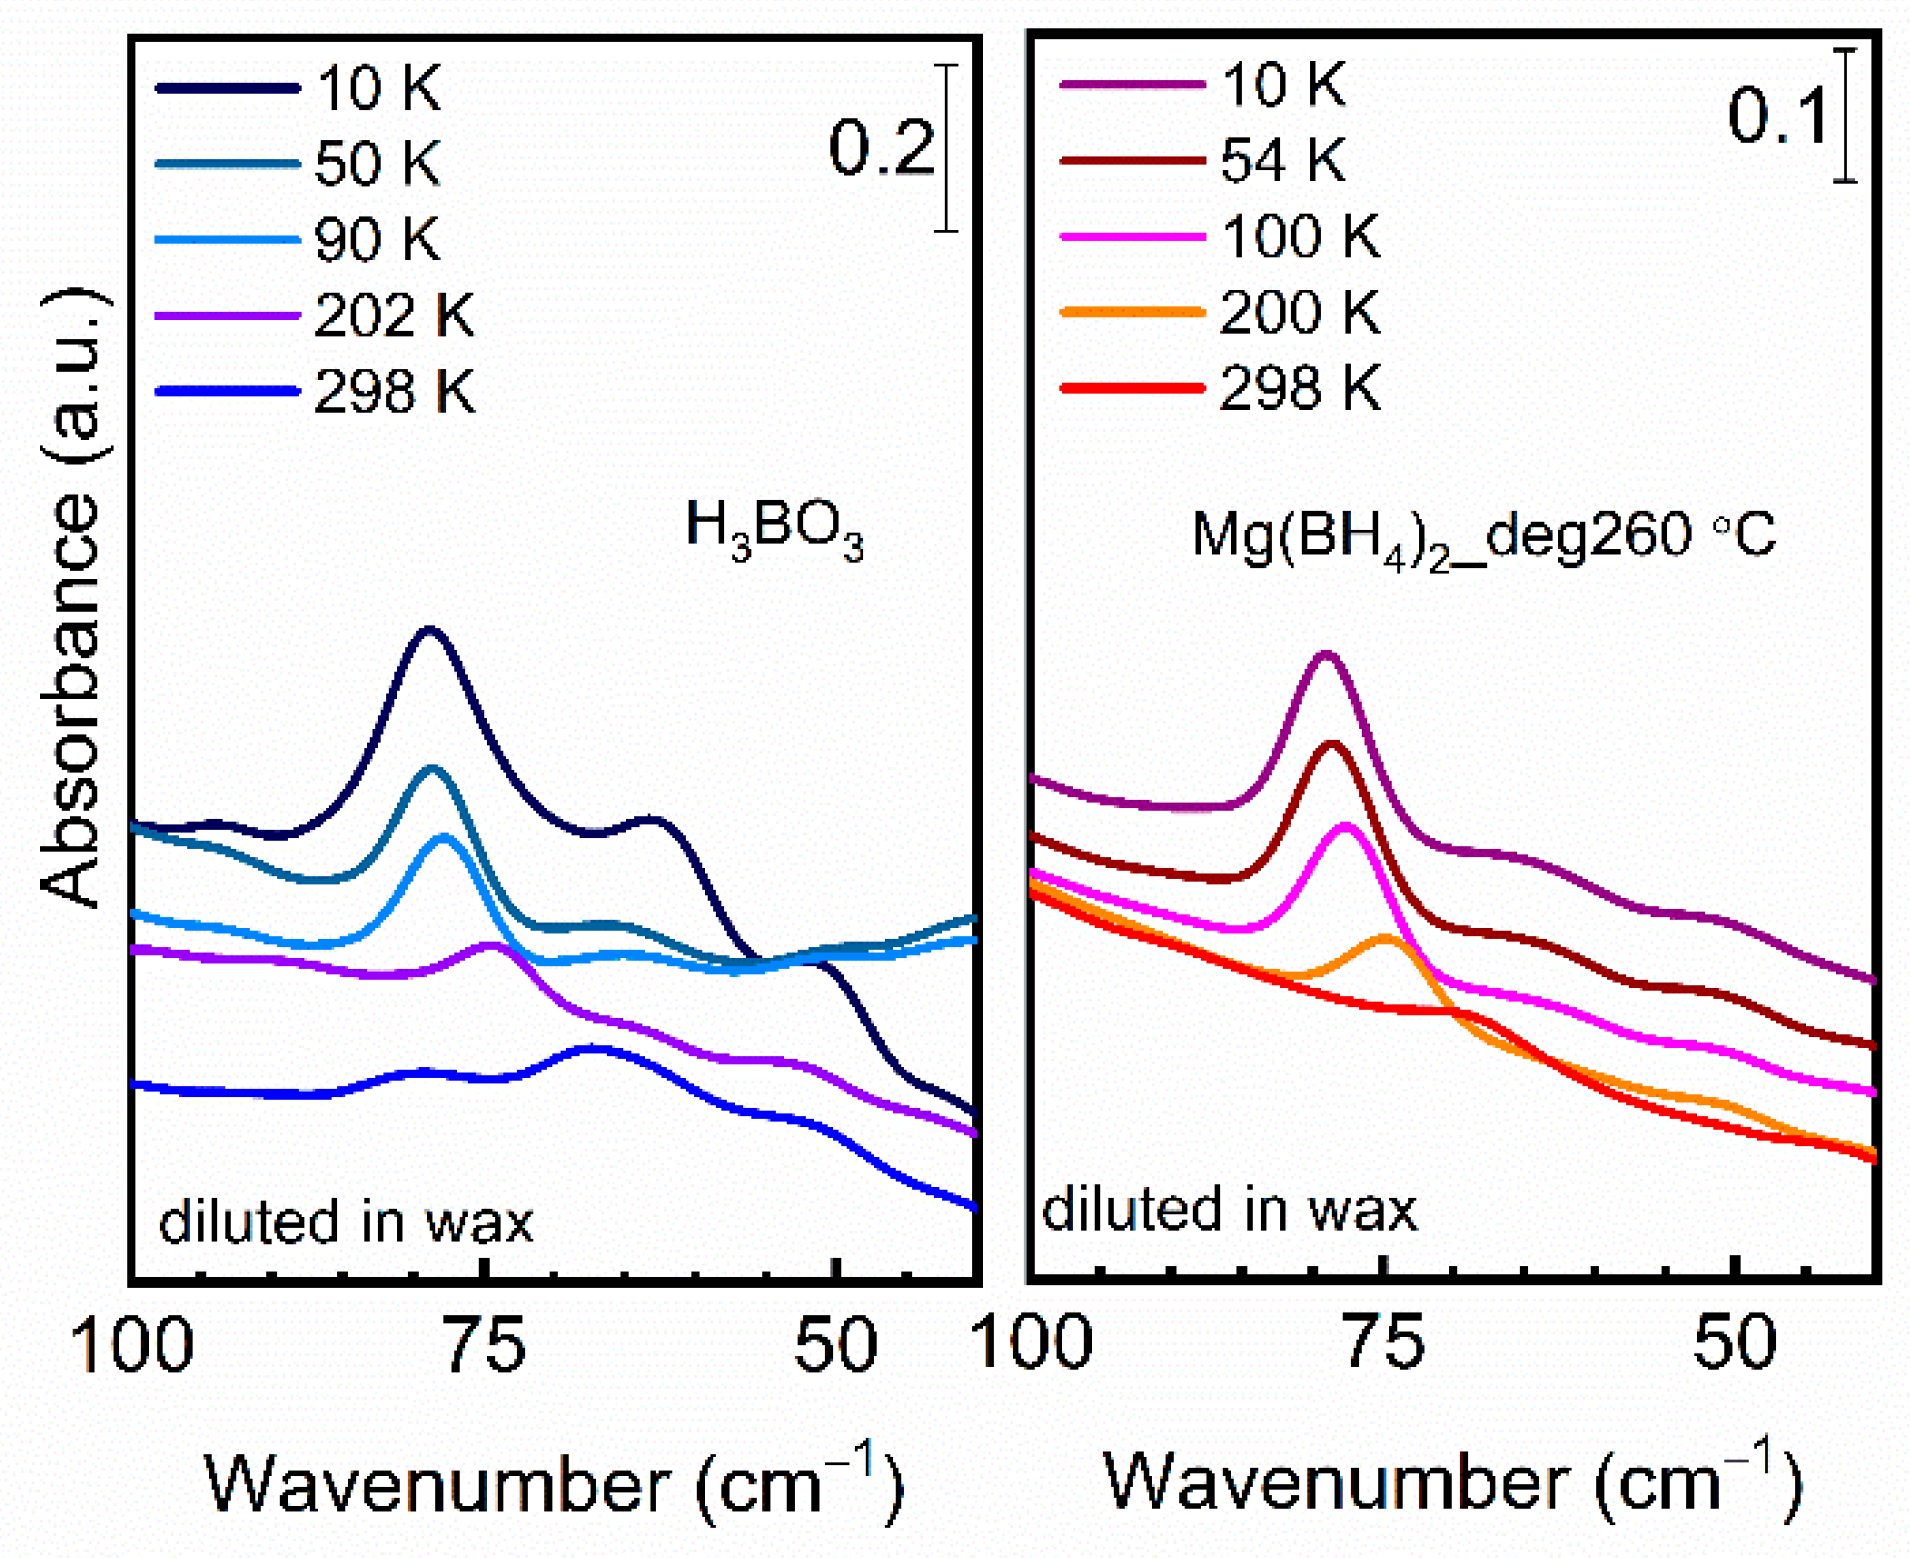
3.3. Synchrotron FTIR Analysis of the Decomposition Reaction Products

The samples measured with SR-FTIR included pristine Mg(BH4)2, the borohydride decomposed at 260 °C and 280 °C, and H3BO3 as the reference for oxygen-related impurity phases. Mid-IR and far-IR spectra, recorded at 10 K, of pristine Mg(BH4)2 and after its decomposition at 260 °C and 280 °C along with the spectrum of H3BO3 (blue curve) are reported in Figure 3.
The spectra of H3BO3 were recorded as a reference for possible impurities. In addition, upon contamination with atmospheric water, Mg(BH4)2 can hydrolyze to Mg(BO2)2 as [31]:
Mg(BH4)2 + 4H2O → Mg(BO2)2 + 8H2
In H3BO3, boron atoms are surrounded by three oxygen atoms in planar coordination (three coordinated boron, Btri). In magnesium diborate Mg(BO2)2, boron bonds with four oxygen atoms in tetrahedral coordination, Btetra. The anion consists of two BO4 tetrahedrons with an oxygen bridge. In tri-, tetra-, penta-, and hexaborates both Btri and Btetra are present in various combinations [32]. Table 1 lists the normal modes of these two anions whereas Table 2 shows the list of the peaks in experimentally observed FTIR spectra of the two compounds.
The most prominent differences between the H3BO3 and Mg(BO2)2 · 3H2O are the peaks at 1423 (s) and 1193 (vs) cm−1 (for H3BO3) and 1297 (vs) and 1042 (vs) cm−1 (Mg(BO2)2 · 3H2O). These features are taken here as the fingerprint for the presence of such groups in the samples. The peak positions observed in the spectra of H3BO3 are blue-shifted with respect to the literature data. This is likely associated with the difference in the diluting matrix, CsI here and KBr in Ref. [32]. In the far-IR spectrum of H3BO3, only one peak is observed at 79 cm−1 that, due to its low energy, could be assigned to the translational motions of the whole borate unit.
The mid-IR spectrum of Mg(BH4)2 is dominated by the characteristic peaks, due to stretching and bending of B-H bonds in BH4 ions with distorted tetrahedral local symmetry [10]. These peaks are listed in Table 3. The symmetric stretching ν1 is probably too weak, even though it can be observed theoretically, whereas the asymmetric stretching ν4 is visibly split due to the symmetry distortion of the BH4 tetrahedra in Mg(BH4)2.
In the far-IR spectrum of Mg(BH4)2 (Figure 3b, orange curve), only the weak feature at 79 cm−1 is similar to the one in H3BO3. Other peaks are similar to those reported earlier [18]. It can be mentioned that most of the measurements on borohydrides and similar compounds reported in the literature have been performed using attenuated total reflection (ATR) sampling, a method where no sample dilution is required. In this study, the samples were measured in the transmission mode, diluted in CsI or wax, and thus, the effect from the matrix can be expected in the spectra in addition to a slight shift of the peaks and slightly different intensity ratios between higher-energy and lower-energy modes [34]. For example, the broad absorptions at 3600–3300 with 1620 cm−1 (water) and the weak peaks at ca. 2900 cm−1 (C-H bonds of organics) are most probably related to the impurities in the matrix.
In the decomposed samples (Figure 3), the peaks due to BH4 disappeared to the benefit of B-H vibrations of “higher” boron hydride compounds. The peaks after decomposition at 280 °C and 260 °C are very similar and are listed in Table 4. The features of H3BO3 might be partially responsible for the observed peaks 8–10, however the spectra obviously contain contributions from other species. Notably, the weak features at 2130 and 2075 cm−1 not present in the pristine Mg(BH4)2 or H3BO3 / Mg(BO2)2 are suggesting that the boranes with bridged hydrogen atoms in the structure are formed at this stage. These could be (B2H7), (B3H7)2− [22], (B3H8) [22,35,36], (B4H10)2− [18], etc. These peaks are accompanied by the peaks at > 2300 cm−1, which are characteristic for the stretching of terminal hydrogen atoms of such boron hydride anions and Mg-H-B stretching [37].
There are several high-frequency peaks above and below 2400 cm−1 (1–4) corresponding to the stretching modes of bonds involving boron and terminal hydrogen atoms, B-Hterm. This was observed in case of (B3H8) ions that comprise different types of boron atoms: two equivalent at the base (B1) and one in the third corner (B2) of an isosceles triangle [23]. All of the three atoms have two terminal hydrogens, but the bonds have slightly different energy roughly divided in the regions above and below 2400 cm−1. In CsB3H8, the B1-Hterm stretching was found at 2360–2325 cm−1, and the stretching of B2-Hterm at 2405–2467 cm−1 [23] with 2405 cm−1 being the most prominent feature. The stretching of the bridged hydrogens (B-H-B) was observed at 2120 and 2080 cm−1. In η2-Mg(B3H8)2(THF)2, the respective absorptions were recorded at 2383, 2432 for the terminal, and 2115 and 2069 cm−1 for the bridged units [37]. In addition, the 2280 and 2335 cm−1 peaks were assigned to bridged Mg–H–B stretching. Neither work reported vibrations above 2435 cm−1 for the (B3H8). The observed absorptions correspond well with the modes 1–6 in Table 4, but we are left with 2510 cm−1 unaccounted for and an absence of a feature responsible for the Mg-H-B interactions. In addition, the lower frequency modes of (B3H8) might be referred from the broad absorptions in Figure 3a. However, also in this region, a few unaccounted-for modes remain. In particular, H-B-H bending modes were observed at 1168, 1000, 802, and 782–732 cm−1 in ref. [23] with no peaks at 1460, or 930 cm−1, as in our study. (B2H7) ions have distinct features at 2405, 2050 (broad), and 1030 cm−1 (sharp) [38] but not in the other peaks observed here. In addition, this anion is very unstable and has only one hydrogen bridge, hence one corresponding vibration. Some boranes and borane anions, such as B5Hx (x = 9, 11) have strong IR absorptions in the region 1620–1400 cm−1 assigned to B-H bending modes [39,40,41]. At the same time, the stretching modes of terminal B-H in the pentaboranes are shifted to higher frequencies with respect to the modes 1,2 in Table 4 (>2548, and 2460 cm−1), one of the ν(B-H-B) is located below 2000 cm−1 (clearly absent in Figure 3a); a few prominent lower frequency modes do not correspond well with features 9–11 from Table 4 (1164, 1043, 951, 899 cm−1 for B5H11 [39] and 1045–1035, 900 cm−1 for B5H9 [40]). In B4H10, the most prominent structural feature is the dual pair of bridges at 2120 cm−1 holding the molecule together [39]. The intensity of these modes is as strong as ν(B-H), which is certainly not the case for the weak features 5,6. The stretching of terminal B-H2 is found at 2550 and 2455 in tetraborane, the prominent low-frequency absorptions include 1380 (s), 1145 (s), 1067 (m), 967 (s) cm−1, and a group at 850 cm−1. (B4H10)2− [18] is proposed as a plausible intermediate. It does not have bridged hydrogens, but its other theoretically calculated modes might correspond to the spectra observed here. The data in Table 4 does not correspond to the FTIR features of the B6H9 anion [41].
The broad absorption in the 2440–2630 cm−1 region can include stretching of BnHn2− (n = 6, 8, 9, 10, 11, 12) anions [42]. B9H9: 2529, 2450, and 2415 cm−1, B12H12: 2485 (strong, s), 1071 (m), and 719 (m) cm−1 [43]; B10H102− salts have a very strong absorption at 2470 cm−1 (equatorial B-H stretch) with a shoulder at 2530 cm−1 (apical B-H stretch); 1015 cm−1 and 1070 cm−1 were attributed to cage deformational (ibid). B6H6 has features at 2432, 1051, and 731 cm−1 [43]. In summary, closo-boranes BnHn2− (n = 6, 8, 9, 10, 11, 12) do not have peaks in the region 1200–2500 cm−1 [42], and at ca. 900 cm−1.
In summary, the FTIR spectra of the Mg(BH4)2 decomposed at 260 °C and 280 °C indicate: (i) formation of the same species at both temperatures; (ii) formation of several anionic species with the most probable candidates being B3, B5 borohydrogens with bridged H-B-H groups; (iii) the assignment is hindered by the presence of borate impurities.
We observed two different behaviors for the mid-IR and far-IR spectra upon decreasing the temperature. In fact, while the position and FWHM of the mid-IR bands remain almost unchanged in the whole temperature range (not shown), all the far-IR signals showed a decrease in their FWHM (see Figure 4 where the effect of the temperature on the band at 70 cm−1 is shown).
Unfortunately, the extinction coefficient of the species originating from the decomposition of Mg(BH4)2 (besides borates) was so low in the far-IR region that their signal remained very broad and not so clearly distinguishable from the background also at 10 K, although we have used the highest concentration possible based on sample availability. It would be important to repeat the experiment using pure samples without any diluent.

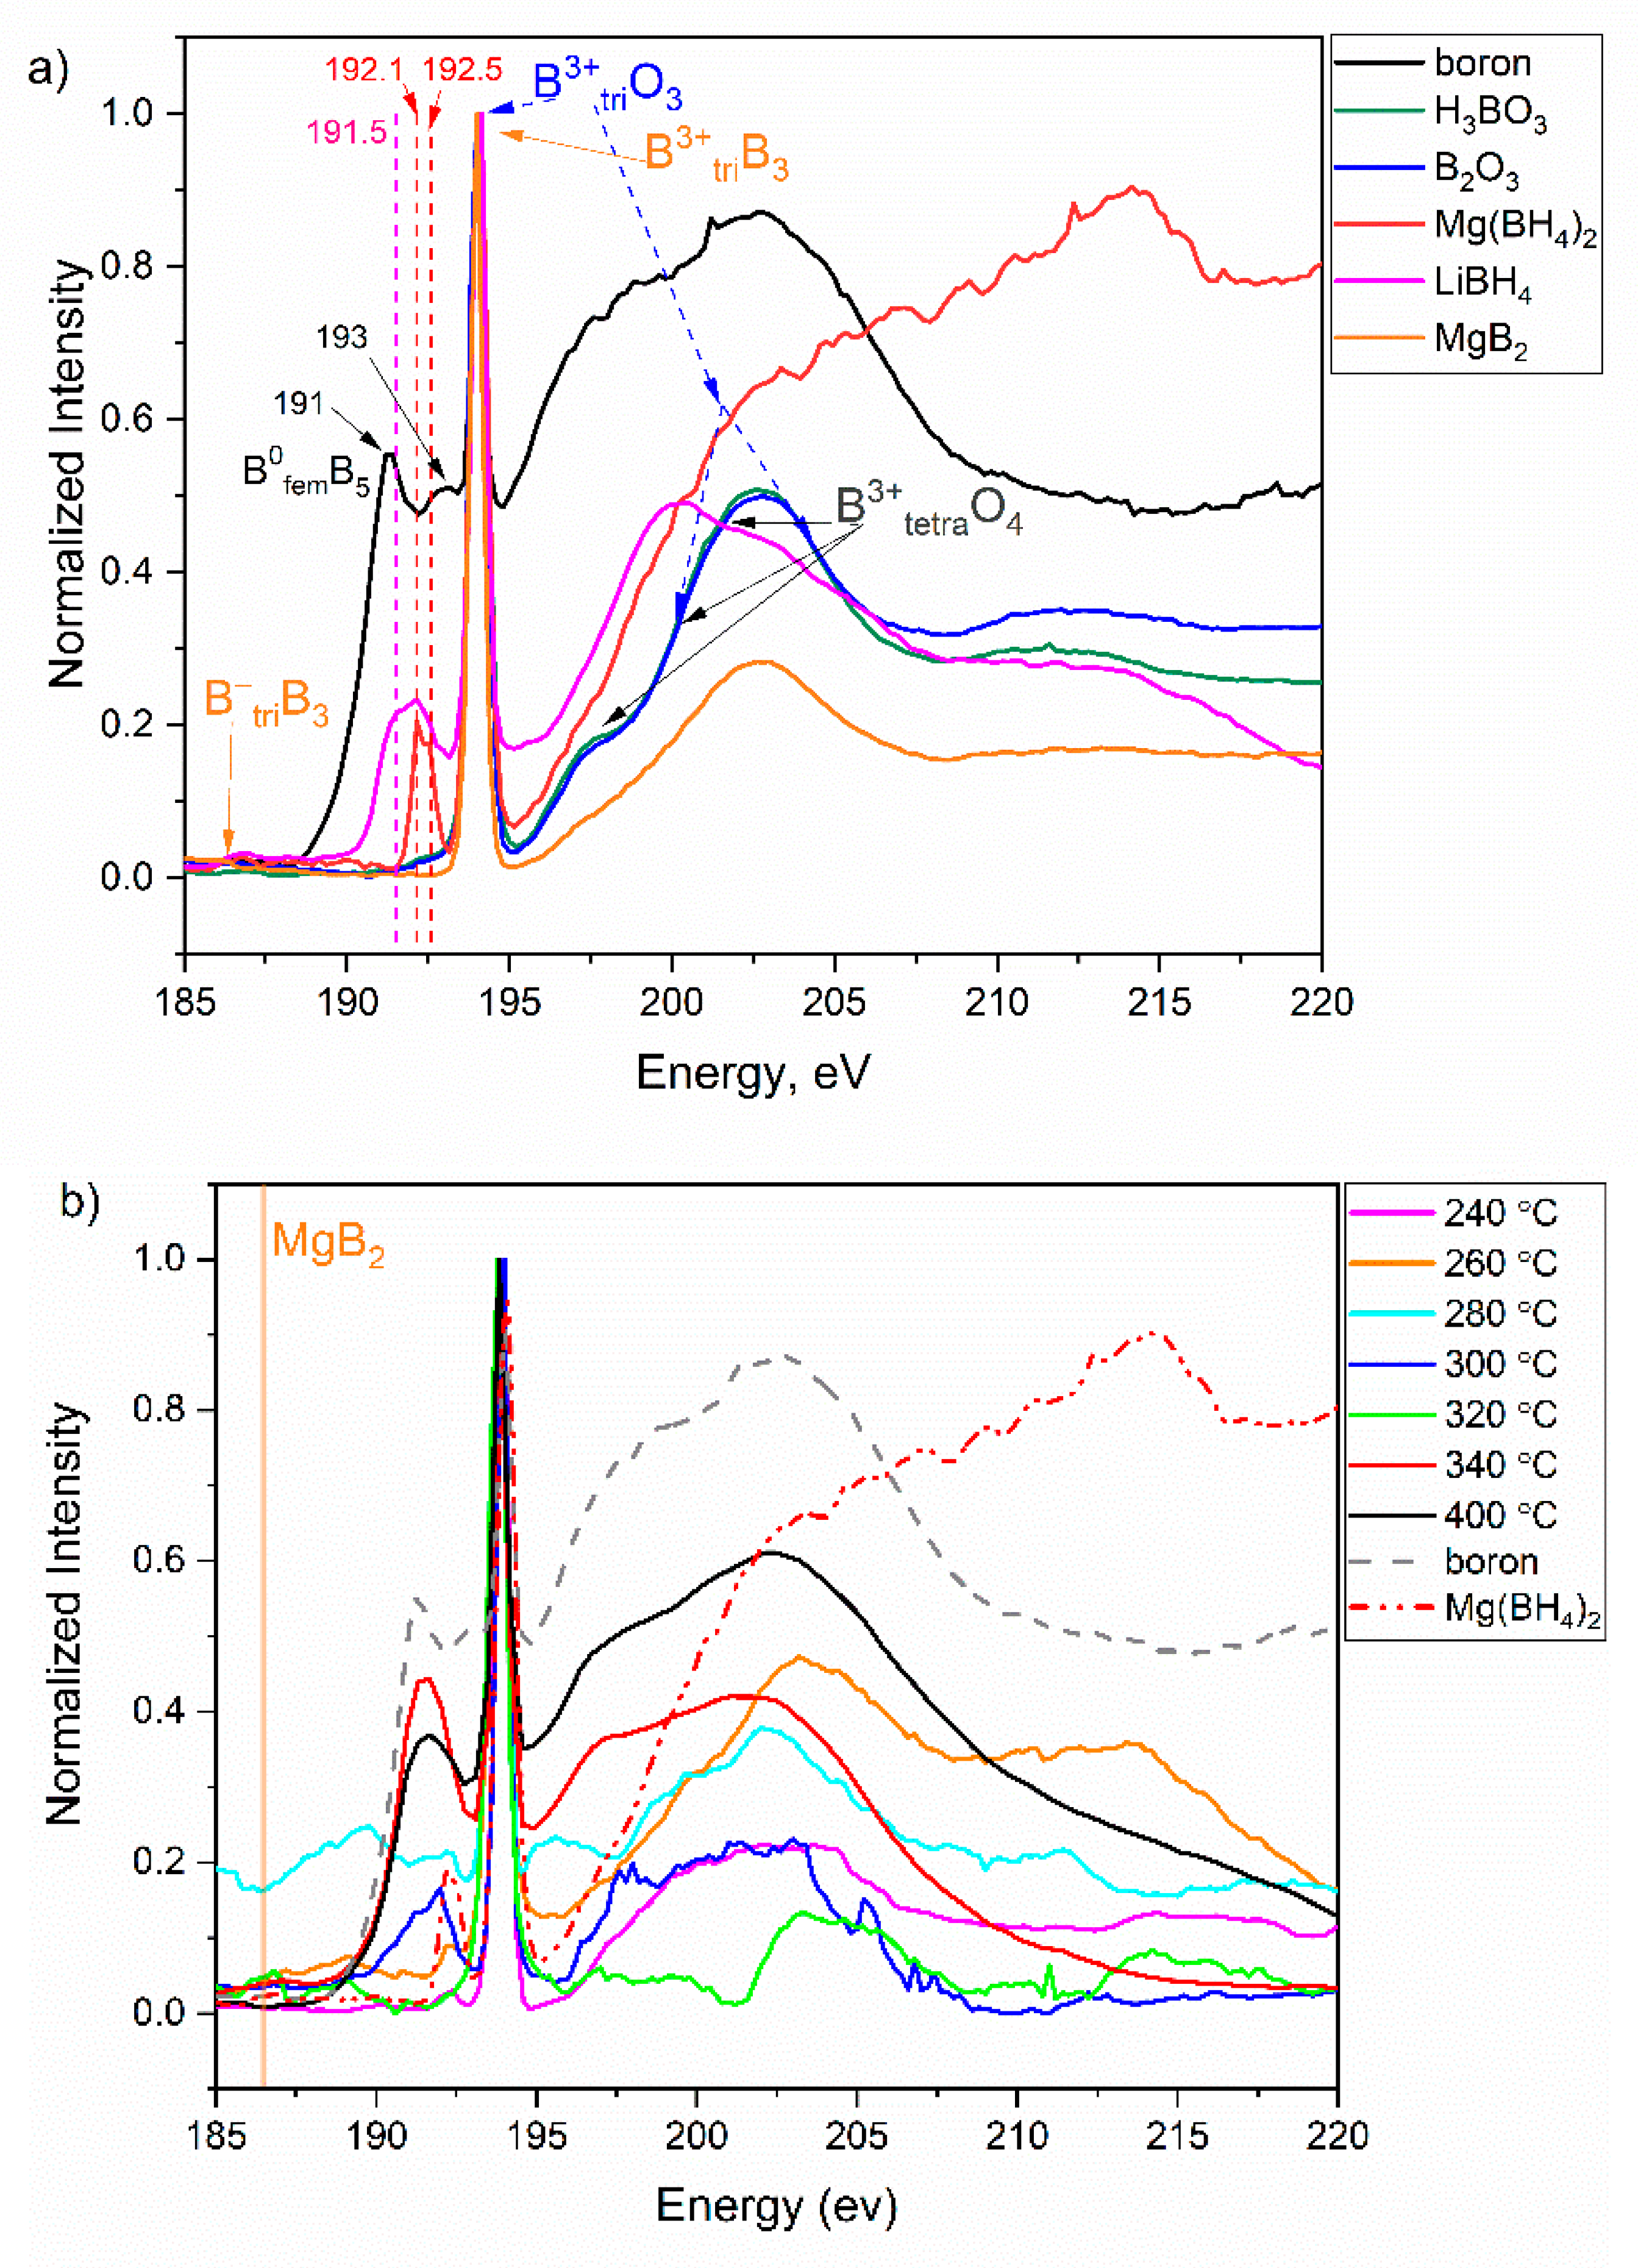
3.4. Soft X-ray Absorption Spectroscopy at the B K-Edge of the Decomposition Products

XAS measurements were carried out with a TEY approach that is based on measuring the sample current produced by Auger and photoelectrons. For low Z-number elements and concentrated samples, the TEY mode is favorable compared to the total fluorescence yield mode (TFY) as the fluorescence becomes greater than the Auger yield of elements with Z > 30. Additionally, the TFY spectra can be distorted due to self-absorption in concentrated samples. On the other hand, the TFY method is more sensitive to bulk properties as it probes about 200 nm–5 μm Å [28], whereas the TEY method is determined primarily by the penetration ranges of Auger electrons that have ranges of tens to hundreds of nm [44]. The probed sample thickness, Rp, can be approximately determined through the relation:
Rp ≈ 1000·E1.4/ρ
where E is an initial electron energy in keV, ρ is the material’s density in g/cm3 and Rp is given in nm. According to this relation, the samples probed at the B K-edge energy range can be estimated as 14–28 nm for porous γ-Mg(BH4)2, 10–20 nm for the denser phases of Mg(BH4)2 and perhaps for the MgBxHy intermediates, and 5–11 nm for H3BO3, etc., i.e., in the range from a few to a few tens of nanometers.
For the qualitative data analysis, spectra of Mg(BH4)2 decomposed at various temperatures were compared with each other and the spectra of the reference compounds: boron (B), boric acid (H3BO3), boron oxide (B2O3), fresh gamma magnesium borohydride (γ-Mg(BH4)2), lithium borohydride (LiBH4) and magnesium boride (MgB2). Figure 5a,b show the experimental NEXAFS B K-edge spectra for the references and the samples, respectively. The XAS spectra of boric acid and boron oxide were analyzed as the reference for potential impurities in the spectra of Mg(BH4)2 and MgBxHy. In many compounds with boron in trigonal coordination and an empty 2pz orbital, a strong, sharp and low energy peak has been observed due to the 1s → 2pz transition [45]. On the other hand, in high symmetry environments, such as icosahedra of elemental boron, polyhedra of borane and carborane complexes, and tetrahedral coordination, where 2pz hybridization occurs, such a feature is not usually found, and the spectra are mostly characterised by a broad band at higher energy. Blau et al. [46] have proposed that NEXAFS spectra of boron with triply degenerate 2p orbitals should exhibit only one broad peak, whereas two peaks can be expected where 2p orbitals would split and 1s → 2pz transition is possible. The latter transistion should be expected as a sharp feature at a lower energy.
Thus, in Btri-O planar anions, the X-ray absorption at the boron K-edge promotes 1s → 2pz (π*) electronic transitions characterized by a lower energy sharp prominent peak at 194 eV. In addition, a weak peak is observed at 197.5 eV stemming from a dipole-forbidden transition 1s → a1’ σ* MO formed by B3s, O2s and O2p. The forbidden transition activates due to the distortion of BO3 from the perfect planar coordination as the O-B-O angles can vary in the 119.6–200.4° region. The second allowed broad feature around 198–205 eV consists of at least three distinct peaks at 200, 202 and 204 eV. They can be assigned either to the transitions of B 1s electrons to unoccupied B-O sigma antibonding (σ*) orbitals of e’ (B2px + B2py + O2s + O2p) symmetry [47] or to B3p and B4p rather than 2p interactions [48]. The NEXAFS spectra of Btetra-O anions are characterized by the peaks at 198 eV (strong, B1s → *σt2 (B2p + O2p) transition) and 200 eV (B1s → a1 (B2s + O2p) transition). The broad feature at 201.5 eV may be assigned to B1s → *σt2 and B1s → *σa1 where the distortion can lift the t2 degeneracy and cause further splitting or broadening of the peak [47]. It has been noted that even the compounds where only Btetra-O should nominally be present, the features of Btri-O can be observed, as this coordination is more favorable near the surface and at defects [47,49]. The spectra of H3BO3 and B2O3 shown in Figure 5a predominantly include the features of Btri-O.
Magnesium boride, MgB2, has a hexagonal layered structure (space group P6/mmm) with boron honeycomb sheets interlaying with the Mg triangular sheets. Thus, boron atoms are covalently bound to three neighboring B in-plane and have a formal oxidation state −1. Hybridization of px and py orbitals of B atoms results in the formation of two strong covalent σ bonds. In addition, B pz orbitals form a π-bond with the 3s states of Mg [50]. Theory predicts an edge at 186.8 eV as a result of 2pxy unoccupied final states above the Fermi level of MgB2 [28], but a very weak peak was observed here (Figure 5a, orange curve). According to Ray et al., this can be explained by oxidation of the sample. Indeed, the spectrum of MgB2 is dominated by the peak at 194 eV [28]. The peak at 186.8 eV, however, was considered a fingerprint for the formation of MgB2.
The spectrum of the amorphous boron closely resembles that of the crystalline β-B105 phase [51] reflecting a similar local structure of B12 icosahedra where each boron atom is coordinated to five neighbors. The sharp feature at 194 eV stems from contamination with Btri-O species as the spectra reported in literature do not contain such a peak [46]. The edge energy of 188 eV is lower than that in oxides, as expected, due to the lower oxidation state of boron with no formal charge. The peaks at 191 and 193 eV are characteristic of this structure.
The spectrum of LiBH4 was measured along with Mg(BH4)2 to investigate the common features of BH4 ions in NEXAFS. In LiBH4 and Mg(BH4)2, boron in sp3 hybridization is tetrahedrally coordinated to four H atoms. Interestingly, both the borohydrides have a peak at ca. 192 eV. However, the peaks have a complex and different structure, evidencing variations in the local environment of boron atoms. For example, a lower-energy shift in LiBH4 may suggest less positive charge of boron atoms. The spectral structure of γ-Mg(BH4)2 (Figure 5a, red spectrum) with the first peak at about 192 eV and the sharp peak at 193 eV showed tetrahedral B coordination in BH4 as earlier studied by Jeong et al. [29].
Figure 5b shows NEXAFS spectra of decomposed Mg(BH4)2. One can immediately note that all the spectra demonstrate peaks due to boron oxides with planar anions evidencing sample oxidation.
At the same time, the region at 187–197 eV contains the information on other boron species. The spectra for the samples decomposed at 240 °C and 260 °C both showed the peak at 192 eV for the tetrahedral coordination of boron in BH4 suggesting Mg(BH4)2 residuals. The spectrum of the sample decomposed at 280 °C also showed a weak feature in that region. Other than that, the spectrum is of a rather poor quality, making it difficult to extract further conclusions. In the next spectrum (300 °C) we can observe a rather strong complex peak at ca. 192 eV, at the energies between those of amorphous boron and Mg(BH4)2. This suggests the presence of boron species in a lower oxidation state than in the (BH4) and closer to zero. That feature disappears in the 320 °C sample though it is also possible that this sample is oxidised to a larger extent. The spectra of the 340 °C and 400 °C samples demonstrate, again, a strong broad peak at 191.6 eV of a slightly different shape. Together with the spectrum profile above 195 eV, these spectra are very similar to those of the amorphous boron with some difference in the structure of the 191.6 eV peak. MgB2 was not found in the studied samples. However, this might also be due to the fact that the species was not present in the oxidised surface layer probed by TEY.
It can be noted that the different quality of the spectra might evidence different electronic properties of the samples as the data quality depends on the sample’s conductivity. Among those, the phases obtained at 280–320 °C have the worst quality and perhaps lowest conductivity. For higher decomposition temperatures, the noise decreases again. On the other hand, the noise can also be associated with the larger heterogeneity of the species in the 280–320 °C range.

4. Discussion and Conclusions

With a multi-technique experimental approach, we have analyzed different reaction phases in the partial decomposition of γ-Mg(BH4)2 in an Ar atmosphere. A maximum of 12% weight loss at 400 °C was measured by thermogravimetry, with the production of amorphous B-H species. Although no analysis of the desorbed gaseous species was carried out, the overall weight loss suggests that the main released gas was hydrogen since the desorption of boron species would correspond to larger weight losses. PXRD confirmed the absence of crystalline compounds in the partially decomposed samples at 260–280 °C temperatures, and formation of MgH2 after decomposition at 300 °C with the subsequent incomplete decomposition to Mg until 400 °C. Formation of MgB2 was not observed with PXRD and NEXAFS. SR-FTIR in transmission mode indicated the formation of bridged B-H-B species in the partially decomposed samples at 260–280 °C as well as the presence of several amorphous phases. Some contamination of the sample was observed, evidenced by the peaks of MgO in the PXRD patterns after 320 °C and boron oxide species in the NEXAFS and FTIR spectra. In the far-FTIR spectra, the peaks at the positions similar to that of H3BO3 were weak in the pure Mg(BH4)2 and more intense in the samples decomposed at 260–280 °C. To the best of our knowledge, we reported, for the first time in situ, (300–10 K) far-FTIR spectra of H3BO3 and Mg(BH4)2. Combining the results from TGA-DSC, NEXAFS spectrum at boron K-edge, and the PXRD report, the sample when decomposed from 240–300 °C comprises the tetrahedral coordination of B probably in terms of BH4 ions and B4-xHx species. The sample decomposed at 300 °C shows boron in oxidation states between those in (BH4) and amorphous boron. Summarizing, our combined experimental approach added more insights to the decomposition reaction of γ-Mg(BH4)2 in Ar for the equilibrium reaction products as collected in Table 5:
This constitutes a further step in the knowledge of the very complex decomposition mechanism of this attractive hydrogen storage material.

Author Contributions

Conceptualization, O.Z.; methodology, O.Z.; data analysis, R.D., J.G.V. and O.Z.; investigation (synchrotron experiments): all authors; resources: S.D., O.Z.; writing—original draft preparation, R.D., J.G.V. and O.Z.; writing—review and editing, all authors; visualization, O.Z., J.G.V., R.D.; supervision, O.Z.; project administration, O.Z.; funding acquisition: O.Z. All authors have read and agreed to the published version of the manuscript.

Funding

The research leading to this result has been partially supported by the project CALIPSOplus under the Grant Agreement 730872 from the EU Framework Programme for Research and Innovation HORIZON 2020. This support was indispensable and is highly appreciated.

Institutional Review Board Statement

Not applicable.

Informed Consent Statement

Not applicable.

Data Availability Statement

The data supporting the conclusions of this manuscript will be made available by the authors, without undue reservation, to any qualified researcher.

Acknowledgments

Part of this work was performed at HZB Helmoltz Zentrum Berlin at beamlines IRIS [52] and RGBL. We thank the Helmholtz-Zentrum Berlin für Materialien und Energie for the allocation of synchrotron radiation beamtime. The skilled assistance of the beamline scientists L. Pushkar and U. Schade (IRIS), and D. Smirnov and A. Makarova (RGBL) in discussion, planning and executing the measurements is heartily acknowledged.

Conflicts of Interest

The authors declare no conflict of interest.

References

  1. Rifkin, J. The Hydrogen Economy: The Creation of the Worldwide Energy Web and the Redistribution of Power on Earth; Wiley: New York, NY, USA, 2002; p. 304. [Google Scholar]
  2. Lovisolo, L.; Serdoner, A.; Whiriskey, K.; Larsson, R. Electrolysis Hydrogen Production in Europe; Bellona Europa, 2021. Available online: https://network.bellona.org/content/uploads/sites/3/2021/04/Electrolysis-Hydrogen-Production-In-Europe-5.pdf (accessed on 10 August 2022).
  3. Andersson, J.; Grönkvist, S. Large-scale storage of hydrogen. Int. J. Hydrogen Energy 2019, 44, 11901–11919. [Google Scholar] [CrossRef]
  4. Hydrogen and Fuel Cell Technologies Office. Hydrogen Storage- Basics. Available online: https://www.energy.gov/eere/fuelcells/hydrogen-storage (accessed on 10 August 2022).
  5. Mohtadi, R.; Orimo, S.-I. The renaissance of hydrides as energy materials. Nat. Rev. Mater. 2016, 2, 16091. [Google Scholar] [CrossRef] [Green Version]
  6. Rivard, E.; Trudeau, M.; Zaghib, K. Hydrogen Storage for Mobility: A Review. Materials 2019, 12, 1973. [Google Scholar] [CrossRef] [PubMed] [Green Version]
  7. Yartys, V.A.; Lototsky, M.V. An Overview of Hydrogen Storage Methods. In Hydrogen Materials Science and Chemistry of Carbon Nanomaterials; Veziroglu, T.N., Yu. Zaginaichenko, S., Schur, D.V., Baranowski, B., Shpak, A.P., Skorokhod, V.V., Eds.; Springer: Dordrecht, The Netherlands, 2005; pp. 75–104. [Google Scholar]
  8. Dematteis, E.M.; Amdisen, M.B.; Autrey, T.; Barale, J.; Bowden, M.E.; Buckley, C.E.; Cho, Y.W.; Deledda, S.; Dornheim, M.; de Jongh, P.; et al. Hydrogen storage in complex hydrides: Past activities and new trends. Prog. Energy 2022, 4, 032009. [Google Scholar] [CrossRef]
  9. Chong, M.; Karkamkar, A.; Autrey, T.; Orimo, S.; Jalisatgi, S.; Jensen, C.M. Reversible dehydrogenation of magnesium borohydride to magnesium triborane in the solid state under moderate conditions. Chem. Commun. 2011, 47, 1330–1332. [Google Scholar] [CrossRef] [PubMed]
  10. Zavorotynska, O.; El-Kharbachi, A.; Deledda, S.; Hauback, B.C. Recent progress in magnesium borohydride Mg(BH4)2: Fundamentals and applications for energy storage. Int. J. Hydrogen Energy 2016, 41, 14387–14403. [Google Scholar] [CrossRef] [Green Version]
  11. Zavorotynska, O.; Deledda, S.; Li, G.Q.; Matsuo, M.; Orimo, S.; Hauback, B.C. Isotopic Exchange in Porous and Dense Magnesium Borohydride. Angew. Chem. Int. Ed. 2015, 54, 10592–10595. [Google Scholar] [CrossRef]
  12. Heere, M.; Zavorotynska, O.; Deledda, S.; Sorby, M.H.; Book, D.; Steriotis, T.; Hauback, B.C. Effect of additives, ball milling and isotopic exchange in porous magnesium borohydride. RSC Adv. 2018, 8, 27645–27653. [Google Scholar] [CrossRef] [Green Version]
  13. Guo, S.; Chan, H.; Reed, D.; Book, D. Investigation of dehydrogenation processes in disordered γ-Mg(BH4)2. J. Alloys Compd. 2013, 580, S296–S300. [Google Scholar] [CrossRef]
  14. Hanada, N.; Chłopek, K.; Frommen, C.; Lohstroh, W.; Fichtner, M. Thermal decomposition of Mg(BH4)2 under He flow and H2 pressure. J. Mater. Chem. 2008, 18, 2611–2614. [Google Scholar] [CrossRef]
  15. Li, H.W.; Kikuchi, K.; Nakamori, Y.; Miwa, K.; Towata, S.; Orimo, S. Effects of ball milling and additives on dehydriding behaviors of well-crystallized Mg(BH4)2. Scr. Mater. 2007, 57, 679–682. [Google Scholar] [CrossRef]
  16. Paskevicius, M.; Pitt, M.P.; Webb, C.J.; Sheppard, D.A.; Filsø, U.; Gray, E.M.; Buckley, C.E. In-Situ X-ray Diffraction Study of γ-Mg(BH4)2 Decomposition. J. Phys. Chem. C 2012, 116, 15231–15240. [Google Scholar] [CrossRef]
  17. Soloveichik, G.L.; Gao, Y.; Rijssenbeek, J.; Andrus, M.; Kniajanski, S.; Bowman, R.C.; Hwang, S.-J.; Zhao, J.-C. Magnesium borohydride as a hydrogen storage material: Properties and dehydrogenation pathway of unsolvated Mg(BH4)2. Int. J. Hydrogen Energy 2009, 34, 916–928. [Google Scholar] [CrossRef]
  18. Vitillo, J.G.; Bordiga, S.; Baricco, M. Spectroscopic and Structural Characterization of Thermal Decomposition of γ-Mg(BH4)2: Dynamic Vacuum versus H2 Atmosphere. J. Phys. Chem. C 2015, 119, 25340–25351. [Google Scholar] [CrossRef]
  19. Zavorotynska, O.; Saldan, I.; Hino, S.; Humphries, T.D.; Deledda, S.; Hauback, B.C. Hydrogen cycling in γ-Mg(BH4)2 with cobalt-based additives. J. Mater. Chem. A 2015, 3, 6592–6602. [Google Scholar] [CrossRef] [Green Version]
  20. Zavorotynska, O.; Deledda, S.; Vitillo, J.G.; Saldan, I.; Guzik, M.N.; Baricco, M.; Walmsley, J.C.; Muller, J.; Hauback, B.C. Combined X-ray and Raman Studies on the Effect of Cobalt Additives on the Decomposition of Magnesium Borohydride. Energies 2015, 8, 9173–9190. [Google Scholar] [CrossRef] [Green Version]
  21. Newhouse, R.J.; Stavila, V.; Hwang, S.-J.; Klebanoff, L.E.; Zhang, J.Z. Reversibility and Improved Hydrogen Release of Magnesium Borohydride. J. Phys. Chem. C 2010, 114, 5224–5232. [Google Scholar] [CrossRef] [Green Version]
  22. Yan, Y.; Remhof, A.; Rentsch, D.; Züttel, A. The role of MgB12H12 in the hydrogen desorption process of Mg(BH4)2. Chem. Commun. 2015, 51, 700–702. [Google Scholar] [CrossRef] [Green Version]
  23. Zavorotynska, O.; Sorby, M.H.; Vitillo, J.G.; Deledda, S.; Frommen, C.; Hauback, B.C. Experimental and computational characterization of phase transitions in CsB3H8. Phys. Chem. Chem. Phys. 2021, 23, 17836–17847. [Google Scholar] [CrossRef]
  24. Sethio, D.; Daku, L.M.L.; Hagemann, H.; Kraka, E. Quantitative Assessment of B-B-B, B-H(b) -B, and B-H(t) Bonds: From BH(3) to B(12) H(12) (2). Chemphyschem 2019, 20, 1967–1977. [Google Scholar] [CrossRef]
  25. Severa, G.; Rönnebro, E.; Jensen, C.M. Direct hydrogenation of magnesium boride to magnesium borohydride: Demonstration of >11 weight percent reversible hydrogen storage. Chem. Commun. 2010, 46, 421–423. [Google Scholar] [CrossRef] [PubMed]
  26. Zavorotynska, O.; Deledda, S.; Hauback, B.C. Kinetics studies of the reversible partial decomposition reaction in Mg(BH4)2. Int. J. Hydrogen Energy 2016, 41, 9885–9892. [Google Scholar] [CrossRef]
  27. Saldan, I.; Hino, S.; Humphries, T.D.; Zavorotynska, O.; Chong, M.; Jensen, C.M.; Deledda, S.; Hauback, B.C. Structural Changes Observed during the Reversible Hydrogenation of Mg(BH4)(2) with Ni-Based Additives. J. Phys. Chem. C 2014, 118, 23376–23384. [Google Scholar] [CrossRef] [Green Version]
  28. Ray, K.G.; Klebanoff, L.E.; Lee, J.R.I.; Stavila, V.; Heo, T.W.; Shea, P.; Baker, A.A.; Kang, S.; Bagge-Hansen, M.; Liu, Y.-S.; et al. Elucidating the mechanism of MgB2 initial hydrogenation via a combined experimental–theoretical study. Phys. Chem. Chem. Phys. 2017, 19, 22646–22658. [Google Scholar] [CrossRef] [PubMed] [Green Version]
  29. Jeong, S.; Heo, T.; Oktawiec, J.; Shi, R.; Kang, S.; White, J.; Schneemann, A.; Zaia, E.; Wan, L.; Ray, K.; et al. A Mechanistic Analysis of Phase Evolution and Hydrogen Storage Behavior in Nanocrystalline Mg(BH4)2 within Reduced Graphene Oxide. ACS Nano 2020, 14, 1745–1756. [Google Scholar] [CrossRef] [Green Version]
  30. Sahle, C.J.; Kujawski, S.; Remhof, A.; Yan, Y.; Stadie, N.P.; Al-Zein, A.; Tolan, M.; Huotari, S.; Krisch, M.; Sternemann, C. In situ characterization of the decomposition behavior of Mg(BH4)2 by X-ray Raman scattering spectroscopy. Phys. Chem. Chem. Phys. 2016, 18, 5397–5403. [Google Scholar] [CrossRef] [Green Version]
  31. Solovev, M.V.; Chashchikhin, O.V.; Dorovatovskii, P.V.; Khrustalev, V.N.; Zyubin, A.S.; Zyubina, T.S.; Kravchenko, O.V.; Zaytsev, A.A.; Dobrovolsky, Y.A. Hydrolysis of Mg(BH4)2 and its coordination compounds as a way to obtain hydrogen. J. Power Sources 2018, 377, 93–102. [Google Scholar] [CrossRef]
  32. Jun, L.; Shuping, X.; Shiyang, G. FT-IR and Raman spectroscopic study of hydrated borates. Spectrochim. Acta Part A Mol. Biomol. Spectrosc. 1995, 51, 519–532. [Google Scholar] [CrossRef]
  33. Nakamoto, K. Applications in Inorganic Chemistry. In Infrared and Raman Spectra of Inorganic and Coordination Compounds, 6th ed.; John Wiley & Sons: Hoboken, NJ, USA, 2008; Volume A, pp. 149–354. [Google Scholar]
  34. Mirabella, F.M. Principles, Theory and Practice of Internal Reflection Spectroscopy. In Handbook of Vibrational Spectroscopy; John Wiley & Sons, Ltd.: New York, NY, USA, 2006. [Google Scholar]
  35. Chong, M.; Autrey, T.; Jensen, C.M. Lewis Base Complexes of Magnesium Borohydride: Enhanced Kinetics and Product Selectivity upon Hydrogen Release. Inorganics 2017, 5, 89. [Google Scholar] [CrossRef] [Green Version]
  36. Gigante, A.; Leick, N.; Lipton, A.S.; Tran, B.; Strange, N.A.; Bowden, M.; Martinez, M.B.; Moury, R.; Gennett, T.; Hagemann, H.; et al. Thermal Conversion of Unsolvated Mg(B3H8)2 to BH4– in the Presence of MgH2. ACS Appl. Energy Mater. 2021, 4, 3737–3747. [Google Scholar] [CrossRef]
  37. Palumbo, O.; Nguyen, P.; Jensen, C.M.; Paolone, A. Determination of the molecular structure of amorphous Mg(B3H8)2(THF)2 through infrared spectroscopic and computational studies. Int. J. Hydrogen Energy 2016, 41, 5986–5993. [Google Scholar] [CrossRef] [Green Version]
  38. Matsui, Y.; Taylor, R.C. Vibrational spectra and structure of the heptahydrodiborate ion, [B2H7]− in glycol ethers. Spectrochim. Acta Part A Mol. Spectrosc. 1989, 45, 299–304. [Google Scholar] [CrossRef] [Green Version]
  39. Lutz, C.A.; Ritter, D.M. Observations on alkylboranes. Can. J. Chem. 1963, 41, 1344–1358. [Google Scholar] [CrossRef]
  40. Hrostowski, H.J.; Pimentel, G.C. The Infrared Spectra of Stable Pentaborane and Deuterated Pentaborane. J. Am. Chem. Soc. 1954, 76, 998–1003. [Google Scholar] [CrossRef]
  41. Johnson, H.D.; Geanangel, R.A.; Shore, S.G. Alkali metal salts derived from pentaborane(9) and hexaborane(10): MB5H8 and MB6H9. Inorg. Chem. 1970, 9, 908–912. [Google Scholar] [CrossRef]
  42. Brint, P.; Sangchakr, B.; Fowler, P.W.; Weldon, V.J. Bonding in clusters Part 10. The nature of the bh groups in closo-borane anions—A study by vibrational spectroscopy, electronic spectroscopy for chemical-analysis, and abinitio computation. J. Chem. Soc. Dalton Trans. 1989, 11, 2253–2260. [Google Scholar] [CrossRef]
  43. Leites, L.A. Vibrational spectroscopy of carboranes and parent boranes and its capabilities in carborane chemistry. Chem. Rev. 1992, 92, 279–323. [Google Scholar] [CrossRef]
  44. Erbil, A.; Cargill, G.S.; Frahm, R.; Boehme, R.F. Total-electron-yield current measurements for near-surface extended X-ray-absorption fine-structure. Phys. Rev. B 1988, 37, 2450–2464. [Google Scholar] [CrossRef] [Green Version]
  45. Esposto, F.J.; Aebi, P.; Tyliszczak, T.; Hitchcock, A.P.; Kasrai, M.; Bozek, J.D.; Jackman, T.E.; Rolfe, S.R. Boron K-shell spectroscopy of boron-doped silicon. J. Vac. Sci. Technol. A 1991, 9, 1663–1669. [Google Scholar] [CrossRef]
  46. Blau, W.; Dudde, R.; Petersen, H. Photoyield measurements of the boron k-edge fine structure of amorphous Fe80B20 alloys. Solid State Commun. 1989, 69, 147–150. [Google Scholar] [CrossRef]
  47. Henderson, G.S.; de Groot, F.M.F.; Moulton, B.J.A. X-ray Absorption Near-Edge Structure (XANES) Spectroscopy. Rev. Mineral. Geochem. 2014, 78, 75–138. [Google Scholar] [CrossRef] [Green Version]
  48. Ishiguro, E.; Iwata, S.; Suzuki, Y.; Mikuni, A.; Sasaki, T. The boron K photoabsorption spectra of BF3, BCl3, and BBr3. J. Phys. B At. Mol. Phys. 1982, 15, 1841–1854. [Google Scholar] [CrossRef]
  49. Fleet, M.E.; Muthupari, S. Boron K-edge XANES of borate and borosilicate minerals. Am. Mineral. 2000, 85, 1009–1021. [Google Scholar] [CrossRef]
  50. Guerfi, T. Out-of-plane ionicity versus in-plane covalency interplay and electron–phonon coupling in MgB2 superconductor. Chin. J. Phys. 2020, 64, 287–294. [Google Scholar] [CrossRef]
  51. Li, D.; Bancroft, G.M.; Fleet, M.E. B K-edge XANES of crystalline and amorphous inorganic materials. J. Electron Spectrosc. Relat. Phenom. 1996, 79, 71–73. [Google Scholar] [CrossRef]
  52. Peatman, W.; Schade, U. A brilliant infrared light source at BESSY. Rev. Sci. Instrum. 2001, 72, 1620–1624. [Google Scholar] [CrossRef]
Figure 1. (a) Temperature, (b) TGA and (c) DSC profiles of γ-Mg(BH4)2 samples kept at different temperatures in Ar flow.
Energies 15 07998 g001
Figure 2. PXRD profiles of as received Mg(BH4)2 and the samples decomposed at various temperatures. The pattern of as received Mg(BH4)2 corresponds to the porous γ-phase, the pattern recorded after the 240 °C isotherm resembles one of the high temperature phases [20].
Energies 15 07998 g002
Figure 3. (a) Mid-IR spectra of pristine and partially decomposed Mg(BH4)2. The spectrum of H3BO3 is also reported for comparison. The spectra are recorded at 10 K. The modes expected for (B3H8) are illustrated according to the reference [23]; (b) Far-IR spectra recorded at 10 K of pristine and partially decomposed Mg(BH4)2. The spectra of H3BO3 and of the diluent (wax) is also reported for comparison. The inset shows the region around the band at 70 cm−1 associated with boric acid (borate). The assignment for the modes 1–13 is given in Table 4.
Energies 15 07998 g003
Figure 4. Temperature dependence of the far-IR spectra in the RT-10 K for the reference H3BO3 (left) and the Mg(BH4)2 decomposed at 260 °C (right).
Energies 15 07998 g004
Figure 5. B K-edge NEXAFS spectra of (a) boron-based reference compounds, (b) samples decomposed at various temperatures.
Energies 15 07998 g005
Table 1. Vibrational frequencies for the normal modes of isolated planar BO3 (D3h) and tetrahedral BO4 (Td) groups in crystalline state [33]. All of the frequencies are in cm−1.
Groupν1ν2ν3ν4
[BO3]3−1060 (R) 1668, 648 (IR)1490–1428 (R, IR)545 (R, IR)
[BO4]5−880 (R)371 (R)886 (R, IR)627 (R, IR)
1 R—Raman active, IR—infrared active.
Table 2. FTIR features of H3BO3 (planar Btri-O groups) and Mg(BO2)2 · 3H2O (tetrahedral Btetra-O groups) [32] in comparison with our data for H3BO3. All of the frequencies are in cm−1.
H3BO3Mg(BO2)2 · 3H2OH3BO3
Ref. [32]Ref. [32]This work
3571, vs 1
3491, vs
3202, br3179, vs3160 vs, br
2515, m2531, m2550 m, br
2362, m 2388 m
2262, s 2283 m
2030, w 2046–2010 w
1423 (ν3) 2, s, br 1448 vs, br
1297, vs1245 w
1221, m
1193 (ν3?), vs1163, vs1212 vs
1042, vs
953, vs
883, m873 (ν3), vs886 m
811, m802, w815 m, br
644 (ν2), s
546 (ν4), vs586 (ν4), vs550, s
n/a 79, m
1 vs—very strong, s—strong, m—medium, w—weak, br—broad, sh—shoulder; 2 νs,a—symmetric, asymmetric stretching; δ—bending; data are from ref. [32].
Table 3. FTIR features of γ-Mg(BH4)2 from literature and this work (orange curve on Figure 3). All of the frequencies are in cm−1.
Observed Peak Refs. [10,11]ModeAssignment 2This Work
n/aν1νs (B-H)
1370, m, br 1 ν2δs (H-B-H)
2270 ± 2, vsν3νa (B-H)2300 s, br
1260, sν4δa (H-B-H)1276 s, br
1120 ± 10, mν4δa (H-B-H)1144 s, br
2660, mν2 + ν4overtone2672 m
434, m Mg-B stretching455 m, br
409, m Mg-B stretching425 m, br
257, 231, 208, m B-Mg-B bending240 w, 210 m
1 vs—very strong, s—strong, m—medium, w—weak, br—broad, sh—shoulder; 2 νs,a—symmetric, asymmetric stretching; δs,a—symmetric, asymmetric bending; data and assignment are from refs. [10] (mid-IR), and [18] (far-IR).
Table 4. Experimentally observed peaks in the FTIR spectra of γ-Mg(BH4)2 decomposed at 260 °C and 280 °C. All of the frequencies are in cm−1.
Peak No.Energy, cm−1Tentative Assignment
12510 s, brν(B-H)
22410, sν(B-H)
32375, mν(B-H)
42320, mν(B-H), /ν(Mg-H-B)
52140, wν(B-H-B)
62075, wν(B-H-B)
71620, mδ(H-O-H)/δ(B-H)
81460, s, brνa(Btri-O)/δ(B-H)
9ca. 1230, brνs(Btri-O)/ν(Btetra-O)/δ(B-H)
10~1030, s, brν(Btetra-O)/δ(B-H)
11930, shν(B-B)/δ(B-H)
1379, mT (Btri-O)
Table 5. Summary of the study of decomposition products of γ-Mg(BH4)2 in Ar.
Tdec (°C)Maximum Weight Loss, wt%
(TGA)
Released No. of H2 MoleculesNominal Composition after H2 DesorptionReaction Step
(TGA-DSC)
Crystalline Reaction Products (PXRD)FTIRNEXAFS
2402.11.1MgB2H7Iht-Mg(BH4)2n/aBtri-O, (BH4)
2604.52.4MgB2H5.6INo- several BxHy phases- B-H-B species
- B3-B5 clusters
Btri-O, (BH4)
2805.22.8MgB2H5.2INoBtri-O
3008.84.7MgB2H3.3IMgH2n/aBtri-O, boron species between (BH4) and B0
3209.95.3MgB2H2.8IIMg, MgOn/aBtri-O
34011.66.2MgB2H1.8III, IVMg, MgOn/aBtri-O, B0
400126.5MgB2H1.5IVMg, MgOn/aBtri-O, B0
Publisher’s Note: MDPI stays neutral with regard to jurisdictional claims in published maps and institutional affiliations.

