Abstract
Scarcity has made fresh water too economically and socially too valuable to be used by the processing industry without restriction. Wet evaporative cooling cycles offer competitive advantages in terms of CoP compared to other cooling cycles with relatively low cost but requiring extensive quantities of water. Dry cooling, on the other hand, requires large heat-transfer areas, in addition to high power requirements. In this study, a hybrid cycle is proposed for high-end cooling loads of 215 MW. The proposed cycle combines the benefits of phase change to make dry cycles competitive. Furthermore, the proposed cycle also diminishes the extensive use of various chemicals used in wet cooling cycles. The applicable dry bulb temperature range is 25–50 °C. Variations in cooling fluid cold temperature due to ambient conditions are curtailed to a maximum of 2 °C by the proposed cycle. A technoeconomic comparison of the proposed solution to wet evaporative cooling is presented, and the effects are summarized without providing extensive design calculations. ASPEN modules are used design and simulation.
1. Introduction
Wet evaporative cooling towers have been used as heat sinks for various chemical processes since their inception. Owing to high heat-transfer rates and extensive experience in design and operation, these heat-exchanging devices are used as heat sinks in the processing industry. However wet evaporative cooling towers are also water- and chemical-extensive devices. Although often claimed to be harmless, the chemicals used to soften water and control corrosion, scaling and bio-life in cooling water are associated with environmental costs. Many processing plants that were erected based on fresh water are now struggling due to limited water supply [1]. In some areas, these processing plants were designed to take water from rivers or canals. However, owing to water crises, many such facilities have resorted to using ground water, further aggravating the problems of water shortage and putting pressure on underground aquifers. Ground water is rich in dissolved solids, thus requiring the use of more chemical for softening, in addition to increasing the amount of sludge produced as a byproduct of water treatment. Sludge from softeners is usually landfilled. High amounts of dissolved solid also increase the corrosivity and scaling of water, requiring considerable amounts of inhibitors. A multidimensional problems and threats are associated with the use of aquifers, in addition to the unsustainability of this practice. Some cooling load facilities, such as cement manufacturers, have turned either to rainwater storage or waterless operations (or both). However, high-end cooling loads still consume large amounts of water for their cooling needs. Political, social, environmental and economic turmoil may ensue in many densely populated areas, such as the Indian subcontinent, the far east, Asia and Africa, as a result of the heavy usage of precious water resources in association with such evaporative cooling methods. The abovementioned regions also represent considerable potential for economic growth opportunity, as exponential industrial development is expected in the future. Therefore, alternatives to cooling techniques employing humidification should be investigated.
Fans used to force or induce air into evaporative systems are major power consumers in cooling towers. The coefficient of performance (CoP) of a typical cooling tower usually depends on factors such as dry bulb and wet bulb temperatures, as well as ambient humidity. Furthermore, variations in CoP are expected under typical daytime conditions, in addition to seasonal changes throughout the year [2]. On the other hand, cooling units that do not employ evaporative cooling, such as dry cooling units, require considerable amounts of air, considerably reducing the CoP [3]. Furthermore, an expected decline in process plant efficiency has been reported due increased in sink temperatures (as sink temperature is equivalent to the dry bulb temperature) in dry cooling units [4]. Since the 1970s, hybrid systems employing a combination of wet and dry technologies have been considered by various researchers to decrease the water carry over, plume abatement, direct evaporative water loss and power consumption compared to dry cooling units [5,6,7,8,9,10,11,12]. A proportion of 20 to 40% prior heat removal by dry units is suggested for refinery cooling loads in a hybrid system [13]. Some researchers have studied air precooling by spraying water before use in dry systems [14]. Hybrid systems have been shown to be theoretically capable of increasing the efficiency of large natural draft cooling towers with improved flow dynamics [15]. On the other hand, a poorly designed or operated hybrid system can have an even lower CoP than that of dry cooling systems [16]. Furthermore, dry cooling systems are preferred areas with low ambient temperatures and high humidity [17].
Dry air cooling systems have been previously investigated for small-scale loads [18,19,20,21] and are associated with known issues of inadequate heat transfer rates and high power consumption. Solar-energy-based power plants may provide high power requirements and can also produce fresh water via desalination [22]. Mostly previous studies have investigated the use of dry cooling systems in power plants. The arid conditions associated with the geolocation of concentrated solar-powered plants require optimized dry cooling units, such as the cycle proposed in [23]. Hooman et al. investigated the use of dry cooling in combination with adsorption refrigeration for water conservation in power plants [24]. Desiccant cooling in combination with evaporative cooling has also been investigated, but such systems increase the evaporative loss of water, as well as the blowdown from the cooling tower [25]. Absorption refrigeration has a better CoP than conventional vapor compression refrigeration but is considerably less efficient than cooling towers. Absorption refrigeration is associated with advantages not only in terms of the elimination of the use of compressors in conventional vapor cycles but also owing to its enhanced heat transfer coefficient for liquids in the heat rejection sections of the process. A variety of working fluids has been purposed for such cycles [26].
Ammonia is produced in several regions of the world in association with food security programs. It is subsequently used for production of nitrogen-based fertilizers. On one hand, ammonia fertilizers increase crop yields; however, their production also consumes precious water essential for agriculture. Abatement of process water required for its production may not be possible. The steam required for the combined cycle/steam power generation in such plants is mostly recycled. The cooling loads of such processes are also very high; however, the water used for cooling purposes may be eliminated, provided a comparable heat sink is available. In this article, we suggest an alternative and provide a technoeconomic comparison of a modified dry cooling cycle with an enhanced heat transfer coefficient relative to that of cooling towers for an ammonia production facility. The proposed cycle differs from hybrid cycles, with integration at the fluid level.
2. Materials and Methods
2.1. Heat Exchanger Design/Simulation
Heat exchangers were rated and designed based on the following general equations:
Existing and new heat exchangers were simulated and designed using ASPEN EDR, respectively. Heat exchangers were designed in an iterative procedure converging at three levels of loops, including the overall heat transfer coefficient, the pressure drop and cost optimization. The cooling load was calculated according to the simple energy balance between cooling water inlet and outlet temperatures, assuming no heat loss to the surroundings. The cooling load was then balanced according to the process cooling load (Equation (1)). Equation (1) was then equated with Equation (2) with an estimated value of ‘U’ to calculate the total area required for heat transfer. The value of ‘U’ was then calculated for the given geometry according to Equation (3). The loop continued until the Equations (2) and (3) were satisfied. The types of heat exchangers, including shell-type rear and front headers, nozzles, internal layouts and fouling factors, were considered according to the TEMA standards [27]. The type of exchanger was assumed to be the same as that of existing exchangers. Individual heat transfer convective coefficients and pressure drops on the shell and tube sides were calculated based on the appropriate correlations for the given services [28]. ΔTLM was calculated based on the natural logarithmic mean formula, whereas the Ft factor was estimated according to the handbook by J. Taborek [29]. Details of the algorithm are provided in [30]. The properties of the fluid-exchanging heats were estimated using the appropriate equation of state. The Peng–Robinson EOS was used for general process fluids. The ASPEN inbuilt sour acid gas model was used for ammonia and CO2 stripping fluids. Other properties, such as thermal conductivity, viscosity and heat capacity, were taken from the ASPEN data base. Water-cooling properties were calculated using IAPWS data [31]. Price was estimated according to the inbuilt module based on indices in Aspen Economics. Air coolers essentially satisfy the same general heat transfer equations as tubular exchangers and are usually designed as individual cells and then combined. Air coolers were selected using the auto-selector module of ASPEN.
2.2. Process Simulation
Process simulation was achieved using ASPEN PLUS. Vapor–liquid equilibrium data were well-represented by the Peng–Robinson equation of state using fugacity coefficients according to modified Raoult’s law (, where ‘ϕ’ is the fugacity coefficient; ‘y’ is the vapor mole fraction; ‘x’ is the liquid mole fraction; ‘P’ is the pressure; superscript ‘v’, ‘l’ and ‘sat’ represent vapor, liquid and saturation, respectively; and subscript ‘i’ represents species), as shown for a propane–butane system in Figure 1 and propane–pentane and butane–pentane systems in Figure 2. Thus, the thermodynamic model was used to further design of the required heat transfer units. The other properties of the fluids were calculated using ASPEN properties, and the model was converged using ASPEN PLUS. Care was taken in adjusting the tolerance limits for the recycle “TEAR” streams. Tolerance was adjusted to 1 × 10⁻⁵ for molar composition, as the cycle was too sensitive to cater to discrepancies in molar fractions.
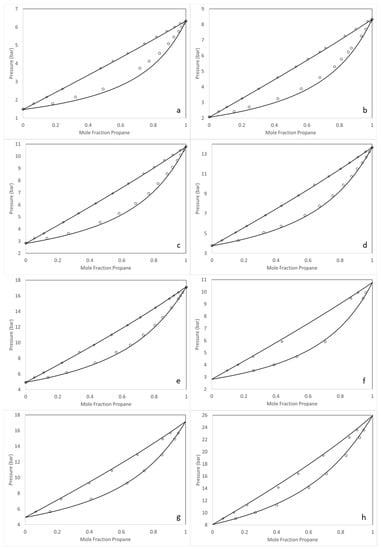
Figure 1.
Vapor–liquid equilibrium data for the propane/butane mixture. Data were calculated using the Peng-Robinson EOS and the fugacity coefficient according to modified Raoult’s law. The symbols ◊ and o represent experimental data for liquid and vapor, respectively, and the line represents model predictions. (a) 283 K [32], (b) 293 K [32], (c) 303 K [32], (d) 313 K [32], (e) 323 K [32], (f) 303 K [33], (g) 323 K [33], (h) 343 K [33].
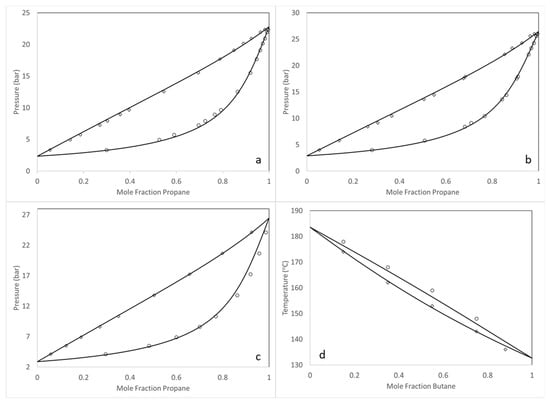
Figure 2.
Vapor–liquid equilibrium data for propane/pentane and butane/pentane mixtures. Data were calculated using the Peng–Robinson EOS and the fugacity coefficient according to modified Raoult’s law. The symbols ◊ and o represent experimental data for liquid and vapor, respectively, and the line represents model predictions. (a) Propane/pentane at 336 K [34], (b) propane/pentane at 344 K [34], (c) propane/pentane at 344 K [35], (d) butane/pentane at 26.77 bar [36].
3. Results and Discussion
3.1. Existing Tubular Heat Exchangers
A total of thirty-four major shell and tube coolers/condensers are available for the ammonia production process. A summary of the exchangers, along with their TEMA type, heat loads and cost, is provided in Table 1. These coolers can be divided into four main categories. Nine are steam condensers for steam turbines used as power generators. A total of ten feed, intercoolers and precoolers are available to aid in efficient compression. Eleven exchangers are employed for ammonia cooling and refrigeration, mainly for ammonia storage. The remaining eight major exchangers are used to satisfy process conditions at different points. The majority of the cooling load is required for power generation being to run generators and pressure-changing rotary machines (≈50%). The inlet and outlet temperatures for both fluids are provided. The total capital cost of these exchangers, excluding piping and other accessories, is approximately USD 8.33 million, with a total cooling load of 194.2 MW. According to the data, an inlet temperature of 27 °C and an outlet temperature of 52 °C were selected for the cooling fluid in the proposed cycle. For exchanger nos. 11, 13, 14, 16 and 17, an outlet cooling fluid temperature of 52 °C was not feasible. Therefore, we propose a possible alternative in the heat exchanger design section for comparison purposes only.

Table 1.
Major shell and tube heat exchanger coolers employed the ammonia production process. * Cost was evaluated by simulating existing heat exchangers using the economics feature in ASPEN EDR v 11.
3.2. Wet Cooling Tower
The total process cooling load is 194.2 MW. However, cooling water is also required for other services, such as lube oil cooling systems, HVAC and some auxiliary jacketed vessels. This load and design represent 10% of the total process load. Therefore, the designed cooling rate is approximately 215 MW. A cross-flow, rectangular, induced-draft cooling tower is available at the facility to provide the required heat sink. A double air flow design splash-type fill is used. The designed outlet temperature of the cooling tower is approximately 30 °C. The temperature of the incoming water to the tower ranges from 60 to 35 °C. This water enters a common header before entering the tower. An approach of 5 °C to the wet bulb temperature is expected. The tower has a concrete basin and foundation with plastic packing and drift eliminators. The fan cylinders are made of fiber-reinforced plastic, with total ten cells, each with an axially induced draft fan with a diameter of 4.87 m. Various design parameters for the cooling tower are presented in Table 2. The total capital cost of the cooling tower is estimated to be USD 2,500,000. This cost was estimated by adjusting the erection cost of the cooling tower in 1992 to 2021 values by according to the cost inflation indices for the location. All presented details correspond to a refurbished cooling tower.
Table 2.
Design parameters after refurbishing the cooling tower.
There are three pumps, two working one standby, for the delivery of the cooling water to the plant, each with a cost of USD 411,400. In addition to these pumps, an extensive water treatment system is required. The existing facility is designed to treat the water in a clarifier first (cost: USD 156,250); the water is then filtered (pump and filtration system cost assumed to be the same as that of the clarifier) before water makes its way into the cooling system. Originally, the plant was designed to operate with fresh water from streams/canals. However, with the passage of time, agricultural water requirements have increased exponentially, and facility has had to resort to ground water for its processing and cooling requirements. Ground water rich in TDS, increasing the operational cost required for treatment. There are more than 100 tube wells, each with a capacity of approximately 120 m3/h, installed approximately 12 km away from the facility. Compared to the process water requirements, we assume that 30 wells are dedicated to intermittently supply cooling water. An an average height of 30 m below ground level is assumed for the water table. The cost of a typical tube well of such size is assumed to be USD 35,900. The total equipment cost for the cooling circuit is provided in Table 3.
Table 3.
Estimated equipment cost for the water cooling system.
3.3. Alternative Cooling Cycle
Despite the apparent advantage of water conservation, there are two major penalties associated with dry cooling systems. One is the overall increase in area/air flow required for heat rejection in air coolers due to the higher dry bulb temperature, and the second is the decreased heat transfer coefficient of the cooling side in the process heat exchangers, which needed to be compensated for the dry cooling system to be economically viable. Furthermore, the temperature of the cooling fluid must be low enough to exchange heat with the process fluid. An effort in this context is shown in Figure 3. A multicomponent liquid mixture, ‘S1/S11’, is injected into the process heat exchangers used to cool the process streams. In this process, a vapor mixture is produced along the length of the heat exchangers, preferably on the tube side. The vaporized fluid, ‘S2’, is then sent into the air cooler to exchange heat (‘Q2’) with the environment. Fluid ‘S3’ is adjusted to reach the dew point, depending on the air dry bulb temperature; therefore, a phase separation vessel is required. Vapor stream ‘S4’, rich in light components, is compressed to ‘S5’ and passes through another air cooler for heat rejection (‘Q3’). Throttling of pressurized cool fluid ‘S6’ reduces the temperature, and some condensation is apparent. The vapors are separated in another vessel, and stream ‘S8’, rich in light components, is sent back for compression after mixing with ‘S3’, reducing the temperature of the first separation vessel and resulting in increased flow of heavy liquid ‘S10’. Liquids from both separation vessels, (‘S9’ and ‘S10’) are pumped back for heat collection. The advantages of the cycle can be assessed using values for a test case, as described in subsequent sections.
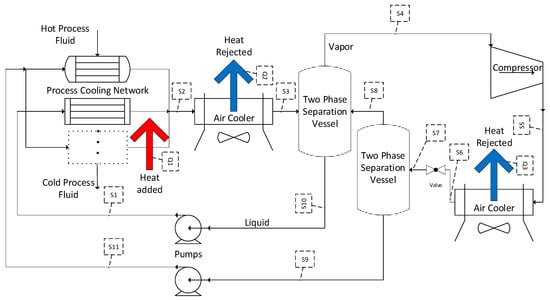
Figure 3.
Concept model for a two-phase cooling fluid for a dry cooling system.
In order to test the proposed model for heat removal from the system, fluid components must be selected with a dew point and bubble point in a range such that phase change is ensured both in the process heat exchanges and dry air coolers. Analysis was performed on the basis of a propane, butane and pentane mixture, as their mixture VLE data are in close proximity to the required range. These components do not form any azeotrope within the pressure range of the process. Therefore, they were selected as model components and be replaced with tailored compounds with improved properties.
3.4. Model Convergence
For the model to converge, two constraints must be respected, namely the inlet and outlet temperatures of the cooling fluid: 27 °C and 52 °C, respectively. Figure 4 shows the composition arrays with a dew point of 52 °C. A three-component system is required to satisfy the process-constrained cooling fluid temperatures at the inlet and outlet. Neither of the binary mixtures can achieve both simultaneously. The fractions of propane, butane and pentane, on the other hand, can be adjusted to control the flows in the main cycle and refrigeration cycle; the higher the volatility of the mixture, the lower the cooling fluid temperature. As the mixture temperature of streams ‘S1’ and ‘S11’ with 15 mol % propane and 41 mol % butane, respectively is 27 °C hence, this composition in maintained for stream ‘S2’, as indicated by the blue scaling lines. The flow of the fluids is dictated by the amount of heat transfer in the process exchangers. Therefore, the degree of freedom necessary to solve the cycle is complete and iterative convergence, with intelligent seed values, which can be achieved using standard algorithms. The values of variables for different streams are provided in Table 4. The process cooling load is 215 MW. The amount of fluid entering the exchangers is adjusted to achieve the bubble point and total vaporization without superheating ‘S2’. This fluid then enters the air cooler. The designed outlet temperature from air cooler is maintained at 45 °C, which is relatively hot. The more volatile fluid is then separated for compression at 42 °C. After compression to 7.5 bar (optimized based on the fluid mixture for throttling), the temperature of the fluid increases to 78 °C, so a higher temperature gradient is available for exploitation by the air cooler. Therefore, although the designed outlet temperature is set to 45 °C, a major portion of heat is lost to the environment from this air cooler (179.2 MW). Throttling reduces the overall fluid temperature to 21 °C. ‘S9’ and ‘S10’ are then pumped back to the process for heat exchange.
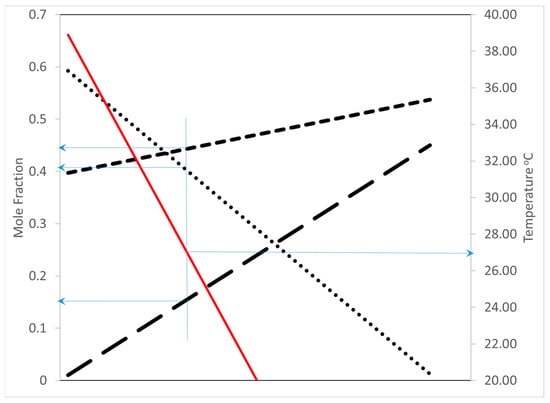
Figure 4.
A dew point molar composition of 52 °C was calculated based on the fugacity coefficient according to modified Raoult’s law. Long dashed line—propane; dotted line—butane; small dashed line—pentane; red line—process inlet temperature of the cooling fluid; blue guide lines—composition at 27 °C.
Table 4.
Temperature, pressure, molar flow, composition, quality and heat load of process streams.
3.5. Design of Heat Exchangers for the Proposed Cycle
A series of exchangers can be designed after optimization according to pinch analysis for the cooling utilities available at 21 °C and 42 °C. Care must be taken to achieve full vaporization of the cooling fluid after the bubble point of 35 °C at 350 kPa. Any liquid accumulation in the heat exchanger will result in residual boiling, altering the overall composition, as well as the dew point adjusted at 52 °C. To address this problem, vaporization with forced circulation of cooling fluid within the tubes was used as a design constraint. ASPEN EDR was used to design the heat exchanger; the results are presented in Table 5. The ‘U’-type bundle selected as channel/tube head presents an inherent problem of vapor accumulation. As mentioned previously, exchanger nos. 11, 13, 14, 16 and 17 cannot be designed for the prescribed outlet temperature of cooling fluid, so a temperature difference of 27 to 34 °C without any phase change was used to design these exchangers. The fluid available at 34 °C is then injected into condensers 1 and 3 to achieve full vaporization. The cost of exchanger no. ‘2’ increased substantially, owing to the low duty for a condenser/evaporator combination. If the process permits, it should be combined with other exchangers. Compressor intercoolers were designed for split-shell side flow ‘G type’ to avoid an excessive drop in pressure. In the original cycle, the process fluid for these exchangers remains in the tubes. Baffles are adjusted to keep the pressure drop within the maximum range of ±5% of the original design. An increase in the cost of the new design is expected. Effluent and ammonia coolers were designed for single-shell pass, as condensation is expected as a result of cooling. A top-to-bottom approach is used for these exchangers, which is associated with increased cost. A stripper condenser was designed with ‘H type’ double-split flow in response to pressure drop limitations. The total cost of the exchangers is approximately USD 9.3 million.
Table 5.
Process coolers design and cost.
A comparison of heat transfer coefficient of the heat exchangers is shown in Figure 5. These coefficients were calculated based on ASPEN EDR simulation, with relations provided in [28,37,38]. The abscissa represents the exchanger, as shown in Table 1 and Table 5. Phase changes in condensers results in increased process-side heat transfer coefficients. On the other hand, as compressor intercoolers deals with relatively low-pressure gas, they exhibit lower heat transfer coefficients; the same is true for gas coolers. The stripper condenser process side contains large quantities of non-condensable carbon dioxide, resulting in a suppressed process-side heat transfer coefficient. Increasing the gas pressure increases the density; thus, the process-side coefficient is superior for high-pressure gas coolers. Exchanger no. 15, i.e., the ammonia gas cooler, has a lower coefficient relative to the other two exchangers (16 and 17), which are ammonia vapor condensers. Process coefficients increase when the phase changes to liquid. In order to design an effective dry cooling network, phase-changing fluid may help, as it provides higher cooling loads per unit mass due to the latent heat. The penalty in overall heat transfer coefficients is minimal for the proposed cycle, which can also be attributed to the cleanliness of the closed-cycle cooling fluid. As scaling and fouling are considerably reduced relative to the cooling water, only exchangers nos. 2, 4 and 10 have a lower coefficient than that of the original cooling cycle. Generally, improved heat transfer is expected with tailored fluid in the proposed cycle.
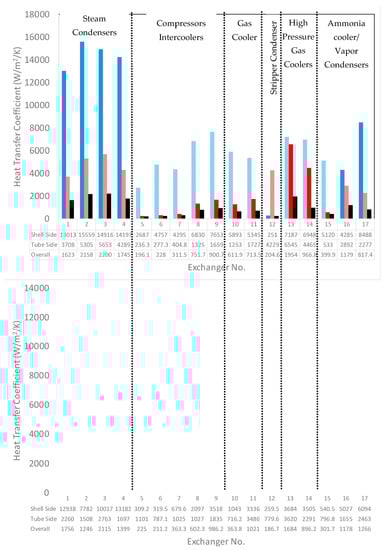
Figure 5.
Heat transfer coefficient. Blue—shell side; red—Tube side, including the conductive heat transfer coefficient of tubes; black—overall heat transfer coefficient; striped bars—cooling water side. A fouling resistance of 0.00022 m2/W/K is assumed for the cooling water side. Top—original water-cooled exchangers; bottom—exchanger for the proposed cycle.
Another advantage of the proposed cooling cycle is the relatively low cooling temperature variations throughout the year. In a typical cooling tower, the water temperature depends on the dry bulb temperature and humidity. A chart showing the two parameters for the last year is provided in Figure 6. Two extremes are taken into account, from April until September and from October until March. From April to September, the average temperature is high, with high humidity associated with the rainy season. During this period, the cooling water temperature increased to 40 °C on a typical day with extreme conditions. On the other hand, the low humidity in combination with low dry bulb temperature in winter (October to March) considerably reduces the water temperature to as low as 5 °C. A variation of 35 °C in cooling water temperature results in process equipment overdesign. Furthermore, it is theoretically assumed that lower the environment/cold reservoir temperature, the higher the process efficiency, despite a negative impact for some processes, for example, a typical Rankine power generation cycle, as shown in Figure 7 P-H. Condensers are usually equipped with ejectors to keep the pressure at the designated value, which is set based on the average value of the cooling fluid temperature. If the temperature is lower than the designated value, then a lower pressure must be maintained by the ejectors to reap the benefits of the low cold reservoir temperature. However, if the pressure is not maintained at saturation, rather than conversion of the energy into the work, the lower cooling fluid temperature results in the subcooling of the process liquid, requiring more heat to ensure turbine inlet temperature, thus decreasing the power cycle efficiency.
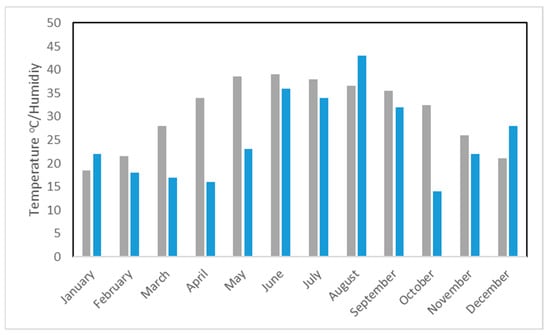
Figure 6.
Weather data for the last year at the plant site [39]. Gray—temperature (°C), blue—humidity.
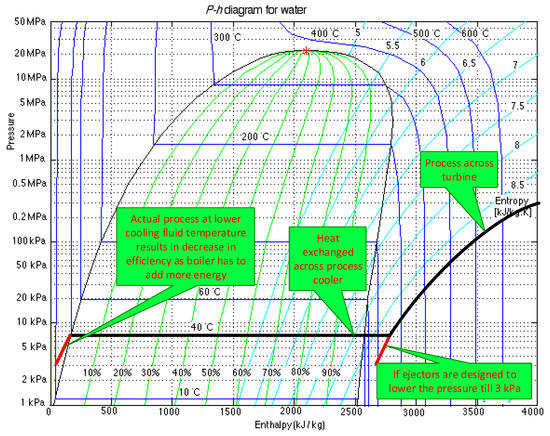
Figure 7.
Pictorial process description of a practical Rankine cycle operating at temperatures lower than the designated cooling water temperature. Data adapted from NIST [40].
On the other hand, the proposed cycle does not considerably alter the cold temperature, as shown in Figure 8. In the ambient air temperature range of 55–25 °C, a change of only 2 °C in the inlet cooling fluid temperature is expected because the system no longer depends on the humidity or wet bulb temperature of the environment. However, the compressor work increases as the temperature of the environment increases up to a threshold limit, after which the cycle becomes a conventional vapor compression refrigeration cycle. The limit in the test case is approximately 50 °C but can be adjusted by changing the composition of the cooling fluid. The ‘CoP’ also behaves accordingly, as the compressor requires an increased workload. The volumetric flow of the compressor changes with the temperature and load conditions, so a variable speed axial compressor is recommended for such services. Below 25 °C, the refrigeration cycle completely shuts off, and further temperature drops in the cooling fluid can be adjusted by managing the air cooler fan, which can be easily accomplished by sequentially turning off the cells. A constant cold reservoir temperature over an extended period of time will help the designer to optimize the overall plant efficiency by decreasing the operational optimization variable, in addition to providing improved plant control.
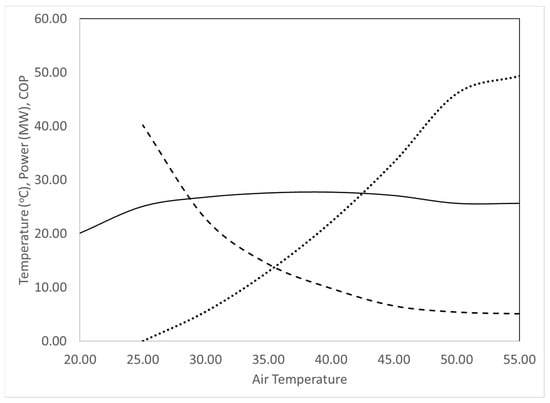
Figure 8.
Effect of ambient air temperature on cooling fluid inlet temperature (continuous line), compressor power requirement (dotted line) and CoP (dashed line).
3.6. Economic Comparison
In the proposed cycle, air coolers are equipped with forced fans, and tubes are G-finned with an effective area of 377,597 m2 and 521,834 m2. Estimated costs are USD 7.01 million and 7.32 million. The total cost of the exchangers is USD 9.3 million. The compressor cost estimated by the ASPEN economic evaluator is USD 35.78 million. The cost of the pumps and vessel is approximately USD 3 million. The equipment cost for the original cycle is estimated to be USD 20.37 million. The total capital investment required for the cooling circuit can be calculated according to the method specified in [41]. Costs are provided in Table 6 based on the referenced method, with a total capital cost for the original cooling circuit of USD 123.2 million, whereas the proposed cycle cost is approximately three times, at USD 377.46 million. However, the proposed cycle has major advantages that justify the additional cost. Further research on such cycles is essential to promote sustainability.
Table 6.
Economic evaluation of the two cooling cycles.
4. Conclusions
Water conservation is of particular importance and is essential for environmental and food security. Feasibility studies of many new industrial setups are subject to water constraints. Many environmental agencies worldwide are imposing water usage limitations on existing setups, representing a moral and social obligation of the processing industry. Ammonia manufacturing setups for high-pressure and high-temperature processing require high cooling loads. On one hand, such plants are erected to ensure food security by producing fertilizer; on the other hand, their requirements for cooling water are considerable. In the present study, an alternative to wet cooling cycles was proposed to provide comparative cold reservoir temperatures for high-end loads, such as ammonia manufacturing. Existing coolers in ammonia manufacturing cycles were simulated using ASPEN EDR, and validated according using operational data. Approximately 50% of the cooling load is required by power generation cycles. Cooling tower costs were estimated assuming a total load of 215 MW. The total cost of the existing system is estimated to be USD 20.37 million, with an estimated water usage of 6.7 m3/min if the system is working under the designed conditions.
An integrated cycle using dry air cooling and compression refrigeration is suggested. The proposed cooling cycle has various technical advantages, such as improved plant operation, low chemical usage and environmental friendliness, provided the energy requirements are meet by renewables. The cycle was analyzed herein using simple fluids; however, further optimization can be achieved using tailored fluids. Model convergence can be achieved using standard processing techniques. Heat exchangers were designed based on the new system, and the cost was estimated. A 12% increase in cost was calculated for the exchangers adapted to the new cycle. The heat transfer coefficients of the prosed cycle heat exchangers are also comparable, as closed-circuit fluid is cleaner relative to the cooling water used in humidifiers. The proposed cycle cooling fluid temperature is less affected by the ambient temperature, with associated advantages in terms of design optimization. The ‘CoP’ of the proposed cycle is 6.55 with at an ambient temperature of 45 °C. However, the CoP increased to 14.3 as the temperature drops to 35 °C, representing a significantly improvement relative to the existing wet cooling cycle.
Despite resource saving, a dry air cycle requires considerable capital investment of approximately three times the amount required for conventional cooling towers. However, wet cooling cycles need to be replaced by an alternative method as a result of known issues. Furthermore, if energy is generated using renewables, a considerable decrease in cooling load can be achieved, making proposed cycle feasible and sustainable.
Author Contributions
Concept and investigation, A.A.T., U.S. and S.-u.R.; resources, A.M.S. and A.A.S.; supervision, S.A.-S., H.S.B., H.A. and W.M.A.; writing—reviewing and editing, A.A.T., U.S. and S.-u.R. All authors have read and agreed to the published version of the manuscript.
Funding
This research work was funded by Institutional Fund Projects under grant no. (IFPNC-003-135-2020). Therefore, authors gratefully acknowledge technical and financial support from the Ministry of Education and King Abdulaziz University, Jeddah, Saudi Arabia.
Data Availability Statement
Not applicable.
Conflicts of Interest
The authors declare no conflict of interest.
Nomenclature
| Abbreviations | Description |
| CoP | Coefficient of performance; ratio of heat absorbed to work consumed |
| CP | Constant-pressure heat capacity (J·kg−1·K−1) |
| di | Tube inside diameter (m) |
| do | Tube outside diameter (m) |
| Ft | Temperature gradient correction factor due to flow arrangement |
| hi | Inside convective heat transfer coefficient (W·m−2·K−1) |
| hid | Inside dirt (fouling) convective heat transfer coefficient (W·m−2·K−1) |
| ho | Outside convective heat transfer coefficient (W·m−2·K−1) |
| hod | Outside dirt (fouling) convective heat transfer coefficient (W·m−2·K−1) |
| HVAC | Heating, ventilation and air conditioning |
| IAPWS | International Association for the Properties of Water and Steam |
| kw | Thermal conductivity for the material of the tubes (W·m−1·K−1) |
| m | Mass flow (kg·h−1) |
| P | Pressure (Pa) |
| Psat | Saturation vapor pressure of liquid (Pa) |
| Q | Heat huty (J·h−1) |
| T | Temperature (K) |
| TEMA | Tubular Exchanger Manufacturing Association |
| U | Overall heat transfer coefficient (W·m−2·K) |
| ΔTLM | Log-mean temperature difference (LMTD) |
| xi | Liquid mole fraction |
| yi | Vapor mole fraction |
| λ | Heat absorbed or liberated due to phase change (J·kg−1) |
| φl | Fugacity of liquid |
| φv | Fugacity of vapor |
References
- Ge, W.; Zhao, Y.; Song, S.; Li, W.; Gao, S.; Chen, T. Thermal characteristics of dry cooling tower reconstructed from obsolete natural draft wet cooling tower and the relevant thermal system coupling optimization. Appl. Therm. Eng. 2020, 174, 115202. [Google Scholar] [CrossRef]
- Hasan, A.; Vuolle, M.; Sirén, K.; Holopainen, R.; Tuomaala, P. A cooling tower combined with chilled ceiling: System optimisation. Int. J. Low-Carbon Technol. 2007, 2, 217–224. [Google Scholar] [CrossRef]
- Asvapoositkul, W.; Kuansathan, M. Comparative evaluation of hybrid (dry/wet) cooling tower performance. Appl. Therm. Eng. 2014, 71, 83–93. [Google Scholar] [CrossRef]
- Wagner, M.J.; Kutscher, C. The impact of hybrid WET/DRY cooling on concentrating solar power plant performance. In Proceedings of the ASME 2010 4th International Conference on Energy Sustainability, ES 2010, Phoenix, AZ, USA, 17–22 May 2010; pp. 675–682. [Google Scholar] [CrossRef]
- Dehaghani, S.T.; Ahmadikia, H. Retrofit of a wet cooling tower in order to reduce water and fan power consumption using a wet/dry approach. Appl. Therm. Eng. 2017, 125, 1002–1014. [Google Scholar] [CrossRef]
- Nourani, Z.; Naserbegi, A.; Tayyebi, S.; Aghaie, M. Thermodynamic evaluation of hybrid cooling towers based on ambient temperature. Therm. Sci. Eng. Prog. 2019, 14, 100406. [Google Scholar] [CrossRef]
- Golkar, B.; Naserabad, S.N.; Soleimany, F.; Dodange, M.; Ghasemi, A.; Mokhtari, H.; Oroojie, P. Determination of optimum hybrid cooling wet/dry parameters and control system in off design condition: Case study. Appl. Therm. Eng. 2018, 149, 132–150. [Google Scholar] [CrossRef]
- Hu, H.; Li, Z.; Jiang, Y.; Du, X. Thermodynamic characteristics of thermal power plant with hybrid (dry/wet) cooling system. Energy 2018, 147, 729–741. [Google Scholar] [CrossRef]
- Lindahl, P.A., Jr.; Jameson, R.W. Plume Abatement and Water Conservation with the Wet/Dry Cooling Tower; Electric Power Research Institute: Palo Alto, CA, USA, 1995. [Google Scholar]
- Wei, H.; Chen, L.; Huang, X.; Ge, Z.; Yang, L.; Du, X. Performance of a novel natural draft hybrid cooling system with serial airside heat exchange. Appl. Therm. Eng. 2018, 147, 361–370. [Google Scholar] [CrossRef]
- Kong, Y.; Wang, W.; Huang, X.; Yang, L.; Du, X.; Yang, Y. Direct dry cooling system through hybrid ventilation for improving cooling efficiency in power plants. Appl. Therm. Eng. 2017, 119, 254–268. [Google Scholar] [CrossRef]
- Deziani, M.; Rahmani, K.; Roudaki, S.M.; Kordloo, M. Feasibility study for reduce water evaporative loss in a power plant cooling tower by using air to Air heat exchanger with auxiliary Fan. Desalination 2017, 406, 119–124. [Google Scholar] [CrossRef]
- Rezaei, E.; Shafiei, S.; Abdollahnezhad, A. Reducing water consumption of an industrial plant cooling unit using hybrid cooling tower. Energy Convers. Manag. 2010, 51, 311–319. [Google Scholar] [CrossRef]
- Sun, Y.; Duniam, S.; Guan, Z.; Gurgenci, H.; Dong, P.; Wang, J.; Hooman, K. Coupling supercritical carbon dioxide Brayton cycle with spray-assisted dry cooling technology for concentrated solar power. Appl. Energy 2019, 251, 113328. [Google Scholar] [CrossRef]
- Zhang, Z.; Gao, M.; Dang, Z.; He, S.; Sun, F. An exploratory research on performance improvement of super-large natural draft wet cooling tower based on the reconstructed dry-wet hybrid rain zone. Int. J. Heat Mass Transf. 2019, 142, 118465. [Google Scholar] [CrossRef]
- Huang, Y.; Chen, L.; Huang, X.; Du, X.; Yang, L. Performance of natural draft hybrid cooling system of large scale steam turbine generator unit. Appl. Therm. Eng. 2017, 122, 227–244. [Google Scholar] [CrossRef]
- Njoku, I.H.; Diemuodeke, O.E. Techno-economic comparison of wet and dry cooling systems for combined cycle power plants in different climatic zones. Energy Convers. Manag. 2020, 227, 113610. [Google Scholar] [CrossRef]
- Butler, C.; Grimes, R. The effect of wind on the optimal design and performance of a modular air-cooled condenser for a concentrated solar power plant. Energy 2014, 68, 886–895. [Google Scholar] [CrossRef]
- Conradie, A.; Kröger, D. Performance evaluation of dry-cooling systems for power plant applications. Appl. Therm. Eng. 1996, 16, 219–232. [Google Scholar] [CrossRef]
- Arie, M.A.; Shooshtari, A.H.; Ohadi, M.M. Experimental characterization of an additively manufactured heat exchanger for dry cooling of power plants. Appl. Therm. Eng. 2018, 129, 187–198. [Google Scholar] [CrossRef]
- Li, X.; Duniam, S.; Gurgenci, H.; Guan, Z.; Veeraragavan, A. Full scale experimental study of a small natural draft dry cooling tower for concentrating solar thermal power plant. Appl. Energy 2017, 193, 15–27. [Google Scholar] [CrossRef]
- Javadi, M.A.; Khodabakhshi, S.; Ghasemiasl, R.; Jabery, R. Sensivity analysis of a multi-generation system based on a gas/hydrogen-fueled gas turbine for producing hydrogen, electricity and freshwater. Energy Convers. Manag. 2021, 252, 115085. [Google Scholar] [CrossRef]
- Ehsan, M.M.; Guan, Z.; Gurgenci, H.; Klimenko, A. Feasibility of dry cooling in supercritical CO2 power cycle in concentrated solar power application: Review and a case study. Renew. Sustain. Energy Rev. 2020, 132, 110055. [Google Scholar] [CrossRef]
- Hooman, K.; Guan, Z.; Gurgenci, H. Advances in dry cooling for concentrating solar thermal (CST) power plants. In Advances in Concentrating Solar Thermal Research and Technology; Elsevier Inc.: Amsterdam, The Netherlands, 2017; pp. 179–212. [Google Scholar] [CrossRef]
- Daou, K.; Wang, R.; Xia, Z. Desiccant cooling air conditioning: A review. Renew. Sustain. Energy Rev. 2006, 10, 55–77. [Google Scholar] [CrossRef]
- Sun, J.; Fu, L.; Zhang, S. A review of working fluids of absorption cycles. Renew. Sustain. Energy Rev. 2012, 16, 1899–1906. [Google Scholar] [CrossRef]
- TEMA. Standards of Tubular Exchanger Manufacturers Association, 6th ed.; TEMA Inc.: New York, NY, USA, 1978. [Google Scholar]
- Kern, D.Q. Process Heat Transfer; Tata McGraw-Hill Education: New York, NY, USA, 1997. [Google Scholar]
- Taborek, J. Heat Exchanger Design Handbook; Hemisphere: New York, NY, USA, 1983. [Google Scholar]
- Towler, G.; Sinnott, R. Chemical Engineering Design: Principles, Practice and Economics of Plant and Process Design, 6th ed.; Butterworth-Heinemann: Oxford, UK, 2021. [Google Scholar]
- Wagner, W.; Pruß, A. The IAPWS Formulation 1995 for the thermodynamic properties of ordinary water substance for general and scientific use. J. Phys. Chem. Ref. Data 2002, 31, 387–535. [Google Scholar] [CrossRef]
- Seong, G.; Yoo, K.-P.; Lim, J.S. Vapor−liquid equilibria for propane (R290) + n-Butane (R600) at various temperatures. J. Chem. Eng. Data 2008, 53, 2783–2786. [Google Scholar] [CrossRef]
- Beránek, P.; Wichterle, I. Vapour—Liquid equilibria in the propane—n-butane system at high pressures. Fluid Phase Equilibria 1981, 6, 279–282. [Google Scholar] [CrossRef]
- Vejrosta, J.; Wichterle, I. The propane-pentane system at high pressures. Collect. Czechoslov. Chem. Commun. 1974, 39, 1246–1248. [Google Scholar] [CrossRef]
- Sage, B.H.; Lacey, W.N. Phase Equilibria in Hydrocarbon Systems Propane–n–Pentane System. Ind. Eng. Chem. 1940, 32, 992–996. [Google Scholar] [CrossRef]
- Kay, W.B.; Hoffman, R.L.; Davies, O. Vapor-Liquid Equilibrium Relations of Binary Systems n-Butane-n-Pentane and n-Butane-n-Hexane. J. Chem. Eng. Data 1975, 20, 333–338. [Google Scholar] [CrossRef]
- Bergman, T.L.; Incropera, F.P. Fundamentals of Heat and Mass Transfer; John Wiley & Sons: Hoboken, NJ, USA, 2011. [Google Scholar]
- Sinnott, R.; Towler, G. Chemical Engineering Design: SI Edition; Butterworth-Heinemann: Oxford, UK, 2019. [Google Scholar]
- World Weather Online. 14 Day Weather Forecast|World Weather Online. World Weather Online Website. 2018. Available online: https://www.worldweatheronline.com/ (accessed on 22 July 2021).
- Water. NIST. Available online: https://webbook.nist.gov/cgi/cbook.cgi?Name=water&Units=SI (accessed on 22 July 2021).
- Peters, M.S.; Timmerhaus, K.D.; West, R.E. Plant Design and Economics for Chemical Engineers; McGraw-Hill: New York, NY, USA, 2003; Volume 4. [Google Scholar]


Publisher’s Note: MDPI stays neutral with regard to jurisdictional claims in published maps and institutional affiliations. |
© 2022 by the authors. Licensee MDPI, Basel, Switzerland. This article is an open access article distributed under the terms and conditions of the Creative Commons Attribution (CC BY) license (https://creativecommons.org/licenses/by/4.0/).