1. Introduction
Global energy demand is increasing exponentially due to the growing population around the world along with economic growth, particularly in emerging market economies. The worldwide attention has been shifted to renewable energy applications to enhance energy security and reduce environmental impact [
1]. Among different types of fuel cells, a proton exchange membrane fuel cell (PEMFC) is one of the promising renewable energy applications [
2]. The fuel cell is typically utilized in portable automotive applications due to the advantage of quick-starting, low-temperature operation, high density, and zero pollution [
3]. Continuous improvement of PEMFC efficiency to attain the desired power output for automotive applications has been carried out in the past decade. The fuel cell possesses minimal weight and cost. A low-performance PEMFC significantly hinders the application and commercialization of fuel cell technology. The computational fluid dynamics modeling approach could predict and evaluate the performance of PEMFC with minimal time and cost-effectiveness. Over the years, researchers have continuously employed numerical methods to attain comparable predicted results with the experimental values for PEMFCs [
4,
5,
6]. Numerical studies on the effect of the PEMFC flow field and manifold patterns on fluid transport [
5,
7,
8,
9], mass and ionic transport in the membrane electrode assembly (MEA) [
10,
11,
12], and PEMFC operating parameters [
13,
14] affecting its performance have been widely reported to understand the phenomena in PEMFCs, which are difficult to capture and expensive to build experimentally. From the literature, two geometry modeling approaches have been applied in predicting the performance of PEMFCs. The simplest model is introduced by simplifying the model geometry, where a straight or U-shaped single channel is modeled by neglecting the flow field pattern or the overall active area of the PEMFC. This model reduces the computational time and load as a single channel and eliminates the study of flow distribution. Thus, this model is commonly adopted by researchers to investigate the fluid and ionic transport in channels and toward the MEA layer [
15,
16]. Researchers also used this model to study the effect of channel walls on cell performance. Zhang et al. and Perng et al. used this model to study the effect of wedge-shaped fins and baffles in a channel on PEMFC performance [
17,
18]. The second numerical approach for PEMFC is by adopting a complete model. This includes the overall active area and complete flow field design for PEMFC performance modeling, and the model is often seen in recent literature [
19,
20]. Xu et al. adopted a complete model, including a full flow field on the anode and cathode, and also MEA layers for optimizing the cathode flow field [
21].
The accuracy of numerical modeling is often validated with experimental values. This is usually carried out before a researcher proceeds with the numerical investigation. Numerical model validation is reported in the early part of the results and discussion to prove the reliability of numerical works. For PEMFC modeling, an I-V curve is often used to show the average difference in percentage between numerical and experimental results. The average difference is commonly known to be low or show a coinciding and similar graph trend. Zhang et al. employed a complete model to study the effect of a rib-like flow channel on PEMFC performance [
22]. Validation was carried out by establishing a complete geometrical model with dimensions according to the experiment. A 2.5% difference was reported from the validation study. Another complete geometry model validation carried out by Liao et al. showed a coinciding I-V curve of numerical and experimental results [
23]. Sezgin et al. validated a numerical model using a single-channel model with a 25 cm
2 active area experimental prototype and reported a similar I-V curve trend but with a higher difference at lower cell voltages [
24]. Liu et al. validated a U-shaped model with the experimental result of a full 71 mm × 71 mm active area [
25]. It was reported that the numerical models at a current density higher than 1.2 A/cm
2 were not accurate enough, where an average of 24% percentage difference was significant for this validation.
Literature has shown that the geometry modeling approach affects the validation results. The average percentage differences are higher for the study adopting a single-channel model and low percentage differences are shown in the literature applying a complete geometry. To date, there is scarce literature discussing the effect of the PEMFC geometry model on the distribution of reactants, temperature, water, and performance. Thus, this paper aims to present the influence of different modeling geometries based on two contrasting 3D models, particularly single-channel and small-scale seven-channel models, by focusing on 0.6 V predicted PEMFC performance. Both 3D models are correlated with a multi-channel model [
26] from a previous study evaluating the effect of modeling scale on fuel cell performance. Comparisons between the models are made in terms of reactants, water, and current density distribution.
3. Results and Discussion
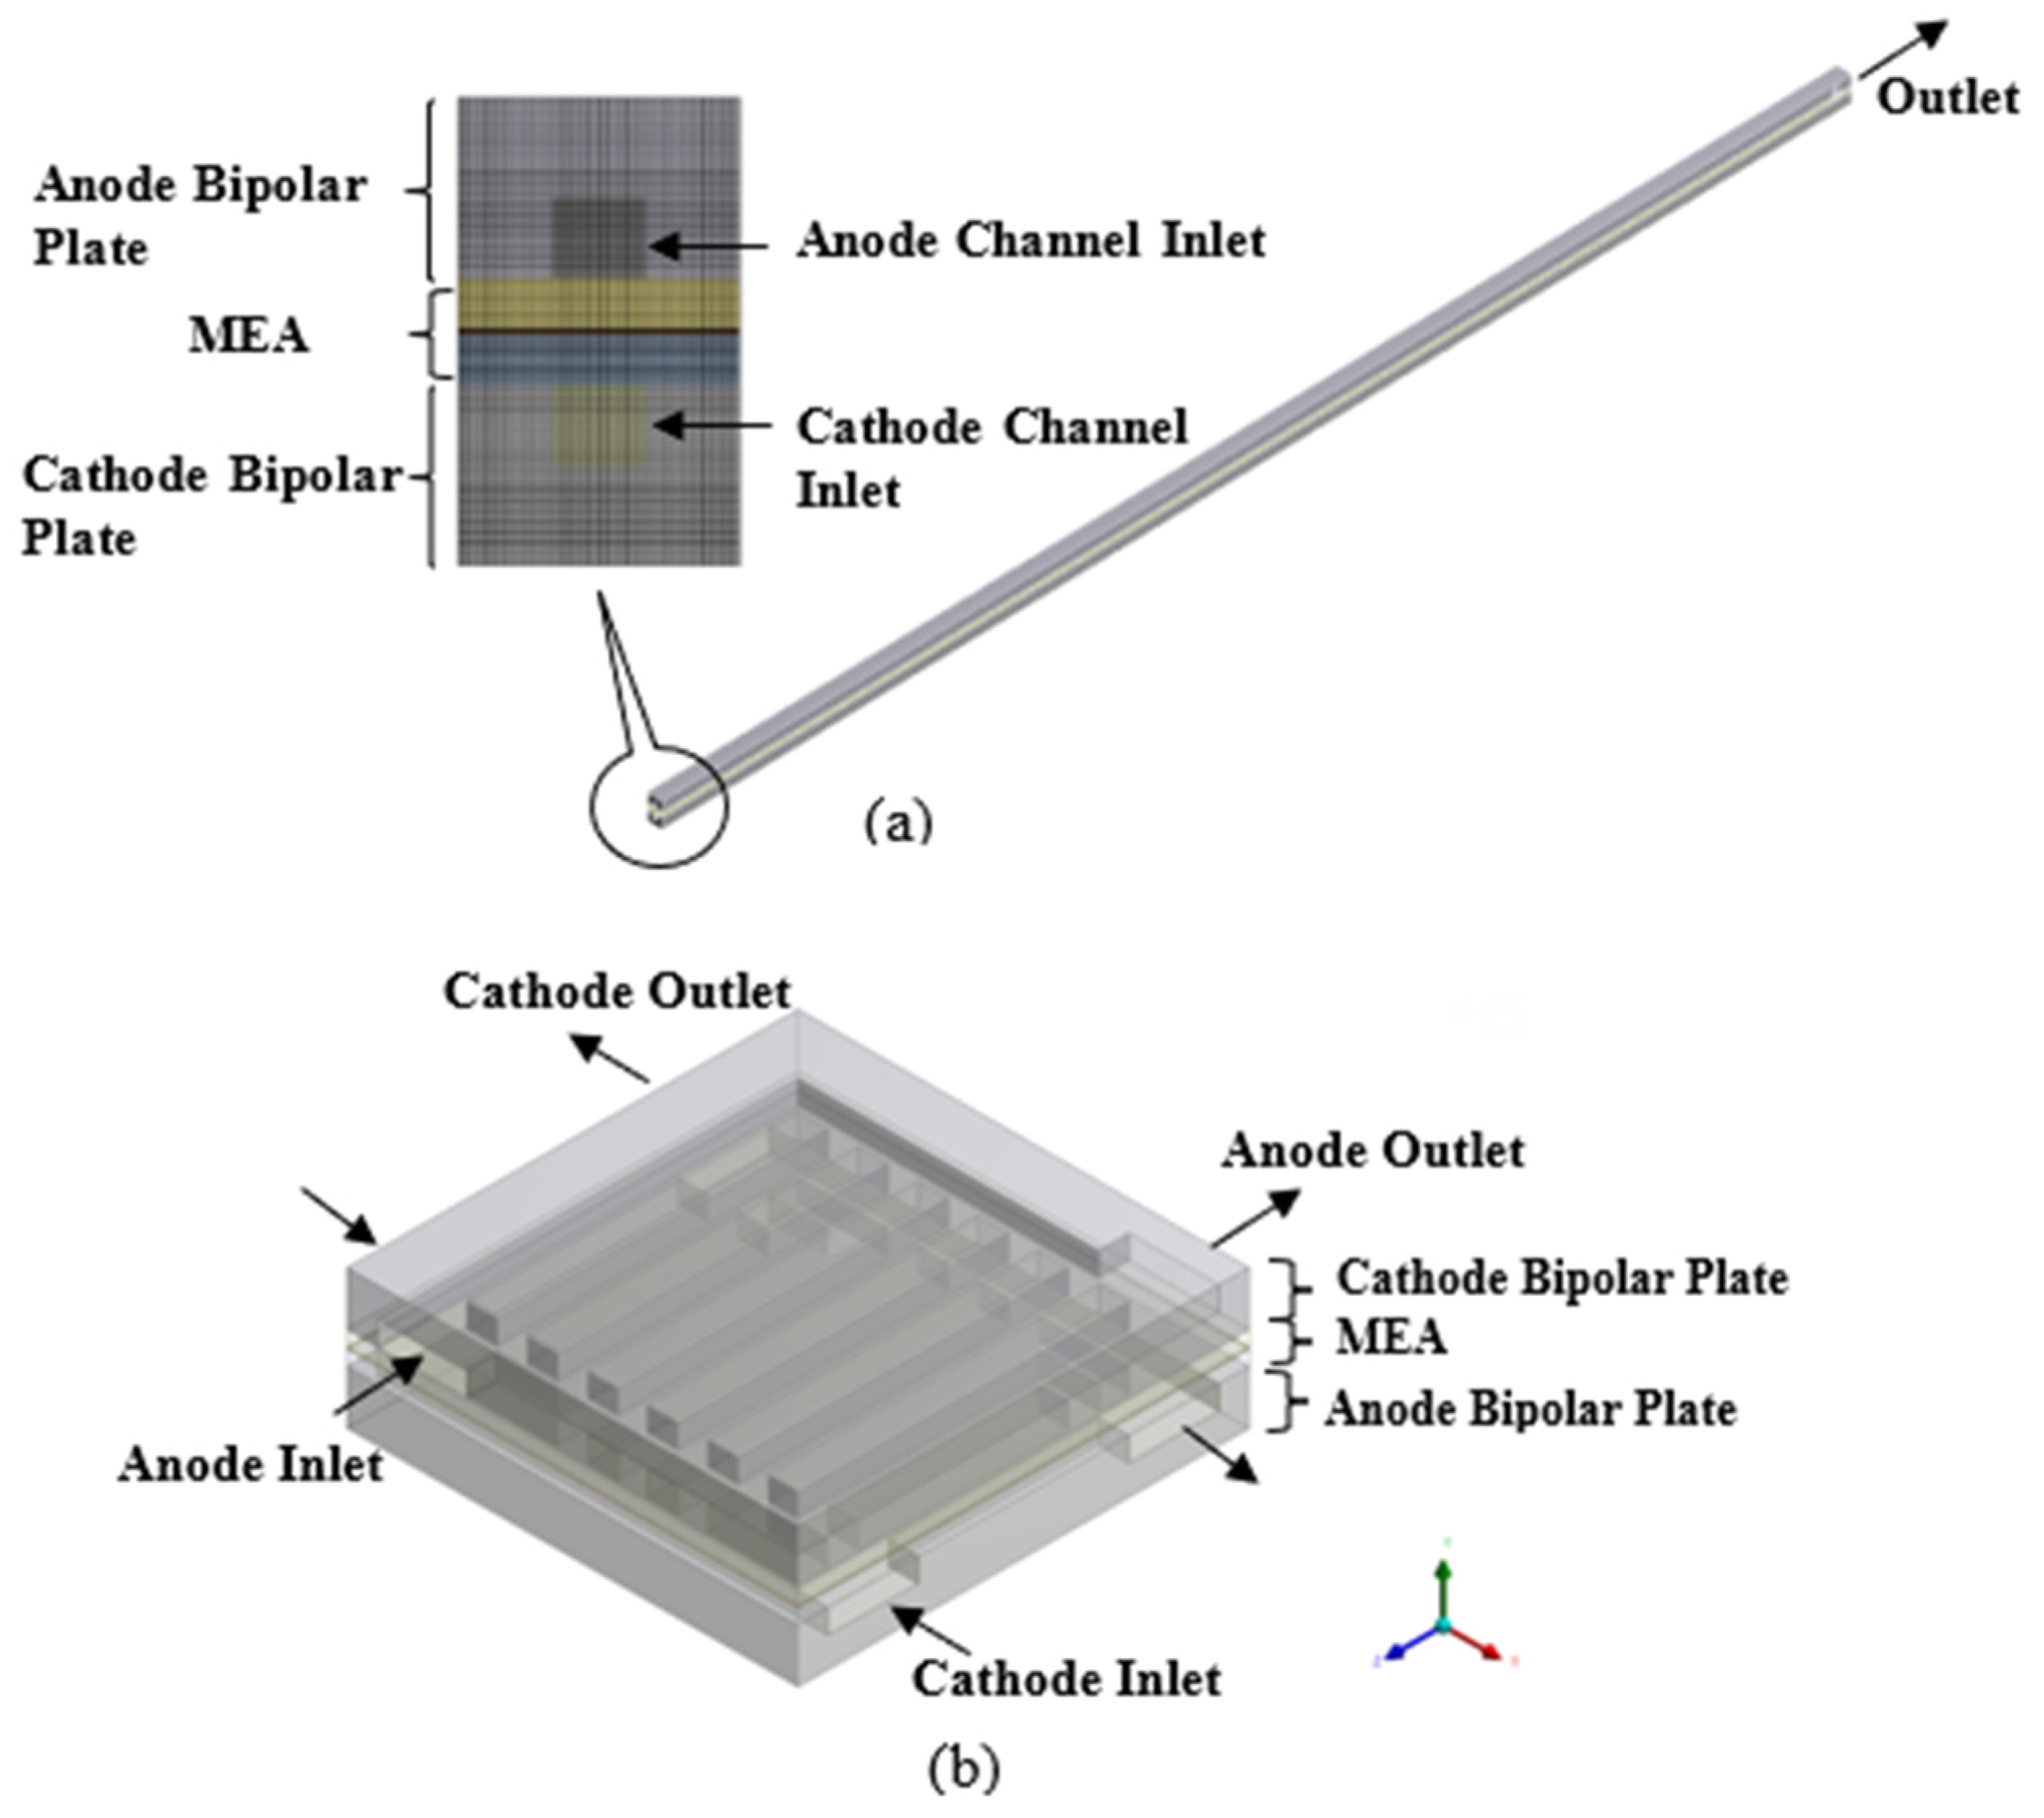
Three-dimensional single-channel and small-scale seven-channel models were utilized to determine the effect of geometry on the prediction of PEMFC performance. The fuel cell performance of the largest scale simulated in a previous study [
26] using a multi-channel model was utilized for comparison purposes. A polarization curve was employed to determine the effect of different geometry modeling methods on PEMFC performance. Both single-channel and small-scale seven-channel models were analyzed at different cell voltages from 0.9 V to 0.4 V to predict the current density.
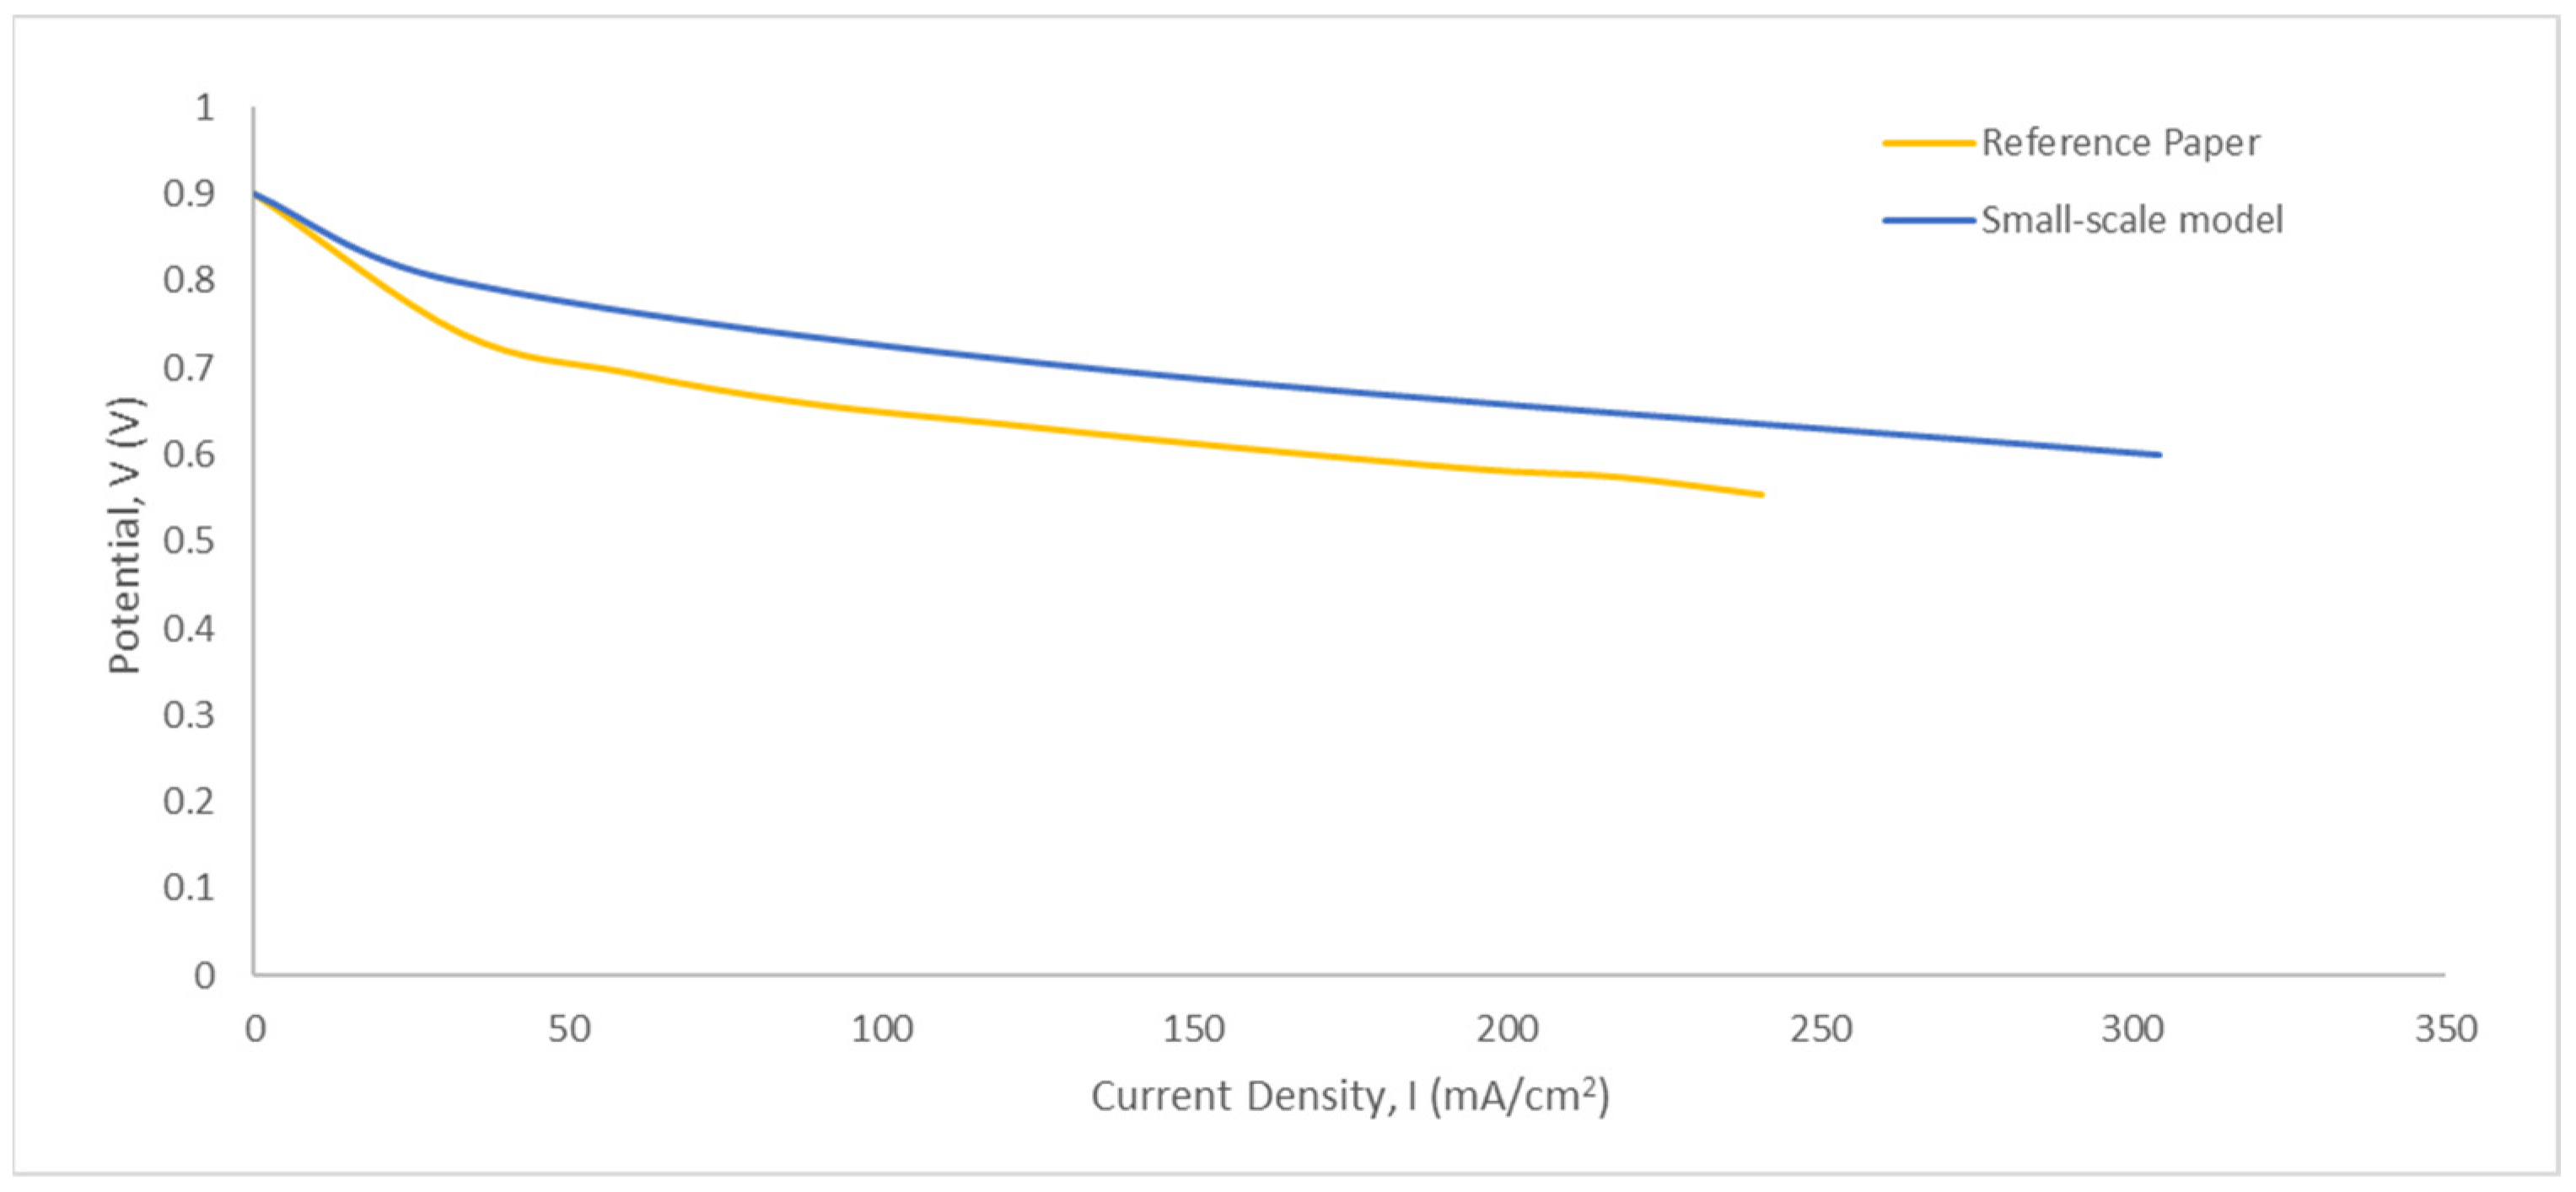
Figure 4 shows the comparison of the polarization curves for the models developed in this study (single-channel and small-scale seven-channel models) and the multi-channel model from the previous study. The single-channel model achieved the highest performance, followed by the small-scale seven-channel model. The multi-channel model showed low performance. As reported in the previous study, the multi-channel model had the largest active area with numerous channels. The cell performance was greatly affected by the large area and a high number of channels. At a cell capacity of 0.6 V, the current density generated by the single-channel model was 0.9 A/cm
2, followed by the small-scale seven-channel model (0.76 A/cm
2) and the multi-channel model (0.71 A/cm
2).
Typically, the PEMFC polarization curve is divided into three parts: activation, ohmic, and concentration losses [
28]. During activation loss, the cell goes through an irreversible voltage drop in the electrochemical reaction when oxidation and reduction occur. For the single-channel model, the activation loss occurred from the open-circuit voltage (OCV) to 0.8 V. A similar activation loss from OCV to 0.9 V was observed for the small-scale seven-channel and multi-channel models because both models had a similar flow field design in which reactant distribution occurred in the models. In terms of the single-channel model, no flow distribution occurred in the simulation results. For this reason, the current density generated by the single-channel model was greater than those by the seven-channel and multi-channel models.
Ohmic losses are the center phase of a polarization curve, as depicted in
Figure 4. The ohmic losses occur as a consequence of proton and electron transfer throughout the electrochemical reaction on the solid material in a particular bipolar plate, diffusion layers, and MEA. In this phase, the gradient of the graph represents the ohmic losses. The graph gradient was parallel with the ohmic loss. All three models exhibited comparable ohmic loss voltages in the range of 0.8 V-V. The multi-channel model revealed the highest ohmic loss in comparison to other models.
The final phase of the polarization curve, as illustrated in
Figure 4, portrays the density loss of the material. All the models showed the occurrence of density loss after 0.6 V cell capacity. At this phase, the cell experienced reactant starvation as a result of the high current density generation. Consequently, all the models displayed a decrease in current density generation during this phase.
The single-channel model showed greater performance as a consequence of model simplification coupled with the absence of reactant distribution (
Figure 4). The results from the seven-channel and multi-channel models indicated that the flow was distributed along the available channels.
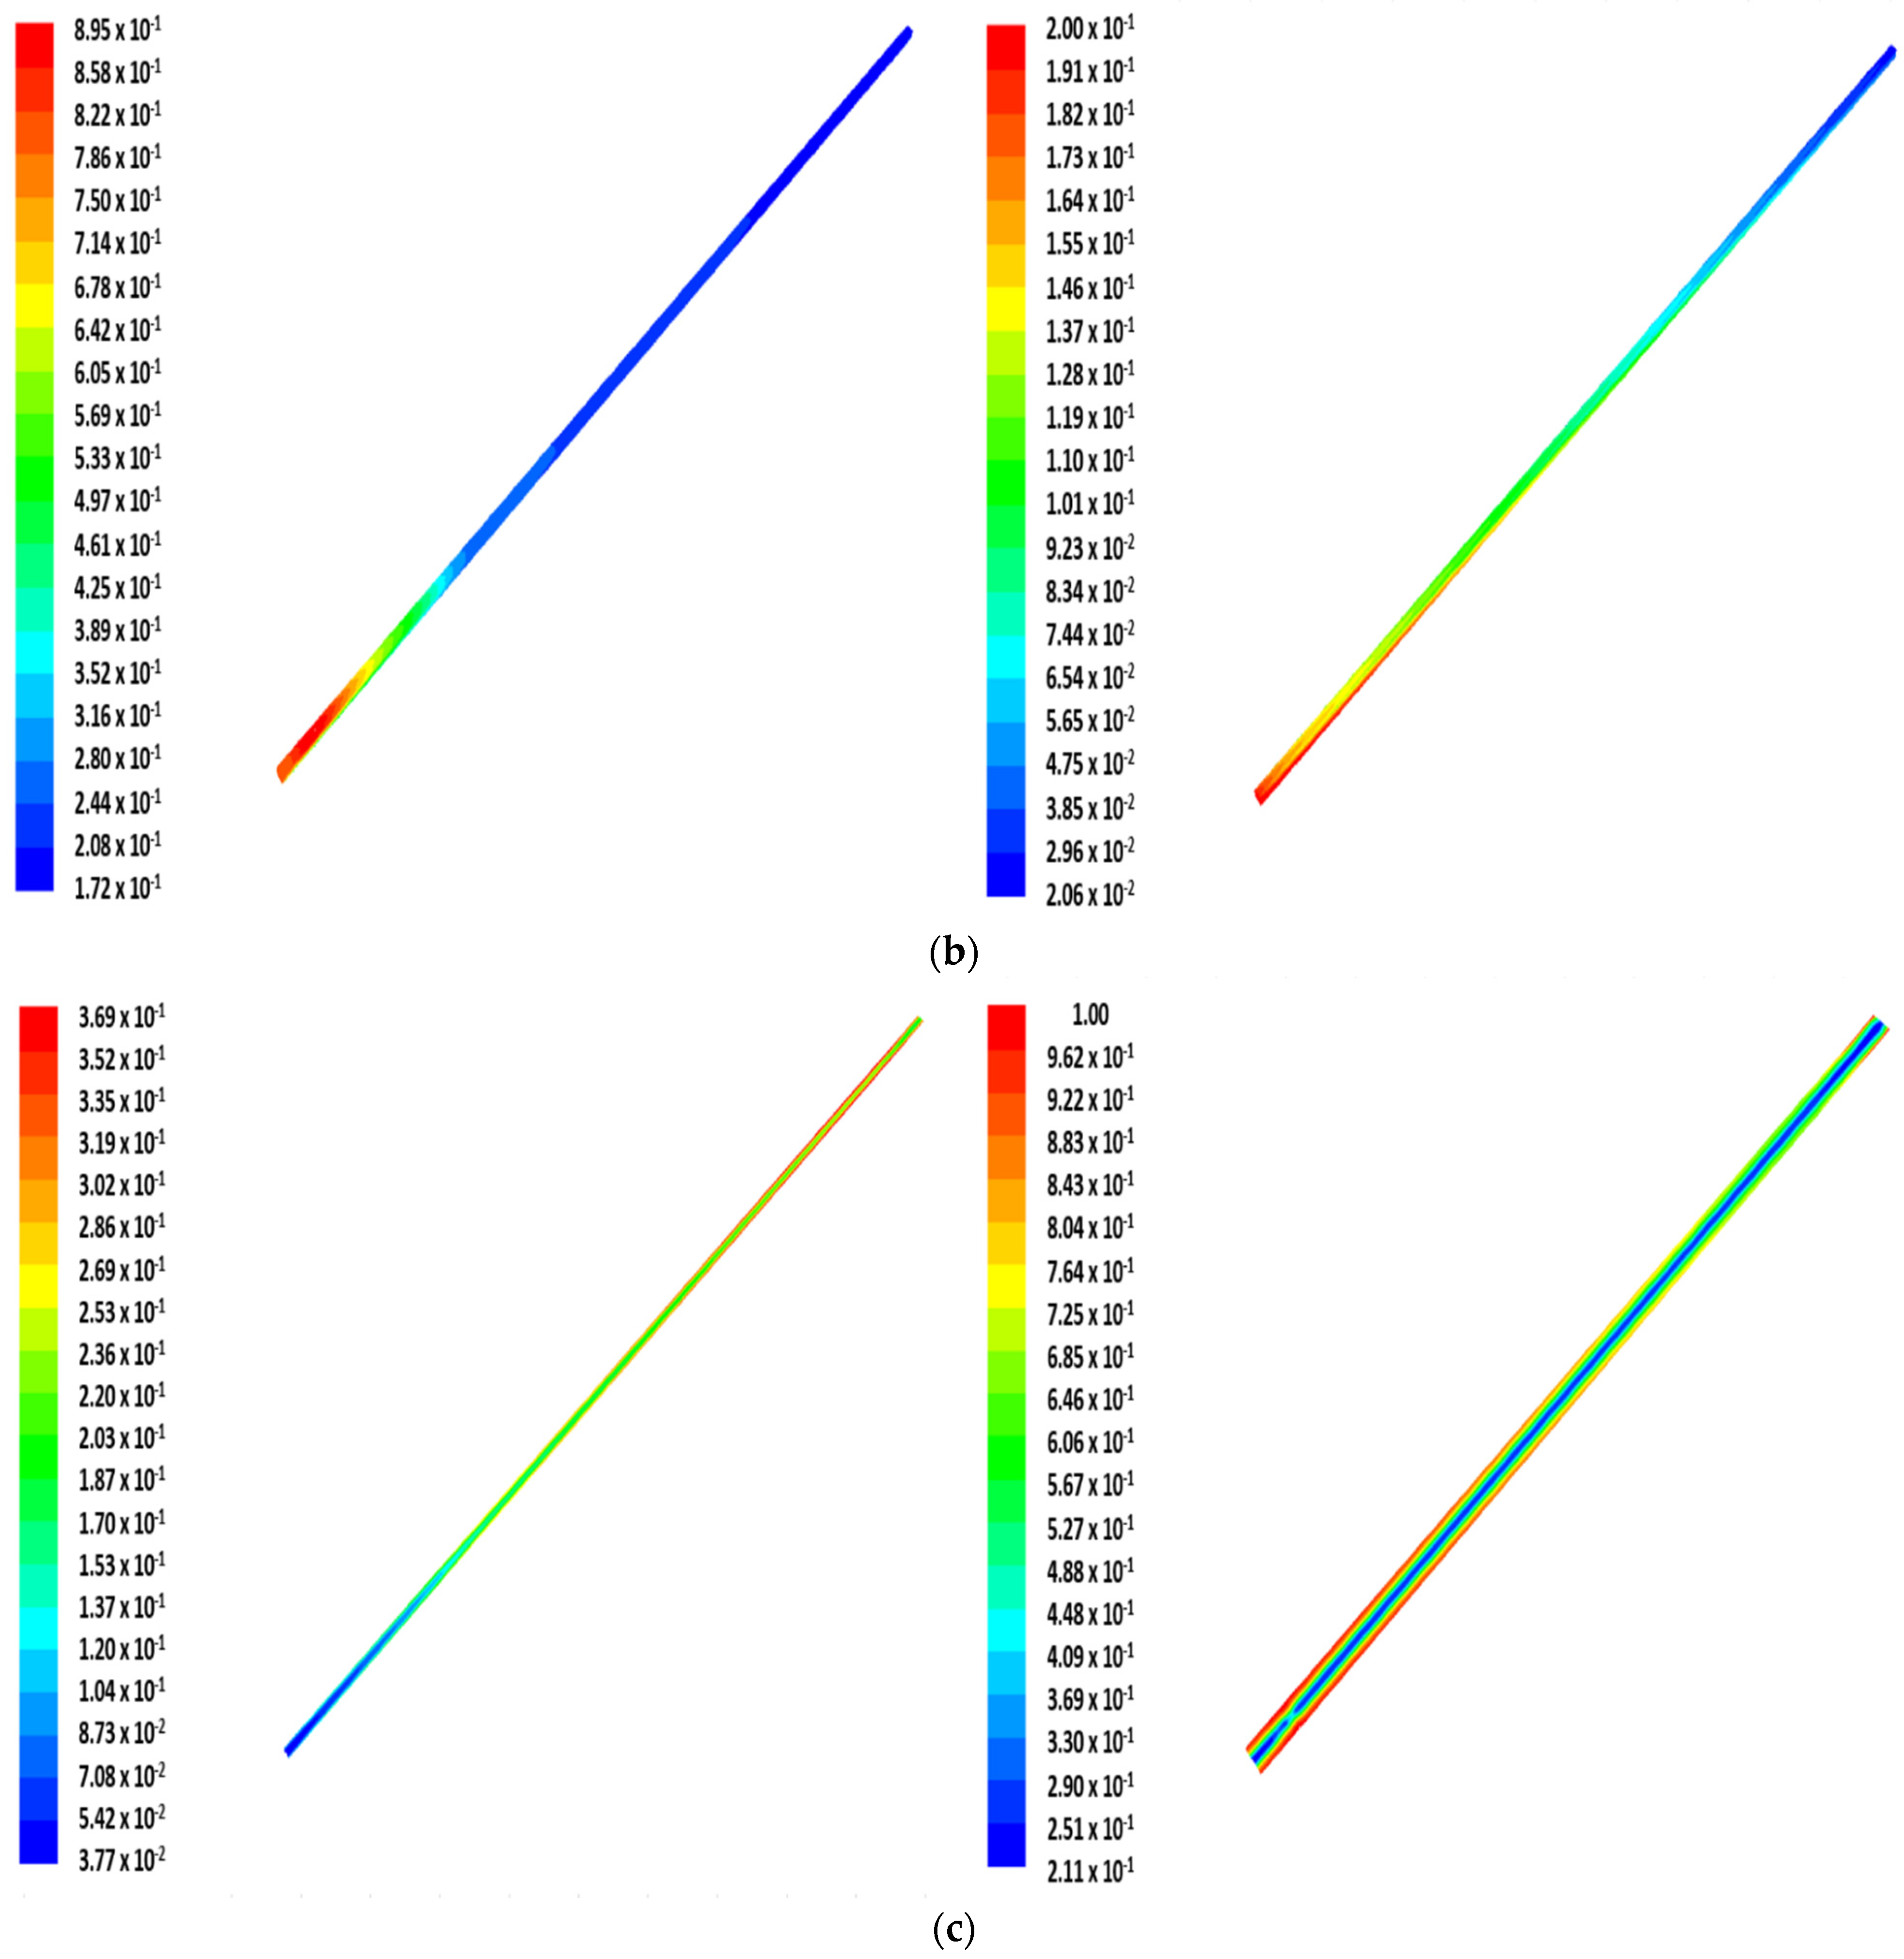
Figure 5a demonstrates the pressure drop between the gas diffusion layer and the channel. The comparison of the pressure drop between the anode (contour on the left) and the cathode (contour on the right) revealed that the cathode exhibited a higher pressure drop. This might be due to the entire air component (reactant) in the cathode compartment. In fact, the oxygen content in the air is only approximately 20%. Consequently, an elevated mass flow rate was dispensed to the cathode to enable the electrochemical reaction. The reactant distribution contours of hydrogen in the anode channel (contour on the left) and oxygen in the cathode channel (contour on the right) are illustrated in
Figure 5b. A declining trend in reactant concentration was observed from the inlet to the outlet due to the occurrence of electrochemical reactions, where the reactants were gradually consumed along the channels [
29].
Figure 5c presents the water content contour for the single-channel model in the gas diffusion layer of the anode (contour on the left) and the cathode (contour on the right). The water substance was generated during oxygen reduction. As a result, the cathode showed increasing water density on the gas diffusion layer along the flow channel. A high density of water content was evident near the inlet of the cathode. The occurrence of this phenomenon can be attributed to the higher electrochemical reaction rate near the inlet containing a high reactant concentration. The anode water distribution contour in
Figure 5c indicates the presence of back diffusion in the single-channel model. Higher water content was captured near the outlet of the anode, where water permeated from the cathode to the anode due to the difference in water content [
19].
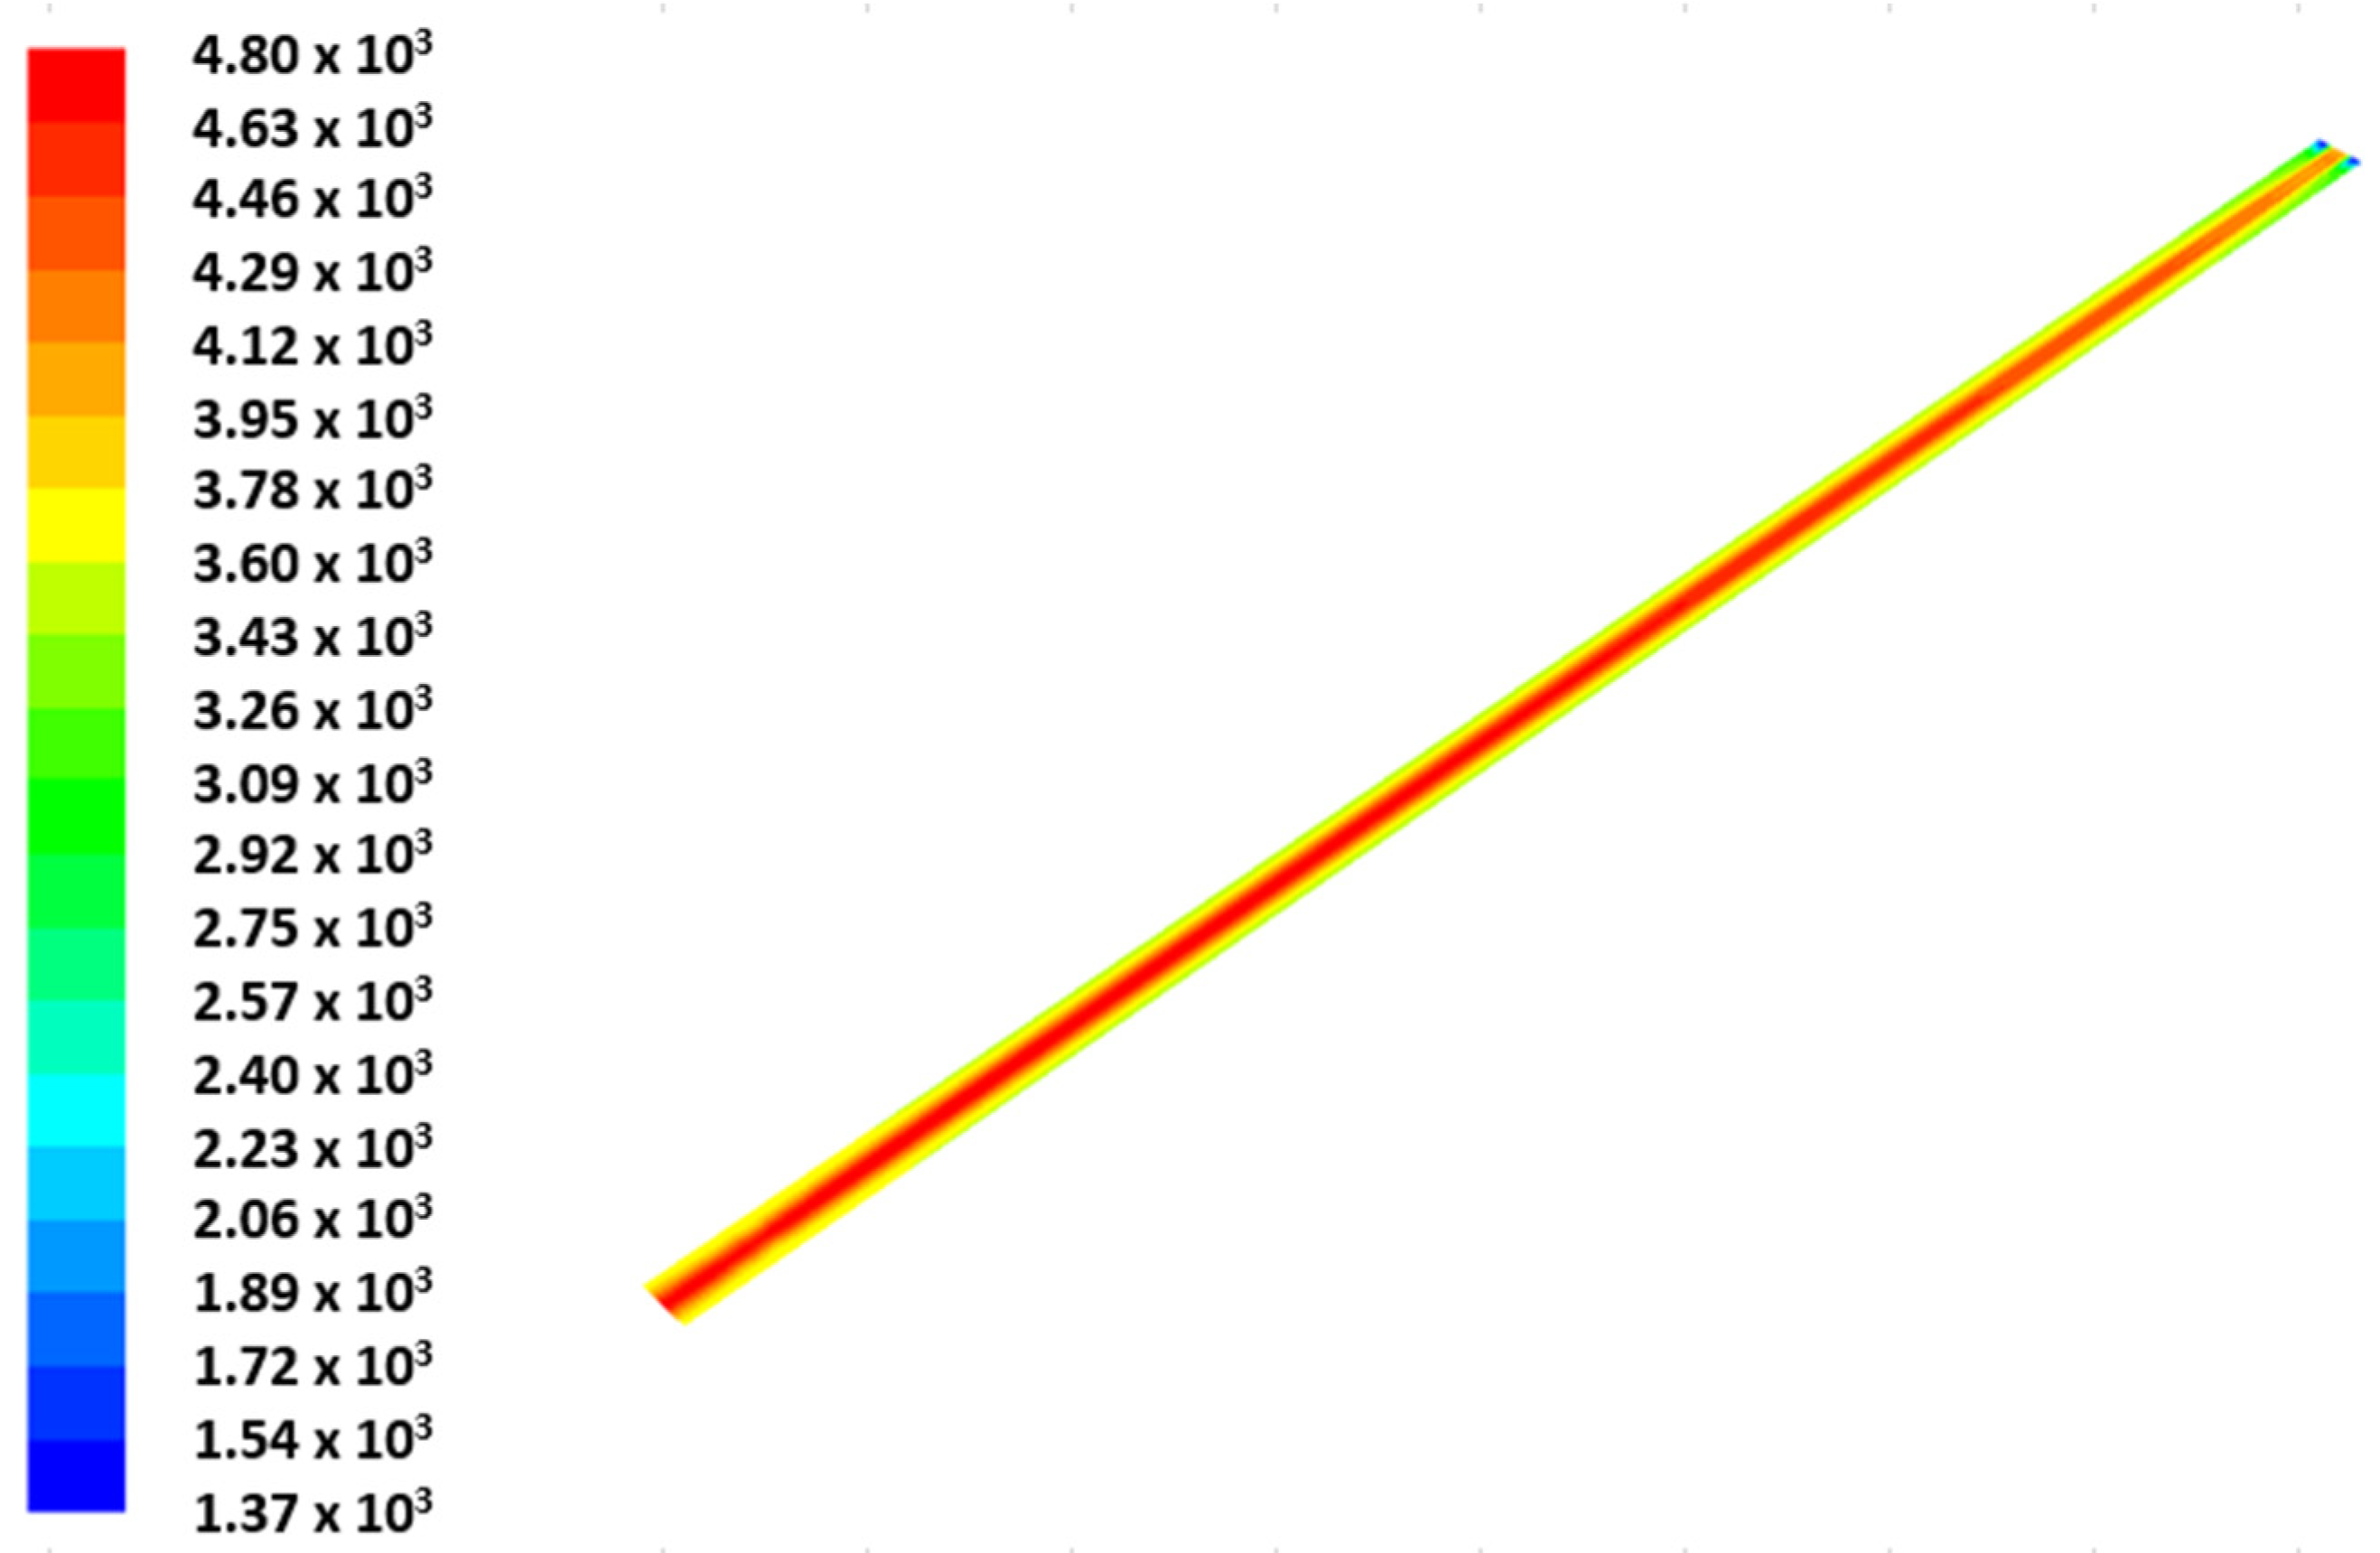
Figure 6 shows the contour of current density generation with respect to the single-channel model. The current density distribution decreased from the inlet to the outlet. A similar trend was discovered in the water content distribution and reactant concentration. This phenomenon occurred because the reactants were consumed during an electrochemical reaction as water and heat were produced. A significant finding is that all three contours are interrelated. A high concentration of reactants increased the electrochemical reaction, thereby producing higher water content and current density. The single-channel model showed an even distribution of reactants from the inlet to the outlet with no flooding and a stable current density generation in the overall active area of the cell. This indicates the ideal theoretically predicted results for PEMFC generation, which shows even reactant supply and current density generation.
The polarization curve in
Figure 2 shows that the small-scale seven-channel model indicated lower cell performance due to the flow distribution phenomenon as compared with the single-channel model. A comparison between the small-scale seven-channel and the multi-channel model’s polarization curves revealed that the former has higher cell performance. Its higher cell performance is correlated with the channel length and water flooding in the cell. A shorter channel length indicates a higher pressure drop, which affects water removal. The channel length could affect water and reactant distribution but has a low effect on current density generation [
10]. Moreover, the large number of channels reduced the pressure drop and consequently reduced cell performance.
Figure 7a illustrates the contour pressure distribution of the anode and cathode for the small-scale seven-channel model. A parallel flow field was used at the cathode, whereas a bend parallel flow field with a side inlet was used for the anode. A comparison between the different flow fields of the anode and cathode showed that the anode had a uniform pressure distribution with a gradually decreasing pressure from the inlet to the outlet. In contrast, the cathode had an uneven pressure distribution among the channels. The highest pressure was observed on the channels near the inlet whereas the lowest pressure occurred on the channel near the outlet. For the reactant distribution, a similar trend of distribution is displayed in
Figure 7b. The result from the anode indicated a uniform distribution of reactants among the channels, whilst the cathode had an uneven distribution of reactants. The gas diffusion layer near the middle of the cathode active area had a low reactant concentration. This phenomenon can be related to the pressure distribution in which almost no pressure change occurred along the middle channels. A uniform pressure distribution in the flow channel could improve the diffusion of reactants into the gas diffusion and catalyst layers for the electrochemical reaction [
30]. The hydrogen concentration on the anode gas diffusion layer decreased gradually from the inlet to the outlet. This finding proved the occurrence of an electrochemical reaction in the fuel cell. The lowest hydrogen concentration was found near the outlet on the left side of the anode. This phenomenon emerged owing to the highest oxygen concentration that existed on the cathode gas diffusion layer. Hydrogen consumption in the area was high and reached a starvation level due to insufficient hydrogen (limiting reactant) for the electrochemical reaction. On the right side of the anode, this phenomenon did not occur due to the lower oxygen concentration on the cathode gas diffusion layer. Meanwhile, on the right side of the cathode, the channel far from the inlet showed a reduction in oxygen concentration, resulting in a lower electrochemical reaction and, consequently, a lower hydrogen consumption.
Water distribution along the anode and cathode gas diffusion layers for the small-scale seven-channel model is shown in
Figure 7c. As mentioned earlier, the left area of the cell had a high concentration of oxygen and hydrogen. Thus, higher electrochemical activity was expected to occur in that area, and the waste product of the reaction was a water compound. The anode gas diffusion layer showed a high water concentration near the outlet, especially on the left side, due to the occurrence of high electrochemical activity. Water accumulated on the rib area of the cathode gas diffusion layer. This result occurred due to the low-pressure drop and distribution along the channel, as well as the reduction of the purging of water from the gas diffusion layer. The contour shows the presence of liquid water in the gas diffusion layer. The theory states that a water concentration contour with a value higher than 1 indicates the presence of liquid water. In contrast, if the water concentration value is less than 1, then the water in the gas diffusion layer remains as water vapor.
Figure 7c reveals that the water content with a value higher than 1 was present in the rib area, near the outlet on the anode, and the cathode gas diffusion layer. The high liquid water content in the gas diffusion layer would reduce the diffusion of reactants for electrochemical reactions in the catalyst layer [
31].
Figure 8 displays the current density distribution on the membrane layer. The highest current density occurred along the channel area. Under the rib area, a lower current density generation occurred due to the lower diffusion of reactants, as the gas diffusion layer was occupied by liquid water. An uneven distribution of current density generation occurred due to the uneven pressure and reactant distribution. Consequently, the current density generation of the cell was lower than in the single-channel model.
The geometry model has proven to affect the PEMFC performance, as seen in
Figure 6 and
Figure 8. An identical inlet stoichiometry and channel dimensions were adopted for both small-scale and single-channel models. From
Figure 4, it can be seen that the current density generated per cm
2 of the active area for both models is different. As mentioned earlier, the single-channel model generated a higher current density per cm
2 than the small-scale model. Thus, the numerical model used to predict the performance of the PEMFC adapts well to the small scale or a complete flow field as compared to a simple single-channel model. This shows that a better understanding of reactants, temperature, water, and current density distribution can be obtained.
4. Conclusions
Three-dimensional single-channel and small-scale seven-channel models were developed and compared with that of a multi-channel model from a previous study to determine the effect of modeling scale on fuel cell performance. The simulation work was conducted on both 3D models. The comparison of the operating parameters (i.e., current density generation, pressure distribution, reactant distribution, and water content distribution) showed that the single-channel model had even pressure, reactant, and water content distribution from the inlet to the outlet compared with small-scale and multi-channel models. Further comparison of the performance and current density distribution showed that the multi-channel model had the lowest performance, and the distribution of current density was even throughout the active area (as reported previously) compared to the small-scale seven-channel model. This occurrence was due to the different channel lengths used. The pressure distribution in channels showed that for the small-scale seven-channel model, the cathode had a more severe reactant distribution, and flooding occurred under the rib on the gas diffusion layer. The major difference between the single-channel and small-scale seven-channel models is the flow distribution. The single-channel model does not include the flow distribution. In contrast, the small-scale seven-channel model includes the effect of flow distribution effecting the model. Both small-scale and single-channel models have the same inlet stoichiometry and channel dimensions. As indicated previously, compared to the small-scale model, the single-channel model produced a higher current density per cm2. In contrast to using a straightforward single-channel model, the numerical model used to estimate the performance of the PEMFC is thus found to be well adaptable to the small scale or a comprehensive flow field. Thus, a single-channel model is not encouraged for fuel cell performance prediction, because no fluid dynamic distribution occurs in the model. The major effect of fuel cell performance in the cell was the distribution of reactants and pressure, which directly affected the water and current density distribution. In conclusion, it is recommended to establish a complete flow field model for numerical prediction results of PEMFC investigation. This is beneficial to improve the performance prediction by considering the significant effect of fluid distribution in cells. To further expand the geometrical effect of numerical investigation of PEMFCs, studies on multiple cells forming a stack of PEMFC using a small-scale channel model with an expansion of dual and quad cells can be carried out in the future. Moreover, experimental work is expected to be carried out in future works to prove that the reduction in data error of a numerical model is identical to the experimental work.


 ,
, 


