Abstract
A novel combined power and refrigeration system is proposed based on organic Rankine and jet refrigeration cycles. The system has a wider application range and can be adjusted to different cooling and evaporation temperatures. To meet the needs of diverse populations, the cooling and evaporation temperature can be as low as −60 degrees Celsius. The genetic algorithm is used to optimize the system, and the proposed system’s energy, exergy, economy, and environment are analyzed under optimal conditions. The results desmonstrate that the exergy damage, environmental impact rate, and exergy economic coefficient of steam turbine are the largest. The system’s exergy damage and the turbine’s investment cost are reduced, and the system’s performance is improved. The condenser has the greatest potential for improvement and should be considered a priority component for system improvement. In addition, the system parameters are analyzed. Higher low-pressure steam generation temperature, dryness of low-pressure steam generator outlet, turbine steam extraction ratio, refrigeration evaporation temperature, and compressor compression ratio are advantageous to system cooling capacity output but not the system net power.High-pressure evaporation temperature is unfavorable to the system’s output of net power and cooling capacity. Still, it is beneficial to improve the thermal and energy efficiency of the system. Under the same operating conditions, compared with the system proposed by predecessors, the system’s net power is increased by 12.52 kW, the thermal efficiency is increased by 4.27%, and the energy efficiency is increased by 2.57%. The system was optimized by taking low-pressure evaporation temperature, high-pressure evaporation temperature, outlet dryness of low-pressure steam generator, suction ratio of steam turbine and compression ratio of compressor as decision variables, and thermal efficiency, exergy efficiency, SUCP and SUEP as objective functions. The low-pressure evaporation temperature, high-pressure evaporation temperature, outlet dryness of low-pressure steam generator, suction ratio of steam turbine, and compression ratio of compressor are 357.99 K, 385.72 K, 0.1, and 0, respectively. The system thermal efficiency is 15.01%, exergy efficiency is 43.18%, SUCP is 45.525USD/MWh, and SUEP is 5122.6 MPTS/MWh.
1. Introduction
With today’s rapid economic expansion, energy reserves are depleting, and environmental pollution is getting worse, forcing people to find effective ways to use energy and renewable energy sources. The world’s primary energy is inappropriately converted to waste heat at about 72%, which has increased interest in waste heat recovery studies [1]. Combined cooling and power supply is a mature technology for the utilization of low-grade energy [2]. The refrigeration and generation cycle are coupled by the combined cooling and power supply system. Different cycle and coupling modes will result in variations in the system’s thermodynamic performance [3]. To recover low-temperature waste heat, ORC has reached a reasonably advanced stage. The benefits of ERC include its straightforward structure, inexpensive equipment investment, and low operating and maintenance expenses [4]. As a result, domestically and internationally, researchers have examined and built various cooling and power supply systems based on ORC and ERC. Zhang et al. evaluated different common alternative refrigerants before proposing an ORC-ERC combined cycle system that uses low-grade solar energy or other waste heat (below 150 °C) in hot and dry areas: In hot regions, they discovered that R290 (propane) and R601 (pentane) have intrinsic advantages for cooling or power generation [5]. Wang et al. proposed a new combined cooling and power supply system, which combined ORC and ERC by adding an extraction turbine between the heat recovery steam generator (HRVG) and ejector. They carried out parameter analysis and exergy loss of the system and found that the biggest exergy loss occurred in the heat recovery steam generator, followed by the ejector and turbine [6]. Zheng et al. proposed a combined power-cooling system driven by a low-temperature heat source. The system uses the exhaust of the ejector turbine to generate power and refrigeration at the same time. They found that when R245fa was used as a working medium, the steam generation temperature was 395 K, condensation temperature was 298 K and refrigeration and evaporation temperature was 280 K, and the energy efficiency, exergy efficiency, and exergy efficiency of the system could reach 34.1%, 18.7% and 56.8%.The majority of exergy loss occurred in the ejector [7] Wang et al. proposed a new combined refrigeration cycle of power and ejection absorption, which used ammonia as a working fluid. It was found through parameter analysis that the heat source, condenser, and evaporator temperature had significant effects on the net power output, cooling capacity, and exergy efficiency of the combined cycle. Yu et al. designed a new type of CCP based on dual-pressure evaporation ORC (DORC) and ERC, carried out thermodynamic and exergoeconomic analysis of the system and used a genetic algorithm to optimize the system. The results desmonstrated that the steam generator and condenser accounted for the largest proportion of overall exergy loss of the system under an optimized condition [8] Yu et al. proposed a new combined cooling and power generation system with dual pressure evaporation ORC (DORC) and ERC coupling by changing the coupling mode of the system, carried out thermodynamic and exergoeconomic analysis on the system, and evaluated the influence of critical parameters on the system performance. It is found that, compared with the parallel steam generator system, the unit cost of the system is obviously reduced, and the net output power is obviously increased [3].
Despite the fact that many researchers have studied CCP system that couples ORC and ERC, the evaporation temperature of the refrigeration cycle is higher than −5 °C, which can not provide a lower temperature cooling capacity for freezing, and the application range is small. Therefore, by changing the coupling mode of ORC and ERC, this paper proposes a CCP system that can provide both electric quantity and low-temperature cooling capacity. In addition, the researchers’ integrated cooling and power supply system based on ORC and ERC is only limited to thermodynamic analysis and exergy economic analysis. Therefore, this paper will build a thermodynamic, exergy economic, and exergy environment model of the system and analyze the system from multiple perspectives.
2. System Description
The cycle diagram of the system is shown in Figure 1. From the figure, we can observed the components of the system. Abbreviations represent the names of the components of the system, and the meanings of the abbreviations have been listed in the glossary. The system works as follows: the working fluid flows through the condenser to cool down and becomes saturated. After that, the working liquid is divided into two parts. One part is throttled by THV and enters EVA for refrigeration. After absorbing heat, the working liquid becomes saturated gas and enters the ejector as an ejector fluid after pressurizing by COM. LP first pressurized the other part, then preheated by IHE, changed into a wet steam state by endothermic in LPVG, and finally entered SEP. The saturated gas working fluid in the upper part of SEP is confluent with the exhaust of TUR and acts as the working fluid of EJ. The saturated liquid working fluid in the lower part of SEP is pressurized by HP and then enters HPVG for heat absorption. The endothermic working fluid has a certain superheat and enters TUR for work output. The working fluid after work is merged with the fluid at the EJ outlet, and the merged fluid enters IHE to preheat the fluid at the LP outlet and finally enters the condenser for heat dissipation. Thus, it is a complete cycle.
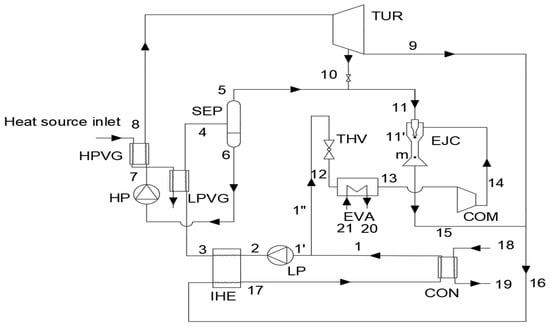
Figure 1.
The cycle diagram of the system.
3. Mathematical Models and Assumptions
3.1. Assumptions
To simplify the simulation process, it is necessary to make some assumptions about the ejector and system before system simulation [9,10,11]:
- (1)
- The system is steady, regardless of heat loss and pressure drop in heat exchangers and connecting pipes.
- (2)
- The working medium at the outlet of the separator and refrigeration evaporator is saturated.
- (3)
- The compression process in the compressor and expansion process in the turbine are non-isentropic processes.
- (4)
- The throttle valve’s throttling process is equal enthalpy.
- (5)
- The refrigerant in the ejector is in a one-dimensional steady flow state, and the ejector’s working process meets the law of conservation of energy, momentum, and energy.
- (6)
- The ejector inlet and outlet velocities are ignored, and the primary and secondary flow process in the mixing chamber is isobaric.
- (7)
- Three efficiencies represent the irreversible loss of the injector: the isentropic efficiency of the nozzle and the diffusion section and the mixing section efficiency.
- (8)
- The pinch temperature difference in the heat absorption process is (ΔTPP) 10 K, the pinch temperature difference in the heat transfer process of IHE, the condensation process of condenser and the heat absorption process of the evaporator is 5 K, and the superheat (Tsup) of the steam entering the turbine is 5 K [11,12].
3.2. Energy Model of the System
The ejector is the core connecting part of the system, which combines the power and refrigeration cycles of the system. Ejectors have no moving parts and no energy loss, making them safer, environmentally friendly and energy efficient than compressors. This paper’s ejector is modeled based on the one-dimensional isobaric mixture model theory. Many existing studies demonstrate that the model accurately predicts ejector performance [13,14]. The calculation process is as follows:
According to the conservation of energy and momentum, the velocity and enthalpy at the exit of the mixing chamber can be calculated using the mixing efficiency of the ejector mixing section.
Ignoring the fluid velocity at the outlet of the diffusion section, the fluid enthalpy value at the outlet of the diffuser is:
By applying the isentropic efficiency ηd of the diffuser, the ideal specific enthalpy at the diffuser outlet can be obtained as follows:
When the system is in a steady flow, all components in the cycle follow the conservation of mass, working medium components, and energy. When the system is in a constant flow, kinetic and potential energy changes can be ignored. According to the conservation law of mass, energy, and working medium components, the mathematical model of each element of the system are as follows [15]:
The equation of exergic balance, exergic efficiency and exergic loss improvement potential of each component of the system is as follows [3]:
The net output work of turbine can be expressed as:
Calculation formula of working medium pump power consumption:
The power consumption of the compressor is described as:
The net work of the system is calculated as follows:
Exergy of cooling capacity and cooling capacity can be calculated as follows:
System external input system heat:
The thermal efficiency of the system is:
The exergy efficiency of system is as follows:
3.3. Exergoeconomic Model
For a thermodynamic system, it should be determined that the proposed system is cost-effective before its application in industry. We often need to know the cost of inefficiency in the system. Knowing this information about costs can be very beneficial in improving the system’s cost-effectiveness, that is, in reducing the cost of the final product that the system produces. Exergy economic assessment is used to evaluate this system from both technical and economic perspectives. Exergy economic evaluation is a good way to evaluate the cost and efficiency of a thermal system [16]. Exergy balance and exergy financial balance equation combined with Equations (22)–(24) [17,18]. can be used to calculate the exergy carried by each working medium flow of the system, fuel exergy rate of each equipment, exergy rate of products and capital investment cost rate.
In the above expression, ($/h) and ($/h) refers to the product cost rate and fuel cost rate of each equipment, ($/h) refers to the equipment cost rate, while ($/MWh) and ($/MWh) refer to the average unit cost of product and fuel, respectively.
The investment cost equation of each piece of equipment in the system is shown in Table 1. The purchase cost (PEC) of the system equipment listed in Table 1 was proposed before this study. To calculate the equipment purchase cost in this study year, it is required to multiply the proportion of a chemical factory cost index. The PEC of the reference year can be converted by using the inflation index—Chemical Plant Cost Index (CEPCI) [19,20]:

Table 1.
The investment cost equation of equipment.
The above equation represents the capital recovery coefficient since the initial investment that can be recovered at the end of the useful life of the equipment is calculated, where i represents the interest rate (assumed to be 15%) and n represents the system life (supposed to be 20 years) [21].
The investment cost rate of each piece of equipment is calculated by the above equation, where Zk, CRF, N and respectively represent the purchase cost, capital recovery coefficient (CRF), annual working hours (7000 h in this study) and maintenance coefficient (assumed to be 1.06) of the kth component [19]. To make a more comprehensive evaluation of the system from the perspective of thermal economy, three parameters, exergy loss cost rate , relative cost difference and exergy economic factor , are introduced, and their calculation formula is [22,23,24]:
For the whole system, the sum unit cost of products can be expressed as [3]:
In order to solve the exergy cost of each flow, Equation (22) is deformed to obtain the balance equation of the exergy cost of parts in a general form. By applying Equation (30) and the auxiliary equation of each component, a set of linear equations [25]. can be written out. Exergy cost balance equations of each component in the system and supplementary equations for solving exergy cost balance equations are listed in Table 2, and the expression of the linear equation is as follows:
Table 2.
Exergy balance equation and supplementary equation of each component in the system.
3.4. Exergoenvironmental Model
Exergy environment analysis of the system requires knowing the environmental impact of all components and products in the system in its life cycle. Life cycle assessment is a good method. The life cycle of each element in the system includes the acquisition, production, operation, and final disposal and recovery of materials. There are a variety of guidelines to follow when determining the environmental impact of a product. Many evaluation approaches have been developed to assess the environmental impact and performance of energy conversion and production systems [26]. In this paper, Eco-Indicator 99 method is used for the environmental analysis life cycle assessment. The life cycle impact assessment method can be found in [27]. This methodology assesses five life cycle assessment stages of the components: (i) materials used in manufacturing (per kilogram of materials), and (ii) the manufacturing process-the handling and processing of various materials. (iii) the transportation process of materials, components, fuel (per unit ton-km), (iv) the energy required for a production such as electrical and thermal loads, and (v) the disposal of materials and waste (per kilogram of materials).
The environmental impact of each device is represented by “ecopoints” (1000 mpts = 1 pts), and the ecopoints of each device are obtained by weighting the above results. One of these points is equivalent to 1/1000 of a European resident’s average annual environmental impact [28]. Table 3 presents the ecological indicators of the materials of the system components, and Table 4 lists the data related to the life cycle of the system components.
Table 3.
Eco-indicator for materials for system equipments.
Table 4.
Environmental impact data related to equipment in life cycle assessment.
Due to the lack of available data on compressor weight, the following equation was used to assess the compressor weight from the mass flow rate of fluid in the component and the rupture pressure in the cylindrical steel shell [29].
In the above formula, (kg/m3), v (m/s), and A (m2) are the density, the velocity of the working medium and the cross-sectional area of the compressor inlet, respectively. FS is the safety factor, whose value is 2.0, and σ is the fracture stress, whose value is 21 Mpa.
The balance equation of the environmental impact of the system components is as follows:
where and are the environmental impact rate associated with product and fuel, respectively, while and are the environmental impact corresponding to the unit exergy of product and fuel.
The environmental impact of each system component considers the entire life cycle of the component, and the sum of the following parameters calculates the environmental impact of each component:
where is the construction environmental impact related to manufacturing, transportation, installation and other processes; is the environmental impact associated with operation and maintenance; is the environmental impact associated with the disposal and recovery of equipment, and the above environmental impact data for each system component are listed in Table 4.
Environmental impacts related to equipment damage are as follows:
In order to obtain the improvement potential of environmental impact of each equipment, the difference of relative environmental impact of parameter is introduced; to determine which environmental impact is most important for each component, an environmental impact factor is introduced. The two indicators are calculated as follows:
The environmental impact of the total unit product of the system is represented by the following equation:
Similar to the exergoeconomic analysis, a set of linear equations [30]. can be written by applying Equation (35) and auxiliary equation of each component to solve the environmental impact of each exergy flow. Overall exergy environment impact balance equation of each component in the system and supplementary equations for solving exergy environment balance equations are listed in Table 5, and the expressions of the linear equations are as follows:
Table 5.
Exergy environmental impact balance equation and supplementary equation of each component.
4. Model Validation
To verify whether the system energy model established in this paper is accurate, a verification program is written in MATLAB to compare the calculation results with the results of references. The accuracy of the energy model of the dual pressure ORC system in this paper is verified by comparing the calculation results of this paper with those of Manente et al. [31]. under the same internal and external conditions. Table 6 lists the validation results.
Table 6.
Validation of dual pressure ORC systems model.
In addition, the calculation results of the ejector mathematical model established in this paper are compared with the experimental data of Huang et al., which verifies the accuracy of the ejector model [32], and it was found that the error was small and had little influence on the simulation results. Table 7 lists the injector validation results.
Table 7.
Validation of ejector model.
5. System Optimization
In this paper, four output parameters are defined to evaluate the system’s performance: thermal efficiency, exergy efficiency, SUCP, and SUEP. For a perfect system, the higher the thermal and exergy efficiency, the better it would be, while the smaller the SUCP and SUEP, the better. The genetic algorithm has been proved to be the most comprehensive and robust method [33], thus, a genetic algorithm is selected to optimize the system, and through MATLAB there is a genetic algorithm optimization toolbox to achieve.
Because of the conflict of output parameters, it is necessary to make the optimal decision under the condition of tradeoffs among multiple objectives. Exergy efficiency and thermal efficiency should be maximized, while system cost and environmental impact should be minimized. In this case, the Pareto method is only one of many methods to achieve this goal. Multiply each objective function by a weight coefficient and then add it up. Changing the weight coefficient of each objective function can also obtain different Pareto frontier optimal solutions. For this system, the objective function MOF can be defined as the following equation:
where w1, w2, w3, and w4 are the weight coefficients of thermal efficiency, exergy efficiency, SUCP, and SUEP, respectively, and bw is the unit environmental impact of electricity supply in the proposed system.
In the above formula, Tlpvg is the low-pressure evaporation temperature; Thpvg is the high-pressure evaporation temperature; Tcr is the critical temperature of the working medium used by the system; XLPVG, OUT is the dryness of the outlet working fluid of the low-pressure evaporator generator; rsuction is the ratio of suction from the steam turbine, Pcond is the condensing pressure, Pevap is the evaporation pressure of refrigeration, and rCompress is the compression ratio of the compressor.
6. Results and Discussion
Based on the above description, a program was developed to calculate the energy, exergy economy and exergy environment models of the proposed new power/refrigeration cycle. The program is designed in the numerical analysis software MATLAB, using iterative methods to evaluate the system from the energy, economic, and environmental points of view. Table 8 lists the initial parameters used to simulate the proposed cycle. Under the optimal working condition, the parameters of each state point of the system are shown in Table 9, and the system’s performance is shown in Table 10. It can be odserved from the Table 10 that the net power output of the system is 465.36 kW, and the cooling output is 219.06 kW. The system’s thermal, exergy efficiency, SUCP and SUEP were 15.01%, 43.18%, 45.525 USD/MWh and 5122.6 mpts/MWh, respectively.
Table 8.
Initial condition of simulation.
Table 9.
Parameters of each state point under optimized working conditions.
Table 10.
The optimal condition calculated based on genetic algorithm.
The calculated parameters of each state point in the system under optimal conditions are shown in Table 9. The performance parameters of the system can be easily calculated using the results in Table 9. Table 10 shows that a net power output of 465.36 kW and a cooling output of 219.06 kW can be obtained under optimal conditions, and the corresponding system energy efficiency, exergy efficiency, and SUCP and SUEP are 15.01%, 43.18%, and 45.525 $/MWh, 5122.6 mpts/MWh respectively.
6.1. Exergy Analysis
The exergy destruction of each component of the system can be calculated based on the above optimal conditions. As can be observed from Table 11, LPVG, and HPVG, the steam turbine and condenser were the four parts with the biggest exergy loss in the system, and their exergy loss was 116.2 kW, 131.4 kW, 172.8 kW and 107.6 kW respectively. Exergy efficiency was 63.99%, 84.73%, 77.09% and 26.30%, respectively. The improvement potentials are 41.84 kW, 20.06 kW, 39.59 kW, and 79.30 kW, respectively. Figure 2 shows the ratios of exergy destruction of the four parts in the total exergy destruction of the system, which are 18.1%, 20.5%, 26.9%, and 16.8%, respectively. From the perspective of exergy efficiency and improvement potential, the condenser has the greatest improvement potential, followed by LPVG.
Table 11.
Exergy analysis results of the system.
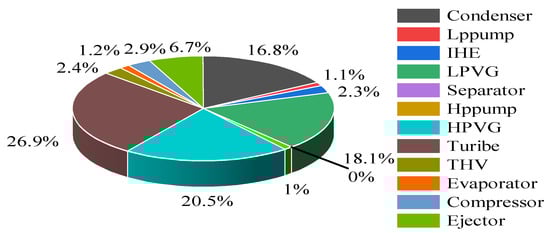
Figure 2.
Exergy loss of system components.
6.2. Exergoeconomic Analysis
Table 12 lists the thermal economic evaluation parameters of the system, the average unit cost of fuel and product, the exergy consumption cost rate, the total cost rate, the relative cost difference and the economic energy coefficient of each component. The turbine had the highest equipment investment, operation and maintenance cost ratio at USD14.149 per hour. The ejector and condenser fuel costs are very high, at USD46.5427/MWh and USD23.4302/MWh, respectively. Therefore, the ejector and condenser are the parts with the most increased destruction cost rates of exergy in the system, which are USD2.0153/h and USD2.5211/h, respectively. The relative cost rate of the condenser is the largest, which is 4.4493, followed by the compressor and turbine, which are 3.1114 and 2.7189, respectively. Exergy economic coefficients of the turbine are the largest, respectively, at 0.8907, indicating that reducing equipment investment costs can improve the performance of this system. Exergy economic coefficient of two pumps and throttle valve is lower than 0.3. For these components, reducing exergy destruction can improve the system exergy efficiency and system performance.
Table 12.
Exergoeconomic analysis results of system components.
6.3. Exergoenvironmental Analysis
The thermal environment variables of this system, average unit environmental impact of fuel and products, environmental impact rate of waste, total environmental impact rate, the relative environmental impact difference, and environmental impact coefficient of each component are given in Table 13. Among the components of the system, HPVG has the highest environmental impact rate in the whole life cycle, which is 9.6843 mpts/h, followed by LPVG, which is 5.6278 mpts/h. The main reason is that these two components need to use 15% copper in the manufacturing process, and the environmental impact rate of copper in its life cycle is 1400 mpts/kg. The exergy loss of the steam turbine, condenser, HPVG and LPVG accounted for more than 16%, thus, the environmental impact rate of the four parts was relatively high. They are 2975.4432 mpts/h, 1979.9476 mpts /h, 1915.4178 mpts/h and 1693.8474 mpts/h, respectively. The relative environmental impact rate of ejector is the largest, which is 3.1474, followed by the condenser, which is 2.8079. The main reason is that the average unit environmental impact of these two parts is the largest, which is 55,733 mpts/MWh and 70,071 mpts/MWh, respectively. The internal heat exchanger (IHE) has the largest environmental impact coefficient, which is 0.86%, followed by HPVG and LPVG, which are 0.50% and 0.33%, respectively. The main reason is that the production materials of these three components contain copper, and their total environmental impact rate is relatively large.
Table 13.
Exergoenvironmental analysis results of system components.
6.4. Parameter Analysis
The inlet pressure of the ejector mainstream had a decisive effect on the ejector suction ratio. The inlet pressure of the ejector mainstream was determined by the low-pressure evaporation temperature (Tlpvg), and the outlet wet vapour dryness (xlpvg,out) of the low-pressure evaporator and the steam turbine suction ratio (rsuction) affected the mass flow rate of the secondary fluid that the ejector could induce. The system’s cooling capacity is affected by the ejection ratio and the secondary flow rate of the ejector. The ejector ejection ratio is also affected by the secondary fluid pressure, controlled by the refrigeration and evaporation temperature (Tevap) and the compressor compression ratio (rcompress). The system’s power output is determined by the thermal properties of the steam at the inlet of the turbine, and the high-pressure evaporation temperature (Thpvg) controls the thermal properties of the steam at the inlet of the turbine. At the same time, it also affects the matching of the heat transfer temperature difference of the organic working medium in heat absorption. All the parameters affect the output of the net work and cooling capacity of the system, thus, this paper selects the above six parameters to analyze the system’s performance. The working condition of the analysis process is the optimal working condition calculated by the genetic algorithm.
Figure 3 shows the impact of Tlpvg on the system performance. As shown in Figure 3, with the increase in Tlpvg, the net power output of the system gradually decreased from 467.39 kW to 455.19 kW. The cooling capacity is slowly increasing, from 213.6 KW to 246.96 KW. Because the increase in Tlpvg will lead to a rise in the outlet temperature of the heat source, the mass flow rate through the two vapor generators will be reduced, and the system output work will be reduced under the condition that Thpvg is unchanged. Secondly, with the increase in the ejector primary fluid pressure and enthalpy value, the ejection coefficient will be improved, and the working medium flow through the evaporator will be increased accordingly. Under the condition that the evaporation temperature is unchanged, the cooling capacity will be increased. As output work decreased and cooling capacity increased, the system’s exergy efficiency decreased, while the system’s thermal efficiency inflated. The exergy efficiency decreased from 43.26% to 42.77%, and the thermal efficiency increased from 14.93% to 15.385%. SUCP increased from $45.4 /MWh to $46.15 /MWh because the cost of cool exergy was higher than the cost of work exergy. When the compression ratio is unchanged, increasing the working medium flow through the evaporator will increase compression power consumption and have a greater environmental impact on the system. SUEP increases from 5025 mpts/MWh to 5617.1 mpts/MWh.
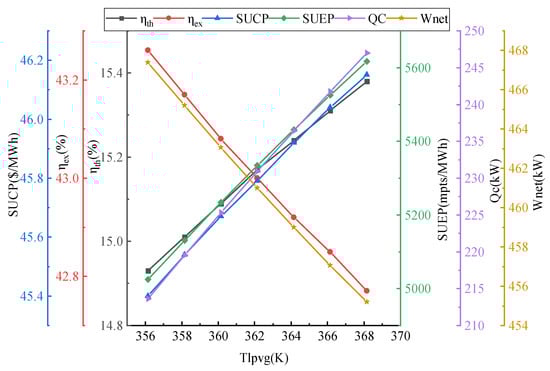
Figure 3.
Effect of low pressure evaporation temperature on system performance.
Figure 4 shows the impact of Thpvg on system performance. As observed in Figure 4, with the increase in Thpvg, the net power output of the system gradually decreased from 533.93 kW to 389.45 kW. The cooling capacity is also reducing progressively, from 289.51 KW to 171.55 KW. This is because when Thpvg increases, the working medium’s enthalpy value at the high-pressure steam generator outlet will increase. When the mass flow rate of the heat source is certain, the mass flow rate of the working medium flowing through the whole system will decrease.
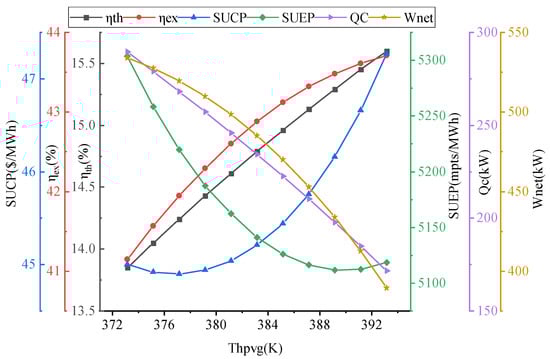
Figure 4.
Effect of high pressure evaporation temperature on system performance.
Although the enthalpy value at the outlet of the high-pressure evaporator will increase, the output work of the system still demonstrate a decreasing trend, and the decreasing speed is increasing. In the case of Tlpvg and XLPVG, OUT is unchanged, the flow of working medium through the evaporator will be reduced, the evaporation temperature is entire, and the cooling capacity will be reduced when the output work and cooling capacity of the system decrease at the same time, and the increase in Thpvg leads to the decline of flow through the two steam generators. According to Equations (20) and (21), the decline rate of denominator Qg and Eg is greater than that of the numerator, thus, the system’s thermal and exergy efficiency will show an increasing trend, with the thermal efficiency rising from 13.85% to 15.6%. Exergy efficiency increased from 41.15% to 43.71%. As can be odserved from the diagram, SUCP first reduces after an increasing trend, and this is due to the rise of Thpvg flows through two flow decreases, the steam generator system of heat absorption capacity decreased, and the cost of fuel consumption is reduced, according to the Formula (30),with a declining rate of fuel costs less than initially lower than that of the exergy of output work and the exergy of cooling capacity., However, when Thpvg increases to a certain degree, the decreasing rate of fuel cost is greater than that of exergy of output work and exergy of cooling capacity. SUEP shows a downward trend and then an upward trend because the downward trend of output work is slow at first and then fast. When the downward trend of output work is greater than that of the cooling capacity, according to Formula (41), the downward trend of the numerator is smaller than that of the denominator, thus, SUEP shows a downward direction first and then an upward trend.
Figure 5 shows the impact of XLpvg,out on system performance. With the increase in XLpvg,out, the net power output of the system gradually decreases from 465.36 kW to 238.24 kW. The cooling capacity is increasing from 219.06 kW to 844.93 kW. This is because the increase in XLpvg will increase the flow of the working fluid flowing through the low-pressure evaporator and the primary working fluid flow of the ejector. Under the condition that the evaporator temperature remains unchanged, the cooling capacity will gradually increase. In addition, the working flow of the low-pressure evaporator increases, and the power consumption of the low-pressure pump and compressor will also increase. However, the increase in XLpvg,out will not change the flow of the working fluid flowing through the high-pressure steam generator; that is, the output work of the turbine will not change, so the net output work of the whole system gradually decreases. As the output work of the system decreased and the cooling capacity increased, the exergy efficiency of the system decreased, while the system’s thermal efficiency increased. Exergy efficiency decreased from 43.18% to 29.37%, and thermal efficiency increased from 15.01% to 18.95%. SUCP increased from $45.525/MWh to $64.17/MWh. When the compression ratio is unchanged, the increased working fluid flow through the evaporator will increase compression power consumption and the greater environmental impact on the system. The SUEP increases from 5122.6 mpts/MWh to 18,673 mpts/MWh.
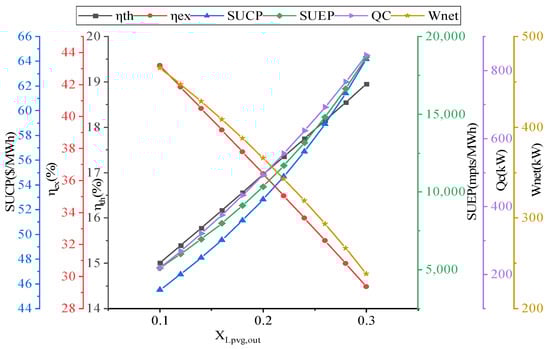
Figure 5.
Effect of dryness of the outlet working fluid of the low-pressure evaporator generator on system performance.
Figure 6 shows the effect of rsuction on system performance. As shown in Figure 6, when the system’s rsuction increases, the system’s net output energy decreases from 465.36 kW to 82.66 kW. The cooling capacity has been increased from 219.06 KW to 898.79 KW. This is because the increase of rsuction could not only reduce the flow of working fluid flowing through the turbine but also increase the primary working fluid flow of the ejector, the work conducted by the turbine is reduced, the work of the input compressor is increased, and the net power output of the whole system is reduced. In addition, under the condition that the evaporator temperature remained unchanged, the cooling capacity would also gradually increase. The increase in rsuction did not change the system’s heat absorption, and the exergy efficiency of the system decreased. In contrast, the thermal efficiency of the system increased instead, with exergy efficiency declining from 43.18% to 23.15% and thermal efficiency rising from 15.01% to 22.14%. As the cost of the cooling capacity exergy was higher than that of electric exergy, SUCP increased from 45.525 USD/MWh to 83.53USD/MWh. When the compression ratio is unchanged, the increase in the working medium flow through the evaporator will increase compression power consumption and the greater environmental impact on the system. SUEP increases from 5122.6 mpts/MWh to 29,908 mpts/MWh.
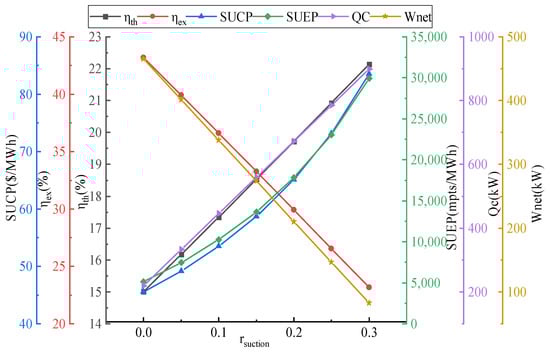
Figure 6.
Effect of ratio of suction from the steam turbine on system performance.
Figure 7 shows the impact of Tevap on system performance. As shown in Figure 7, with the increase in Tevap, the net power output of the system gradually decreased from 540.16 kW to 347.06 kW. The cooling capacity is slowly increasing, from 7.69 KW to 558.77 KW. This is because the increase in Tevap will increase the pressure of secondary fluid entering the ejector, and the ejector coefficient will also increase. Under the condition that rcompress is unchanged, the compressor’s power consumption will gradually increase, so the net work output of the system will decrease. Secondly, the ejector’s ejection coefficient increases, and the working fluid’s flow rate through the evaporator increases accordingly. When the Tevap gradually increases, the cooling capacity will also increase. As output work decreased and cooling capacity increased, the system’s exergy efficiency decreased, while the system’s thermal efficiency increased. Exergy efficiency decreased from 45.96% to 37.99%, and thermal efficiency increased from 12.02% to 19.9%. Because the cooling capacity cost is greater than the work capacity, SUCP increases from 45.525 USD/MWh to 83.53 USD/MWh. When the rcompress is unchanged, increasing the working fluid flow through the evaporator will increase the compression power consumption and the greater environmental impact on the system. The SUEP increases from 1736.7 mpts/MWh to 11,726 mpts/MWh.
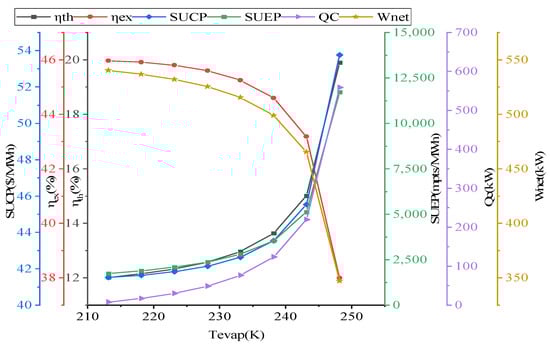
Figure 7.
Effect of evaporation temperature on system performance.
Figure 8 shows the impact of rcompress on system performance. As shown in Figure 8, with the increase in rcompress, the net output power of the system decreases from 511.26 kW to 342.84 kW. The cooling capacity is gradually increasing, from 110.06 KW to 500.48 KW. When the compressor compression ratio increases, the pressure of the injected fluid in the ejector will increase, and the injection coefficient of the ejector will also increase. As a result, the mass flow rate of the working fluid flowing through the compressor and the compressor’s power consumption will increase, so the net work output of the system will decrease, but the cooling capacity will increase. As the output work decreased and the cooling capacity increased, the system’s exergy efficiency decreased, while the system’s thermal efficiency increased. Exergy efficiency decreased from 45.12% to 37.82%, and thermal efficiency increased from 13.61% to 18.56%. As the cost of unit cooling capacity is greater than that of unit work capacity, SUCP rose from 42.77 USD/MWh to 54.68 USD/MWh. Due to the increased flow of working fluid through the compressor, the compressor’s power consumption will increase, and the system’s environmental impact will be larger. The SUEP increased from 2976.1 MPTS /MWh to 12,007 mpts/MWh.
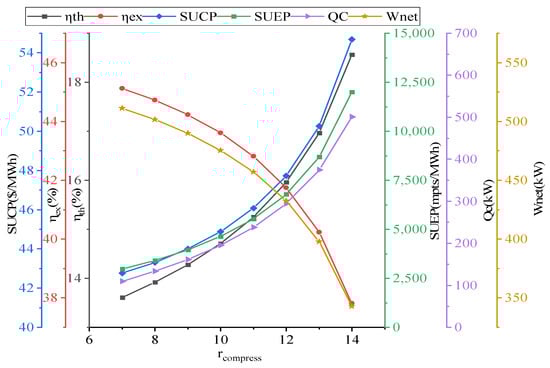
Figure 8.
Effect of the compression ratio on system performance.
6.5. System Comparison
The new system proposed in this paper is based on DORC and ERC. However, the new system can adjust the evaporation temperature according to different needs, up to −60 degrees Celsius. To illustrate the advantages of the proposed system over the system of Yu et al. [3], a comprehensive comparative study is conducted between the proposed system and the system of Yu et al. under constant input parameters. The simulation was carried out based on the constant input parameters and assumptions of the research of Yu et al., and the results are shown in Table 14. It can be observed from the table that with the same cooling capacity of 555.37 kW, more work was obtained in this study, and the new system absorbed less heat into the system than Yu et al.’ s system, thus, so the thermal efficiency and exergy efficiency were also higher than the system of Yu et al. As the cost of fuel exergy decreased, the SUCP of the present system was much lower than that of Yu et al. In summary, the proposed new system not only has a broader application range but also has a certain improvement in performance compared with the system of Yu et al.
Table 14.
Comparison between the thermodynamic performance of the system in this study and that of the reference system.
7. Conclusions
This paper presents a new type of electric cooling co-generation system. The system parameters are optimized, and the system performance is analyzed from the perspectives of thermodynamics, exergy economy and environment combined with the system parameters. The new system’s performance is compared with that of the previous system. The main conclusions are as follows:
(1)Taking thermal efficiency, exergy efficiency, SUCP, and SUEP as the objective functions, GA was used to optimize the system. After optimization, the low-pressure evaporation temperature, high-pressure evaporation temperature, outlet dryness of low-pressure steam generator, suction ratio of steam turbine, and the compression ratio of compressor are 357.99 K, 385.72 K, 0.1, and 0, respectively. the thermal efficiency was 15.01%, exergy rate was 43.18%,SUCP was 45.525 USD/MWh, and SUEP was 5122.6 MPTS/MWh.
(2) The exergy destruction of steam turbine is the greatest. However, from the perspective of exergy efficiency and improvement potential of each component, condenser should be the priority component for system improvement, followed by LPVG.
(3) Among the components of the system, the equipment investment, operation and maintenance cost rate of turbine is the highest, which is 14.149 USD/h; the exergy economic coefficient of steam turbine is the largest, which is 0.8907. Reducing the investment cost can improve the system performance. The exergy economic coefficient of the two pumps and throttle valve is lower than 0.3, so reducing the exergy destruction of these components can also improve the system performance.
(4) Among all components of the system, turbine had the highest impact rate of exergy destruction, which is 2975.4423 mpts/h. The relative environmental impact rate of ejector is the largest, followed by condenser. The exergy environmental influence coefficient of internal heat exchanger (IHE) is the largest.
(5) Higher Tlpvg, Xlpvg, out, rsuction, Teva and rcompress are beneficial to the output of cooling energy of the system but unfavorable to the output of net work of the system, and the SUCP and SUEP of the system are also larger. However, higher Thpvg is not conducive to the output of net power and cooling capacity of the system, but is conducive to the improvement of thermal efficiency and exergy efficiency of the system. As for the larger SUCP of the system, the opposite is true for SUEP.
(6) The proposed new system is more widely used through a comprehensive comparative study with the system proposed by Yu et al. Moreover, under the same operating conditions, the net power of the new system increases by 12.52 kW, the thermal efficiency increases by 4.27% and the energy efficiency increases by 2.57%. The results demonstrate that the system’s performance can be significantly improved by using the compressor to increase the pressure of the secondary flow into the ejector.
(7) In this paper, geothermal energy is used to realize the combined supply of cold and electricity, which cannot meet the needs of different users for different products. Distributed energy supply networks can promote the further utilization of renewable energy technologies, reduce costs and improve energy supply efficiency. For example, Sadi [34]. et al. used parabolic trough solar collectors to jointly supply the main heating demand of the chiller and district heating network, realizing the combined heating and cold supply in Denmark. Therefore, solar energy and geothermal energy can supply energy for the system in the future, improving energy utilization efficiency and realizing the triple production of cold, heat, and electricity. The triple production of cold, electricity and distilled water for island areas can also be realized.
Author Contributions
Funding acquisition, J.W.; Methodology, H.W.; Resources, C.F.; Validation, J.T.; Writing—original draft, J.T. All authors have read and agreed to the published version of the manuscript.
Funding
This research was funded by National Natural Science Foundation of China (Grant No. 51366005); This research was also partially funded by the Yunnan Fundamental Research Projects (Grant No. 202001BB050070).
Acknowledgments
In this section, you can acknowledge any support given which is not covered by the author contribution or funding sections. This may include administrative and technical support, or donations in kind (e.g., materials used for experiments).
Conflicts of Interest
The authors declare no conflict of interest.
Nomenclature
| Nomenclature | d | Diffuser | |
| symbols | E | Evaporation | |
| A | Area (m2) | th | Thermal |
| Exergy cost | ex | Exergy | |
| Unit exergy cost | F | Fuel | |
| Exergy (kW) | in | Inlet | |
| f | Exergoeconomic factor | m | Mixing chamber |
| h | Enthalply | n | Noozle |
| Mass flow rate (kg/s) | out | Outlet | |
| P | Pressure | pp | Pinch point |
| Heat transfer (kW) | sup | Superheating | |
| Cooling output (kW) | T | Turbine | |
| r | Ration | 1-21 | State points |
| s | Entropy (kJ/kg.k) | 0 | Ambient state |
| T | Temperature | CCP | Combined cooling and power supply system |
| x | Dryness | ERC | Ejector refrigeration cycle |
| U | Total heat transfer coeffiCient | CON | Condenser |
| W | Work (kW) | LP | Low pressure pump |
| Wnet | Net work (kW) | HP | High pressure pump |
| Total cost rate of system Investment and operation | IHE | Internal heat exchanger | |
| Greek letters | LPVG | Low pressure steam generator | |
| η | Efficiency | HPVG | High pressure steam generator |
| μ | Entriainment coeffcient | SEP | Separator |
| Δ | Difference | TUR | Turbine |
| Sybcripts | THV | Throttle valve | |
| cond | Condenser | EVA | Evaporator |
| cr | Critical | EJCCOM | EjectorCompressor |
| D | Destruction |
References
- Wang, Q.; Wu, W.; Li, D.; Wang, J.; He, Z. Thermodynamic analysis and optimization of four organic flash cycle systems for waste heat recovery. Energy Convers. Manag. 2020, 221, 113171. [Google Scholar] [CrossRef]
- Wang, J.; Wang, J.; Zhao, P.; Dai, Y. Thermodynamic analysis of a new combined cooling and power system using ammonia–water mixture. Energy Convers. Manag. 2016, 117, 335–342. [Google Scholar] [CrossRef]
- Yu, W.; Wang, H.; Ge, Z. Comprehensive analysis of a novel power and cooling cogeneration system based on organic Rankine cycle and ejector refrigeration cycle. Energy Convers. Manag. 2021, 232, 113898. [Google Scholar] [CrossRef]
- Tashtoush, B.; Alshare, A.; Al-Rifai, S. Performance study of ejector cooling cycle at critical mode under superheated primary flow. Energy Convers. Manag. 2015, 94, 300–310. [Google Scholar] [CrossRef]
- Zhang, T.; Mohamed, S. Conceptual design and analysis of hydrocarbon-based solar thermal power and ejector cooling systems in hot climates. J. Sol. Energy Eng. 2015, 137, 021001. [Google Scholar] [CrossRef]
- Wang, J.; Dai, Y.; Sun, Z. A theoretical study on a novel combined power and ejector refrigeration cycle. Int. J. Refrig. 2009, 32, 1186–1194. [Google Scholar] [CrossRef]
- Zheng, B.; Weng, Y.W. A combined power and ejector refrigeration cycle for low temperature heat sources. Sol. Energy 2010, 84, 784–791. [Google Scholar] [CrossRef]
- Yu, W.; Xu, Y.; Wang, H.; Ge, Z.; Xia, Y. Thermodynamic and thermoeconomic performance analyses and optimization of a novel power and cooling cogeneration system fueled by low-grade waste heat. Appl. Therm. Eng. 2020, 179, 115667. [Google Scholar] [CrossRef]
- Li, D.; Groll, E.A. Transcritical CO2 refrigeration cycle with ejector-expansion device. Int. J. Refrig. 2005, 28, 766–773. [Google Scholar] [CrossRef]
- Yu, J.; Tian, G.; Xu, Z. Exergy analysis of Joule-Thomson cryogenic refrigeration cycle with an ejector. Energy 2009, 34, 1864–1869. [Google Scholar] [CrossRef]
- Wang, M.; Chen, Y.; Liu, Q.; Yuanyuan, Z. Thermodynamic and thermo-economic analysis of dual-pressure and single pressure evaporation organic Rankine cycles. Energy Convers. Manag. 2018, 177, 718–736. [Google Scholar] [CrossRef]
- Li, J.; Ge, Z.; Duan, Y.; Yang, Z.; Liu, Q. Parametric optimization and thermodynamic performance comparison of single-pressure and dual-pressure evaporation organic Rankine cycles. Appl. Energy 2018, 217, 409–421. [Google Scholar] [CrossRef]
- Dai, Y.; Wang, J.; Lin, G. Exergy analysis, parametric analysis and optimization for a novel combined power and ejector refrigeration cycle. Appl. Therm. Eng. 2009, 29, 1983–1990. [Google Scholar] [CrossRef]
- Goodarzi, M.; Gheibi, A.; Motamedian, M. Comparative analysis of an improved two-stage multi-inter-cooling ejector-expansion trans-critical CO2 refrigeration cycle. Appl. Therm. Eng. 2015, 81, 58–65. [Google Scholar] [CrossRef]
- Jadidi, E.; Manesh, M.H.K.; Delpisheh, M. Advanced exergy, exergoeconomic, and exergoenvironmental analyses of integrated solar-assisted gasification cycle for producing power and steam from heavy refinery fuels. Energies 2021, 14, 8409. [Google Scholar] [CrossRef]
- Ahmadi, P.; Dincer, I. 1.8 Exergoeconomics. In Comprehensive Energy Systems; Dincerl, I., Ed.; Elsevier: Amsterdam, The Netherlands, 2018; pp. 340–376. [Google Scholar]
- Javadi, M.A.; Khodabakhshi, S.; Ghasemiasl, R.; Jabery, R. Sensivity analysis of a multi-generation system based on a gas/hydrogen-fueled gas turbine for producing hydrogen, electricity and freshwater. Energy Convers. Manag. 2022, 252, 115085. [Google Scholar] [CrossRef]
- Javadi, M.; Najafi, N.J.; Abhari, M.K.; Jabery, R.; Pourtaba, H. 4E analysis of three different configurations of a combined cycle power plant integrated with a solar power tower system. Sustain. Energy Technol. Assess. 2021, 48, 101599. [Google Scholar] [CrossRef]
- Bejan, A.; Tsatsaronis, G.; Moran, M.J. Thermal Design and Optimization; John Wiley & Sons: Toronto, ON, Canada, 1995. [Google Scholar]
- Shamoushaki, M.; Aliehyaei, M.; Taghizadeh-Hesary, F. Energy, exergy, exergoeconomic, and exergoenvironmental assessment of flash-binary geothermal combined cooling, heating and power cycle. Energies 2021, 14, 4464. [Google Scholar] [CrossRef]
- Mohammadkhani, F.; Shokati, N.; Mahmoudi, S.; Yari, M.; Rosen, M.A. Exergoeconomic assessment and parametric study of a Gas Turbine-Modular Helium Reactor combined with two Organic Rankine Cycles. Energy 2014, 65, 533–543. [Google Scholar] [CrossRef]
- Misra, R.D.; Sahoo, P.K.; Gupta, A. Thermoeconomic evaluation and optimization of a double-effect H2O/LiBr vapour-absorption refrigeration system. Int. J. Refrig. 2005, 28, 331–343. [Google Scholar] [CrossRef]
- Al-Sayyab, A.K.S.; Navarro-Esbrí, J.; Soto-Francés, V.M.; Mota-Babiloni, A. Conventional and advanced exergoeconomic analysis of a compound ejector-heat pump for simultaneous cooling and heating. Energies 2021, 14, 3511. [Google Scholar] [CrossRef]
- Marques, A.S.; Carvalho, M.; Ochoa, Á.A.V.; Souza, R.J.; dos Santos, C.A.C. Exergoeconomic assessment of a compact electricity-cooling cogeneration unit. Energies 2020, 13, 5417. [Google Scholar] [CrossRef]
- Ahmadi, P.; Dincer, I. Exergoenvironmental analysis and optimization of a cogeneration plant system using Multimodal Genetic Algorithm (MGA). Energy 2010, 35, 5161–5172. [Google Scholar] [CrossRef]
- Dincer, I.; Rosen, M.A.; Al-Zareer, M. 1.9 Exergoenvironmental analysis. In Comprehensive Energy Systems; Dincer, I., Ed.; Comprehensive Energy Systems; Elsevier: Amsterdam, The Netherlands, 2018. [Google Scholar]
- Mark, G.; Suzanne, E.; Marcel, C. Eco-Indicator 99 Manual for Designers—A Damage Oriented Method for Life Cycle Impact Assessment; Methodology Report; PRé Consultants: Amersfoort, The Netherlands, 2000. [Google Scholar]
- Paraskevas, D.; Kellens, K.; Renaldi, R.; Dewulf, W.; Duflou, J. Closed and Open Loop Recycling of Aluminium: A Life Cycle Assessment Perspective; Technische Universität Berlin: Berlin, Germany, 2013; pp. 305–310. [Google Scholar]
- Cidade Cavalcanti, E.J. Exergoeconomic and exergoenvironmental analyses of an integrated solar combined cycle system. Renew. Sustain. Energy Rev. 2017, 67, 507–519. [Google Scholar] [CrossRef]
- Mousavi, S.A.; Mehrpooya, M. A comprehensive exergy-based evaluation on cascade absorption- compression refrigeration system for low temperature applications—Exergy, exergoeconomic, and exergoenvironmental assessments. J. Clean. Prod. 2020, 246, 119005. [Google Scholar] [CrossRef]
- Manente, G.; Lazzaretto, A.; Bonamico, E. Design guidelines for the choice between single and dual pressure layouts in organic Rankine cycle (ORC) systems. Energy 2017, 123, 413–431. [Google Scholar] [CrossRef]
- Huang, B.J.; Chang, J.M.; Wang, C.P.; Petrenko, V.A. A 1-D analysis of ejector performance. Int. J. Refrig. 1999, 22, 354–364. [Google Scholar] [CrossRef]
- Wang, N.; Zhang, S.; Fei, Z.; Zhang, W.; Shao, L.; Sardari, F. Thermodynamic performance analysis a power and cooling generation system based on geothermal flash, organic Rankine cycles, and ejector refrigeration cycle; application of zeotropic mixtures. Sustain. Energy Technol. Assess. 2020, 40, 100749. [Google Scholar] [CrossRef]
- Arabkoohsar, A.; Sadi, M. A solar PTC powered absorption chiller design for Co-supply of district heating and cooling systems in Denmark. Energy 2020, 193, 116789. [Google Scholar] [CrossRef]


Publisher’s Note: MDPI stays neutral with regard to jurisdictional claims in published maps and institutional affiliations. |
© 2022 by the authors. Licensee MDPI, Basel, Switzerland. This article is an open access article distributed under the terms and conditions of the Creative Commons Attribution (CC BY) license (https://creativecommons.org/licenses/by/4.0/).