Article

Determination of Carbonyls Compound, Ketones and Aldehydes Emissions from CI Diesel Engines Fueled with Pure Diesel/Diesel Methanol Blends

1
Department of Mechanical Engineering, Faculty of Engineering, Al-Hussein Bin Talal University, Ma’an 71110, Jordan
2
Department of Mechanical Engineering, Faculty of Engineering, Benha University, Benha 13512, Egypt
3
Department of Environmental Engineering, Faculty of Engineering, Al-Hussein Bin Talal University, Ma’an 71110, Jordan
*
Author to whom correspondence should be addressed.
Energies 2022, 15(21), 7933; https://doi.org/10.3390/en15217933
Submission received: 22 August 2022 / Revised: 10 October 2022 / Accepted: 22 October 2022 / Published: 26 October 2022
(This article belongs to the Special Issue Advanced Engine Technologies and Fuels)

Abstract

:
Quantitative and qualitative analyses of chemical species out of CI engine tailpipe emissions fueled with pure diesel and diesel methanol blends, trapped in dinitro phenylhydrazine (DNPH) solutions, were performed. The formed hydrazine was studied using high-performance liquid chromatography (HPLC) accompanied by a detector for ultraviolet (UV). A set of carbonyl-DNPH derivative standards was developed and compared with engine tailpipe gases produced by both fuel modes. An understanding of carbonyl chemical compounds such as formaldehyde, acetaldehyde, and acrolein (HCHO, CH3CHO, and H2 = CHCHO, respectively) is essential for researchers to know how these chemicals affect human health and the environment. In both fuel modes, acetaldehyde was the main combustible product 25 ppm followed by formaldehyde 17 ppm, croton aldehydes 16 ppm, acrolein 12 ppm, and iso-valerdyhyde 10 ppm. In addition to these species, only a few other chemical species were detected in the exhaust gas. According to this study, carbonyl compounds from blended fuel contribute 15–22% of pure diesel fuel emissions. As shown by the results, engine operating conditions and fuel mode have a strong impact on the total amount of carbonyls released by the engine. Engine performance was highly influenced by different fuel modes and engine speeds. Using pure diesel, the regulated emissions, HC, CO, and NOx, registered high concentrations at a lower speed (1500 rpm) and NOx presented with the highest concentration of 4 g/kWh followed by CO with 1 g/kWh and HC with 0.5 g/kWh.

1. Introduction

The automotive industry focuses on diesel engines due to their high performance of the diesel engines and their high durability with an excellent fuel economy; throttling losses are lower than spark ignition engines. The problem of compression ignition diesel engines is the huge amount of diesel emissions released such as NOx, particulate matter, and soot particles, compared to SI engines [1,2,3]. Diesel engines are popularly termed a reliable CI engine, and gained this reputation over the years for their ability to emit lower hydrocarbon with better fuel economy and lower maintenance costs. On the other hand, CO, NOx, and particulate matter emissions released from diesel combustions are highly dangerous for the environment, human health, and the atmosphere [4,5,6]. The purpose of diesel engine tailpipe emissions is to control carbon monoxide, HC, and NOx. Uncontrolled chemical species such as carbonyl aldehydes, olefins, alkanes, and particulate matter emissions are always of interest to diesel emission researchers. In addition to associated organic matter, toxic air emissions from automotive emissions are primarily composed of the organic compounds 1,3-butadiene, acetaldehyde, formaldehyde, benzene, particulates, as well as olefins chemical compounds, such as 1,3-butadiene and formaldehyde, that have a high atmospheric reactivity in urban areas. Many chemical species emissions, originating from exhaust gases, such as aldehydes and alkanes and alkenes, are considered to be intermediate species during the combustion process; these processes are an important target for researchers to provide a valuable research information and theoretical platform for future scientific database [7,8]. These days, there is a strong regulation and more restrictions on the emission of gases such as NOx, HC, CO, and PM, but unfortunately no serious restrictions or real regulations to control unregulated emissions. In fact, unregulated hydrocarbon emissions are considered to be more dangerous to human health and the environment than regulated HC. Under certain conditions, these chemical species could produce photochemical smog accompanied by plenty of ozone quantity [9,10,11]. For example, high-performance liquid chromatography (HPLC) and gas chromatography-mass spectrometry (GCMS) tools are highly beneficial to the detection of aldehydes and the analysis of unburdened hydrocarbons such as HC, especially in the medical and atmospheric fields. There are many compounds that have been reported to be carcinogenic, such as formaldehyde, acetaldehyde, and benzaldehyde [12,13]. For the detection of aldehydes and ketones in different tested samples, it is very practical to derivatize them with 2,4-dinitrophenylhydrazine (DNPH) and then perform high performance liquid chromatography (HPLC) on the product. The 2,4-dinitrophenylhydrazine derivatives have been separated for detection using UV/VIS, diode array, and mass spectrometric detectors [14,15]. Urban areas dominate the polluted air in field; formaldehyde and acetaldehyde, with similar aldehydes, are potential contributors to forming photochemical smog. Increasing regulated and unregulated emissions could face more restrictions and new regulations in the automotive industry in the future [16,17,18]. Many researchers are focusing on an after-treatment system and new techniques to be used to minimize engine tail pipe emissions and reduce the effect of these gases in the atmosphere. New pressure techniques called high-pressure injection are used to reduce harmful emissions. The strong regulations imposed on the car industry encourage researchers to work harder to achieve an after-treatment system along with in-cylinder emission reduction technologies to minimize harmful emissions to minimum levels [19,20,21].
Sharma and Sahoo [22] predicted a new model approach was used to present the performance of a diesel engine and its emissions under variable engine compression ratio (rc). For the purpose of forecasting a variety of parameters, the Boosted Regression Trees model was developed on the basis of experimental data. Performance and emission parameters were predicted by the proposed Boosted Regression Trees model and presented with a respectable level of accuracy. During the first-of-its-kind endeavor in the field of syngas-fueled engines, Sharma and Sahoo [23] examined a hybrid adaptive neuro-fuzzy inference system response surface approach. A new synthetic gaseous fuel called syngas (H2 + CO) was examined in four distinct configurations for performance. A hybrid adaptive neuro-fuzzy inference system models’ low errors and uncertainty levels served as evidence of their excellent predicting capabilities. Utilizing the desirability technique, the performance of the syngas-powered engine was enhanced for maximum effectiveness and minimal pollutant emissions. However, some issues were examined regarding unregulated gas emissions, and the environmental protection agency EPA study [24] showed that the ratio of total volatile organic compound detected in the sample by GC to HC (determined by straight reading instruments) increased with the biodiesel concentration. Regarding chemical individual species, biodiesels emit higher exhaust emissions, such as benzene, toluene, and acrolein, compared to diesels. Most of the previous literature concentrates on regulated emissions and there is a shortage of knowledge regarding unregulated hydrocarbons.
The aim of this work was to investigate the impact of using blended fuel (methanol) in different portions on engine characteristics and tail pipe emissions, and the influence of engine speeds on tail pipe emissions, such as hydro carbon HC, carbon monoxide CO, and nitrogen oxide NOx, was presented. Aldehyde speciation from diesel engine was analyzed at different engine load conditions.

2. Experimental

2.1. IC Engine

The experiment was performed on a water cooled, four cylinders, four-stroke, turbocharged direct injection diesel engine equipped with dynamometer, and data management was used for data collection. The engine had a 80 kW power at 2600 RPM, displacement of 3.8-L, and the main engine specifications are presented in Table 1. An electric dynamo meter with a rotor and a load cell was used to load and rotor the engine. Ignition timing was adjustable manually. Engine speed was provided with speedo meter to control engine speed. Multi-point thermometer was available to measure the water flow in to the engine cooling system and out of the cooling system, a thermocouple was used to measure the cooling water temperature, and another thermocouple was used to measure exhaust temperature. The diesel fuel flow rate was measured by a flow meter instrument installed on the engine test rig. The experimental setup is shown in Figure 1.

2.2. Fuel

Standard commercial diesel fuel was used in this work study; specification of used fuel is presented in Table 2.

2.3. Emissions Analysis

The emissions analyzer used in this work, is Horiba MEXA 7100 DEGR, supported with emission heated line to measure HC, CO, CO2, NOx and O2. The gas measurements were recorded with the uncertainty analysis as seen in Table 3. The average recorded values are given by ( X ¯ ):
X ¯ = X m n
where n is the number of measurements recorded, and Xm is the value measured. A standard deviation (SD) can be expressed as follows:
SD   = m = 1 n   X m X 2 n 1
In order to calculate uncertainty (U), the following formula can be used:
U   = SD n
To sample engine tailpipe gases, 1.0 L/min of gas was passed through a midget impinger with a volume of 25 mL. For the first 20 min of the process, exhaust gas bubbles were present within the DNPH solution reagent, throughout the test, and to prevent any evaporations of the samples, a bath of ice was available around the samples during the whole process. In the samples, the carbonyl compounds reacted with the reagent and produced DNPH-carbonyl derivatives as soon as the emission gases bubbled in the DNPH solution. A similar sampling methodology has been described in the past [25]. Every individual sample was taken to be put inside the refrigerator until HPLC analysis was performed, and temperatures remained below 4 °C. High performance liquid chromatography (HPLC) was used to carry out the carbonyl species analysis, approaching reversed phase. Dionex Acclaim 120 was used in HPLC, to separate component samples, on a 250 mm × 4.6 mm ID, and separation was achieved. The column was backed with five micro meters of C18 Acclaim 120. In this instance, a UV detector was available and its wavelength was set to 365 nanometers. The experiments were conducted using an eluent containing an acetonitrile/deionized water solvent gradient (10:90 v/v), passing the eluent with a flow rate of 1.0 mL/min with mixing ratio reaching 75:25 v/v acetonitrile to deionized water at 60 min; time analysis for an individual measurement took 70 min. A company called Sigma Aldrich (St. Louis, MO, USA) supplied the acidified solution of 2,4 DNPH. A mixture of 2,4 dinitrophenyl hydrazine (DNPH) and acetonitrile was used to hunt for twelve standards of aldehydes and ketones. The goodness of fit was 95% and uncertainty was 0.05%. Programmed work settings are shown in Table 4. A reference gas of carbonyl was used as a standard for comparing detected aldehydes from engine exhaust gases. Depending on the concentration level of the compound, each peak had a different retention time. Table 5 presents these data. As shown in Equation (4), an acidified solution of DNPH was used in the DNPH method to form hydrazine derivatives.
Energies 15 07933 i001

3. Results and Desiccation

3.1. Exhaust Emissions

3.1.1. NOx Emissions

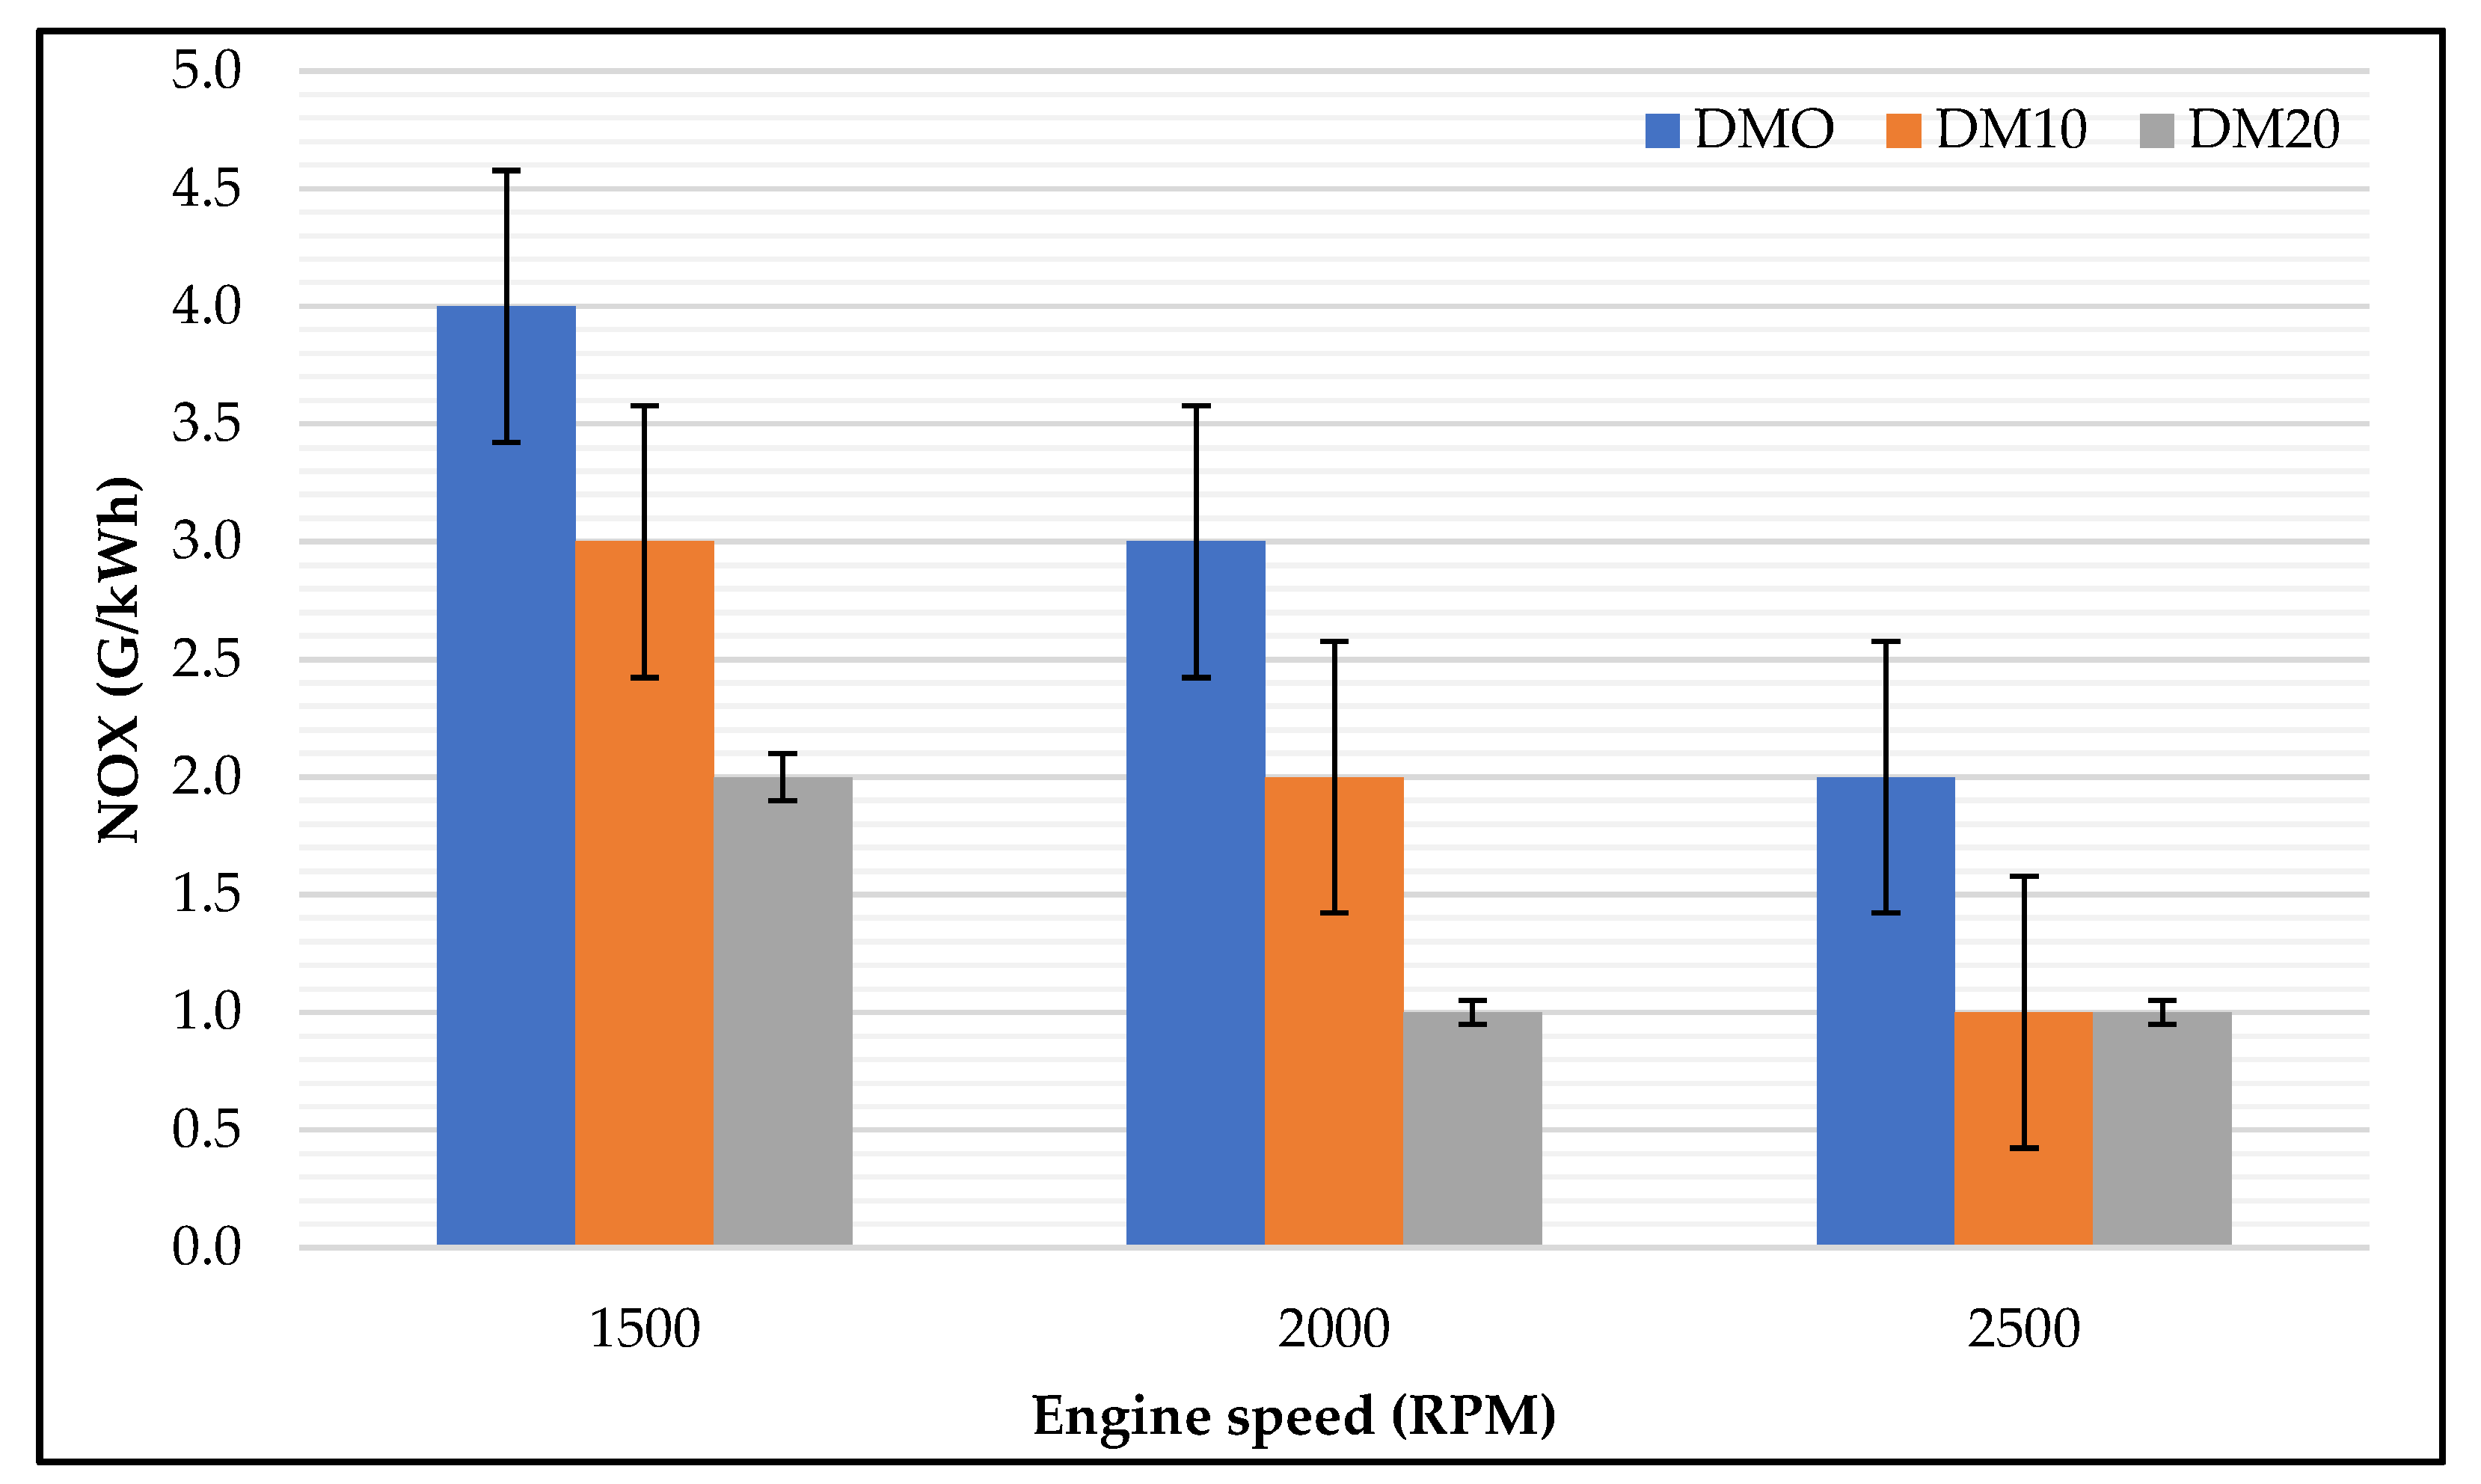
During the combustion in a diesel engine, with high temperature and plenty of air presented in the combustion chamber, NOx was formed by the thermal mechanism. So, the NOx emissions are highly affected by the temperature of fuel combustion, presence of oxygen, and the residence time in the combustion chamber. NOx emissions with changing engine speeds showed an important trend; as seen in Figure 2, NOx emissions were heavily reduced at all different engine speeds with all used fuels. This is attributed to two main factors: (i) changing to predominantly diffusion combustion phase because of lower time available for fuel–air premixing, and (ii) not much time available for NOx formation. Or it could be attributed to a high concentration of air at a higher speed compared to a lower engine speed [26]. DM20 emitted the lowest NOx emissions among all different engine speeds, which could be attributed to the cooling of the charge present in the cylinder. Increasing engine speeds has a strong influence in reducing NOx emissions for all different used fuels. In combustion products there are two types of nitric oxides. Also, some nitrogen is already present in the fuel content; most NOx formations come from the oxidation of atmospheric nitrogen initiated via reaction with O atoms, O + N2 → NO + N, followed by N + O2 → NO + O, and N + OH → NO + H [27,28]. This is known as the Zeldovich mechanism, which happened during the power stroke and presented at the tail pipe emissions which represent our case of NOx formations.

3.1.2. HC, CO Emissions

The formation of unburned HC in CI diesel engines is an indicator of poor combustion efficiency, as complete combustion will reduce HC emissions. As seen in Figure 3, with pure diesel, HC is highly influenced by increasing engine speeds. Increasing engine speeds leads to decreases in HC emissions; when the speed increased, the intake and exhaust valves opened and closed faster, the air was replenished in a timelier manner, and the fuel was fully burned, reducing the emission of HC compounds. This phenomenon regarding engine speed was also found in some studies [29,30,31]. On the other hand, using diesel and blended fuels (Figure 3) showed a higher HC emission from DM10-DM20 compared to pure diesel, which is attributed to a combined rezone of relatively higher latent heat of vaporization, and slower flame-speed, which could cause a higher degree of incomplete combustion of fuel which is closed to the cylinder wall.
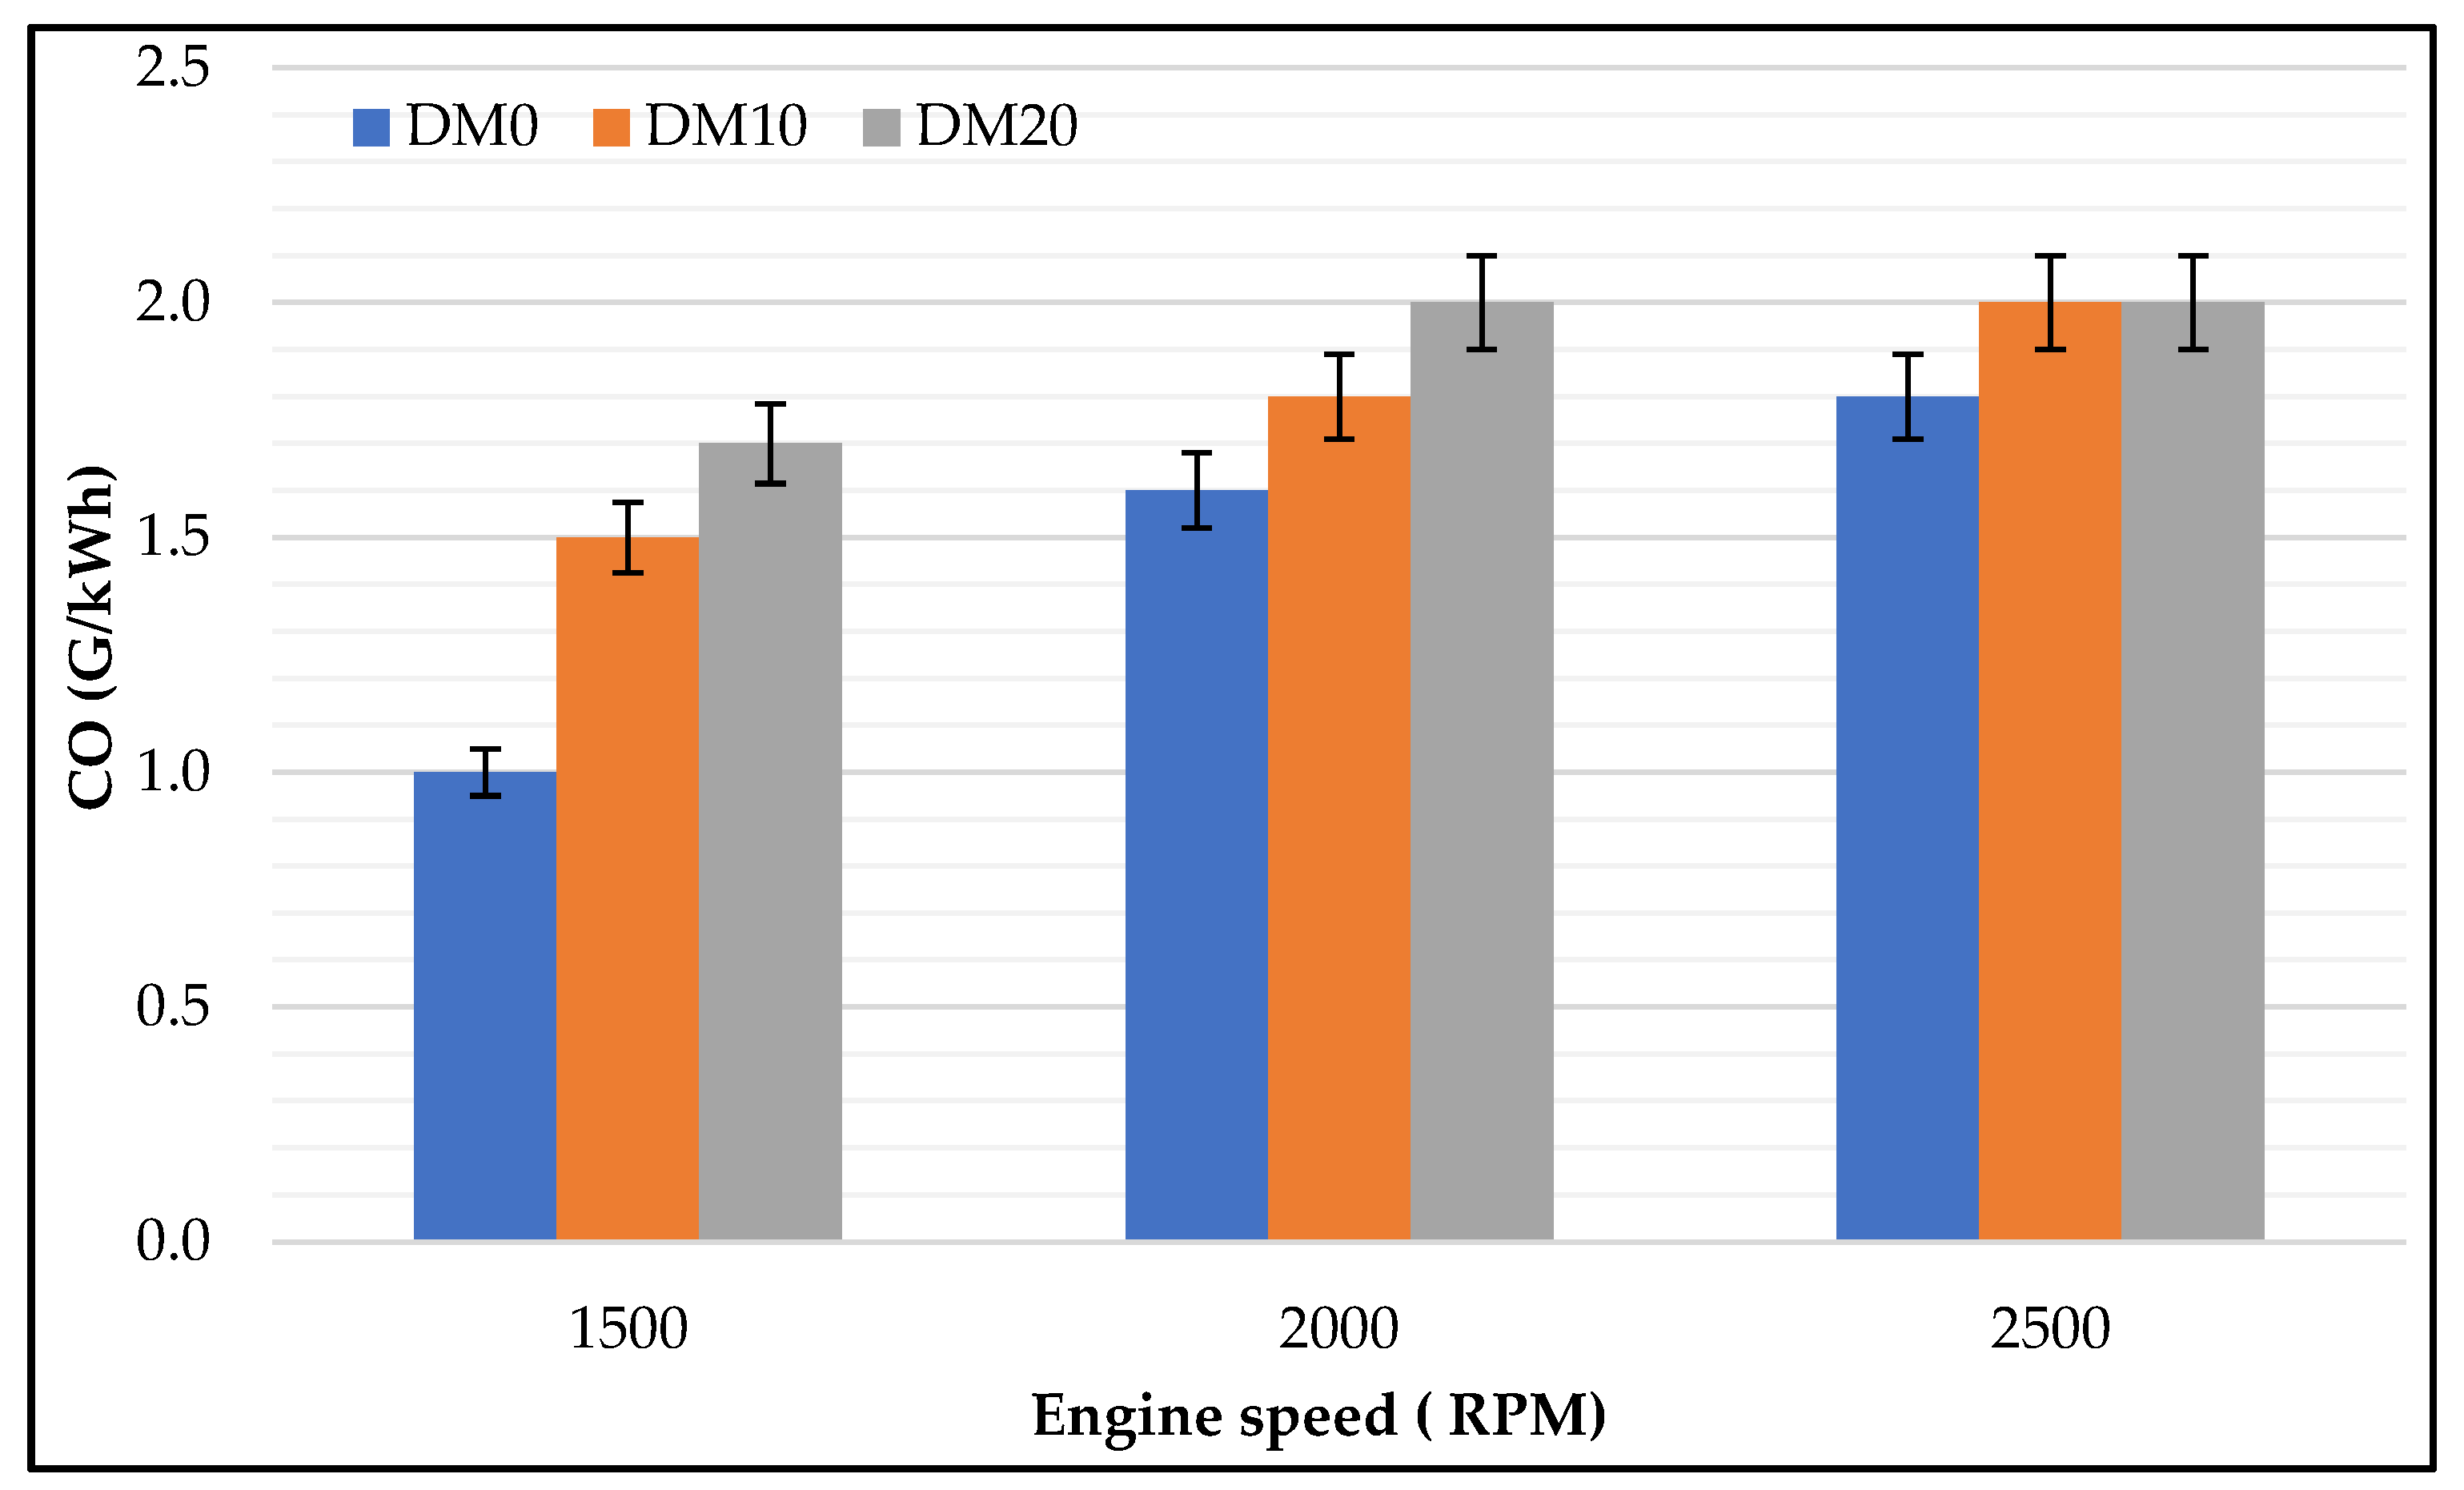
Figure 4 illustrates the increase in CO emissions in the blended fuels (10% and 20% methanol blends), compared to pure diesel fuel at all different engine speeds. Taking the average concentration at different speeds, the increases in CO are in the order of (33% and 41%) 10% and 20% for blended fuel. According to the results, returning to the pure diesel mode, the lower temperature of the combustion which is related to the cooling influence and higher latent heat of methanol resulted in poor combustion, suppressed CO oxidation, and led to an increase in CO compared to diesel [32,33,34].

3.1.3. UN Regulated HC Emissions

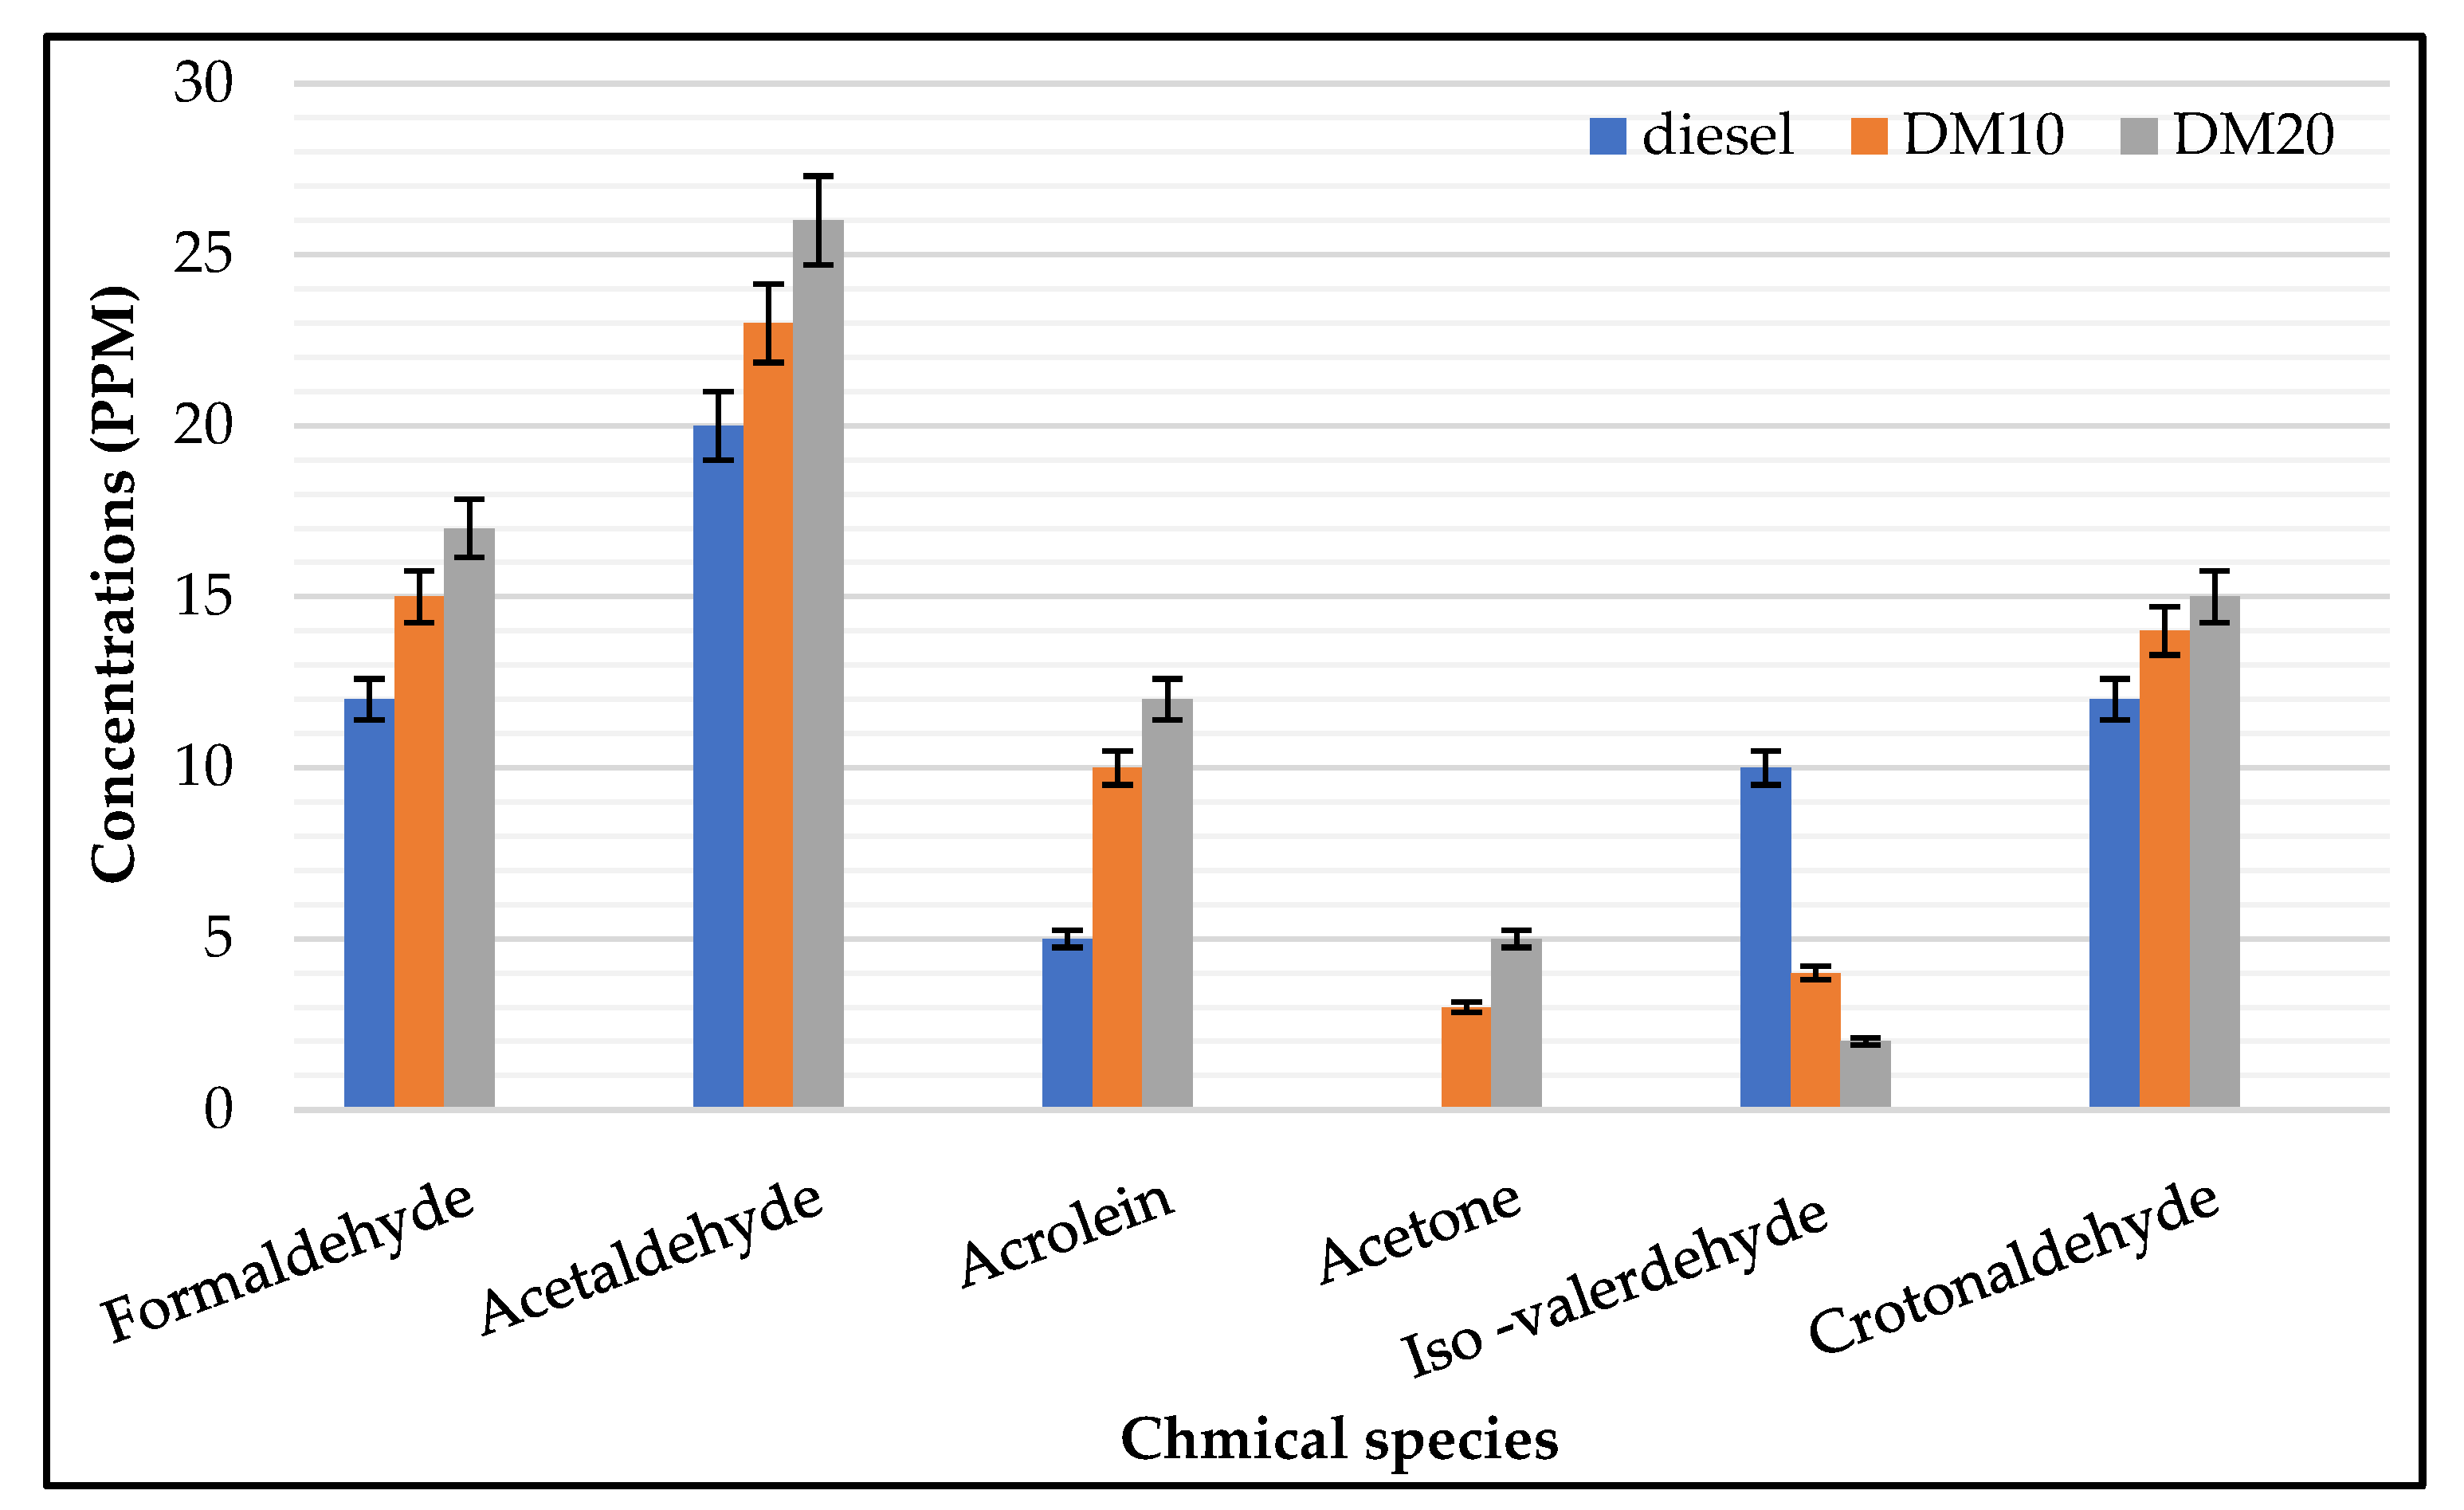
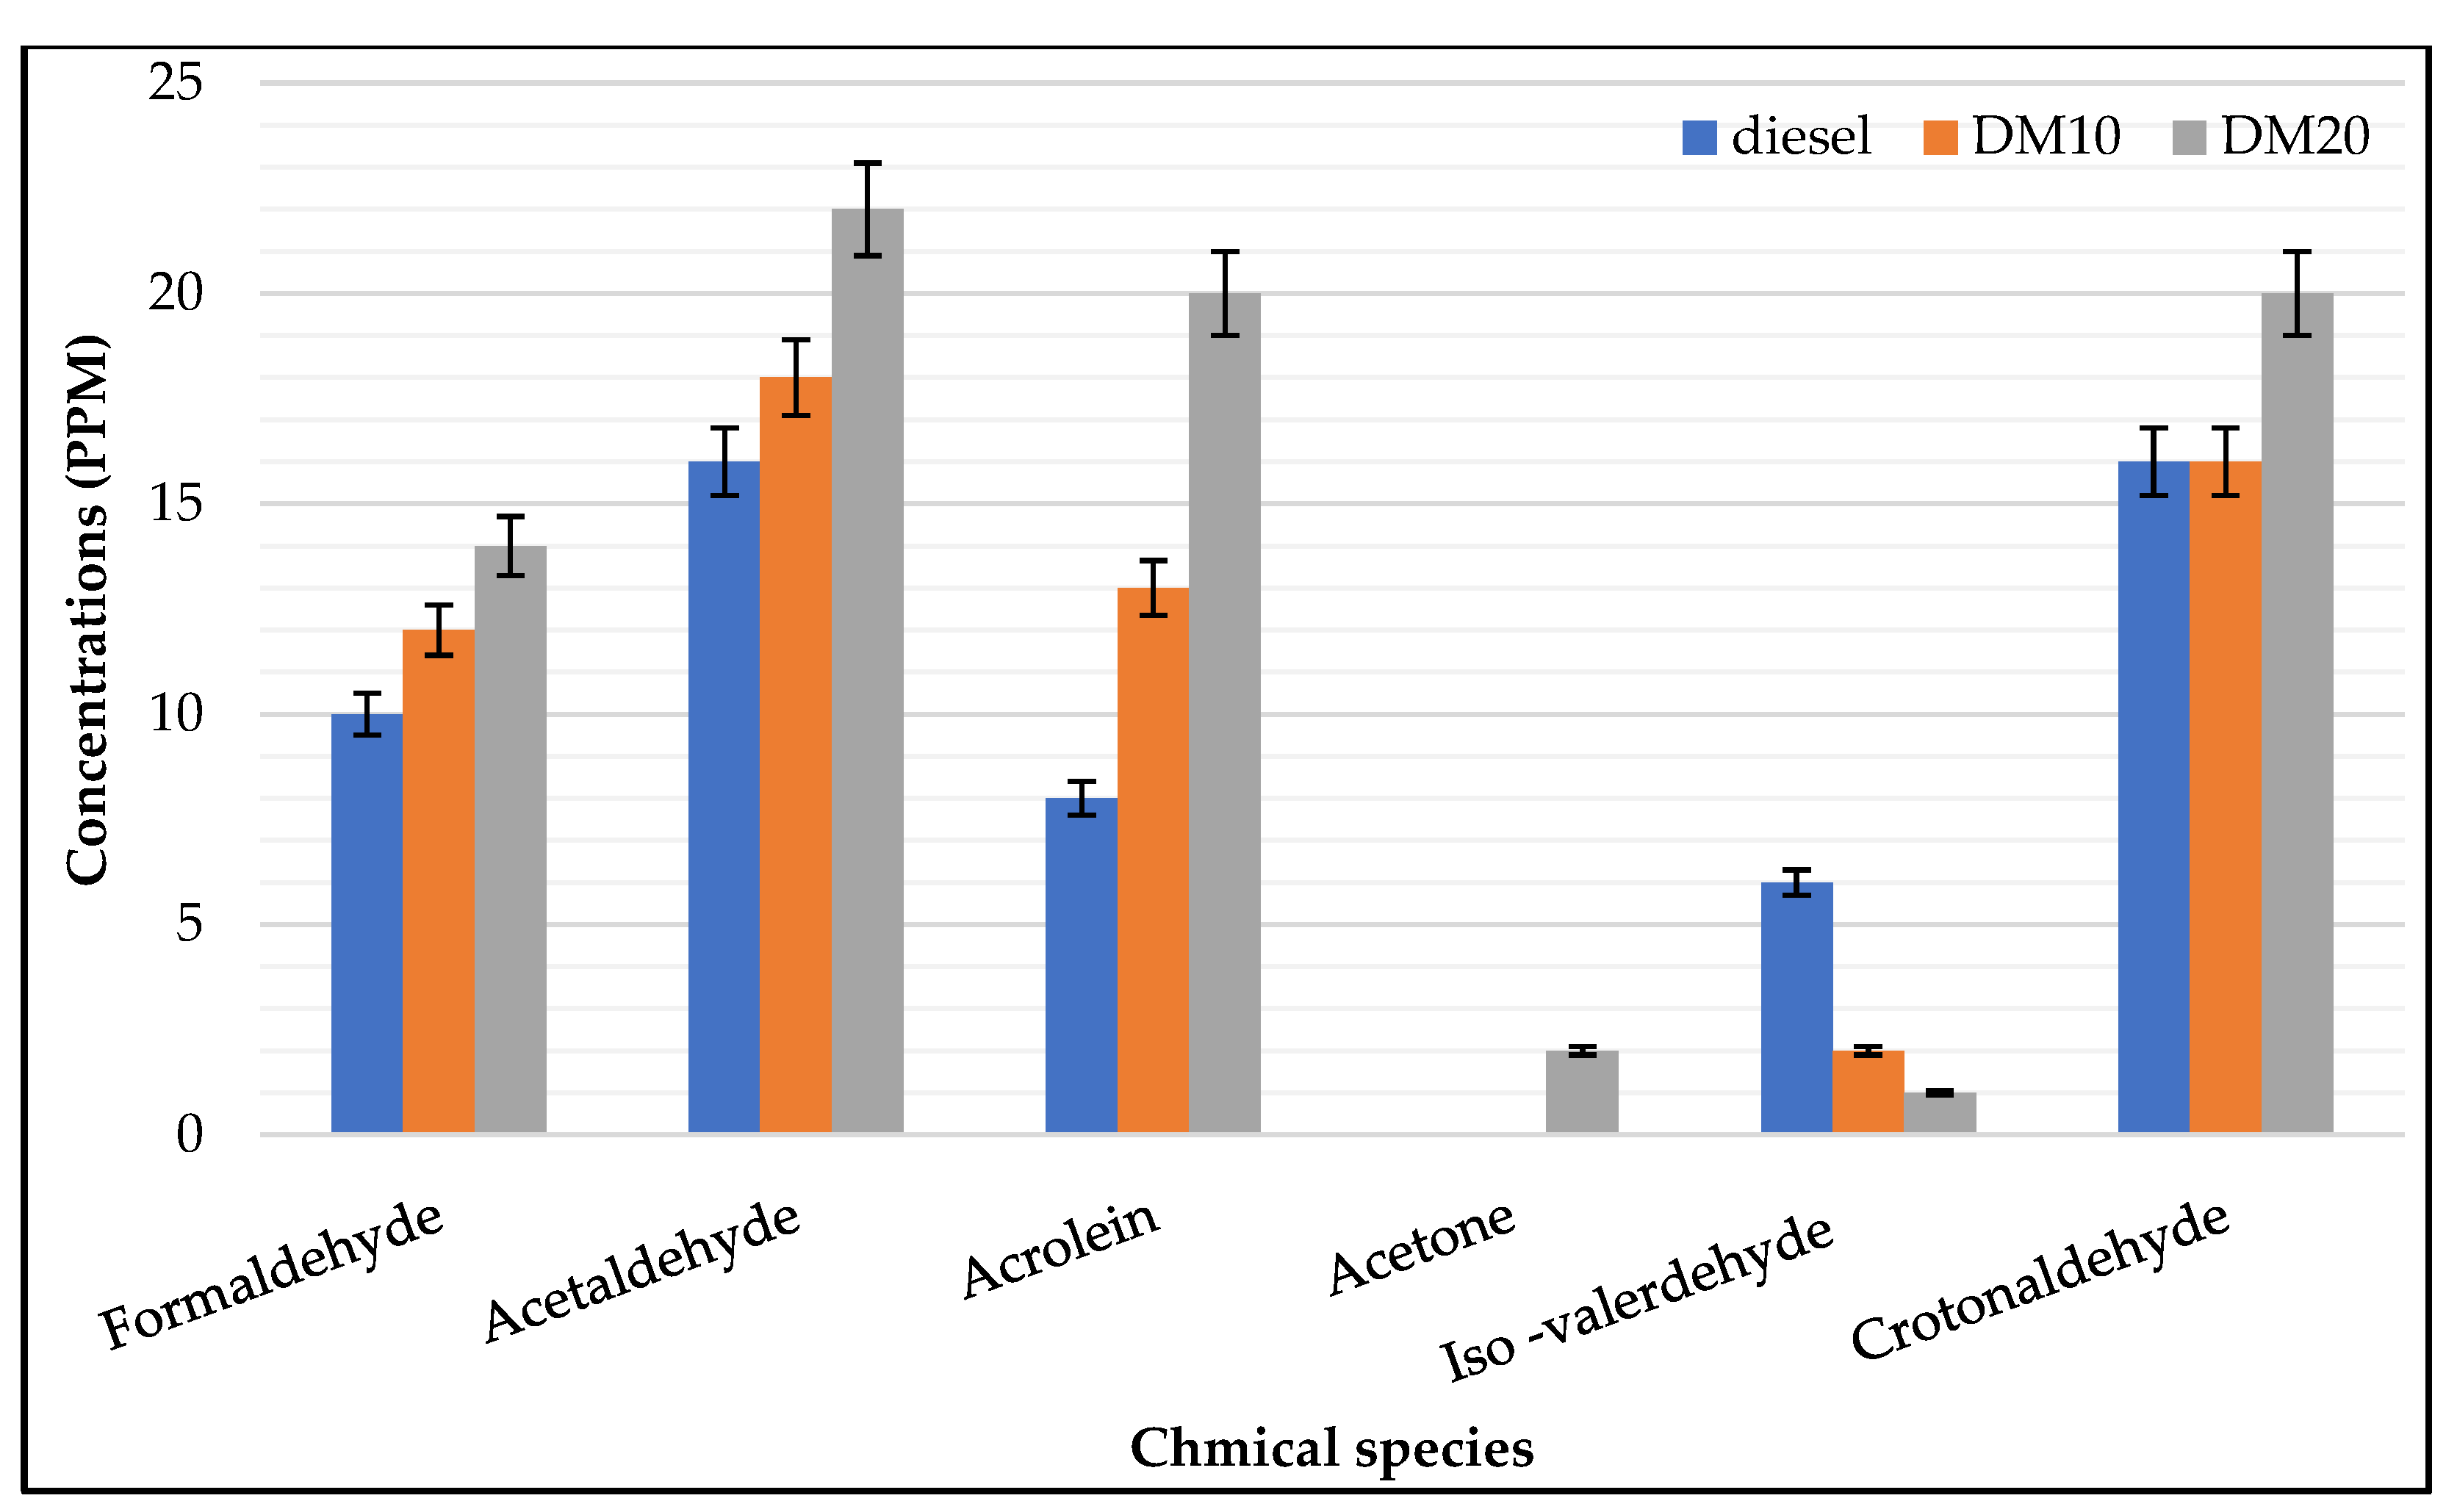
Formaldehyde: the formation of this chemical compound is more likely due to the lack of oxygen during combustion; consequently, the fuel contents are partially oxidized. This study measured the detected chemical species using a C1 equivalent to formaldehyde and calculated them in parts per million (ppm). At different engine loads, Figure 5, Figure 6, Figure 7 and Figure 8 show that, carbonyl species from the engine exhaust is a result of methanol/diesel blends. A carbonyl functional group is associated with the term ‘carbonyl’, which is a divalent group. This compound is formed by double-bonding between carbon atoms and oxygen atoms.
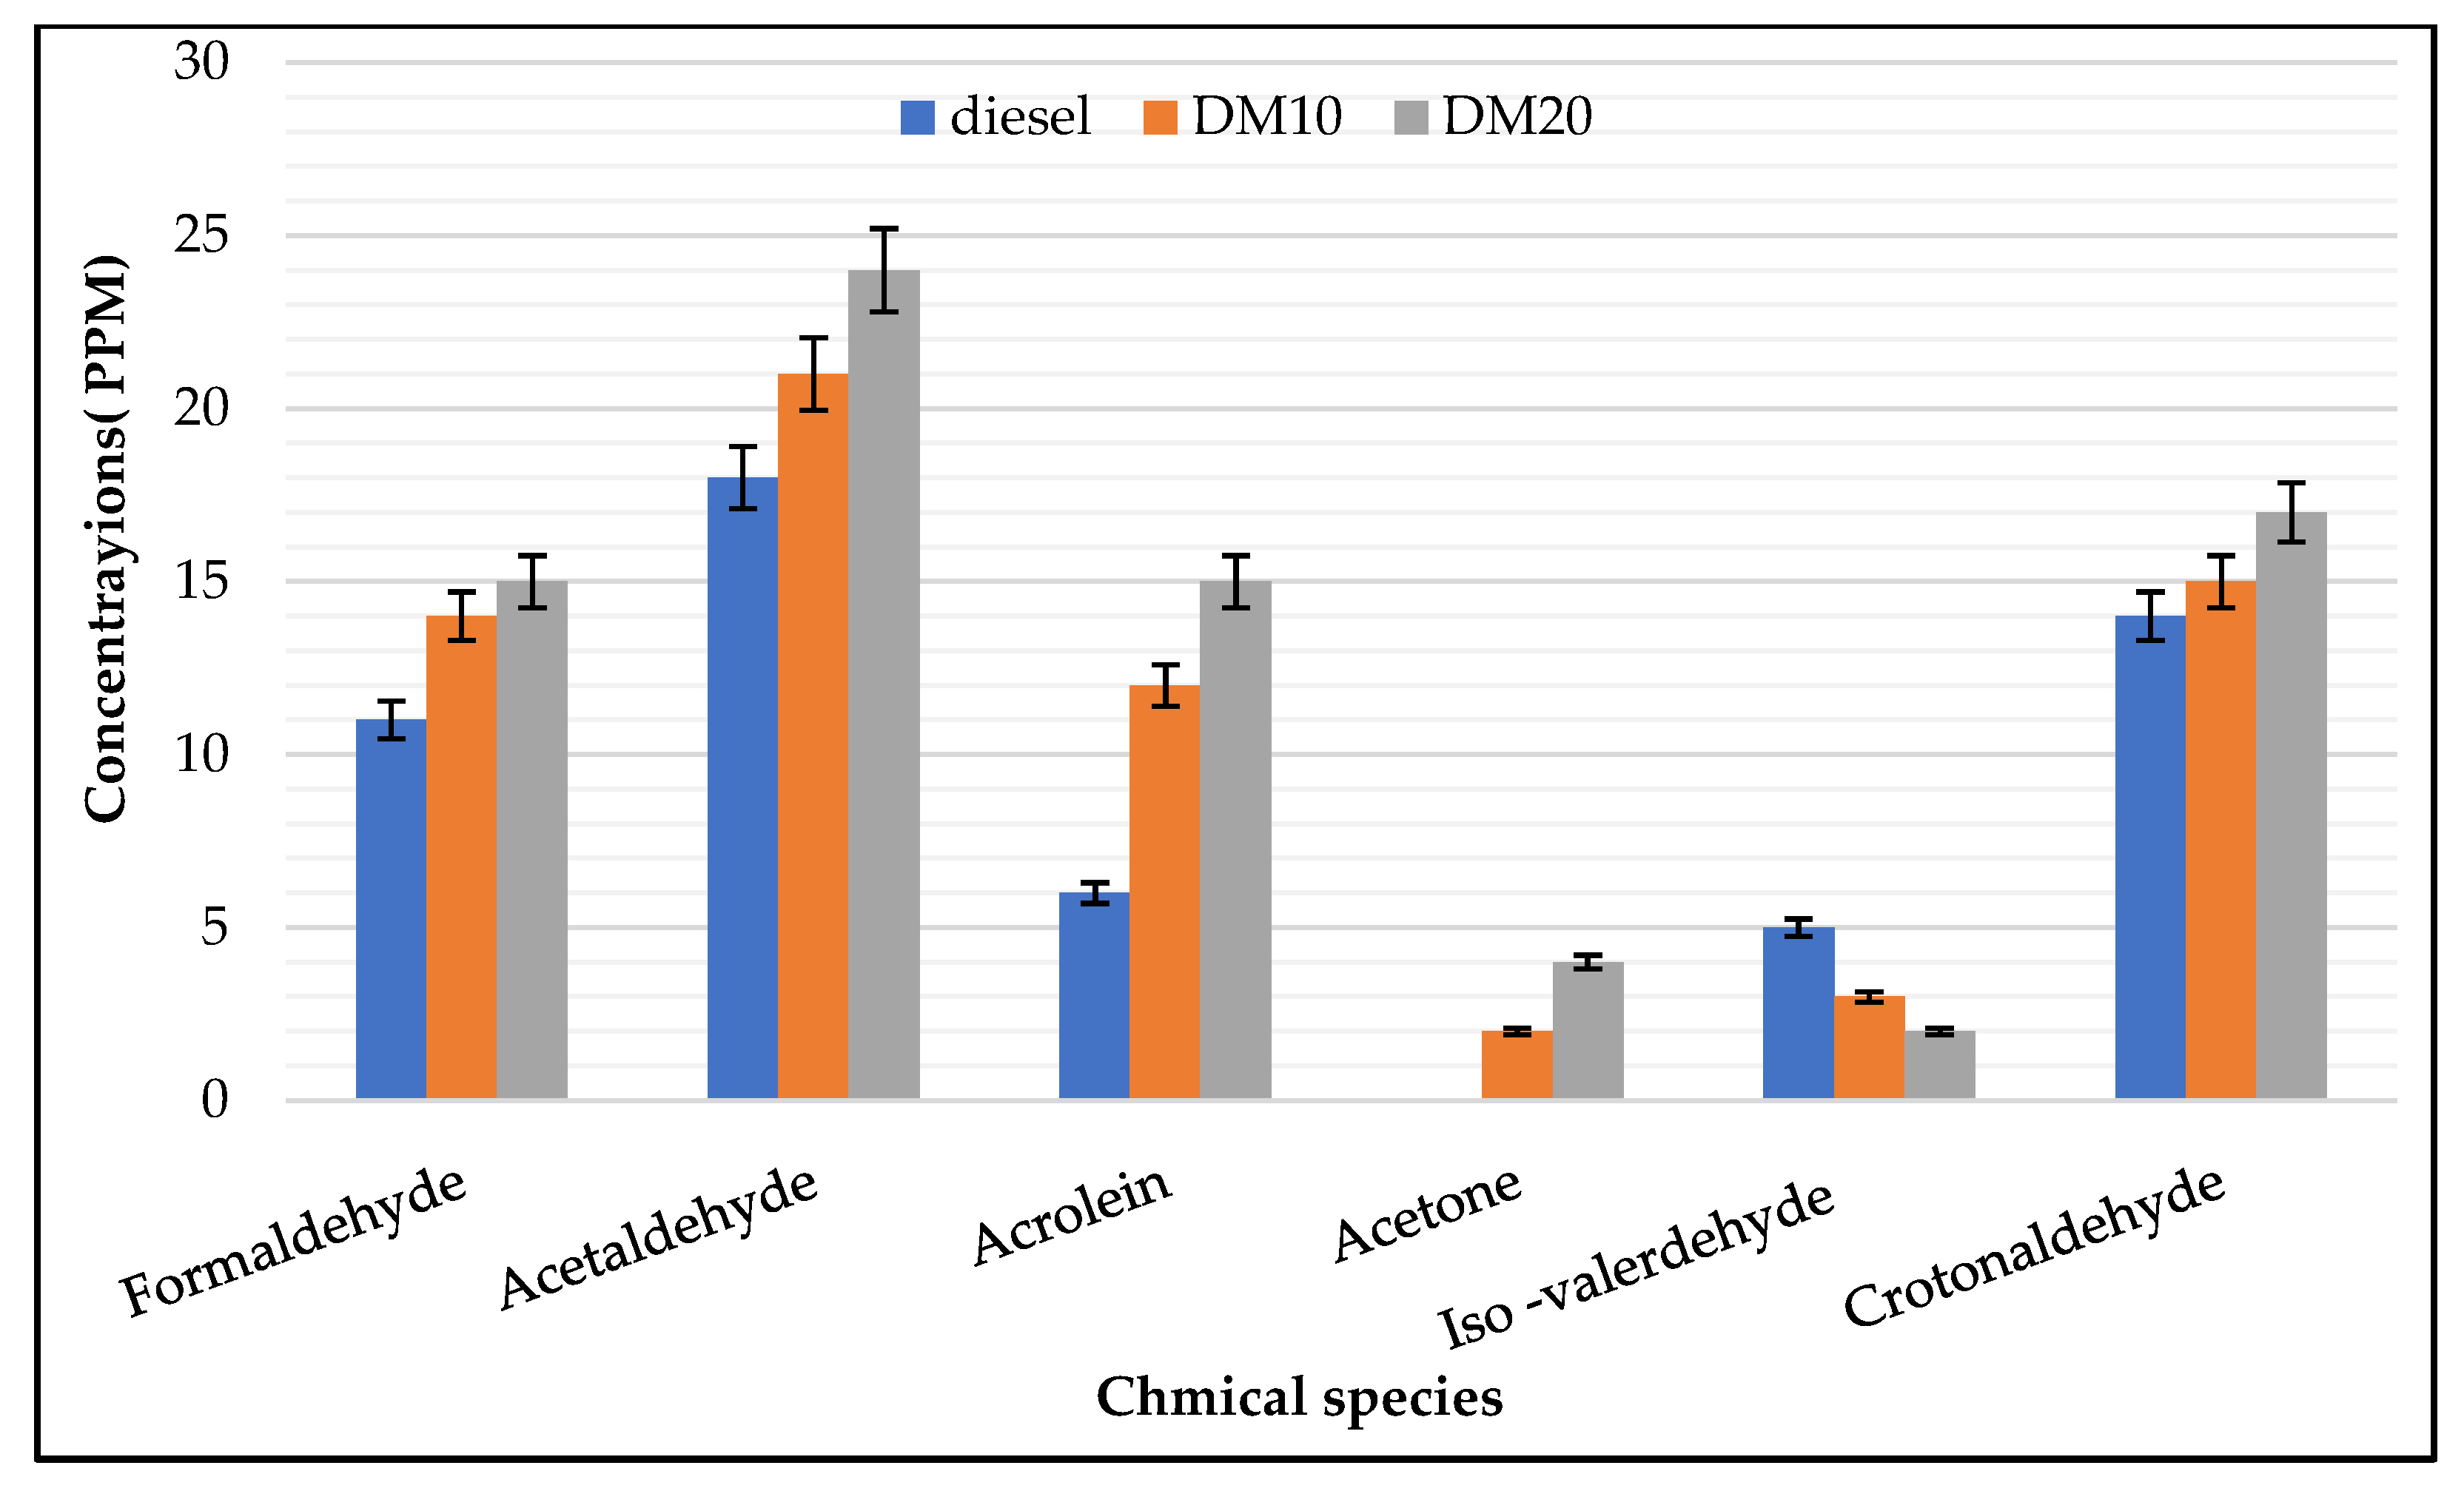
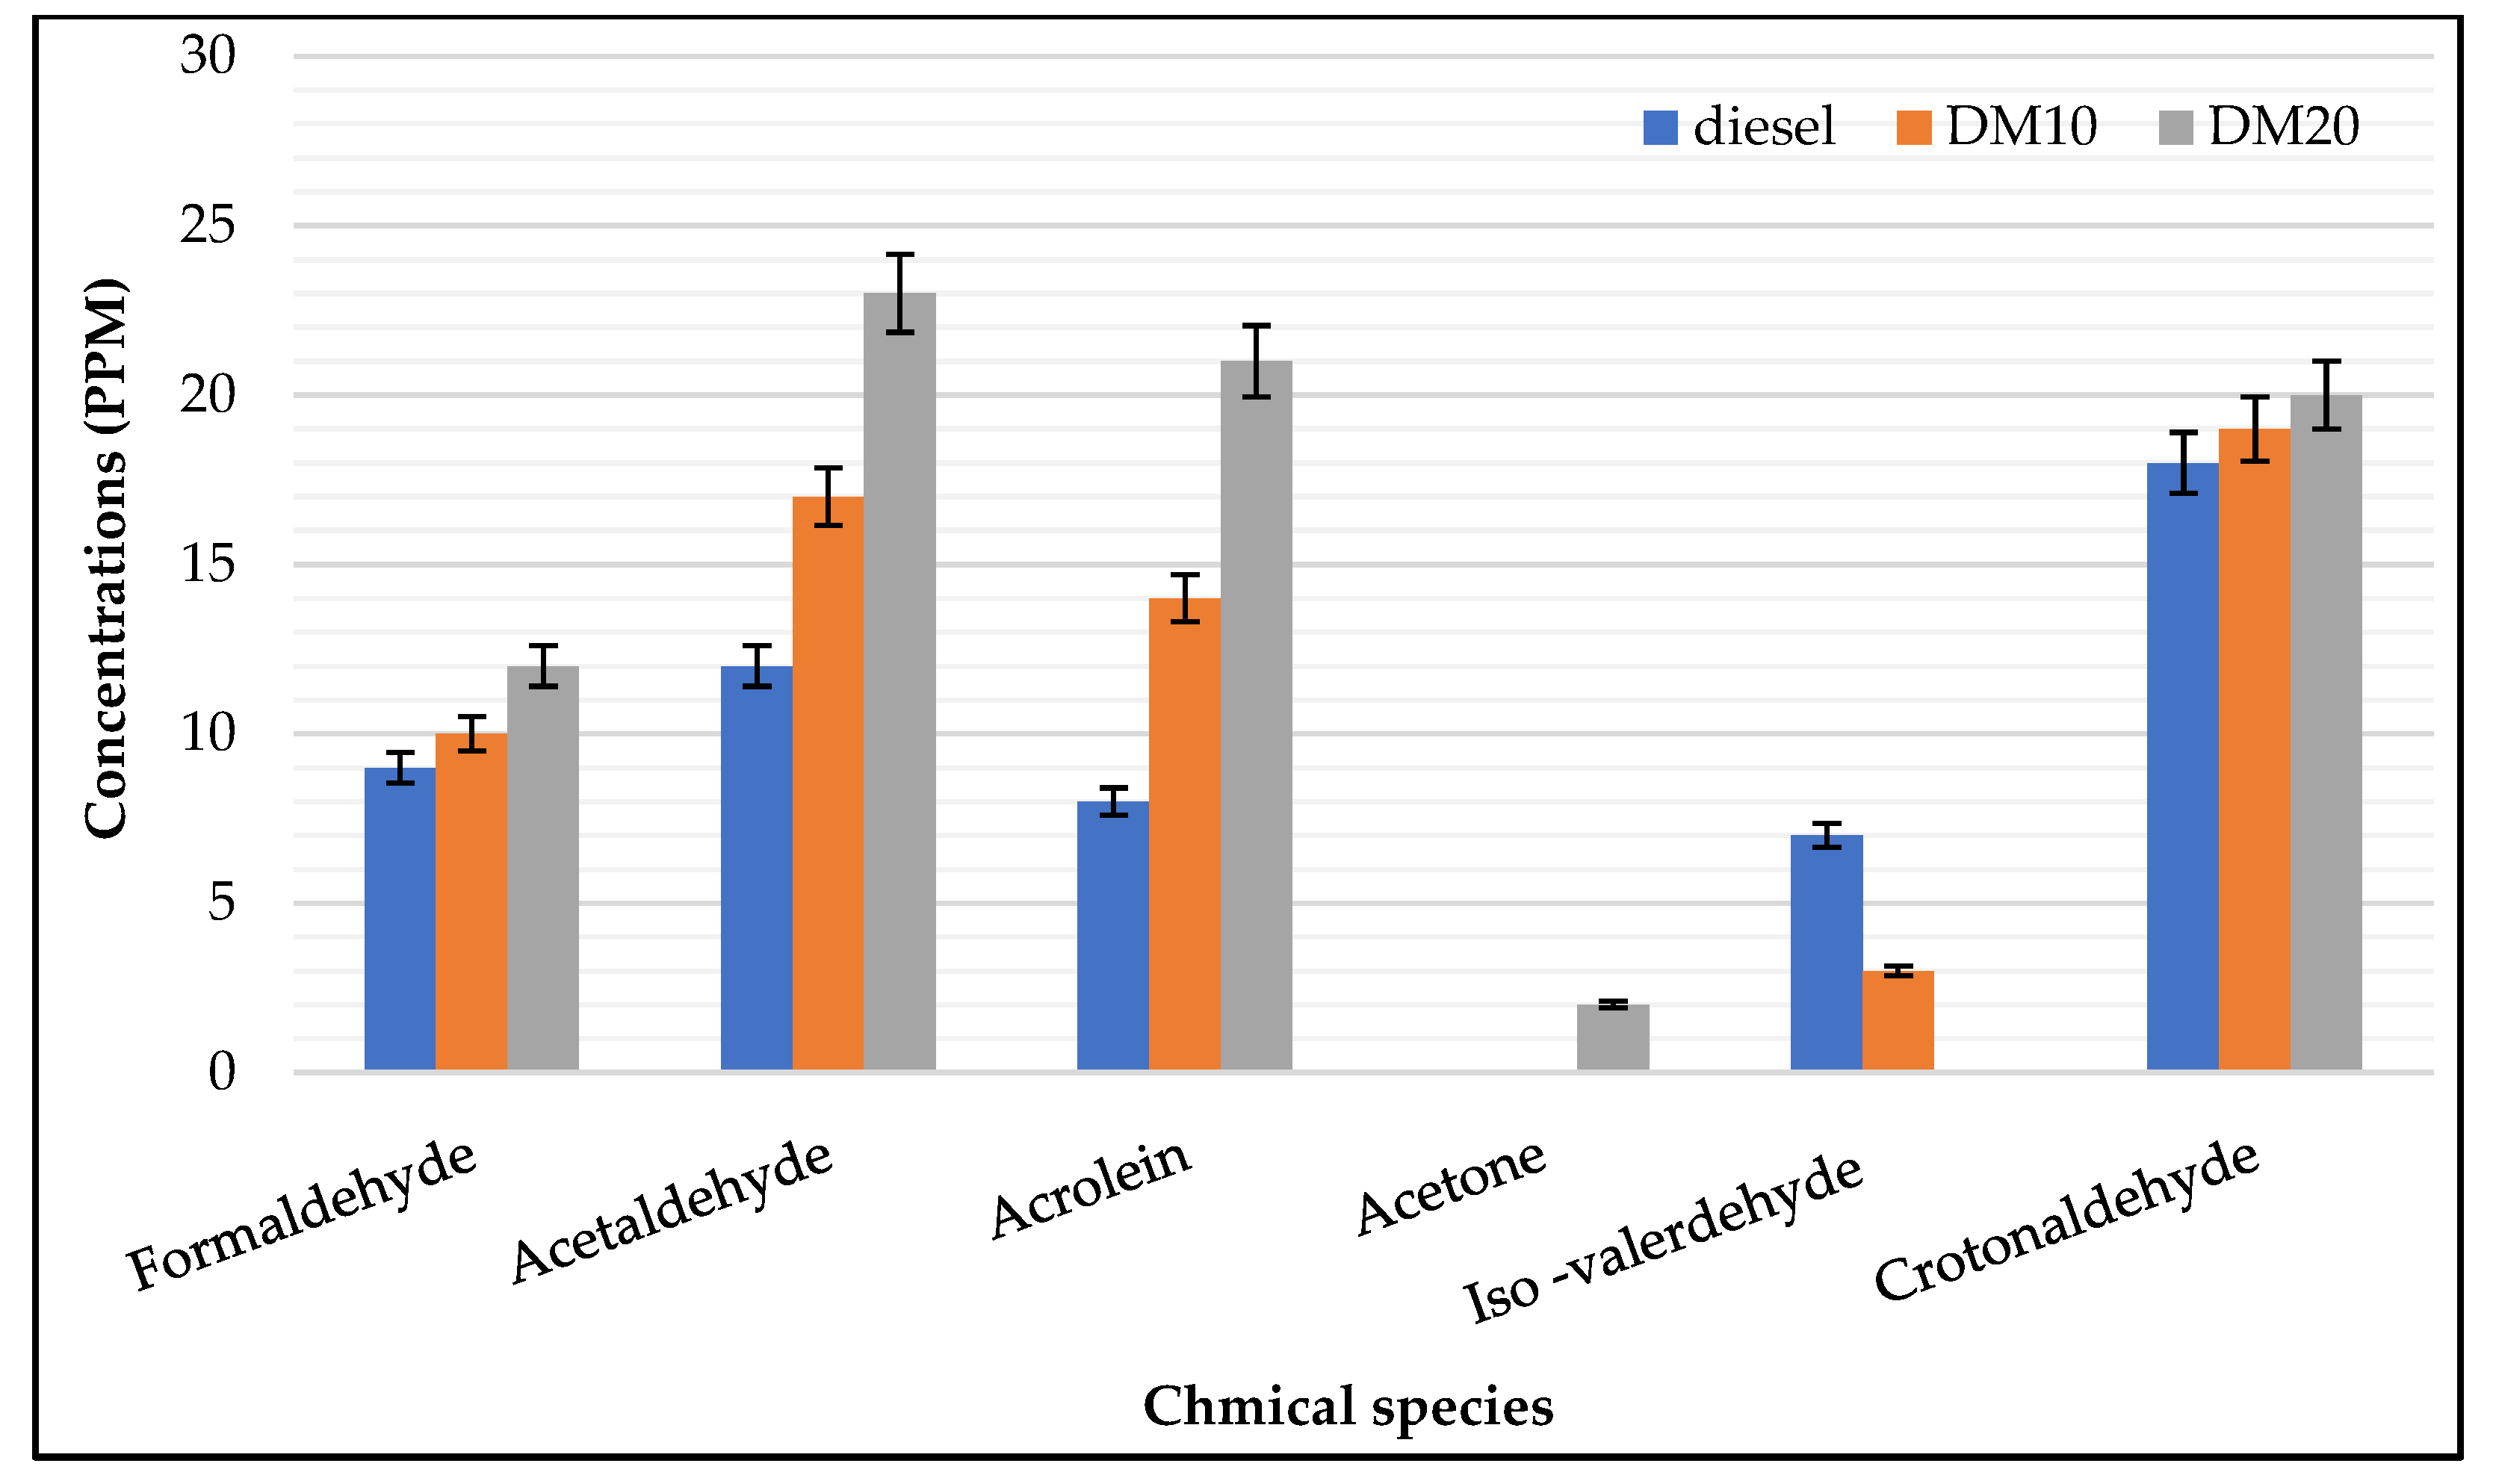
Carbonyl compounds in diesel particulates participate in enhancing its physiological response [35]. Figure 5, Figure 6, Figure 7 and Figure 8 show the influence of pure diesel content on formaldehyde and acetaldehyde and other aldehyde gas emissions, with engine load ranging from 2 bar to 8 bar. Carbonyl emissions were slightly higher at low load and decreased as the load increased. Aldehyde emissions of pure diesel and diesel-blend fuel maintained a low level, while on the other hand, the methanol/diesel blend of different portions of methanol increased aldehyde emissions, especially in lower loads. Formaldehyde is an intermediate chemical species of the ignition phase of diesel fuel; formaldehyde is rapidly consumed with the availability of OH through the diffusion combustion stage [36,37]. By increasing engine load, formaldehyde emissions reduced and the effect of fuel components reduced because of increasing cylinder temperature; this temperature will help with the further oxidation of formaldehyde. Figure 5 and Figure 6 at a lower engine load show that diesel ignition delay is relatively short. The fuel spray period and the “cool flame” period during the beginning of combustion are longer with diesel/methanol blends with greater ignition delay, making combustion more efficient by generating more HCHO. This resulted in a higher level of HCHO emissions from blended fuels with a longer ignition delay. A reduction of approximately 25% in formaldehyde concentrations was observed. At a higher load, shown in Figure 8, referring to the methanol/diesel blend, formaldehyde increased about 29%
Acetaldehyde: Figure 5, acetaldehyde presented with higher concentrations compared to formaldehyde, reached up to 20 ppm at the lower load and decreased about 40% at the higher load. In Figure 8, on the other hand, acetaldehyde showed a higher concentration when using the blended fuel; this was noticed at all different engine loads. Figure 5, Figure 6, Figure 7 and Figure 8 reflects the impact of fuel components on acetaldehyde formation.
Acrolein: At a lower load, Acrolein had a different trend compared to formaldehyde and acetaldehyde (Figure 5); it showed a low concentration of 5 ppm when pure diesel was used.
By increasing engine load, Acrolein increased in all engine load conditions, Increments occurred up to 38%. On the other hand, a higher concentration was noticed when the diesel methanol blend was used as fuel, Figure 5, Figure 6, Figure 7 and Figure 8. Acrolein concentrations, regardless of the methanol blend, increase as engine loads increase. According to literature, the load of the engine and fuel/air ratio of acrolein are the main sources of carbonyl emissions. The formation of acrolein species in the tail pipe could have been produced from the fuel when methanol was added. The fuel components can strongly affect the emission of carbonyl chemical compounds; also, the oxidation of acrolein precursors may be restricted by the addition of methanol blends [38,39,40].
Acetone: Acetone, as seen in Figure 5, Figure 6, Figure 7 and Figure 8, did not show a high concentration between different engine conditions. Increasing engine load reduced acetone to a minimum, and it almost diminished at higher loads (Figure 5).
Iso-valerdehyde: This is aldehyde with a colorless liquid at standard temperatures, and has pressure presented with lower levels in the atmosphere and plenty of food.
At lower engine loads (Figure 5), iso-valerdehyde had the highest concentrations when pure diesel was used and was reduced about 30% at a higher engine load. Alternatively, with blended fuel, the iso-valerdehyde concentration was reduced about 50% at all engine loads (Figure 5, Figure 6, Figure 7 and Figure 8).
Croton aldehydes: This is strongly toxic, normally presented with mixed E- and Z-isomers; it has one of both methyl and formyl groups. Croton aldehyde is present in variable kinds of food stuffs as soya bean oil. At a lower load, Figure 5, the concentration of croton aldehyde for pure diesel and blended fuel, 10% and 20%, are 12 ppm, 14 ppm, and 15 ppm, respectively, then increased to 18 ppm, 19 ppm, and 20 ppm, respectively, for the higher load, Figure 8. In normal conditions oxygenates produce less croton aldehyde levels from diesel fuel compared to commercial gasoline fuel. It is possible that the reduction in croton aldehyde formation can be attributed to the lack of hydrocarbons such as 1-hexene and cyclohexane in these fuels. This is reported for some levels of aliphatic gasoline, as the related fuel has smaller amounts of hexane.

3.2. Engine Characteristics

3.2.1. Brake Specific Fuel Consumption

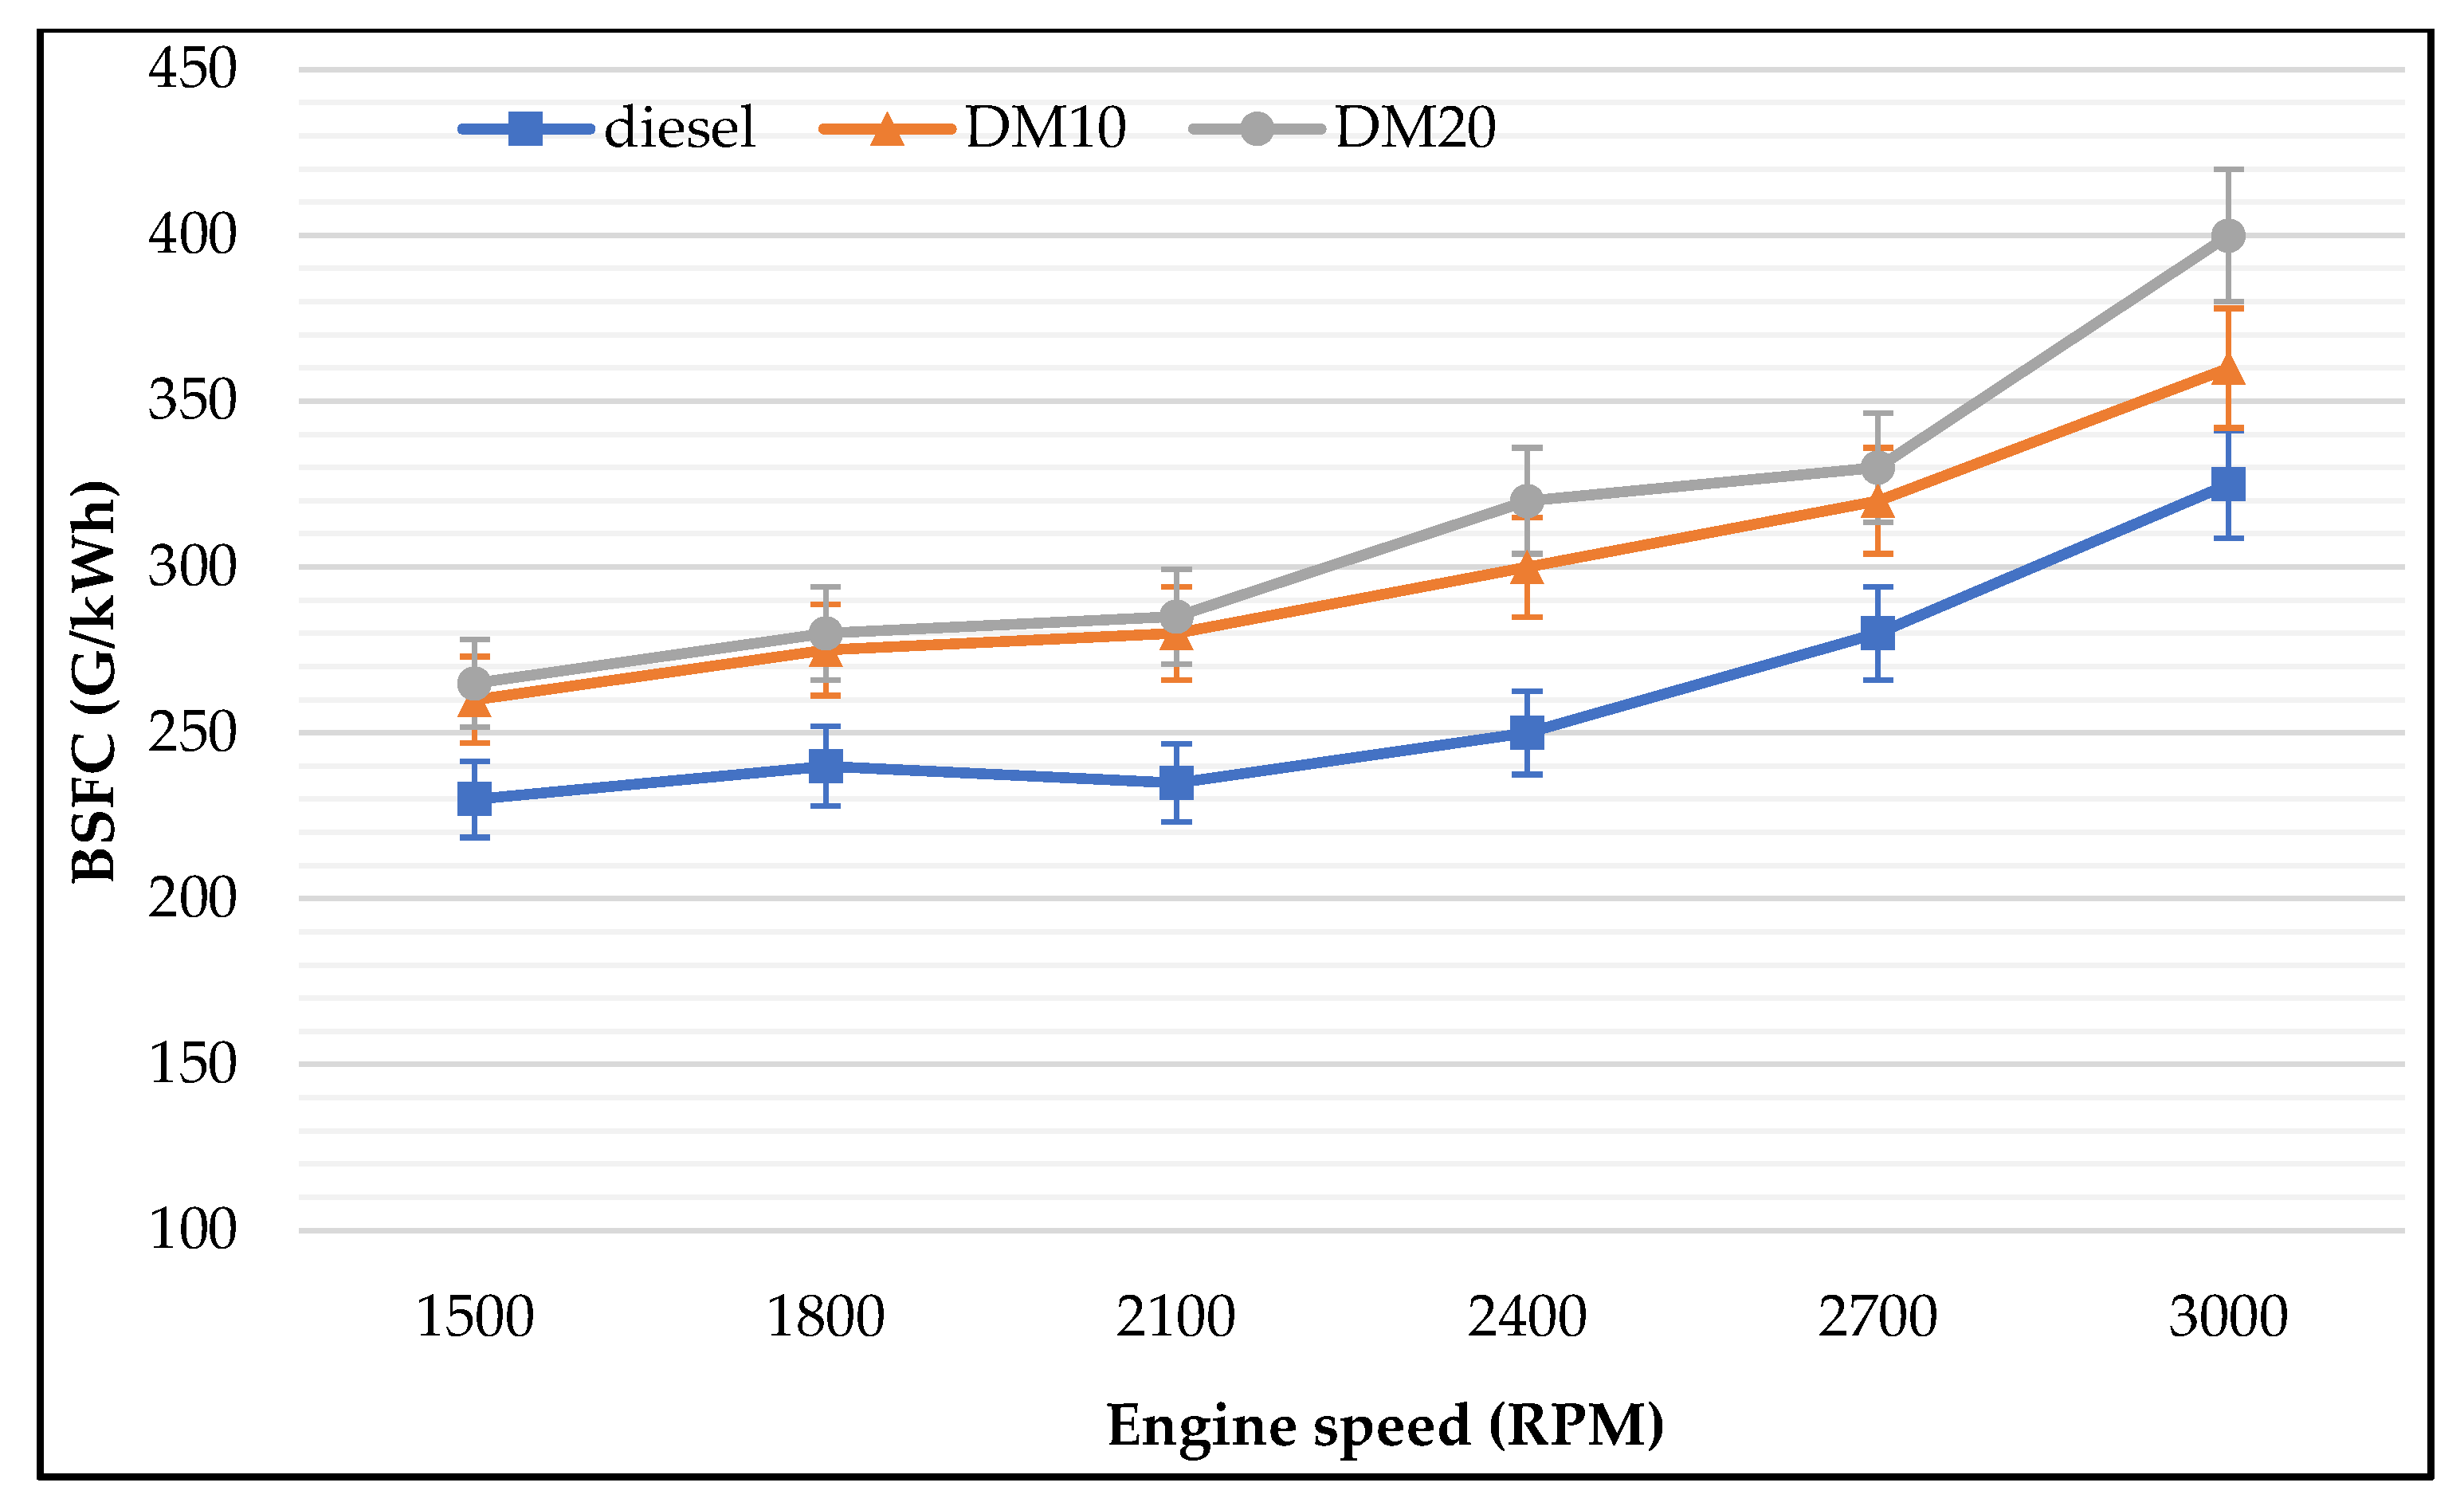
The influence of different fuels on the brake BSFC with respect to engine speed are shown in Figure 9; by increasing engine speeds with a constant load, BSFC becomes higher for all used test fuels. Blended fuel 20% showed a higher BSFC compared to pure diesel. BSFC values of blended fuel 10% and 20% methanol were higher than those of pure diesel fuel at all engine speeds. This is related to the HHV of diesel fuel compared to diesel blended fuel. LHV of the blended fuel leads to greater BSFC compared to diesel fuel.
The variations of BSFC with different engine speeds for all test readings clarify that the BSFC of more methanol samples increased with higher speed due to the increased percentage of methanol in the fuel used; these are adding sufficient oxygen content to help the fuel to burn properly. Increasing the concentration of blended fuel and the in-cylinder oxygen concentration helps in diminishing the calorific value and enhance the viscosity which causes the increase of BSFC compared to diesel fuel.

3.2.2. Brake Thermal Efficiency

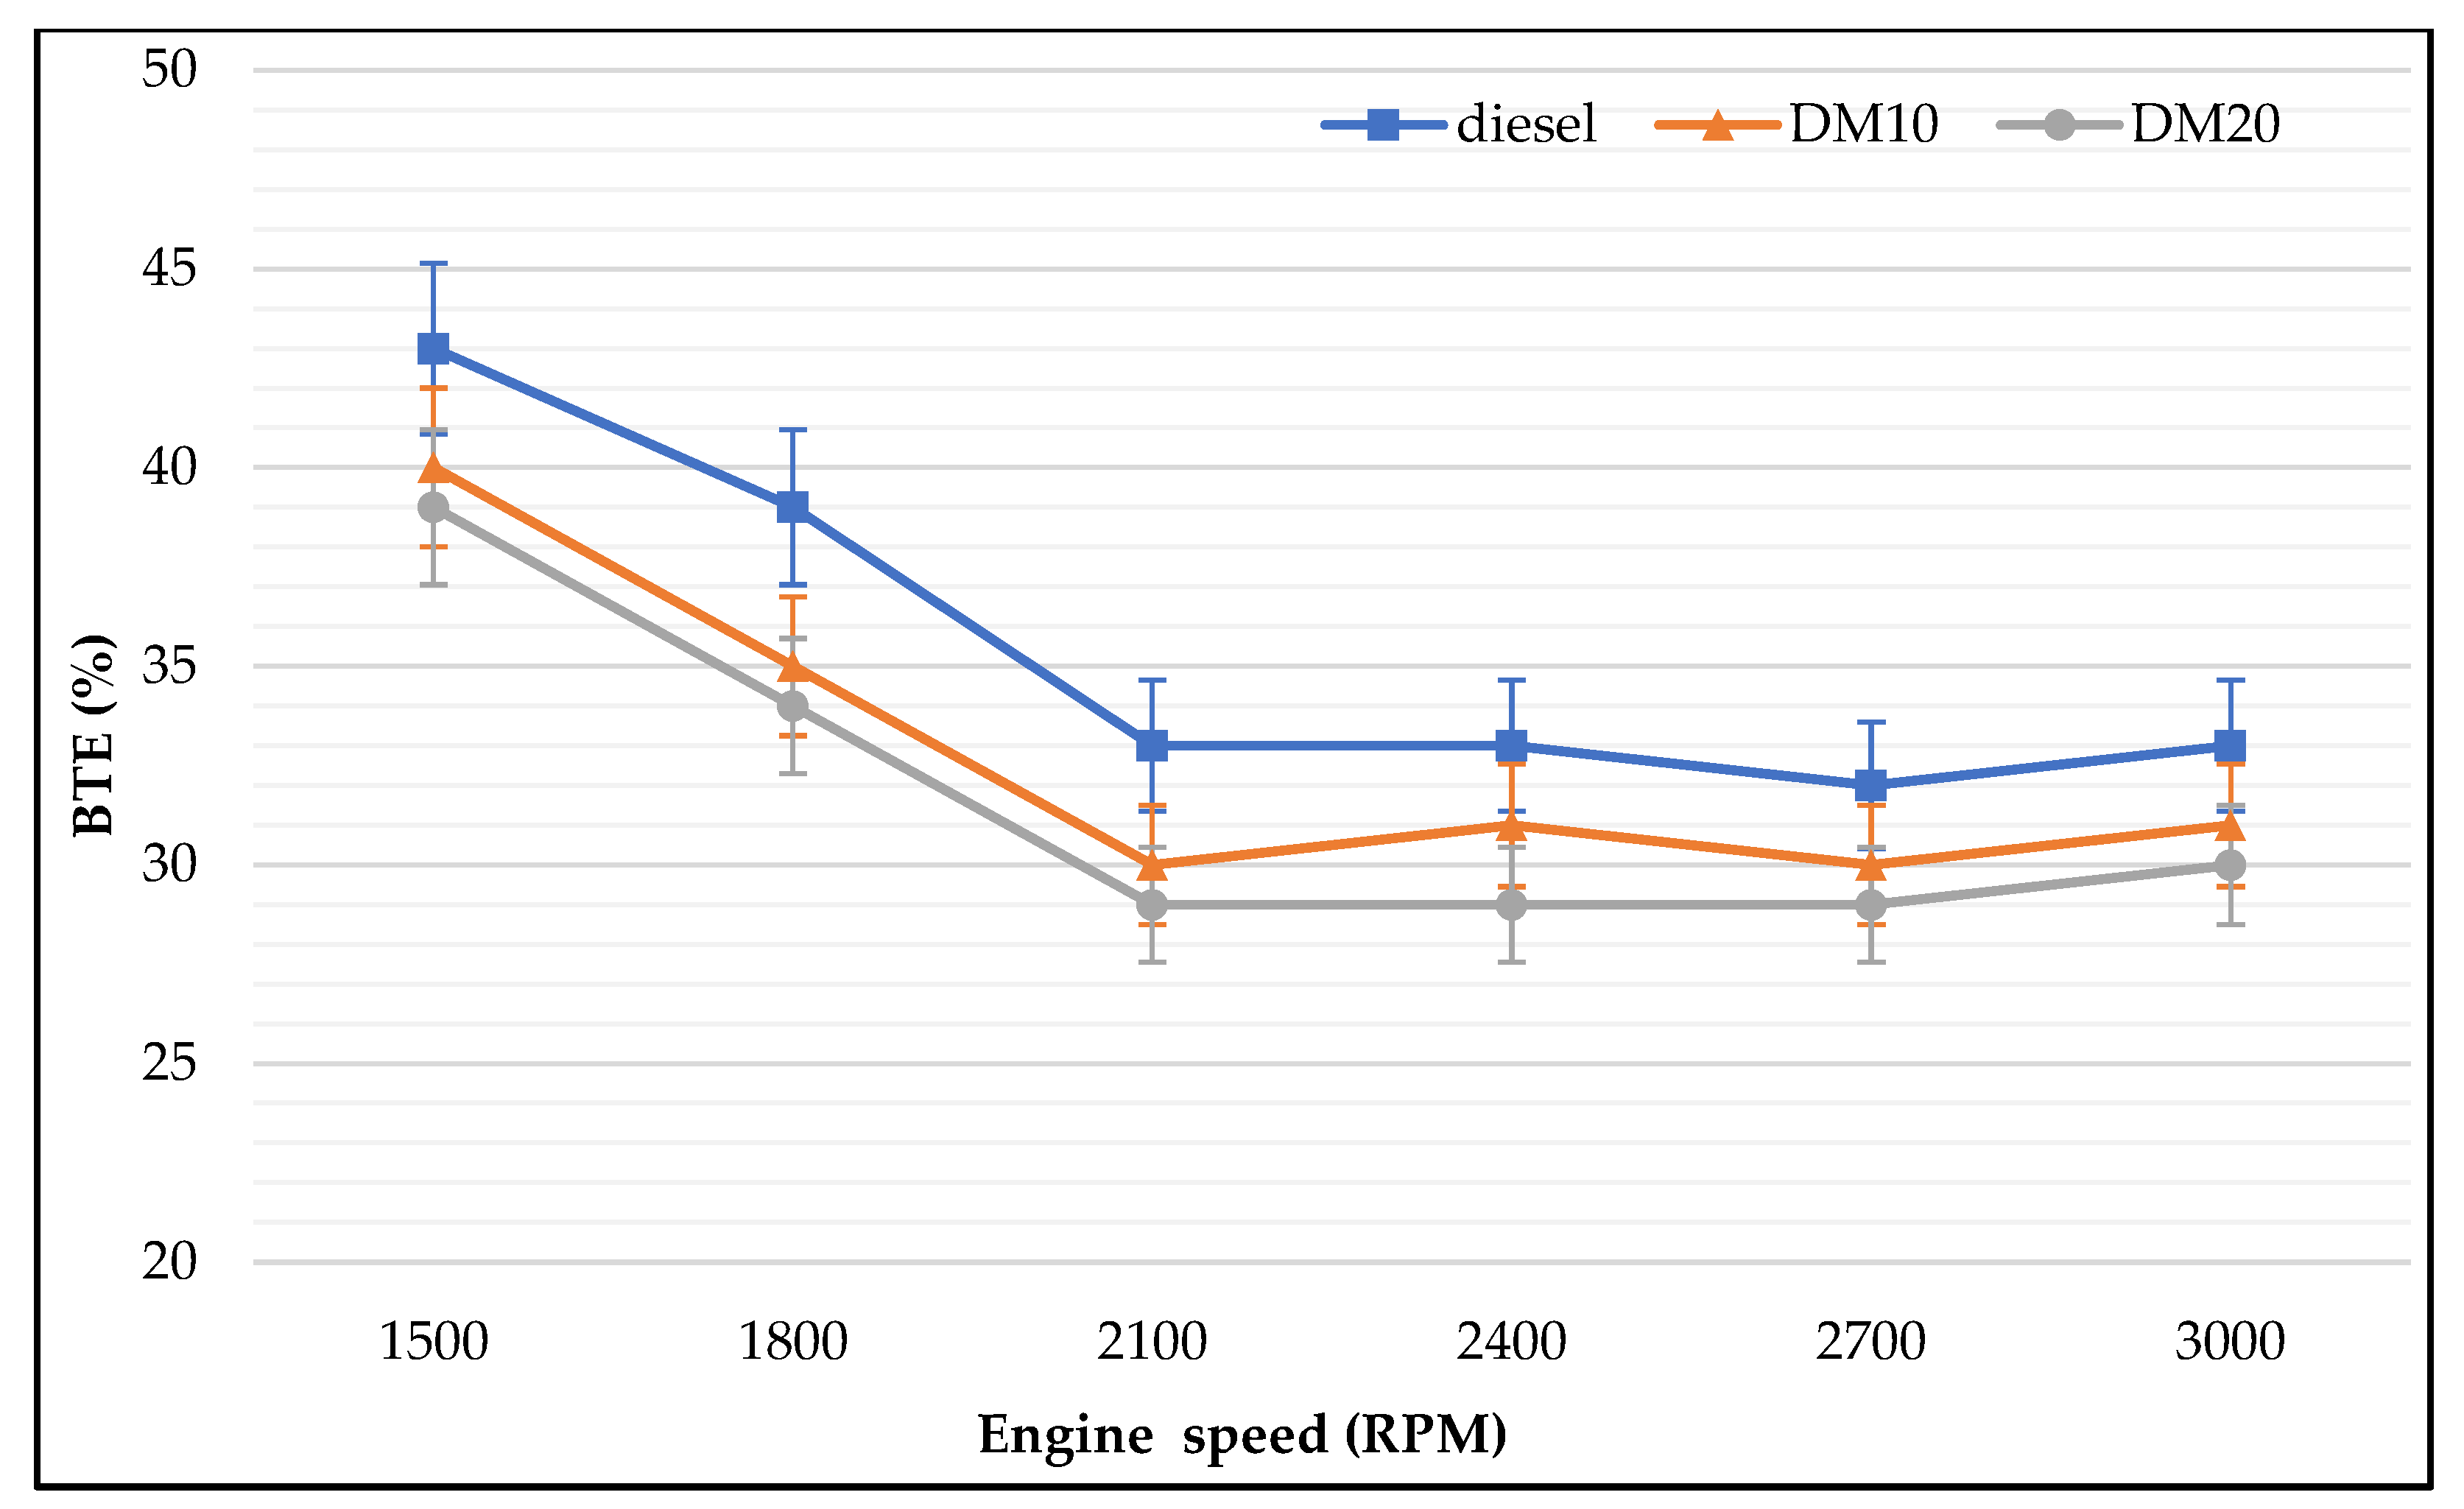
Brake thermal efficiency of the used fuels are presented in Figure 10. The registered values of BTE of all tested fuel showed an increase near the richest conditions (lower speed) and then decreases with increasing engine speeds. BTE presented an average value of the unblended fuel being a little higher than those of blended fuels with increments about 11%. Bearing in mind, BTE values for blended fuels were not far from each other. It is very clear that engine efficiency and BSFC are inversely related and that these values are directly related to the heating value of the used fuels. The reduction in brake thermal efficiency may be related to a greater reduction in cylinder temperature. Increasing premixed methanol leads to a strong reduction in cylinder temperature, which is attributed to the absorption of latent heat from the compressed air, which led to a reduction in crank shaft work. This is due to two factors: (i) fast burning velocity of methanol, and (ii) a huge amount of homogeneity of methanol/air mixture. This attitude will lead to fuel burning through the premixed combustion phase, and it also strongly shortens the combustion period of time [41,42].

3.2.3. Engine Torque

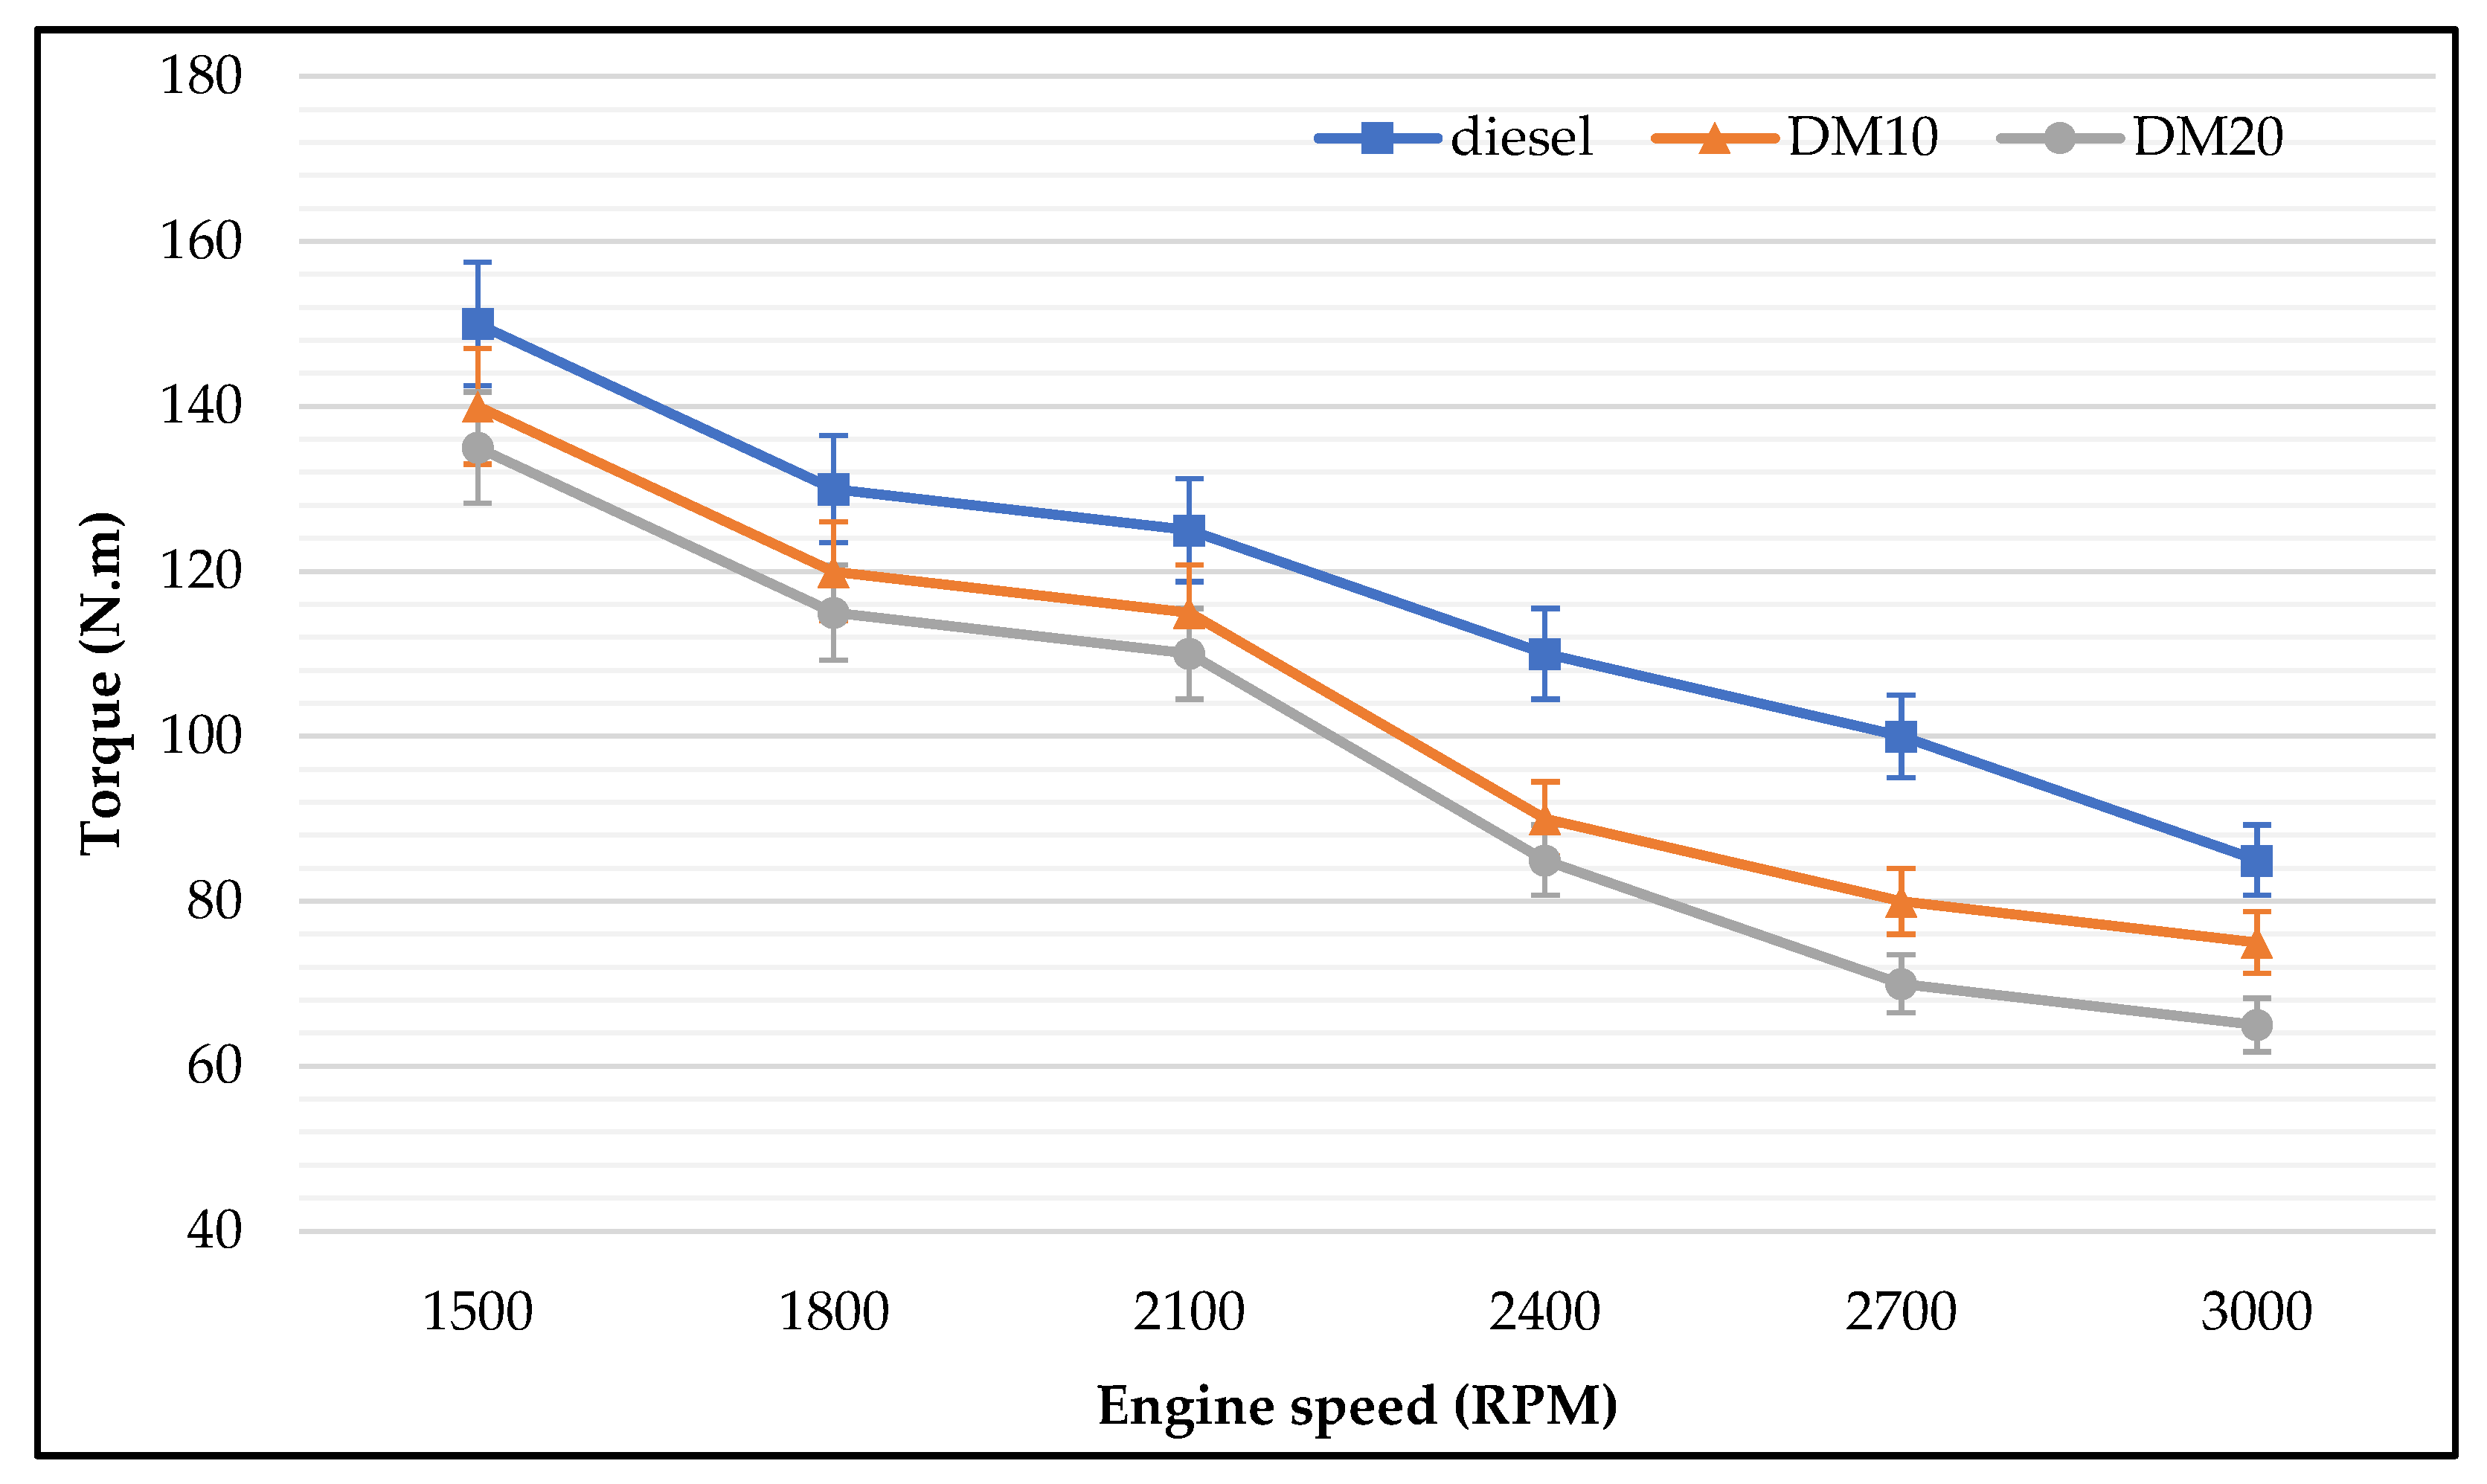
As seen in Figure 11, engine operation under different engine speeds showed that increasing engine speeds led to a decrease of engine load; as expected, the highest torque achieved was 150 N·m at an engine speed of 1500 rpm. By increasing engine speeds to 3000 rpm, torque registered the lowest value which was 85 N·m. On the other hand, by changing to blended fuel, 10% and 20%, torque dropped to lower values in all different engine speeds; this phenomenon is dominated by LHV of diesel blended methanol.

3.2.4. Engine Brake Power

Engine speeds strongly influence the engine BP, Figure 12. When using blended fuel, brake power increased by running the engine with higher speeds.
The highest output of engine BP was achieved when the engine was running on diesel only at an engine speed of 2400 rpm. The maximum BP of 30 kW was achieved by using pure diesel at engine speeds. On the other hand, the lowest BP of 15 kW was achieved for 20% blended fuel at 3000 rpm engine speed. Most blended fuels showed a lower engine brake power among different engine speeds. In general, an obvious preoperational relation between engine speeds and brake power, except beyond 2400 rpm, shows engine power started to deteriorate. The small value of brake power for blended is attributed to the lower calorific value of methanol/diesel blends compared to pure diesel.

4. Conclusions

In the present work a comprehensive view was presented to improve the characteristics of CI engines using a diesel blend of methanol in different percentages, and a clear picture of engine tail pipe emissions was drawn.
Key findings of the presented work:
  • Engine–exhaust emissions: Hydrocarbon, carbon monoxide, and nitrogen oxide emissions were strongly influenced by engine speeds and diesel methanol blends. HC and CO emissions had a similar trend at different engine speeds and were slightly higher at lower engine speeds, while with pure diesel, NOx concentrations presented with higher levels at all engine speeds; with diesel blended methanol at lower speeds NOx showed lower concentrations. Using diesel blended methanol fuel had a remarkable result regarding exhaust emissions; HC, CO, and NOx were heavily reduced.
  • Engine–UN regulated HC: Engine loads has a strong influence on saturated aldehyde (e.g., formaldehyde, acetaldehyde); a considerable amount of exhaust gas emissions was presented at lower loads, which agrees with previous work when it was found that the highest hydrocarbon engine-out emissions were produced for HCCI engine at low engine load operations [43] while unsaturated aldehydes were less sensitive to higher loads. In combustion fuel modes and engine operating parameters, carbonyl chemical species were strongly influenced (i.e., pure diesel or diesel methanol blends); saturated species such as acetaldehyde, formaldehyde, and croton aldehyde were mainly found with higher concentrations in the exhaust of both engine fuel modes. Carbonyl’s highest concentrations were found in higher loads, and acrolein concentration was higher in higher load and exceeded formaldehyde concentrations. During engine operations at a low engine load, the highest amount of hydrocarbon emissions was produced.
  • Engine performance: Diesel methanol blends (30% and 40% methanol) showed less improvement in engine brake power than lower portions of methanol blended. Results showed that BTE was dominated by engine speed. There was no difference in BTE for different proportions of methanol, which increased when engine speeds increased. Moreover, BTE increments were different among tested fuels. Methanol blends improved engine tailpipe emissions rather than improving engine performance and reducing engine emissions, according to the study results. At low engine speeds, pure diesel produced the highest BTE followed by 10% and 20% methanol blends. As noticed in the presented results, BSFC was dominated by the methanol concentration with different engine speeds.

Author Contributions

Conceptualization, A.O.H. and M.R.G.; methodology, H.A.-R.; validation, A.O.H., M.R.G., A.A.-j. and M.S.; formal analysis, H.A.-R.; investigation, A.A.-j.; resources, M.R.G. and M.S.; data curation, A.O.H.; writing—original draft preparation, A.O.H. and M.R.G.; writing—review and editing, H.A.-R. and A.A.-j.; visualization, H.A.-R. and M.S; supervision, A.O.H.; project administration, M.R.G.; funding acquisition, H.A.-R. All authors have read and agreed to the published version of the manuscript.

Funding

This research received no external funding.

Data Availability Statement

Not applicable.

Conflicts of Interest

The authors declare no conflict of interest.

Nomenclature

BPbrake power
BSFCbrake specific fuel consumption
BTEbrake thermal efficiency
BTEXbenzene, toluene, ethyl benzene, xylene
CIcompression ignition
COcarbon monoxide
DM10diesel blended with 10% methanol
DM20diesel blended with 20% methanol
DNPH2,4-dinitrophenyl hydrazine
EGRexhaust gas recirculation
EPYenvironmental protection agency
HPLChigh performance liquid chromatography
IARCinternational agency for research on cancer
NOxnitrogen oxide
OHhydroxyl radical
O2oxygen
PMparticulate matter
RPMrevolution per minute
SOAsecondary organic aerosol
STPstandard temperature pressure
THCtotal hydrocarbon
UVultraviolet
UV/VISultraviolet/visible spectroscopy
UN HCunburned hydro carbon
VOCvolatile organic compound

References

  1. Hasan, A.O.; Osman, A.I.; Al-Muhtaseb, A.H.; Al-Rawashdeh, H.; Abu-jrai, A.; Ahmad, R.; Gomaa, M.R.; Deka, T.J.; Rooney, D.W. An Experimental Study of Engine Characteristics and Tailpipe Emissions from Modern DI Diesel Engine Fuelled with Methanol/Diesel Blends. Fuel Process. Technol. 2021, 220, 106901. [Google Scholar] [CrossRef]
  2. Mustafa, R.J.; Al-Rawashdeh, H.A.; Hasan, A.O.; Gomaa, M.R. Enhancement of a Hydrogen Engine Cavitation Utilizing Mixed Fuel: A Review and Experimental Case Study. Int. Rev. Mech. Eng. 2020, 14, 33–42. [Google Scholar] [CrossRef]
  3. Alahmer, A.; Rezk, H.; Aladayleh, W.; Mostafa, A.O.; Abu-Zaid, M.; Alahmer, H.; Gomaa, M.R.; Alhussan, A.A.; Ghoniem, R.M. Modeling and Optimization of a Compression Ignition Engine Fueled with Biodiesel Blends for Performance Improvement. Mathematics 2022, 10, 420. [Google Scholar] [CrossRef]
  4. Hasan, A.O.; Al-Rawashdeh, H.; Abu-jrai, A.; Gomaa, M.R.; Jamil, F. Impact of variable compression ratios on engine performance and unregulated HC emitted from a research single cylinder engine fueled with commercial gasoline. Int. J. Hydrogen Energy 2022, in press. [Google Scholar] [CrossRef]
  5. Mohamed, R.G.; Talib, K.M.; Abu-Jrai, A.; Hegazy Rezk, M.; Altarawneh, A.; Marashli, A. Experimental Investigation on Waste Heat Recovery from a Cement Factory to Enhance Thermoelectric Generation. Sustainability 2022, 14, 10146. [Google Scholar] [CrossRef]
  6. Hasan, A.O.; Essa, K.; Gomaa, M.R. Synthesis, structure characterization and study of a new kind of catalyst: A monolith of nickel made by additive manufacturing coated with platinum. Energies 2022, 15, 7575. [Google Scholar] [CrossRef]
  7. Karavalakis, G.; Poulopoulos, S.; Zervas, E. Impact of Diesel Fuels on the Emissions of Non-Regulated Pollutants. Fuel 2012, 102, 85–91. [Google Scholar] [CrossRef]
  8. Rantanen, L.; Mikkonen, S.; Nylund, L.; Kociba, P.; Lappi, M.; Nylund, N.O. Effect of Fuel on the Regulated, Unregulated and Mutagenic Emissions of Di Diesel Engines. In Proceedings of the 1993 SAE International Fuels and Lubricants Meeting and Exposition, Pennsylvania, PA, USA, 18–21 October 1993; SAE International: Warrendale, PA, USA, 1993. [Google Scholar]
  9. Ge, J.C.; Kim, H.Y.; Yoon, S.K.; Choi, N.J. Reducing Volatile Organic Compound Emissions from Diesel Engines Using Canola Oil Biodiesel Fuel and Blends. Fuel 2018, 218, 266–274. [Google Scholar] [CrossRef]
  10. Hu, N.; Tan, J.; Wang, X.; Zhang, X.; Yu, P. Volatile Organic Compound Emissions from an Engine Fueled with an Ethanol-Biodiesel-Diesel Blend. J. Energy Inst. 2017, 90, 101–109. [Google Scholar] [CrossRef]
  11. Tian, J.; Tan, J.; Hu, N.; Liu, T.; Wang, Y.; Zhong, H.; Cheng, J.; Zhang, X. Characteristics Analysis for Total Volatile Organic Compounds Emissions of Methanol-Diesel Fuel. J. Energy Inst. 2018, 91, 527–533. [Google Scholar] [CrossRef]
  12. Harrenstien, M.S.; Rhee, K.T.; Adt, R.R. Determination of Individual Aldehyde Concentrations in the Exhaust of a Spark Ignited Engine Fueled by Alcohol/Gasoline Blends; SAE Technical Papers; SAE International: Warrendale, PA, USA, 1979. [Google Scholar]
  13. IARC. WHO IARC Monographs on the Evaluation of Carcinogenic Risks to Humans Volume 88 Formaldehyde, 2-Butoxyethanol and 1-Tert-Butoxypropan-2-Ol; IARC: Lyon, France, 2006; p. 88. [Google Scholar]
  14. Harrenstien, M.S.; Rhee, K.T.; Adt, R.R., Jr. Carcinogenicity of Formaldehyde in Rats and Mice after Long-Term Inhalation Exposure1 | Cancer Research | American Association for Cancer Research. Available online: https://aacrjournals.org/cancerres/article/43/9/4382/488333/Carcinogenicity-of-Formaldehyde-in-Rats-and-Mice (accessed on 14 May 2022).
  15. Kataoka, H.; Kondo, T.; Sumida, A. Gas Chromatographic Determination of Aldehydes in Combustion Smoke Samples. Anal. Chim. Acta 1998, 358, 269–275. [Google Scholar] [CrossRef]
  16. Mohamed, A.A.; Mubarak, A.T.; Marestani, Z.M.H.; Fawy, K.F. Highly Sensitive and Selective Catalytic Determination of Formaldehyde and Acetaldehyde. Talanta 2008, 74, 578–585. [Google Scholar] [CrossRef]
  17. Duan, J.; Tan, J.; Yang, L.; Wu, S.; Hao, J. Concentration, Sources and Ozone Formation Potential of Volatile Organic Compounds (VOCs) during Ozone Episode in Beijing. Atmos. Res. 2008, 88, 25–35. [Google Scholar] [CrossRef]
  18. Avigad, G. A Simple Spectrophotometric Determination of Formaldehyde and Other Aldehydes: Application to Periodate-Oxidized Glycol Systems. Anal. Biochem. 1983, 134, 499–504. [Google Scholar] [CrossRef]
  19. Ghadikolaei, M.A. Effect of Alcohol Blend and Fumigation on Regulated and Unregulated Emissions of IC Engines-A Review. Renew. Sustain. Energy Rev. 2016, 57, 1440–1495. [Google Scholar] [CrossRef]
  20. Anand, K.; Reitz, R.D. Exploring the Benefits of Multiple Injections in Low Temperature Combustion Using a Diesel Surrogate Model. Fuel 2016, 165, 341–350. [Google Scholar] [CrossRef]
  21. Aalam, C.S.; Saravanan, C.G.; Anand, B.P. Impact of High Fuel Injection Pressure on the Characteristics of CRDI Diesel Engine Powered by Mahua Methyl Ester Blend. Appl. Therm. Eng. 2016, 106, 702–711. [Google Scholar] [CrossRef]
  22. Sharma, P.; Sahoo, B.B. Precise prediction of performance and emission of a waste derived Biogas–Biodiesel powered Dual–Fuel engine using modern ensemble Boosted regression Tree: A critique to Artificial neural network. Fuel 2022, 321, 124131. [Google Scholar] [CrossRef]
  23. Sharma, P.; Sahoo, B.B. An ANFIS-RSM based modeling and multi-objective optimization of syngas powered dual-fuel engine. Int. J. Hydrogen Energy 2022, 47, 19298–19318. [Google Scholar] [CrossRef]
  24. US Environmental Protection Agency. A Comprehensive Analysis of Biodiesel Impacts on Exhaust Emissions; Draft Technical Report EPA 420-P-02-001; US Environmental Protection Agency: Washington, DC, USA, 2002. [Google Scholar]
  25. Lowi, A.; Carter, W.P.L. A Method for Evaluating the Atmospheric Ozone Impact of Actual Vehicle Emissions. SAE Trans. 1990, 99, 303–311. [Google Scholar]
  26. Al-Rawashdeh, H.; Hasan, A.O.; Al-Shakhanbeh, H.A.; Al-Dhaifallah, M.; Gomaa, M.R.; Rezk, H. Investigation of the Effect of Solar Ventilation on the Cabin Temperature of Vehicles Parked under the Sun. Sustainability 2021, 13, 13963. [Google Scholar] [CrossRef]
  27. Gomaa, M.R.; Al-Dmour, N.; Shalby, M. Theoretical model of a fluidized bed solar reactor design with the aid of MCRT method and synthesis gas production. Renew. Energy 2020, 148, 91–102. [Google Scholar] [CrossRef]
  28. Gomaa, M.R.; Mustafa, R.J.; Al-Dmour, N. Solar Thermochemical Conversion of Carbonaceous Materials into Syngas by Co-Gasification. J. Clean. Prod. 2020, 248, 119185. [Google Scholar] [CrossRef]
  29. Imdadul, H.K.; Masjuki, H.H.; Kalam, M.A.; Zulkifli, N.W.M.; Alabdulkarem, A.; Rashed, M.M.; Ashraful, A.M. Influences of Ignition Improver Additive on Ternary (Diesel-Biodiesel-Higher Alcohol) Blends Thermal Stability and Diesel Engine Performance. Energy Convers. Manag. 2016, 123, 252–264. [Google Scholar] [CrossRef]
  30. Imdadul, H.K.; Masjuki, H.H.; Kalam, M.A.; Zulkifli, N.W.M.; Alabdulkarem, A.; Kamruzzaman, M.; Rashed, M.M. A Comparative Study of C4 and C5 Alcohol Treated Diesel-Biodiesel Blends in Terms of Diesel Engine Performance and Exhaust Emission. Fuel 2016, 179, 281–288. [Google Scholar] [CrossRef]
  31. Noorollahi, Y.; Azadbakht, M.; Ghobadian, B. The Effect of Different Diesterol (Diesel–Biodiesel–Ethanol) Blends on Small Air-Cooled Diesel Engine Performance and Its Exhaust Gases. Energy 2018, 142, 196–200. [Google Scholar] [CrossRef]
  32. Singh, M.; Sandhu, S.S. Performance, Emission and Combustion Characteristics of Multi-Cylinder CRDI Engine Fueled with Argemone Biodiesel/Diesel Blends. Fuel 2020, 265, 117024. [Google Scholar] [CrossRef]
  33. Hulwan, D.B.; Joshi, S.V. Performance, Emission and Combustion Characteristic of a Multicylinder DI Diesel Engine Running on Diesel-Ethanol-Biodiesel Blends of High Ethanol Content. Appl. Energy 2011, 88, 5042–5055. [Google Scholar] [CrossRef]
  34. He, B.Q.; Shuai, S.J.; Wang, J.X.; He, H. The Effect of Ethanol Blended Diesel Fuels on Emissions from a Diesel Engine. Atmos. Environ. 2003, 37, 4965–4971. [Google Scholar] [CrossRef]
  35. Brady, J.M.; Crisp, T.A.; Collier, S.; Kuwayama, T.; Forestieri, S.D.; Perraud, V.; Zhang, Q.; Kleeman, M.J.; Cappa, C.D.; Bertram, T.H. Real-Time Emission Factor Measurements of Isocyanic Acid from Light Duty Gasoline Vehicles. Environ. Sci. Technol. 2014, 48, 11405–11412. [Google Scholar] [CrossRef]
  36. Kar, K.; Cheng, W.K. Speciated Engine-out Organic Gas Emissions from a PFI-SI Engine Operating on Ethanol/Gasoline Mixtures. SAE Int. J. Fuels Lubr. 2010, 2, 91–101. [Google Scholar] [CrossRef]
  37. Donkerbroek, A.J.; van Vliet, A.P.; Somers, L.M.T.; Dam, N.J.; ter Meulen, J.J. Relation between Hydroxyl and Formaldehyde in a Direct-Injection Heavy-Duty Diesel Engine. Combust. Flame 2011, 158, 564–572. [Google Scholar] [CrossRef]
  38. Zervas, E.; Montagne, X.; Lahaye, J. Emission of Alcohols and Carbonyl Compounds from a Spark Ignition Engine. Influence of Fuel and Air/Fuel Equivalence Ratio. Environ. Sci. Technol. 2002, 36, 2414–2421. [Google Scholar] [CrossRef]
  39. Cheng, C.H.; Cheung, C.S.; Chan, T.L.; Lee, S.C.; Yao, C.D.; Tsang, K.S. Comparison of Emissions of a Direct Injection Diesel Engine Operating on Biodiesel with Emulsified and Fumigated Methanol. Fuel 2008, 87, 1870–1879. [Google Scholar] [CrossRef]
  40. Magnusson, R.; Nilsson, C.; Andersson, B. Emissions of Aldehydes and Ketones from a Two-Stroke Engine Using Ethanol and Ethanol-Blended Gasoline as Fuel. Environ. Sci. Technol. 2002, 36, 1656–1664. [Google Scholar] [CrossRef]
  41. Lee, S.; Lee, C.S.; Park, S.; Gupta, J.G.; Maurya, R.K.; Agarwal, A.K. Spray Characteristics, Engine Performance and Emissions Analysis for Karanja Biodiesel and Its Blends. Energy 2017, 119, 138–151. [Google Scholar] [CrossRef]
  42. Hasan, A.O.; Leung, P.; Tsolakis, A.; Golunski, S.E.; Xu, H.M.; Wyszynski, M.L.; Richardson, S. Effect of Composite Aftertreatment Catalyst on Alkane, Alkene and Monocyclic Aromatic Emissions from an HCCI/SI Gasoline Engine. Fuel 2011, 90, 1457–1464. [Google Scholar] [CrossRef]
  43. Hasan, A.O.; Abu-jrai, A. Control of harmful hydrocarbon species in the exhaust of modern advanced GDI engines. Atmos. Environ. 2016, 129, 210–217. [Google Scholar] [CrossRef]
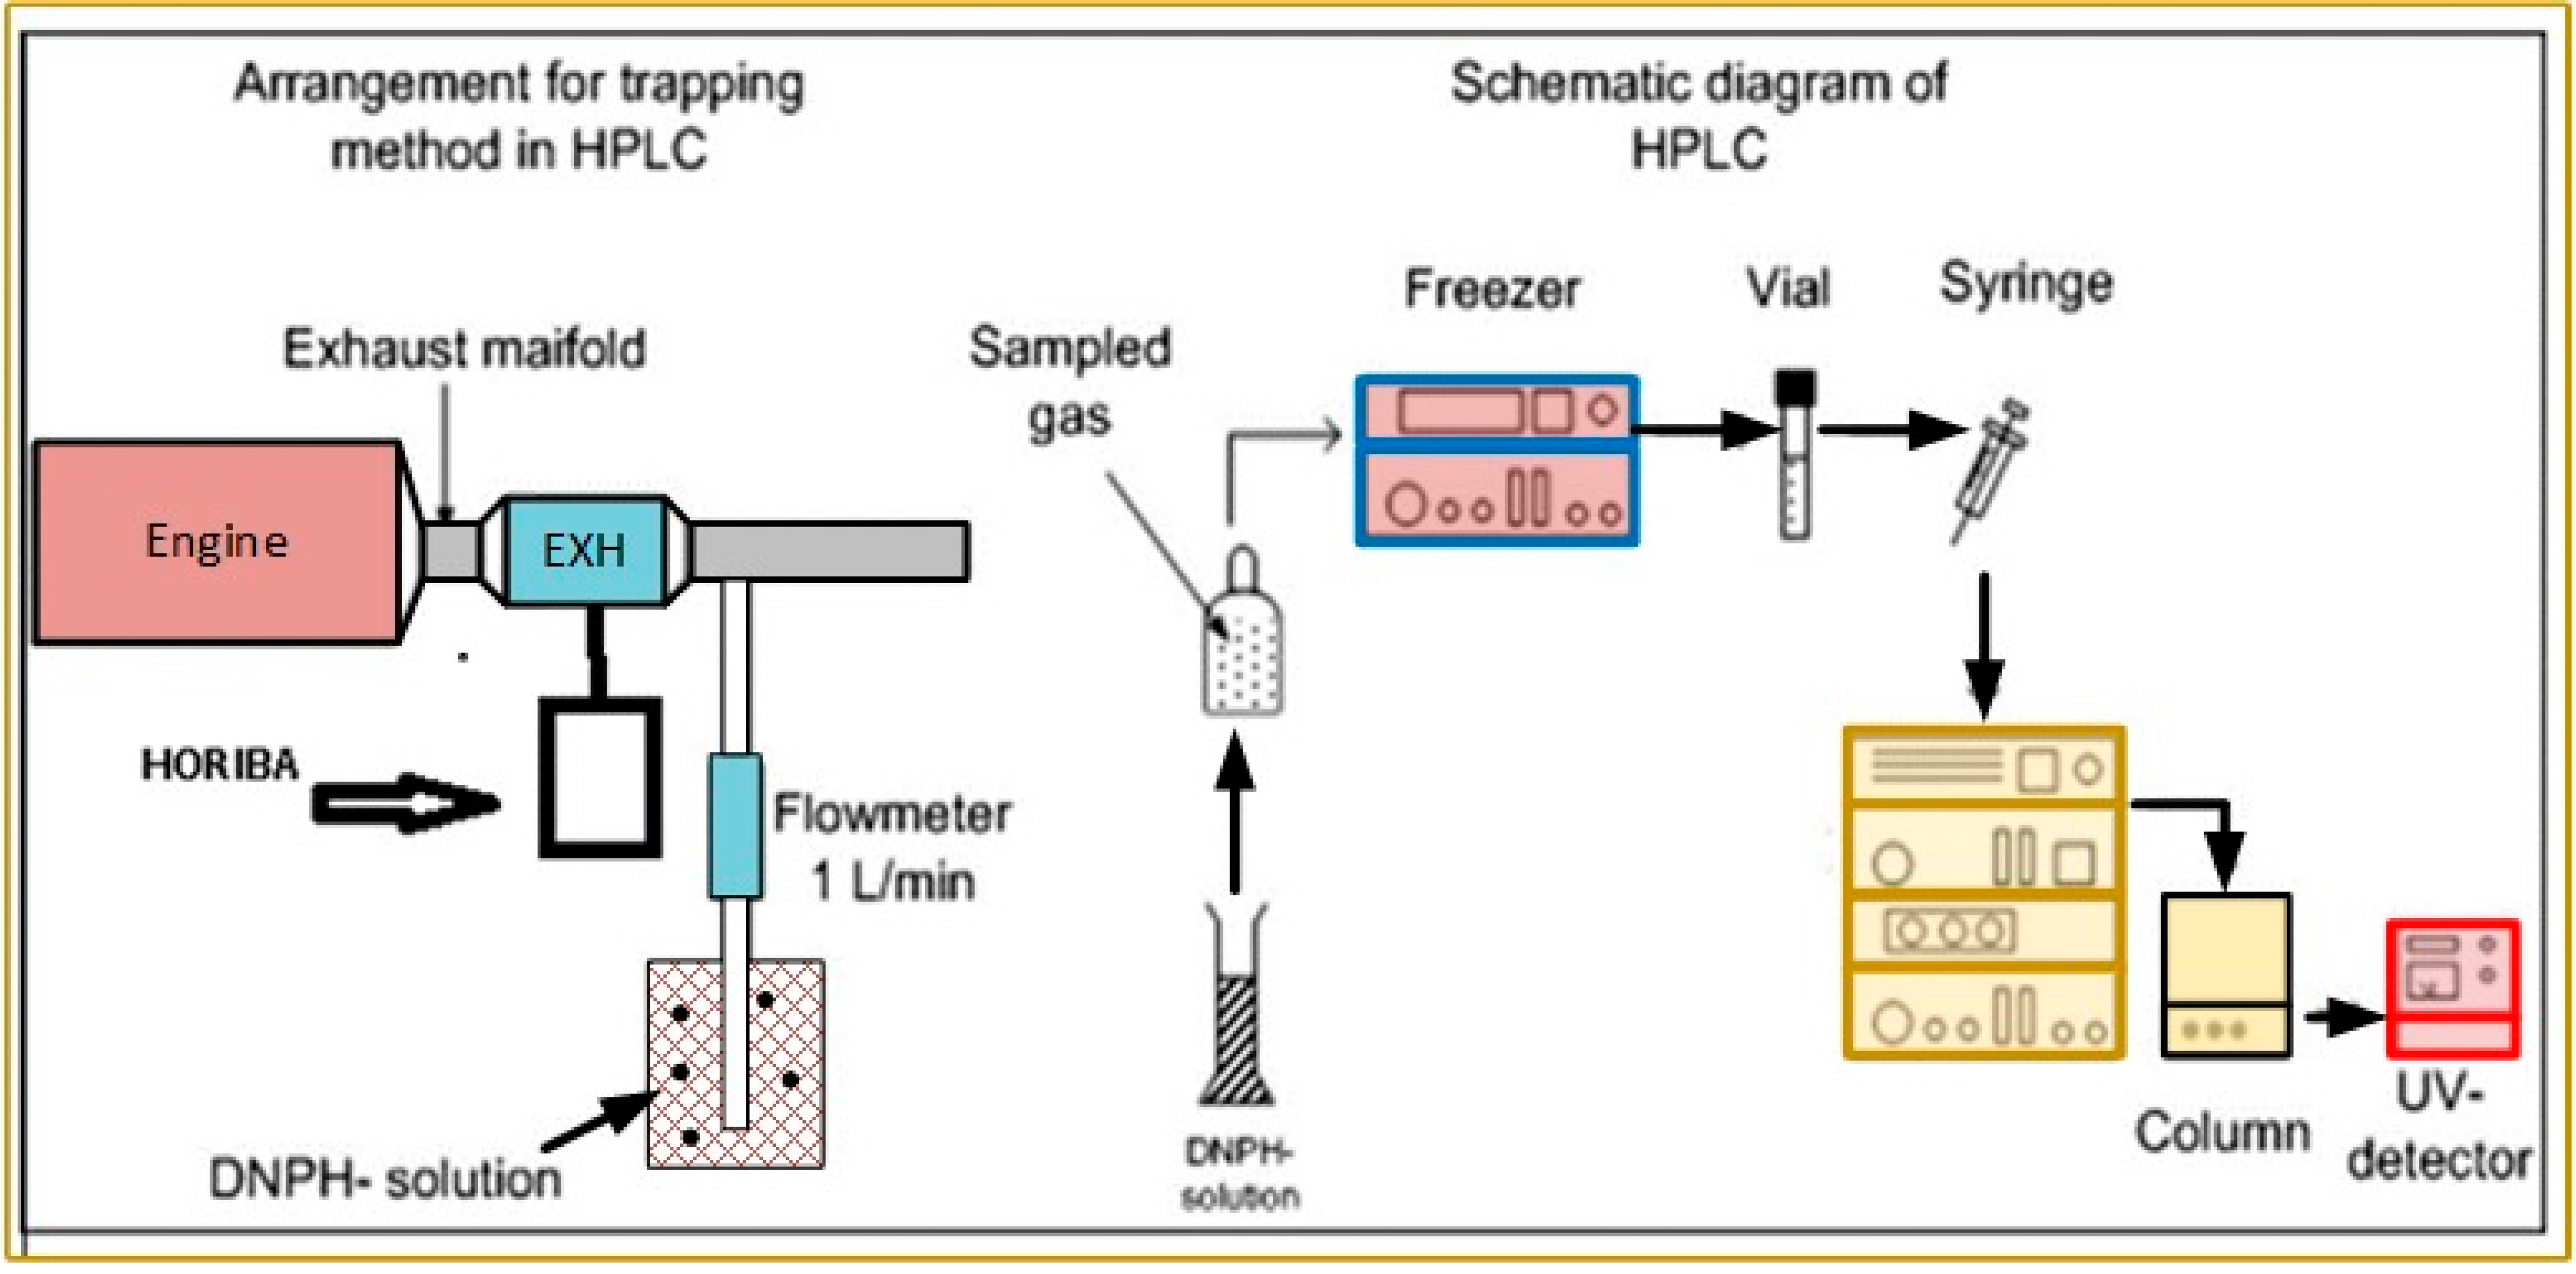
Figure 1. Experimental setup diagram.
Energies 15 07933 g001
Figure 2. NOx emissions at different engine speeds.
Energies 15 07933 g002
Figure 3. HC emissions at different engine speeds.
Energies 15 07933 g003
Figure 4. CO emissions at different engine speeds.
Energies 15 07933 g004
Figure 5. Emissions concentration with carbonyl compounds speciation (2 bar NMEP).
Energies 15 07933 g005
Figure 6. Emissions concentration with carbonyl compounds speciation (4 bar NMEP).
Energies 15 07933 g006
Figure 7. Emissions concentration with carbonyl compounds speciation (6 bar NMEP).
Energies 15 07933 g007
Figure 8. Emissions concentration with carbonyl compounds speciation (8 bar NMEP).
Energies 15 07933 g008
Figure 9. Brake Specific fuel consumption (BSFC) at different engine speeds.
Energies 15 07933 g009
Figure 10. Brake thermal efficiency at different engine speeds.
Energies 15 07933 g010
Figure 11. Engine torque, at different engine speeds.
Energies 15 07933 g011
Figure 12. Engine power at different engine speeds.
Energies 15 07933 g012
Table 1. Specifications of the engine.
Engine modelCI direct injection turbocharged diesel engine, four cylinders, four-stroke
Compression ratio18:1
Torque350 Nm
Power80 kW at 2600 rpm
Displacement (Lit)3.8
Engine speed1900 rpm
FuelCommercial diesel, diesel blends
Table 2. Specifications of diesel fuels.
PropertyMethodDiesel
Pour pointD 980 °C
Flash point, closed cupD 9569 °C
Kinematical viscosityD 5553.03 mm2/s
Sulphated ashD 899-
Total SulphurD 56630.05 wt%
Copper strip corrosionD 1251 a
Cloud pointD 26001.5 °C
ASTM1-D (S15)-
Table 3. Uncertainty measurements.
S.NParameter NameInstrument Uncertainty
1NMEP (bar)±0.01
2Temperature±1 °C
3Speed (rpm)±10
4CO (ppm))±0.01
5HC (ppm)±0.01
6NOx (ppm)±0.01
7Aldehydes±0.01
8Brake Power (kW)±0.1
9Torque (N·m)±0.1
10BSFC (g/kWh)±0.1
Table 4. Parameters of high-performance liquid chromatography instrument.
ModelAcclaim 120 by Dionex
Instrument ColumnThis is a C18 film with a diameter of 250 mm by 4.6 mm ID; a film length of 5 lumens
DetectorThe UVD is 170 s and the wavelength is 365 nanometers
PumpLow pressure quaternary P 580
Flow rateThe eluent flow rate is one ml per minute
Table 5. Chemical standards reference retention time. (In acetonitrile, 15 components, each 1mL/ampule, from aldehyde to ketone to DNPH To-11A Calibration Mix).
Peak No.CompoundRetention Time (min)
1Formaldehyde HCHO32.65
2Acetaldehyde CH3CHO42.88
3Acrolein CH3CH@CHCHO53.42
4Acetone CH3COCH354.63
5Propionaldehyde CH3CH2CHO58.34
6Crotonaldehyde CH3CH@CHCHO69.14
7Butyraldehyde CH3(CH2)2CHO70.05
8Benzaldehyde C6H5CHO80.38
9Isovaleraldehyde (CH3)2CH(CH92)CHO83.80
10PentanalCH3(CH2)3CHO85.57
11o-Tolualdehyde CH3(CH6H4)CHO88.7
12m-Tolualdehyde CH3(C6H4)CHO89.58
13p-Tolualdehyde CH3(C6H4)CHO90.13
14Hexanal CH3(CH2)4CHO94.98
152,5-Dimethylben (CH3)2(C6H4)CHO96.91
Publisher’s Note: MDPI stays neutral with regard to jurisdictional claims in published maps and institutional affiliations.