Article

Local Evolution Model of the Communication Network for Reducing Outage Risk of Power Cyber-Physical System

School of Electrical and Information Engineering, Changsha University of Science & Technology, Changsha 410205, China
*
Author to whom correspondence should be addressed.
Energies 2022, 15(21), 7876; https://doi.org/10.3390/en15217876
Submission received: 18 September 2022 / Revised: 10 October 2022 / Accepted: 12 October 2022 / Published: 24 October 2022
(This article belongs to the Special Issue Advances in Stability Analysis and Control of Power Systems)

Abstract

:
The deep integration of power grids and communication networks is the basis for realizing the complete observability and controllability of power grids. The communication node or link is always built according to the physical nodes. This step is alternatively known as “designing with the same power tower”. However, the communication networks do not form a “one-to-one correspondence” relationship with the power physical network. The existing theory cannot be applied to guide the practical power grid planning. In this paper, a local evolution model of a communication network based on the physical power grid topology is proposed in terms of reconnection probabilities. Firstly, the construction and upgrading of information nodes and links are modeled by the reconnection probabilities. Then, the power flow entropy is employed to identify whether the power cyber-physical system (CPS) is at the self-organized state, indicating the high probability of cascading failures. In addition, on the basis of the cascading failure propagation model of the partially dependent power CPS, operation reliabilities of the power CPS are compared with different reconnection probabilities using the cumulative probability of load loss as the reliable index. In the end, a practical provincial power grid is analyzed as an example. It is shown that the ability of the power CPS to resist cascading failures can be improved by the local growth evolution model of the communication networks. The ability is greater when the probability of reconnection is p = 0.06. By updating or constructing new links, the change in power flow entropy can be effectively reduced.

1. Introduction

In the modern smart grid, the deep interactions between power grids and communication networks are emerging. Their couplings bring new challenges to the safety and reliability of the power system. Power grids become more intelligent with the extensive operation of the information system, realizing more complete functions. However, the interdependency between power system and communication network results in some hidden risks [1]. For example, in 2015, hackers attacked the Ukraine power grid and embedded malicious software, which led to power failure [2]. Another remarkable accident occurred in Venezuela. From the 7th to 9th March 2019, the local power system of 18 states in Venezuela were subjected to two continuous network attacks, resulting in the collapse of power systems directly [3]. These examples demonstrate that even though the power grid can operate normally, the damage to communication networks has grievous effects on entire power grids. Since the traditional modeling of cascading failures in the power grid does not consider the influence of the communication network, the reliability and accuracy of the power grid model cannot be guaranteed. Evaluating communication networks should become an essential part of the power CPS evaluation.
In power CPS, the blackout is always in the form of cascading failures, and multiple regions are affected. Basically, the large-scale transfer of power flow is still the intrinsic reason for cascading failures in power grids [4]. Thus, the interaction between the power and information networks should be considered in cascading failure modeling. In 2010, a model for cascading failure in the interdependent network was put forward first in [5]. Based on this model, the static and dynamic analysis methods are proposed for the cascading failure spreading theory in interdependent networks. By extracting the network topological eigenvector, the static analytical method in [6] calculates the topological feature parameters and presents the structure characteristic index set. The topological characteristic parameters of the two-layer coupling network are generated to describe the effect of the interdependent relation to cascading failures. The dynamic analytical method analyzes the spreading process of cascading failures based on the static topological model. The dynamic approach suggested in [7,8] is employed to study the robustness of the interdependent networks to resist cascading failures and assists to establish the real-world networks [9]. In addition, a CPS model for the hierarchical and distributed control system (HDCS) is also examined in [10]. The information flow in the control process of the active distribution network (ADN) is analyzed and the information and physical performance of the ADN control process is integrated successfully.
In particular, the above research on interdependent relations needs to satisfy an important assumption that both the nodes and the line scales of power grids and communication networks are the same [11]. Based on this assumption, the spreading process of cascading failures under the interaction of two networks can be better discussed.
However, research and actual operation cases indicate that the scale of the real communication network is smaller than the power grid. In other words, the scale of the power grid and communication network is not exactly a “one-to-one correspondence” relationship [12] but a kind of partial interdependency [13]. Under this relationship, the observability and controllability of the power grid cannot be realized fully. Therefore, the practical power grid cannot satisfy the communication requirement of the interdependent network. It makes the research stay in the theoretic stage rather than put it into practice. In [14], the future control center is designed. It intends to build and operate perfect communication networks for optimizing the information networks. Unfortunately, this plan needs huge investment and a long time for construction. Thus, most of the current research still focuses on how to avoid the influence originated by the partial interdependency. The real networks have similar characteristics with the small-world network [15,16]. The employment of the small-world network adds numerous nodes and general links, and then, the dimension of the complex networks rises. This means the theoretical probability of cascading failure occurrence is increased and the analyzing accuracy is affected. In addition, the random small-world network generated with the same “degree” has multiple possibilities which introduces uncertainty to the model. In practical engineering, it is discovered that the topology of existing power grids is obviously different from the random small-world networks. The theoretical model of partial interdependent networks cannot explain the communication process of cascading failure propagation under the interaction of the power and communication networks. Consequently, power grid companies cannot construct and improve the existing communication networks with regards to the suggested topological structure. Therefore, regarding the practical engineering project, the partial interdependency in the power CPS should be deeply studied to improve the perception of the power grid and decrease the probability of cascading failures. It has a remarkable practical significance in engineering.
In this paper, a local evolution model of the communication network is proposed to reduce the outage risk of the power cyber-physical system. The actual communication network is considered as the base, and the natural growth law of the small-world networks is selected as the principle for adding a few important nodes and essence links into the communication networks in order to achieve the “one-to-one correspondence” relationship. Then, the observability and controllability of the power grid can be realized. In addition, the power flow entropy is utilized as a sensitivity index to set the smallest number of communication links of the power CPS to prevent the power grid from entering the self-organized critical state. This model can minimize the probability of blackout brought by cascading failures. It has a guiding significance for the construction of the communication networks.
The outline of the paper is organized as follows. Section 2 lays out the method of analyzing partial interdependency of power CPS and the CPS evolving process. The case studies are included for verification in Section 3. Finally, a conclusion is presented in Section 4.

2. Method of Analyzing Partial Interdependency of Power CPS and Evolution of CPS

2.1. Partial Interdependent Characteristics of Power CPS

In power CPS, the interaction between the power grids and communication networks can be summarized as the energy interdependent relationship and the information interdependent relationship. The energy interdependent relationship means that the nodes in the energy interdependent power grid provide the power required for the operation of the nodes in the communication network. The information interdependent relationship means that the nodes in the information interdependent communication network process the monitoring and scheduling of information from the power grid nodes.
Generally, the power nodes provide energy to the information nodes. The information nodes collect measurement information. The dispatching center obtains the operation state information through the situational awareness, and then, gives optimal scheduling instructions to the power grid to realize the closed-loop control, as shown in Figure 1. Abbreviated as physical-information node pairs, physical nodes and information nodes form the interdependent relationship.
In the physical layer, the power plant and the transformer substation in the actual physical grid are abstracted as the topological node, whereas transmission lines are abstracted as power edges amongst nodes. This structure realizes the power flow transmission between generation nodes and load nodes. In the communication network structure, the information flow realizes the bidirectional transmission with the shortest route through information edges. Information nodes are also dispatching centers and communication plants and stations, whereas the information edges are communication links [17]. However, in different developing stages, upgrading or newly building the information nodes and links is limited by resource allocation. The scale of the communication network gradually increases after updating the corresponding power grids. Therefore, there is a scale difference between power grids and communication networks. The difference can be defined as the partial interdependency.

2.2. The Evolution Model of New Node Connections

To realize closed-loop control, communication links locally evolve according to the topology of power grids [18]. As the rule of designing with the same power tower is widely used, the optical fiber should be erected on power towers. Therefore, the local evolutionary model of the power communication network is constructed via the following steps:
  • Number all the nodes in the power communication network. The unbalance of nodes in the existing power and communication network is considered. Some nodes are added to ensure that the number of nodes in the communication network equals that in power grids.
  • Number the new nodes in sequence and connect them with the nearest four nodes to construct the nearest coupling network, as shown in Figure 2a.
  • Select the nodes to be added (Node i) and reconnect them. Node i is disconnected with the first two nodes at first, and then is reconnected with a probability from 0 to 1. Node i is reconnected to other nodes randomly following the rule of no self-loop or no repeat connection, as shown in Figure 3a.
  • Repeat step 3. It is necessary to ensure the chosen nodes are not selected again until all the added nodes have been chosen, as shown in Figure 2b.
  • After reconnection, inspect whether the network is connected. If not, repeat steps 3–4 until the network is connected. The sketch map of disconnection is shown in Figure 3b.
Different power communication networks can be obtained by changing the reconnection probability p. If the reconnection probability p = 0, the communication network is the regular network. If the reconnection probability p = 1, it is the random network [19].

2.3. The Evolution Model of New Links and Reconnections

Research shows that power flow entropy is an important index to identify whether the power system enters the self-organized state. The power flow entropy is shown in Equation (1). If the power flow entropy is larger, the unbalanced distribution of power flow is as well, thus, the power system faces a higher risk of blackout [20].
H = C k = 1 n 1 P k l n P k
where H is the power flow entropy, P(k) is the proportion of the lines of the load rates μi between Uk and Uk+1 to the total lines, U is a constant sequence (U = {0, 0.02, …, 2.0}), and C is ln 10.
According to the process of Figure 3, a communication network which has the same number of nodes as the power grid can be obtained. However, the number of communication links is less than the number of transmission lines. Therefore, to realize the “one to one correspondence”, the communication links should be added.
The corresponding communication links of important transmission lines should be added first. The research points out that, if the system power flow entropy changes greatly after communication links fail, these transmission lines are important lines [21]. It is not conducive to the realization of closed-loop control if the corresponding acquisition and information control units are not configured for these important lines.
Therefore, when the economy is considered, the following methods are designed to realize the evolution of communication links, which reach the lowest load loss. The simulation flow chart is shown in Figure 4.
  • Find the transmission lines without corresponding communication links. Form a Set s of the physical lines which do not have the acquisition and information control units (the lines are ikjk if the nodes at both ends of each line are ikjk).
  • Trigger the cascading failures in these transmissions. Calculate the variation of the power flow entropy with Equation (1) when any line in the Set s fails.
  • List the power flow entropy in descending order; thus, important transmission lines can be obtained. Then, update Set s.
  • Add the communication links which correspond to the transmission lines in Set s, in turn, to form the different CPS models. Judge whether the power CPS enters a self-organized critical state and calculate the load loss.
  • Compare different CPS models’ load losses after experiencing the cascading failure.
  • Find out the optimal plan of adding communication links.

2.4. Cascading Failure Mechanism through the Partial Interdependency

The dispatching center takes the charge of the complete closed-loop control. Once the physical nodes fail, links fail, or the function is invalid, the corresponding information nodes acquire the status and then upload the information to the dispatching center through the communication network. If the dispatching center received the failure information, the control instruction will be made based on the minimum cut-off load and the control signals will be sent to the corresponding physical elements. If the physical elements work normally, it is considered that the closed-loop control is successful; otherwise, it fails.
In the power communication network, the failure of the power grid optimization will cause the power flow transfer. There might be some wrong actions caused by the improper software configuration or hardware damage of the relay protection device. These actions will cause not only the faulty links, but also other links to be cut [22]. As a result, the topological structure of the power grid will be changed and the corresponding communication network nodes will break down at the same time. The route selection of information packs is then affected, as it will cause a significant increase in information packs to be brought to the information layer. Once information transfer is beyond the bandwidth limitation of the communication link, or the physical equipment fails, the communication links will be blocked.
Then, the corresponding information cannot reach the dispatching center. The closed-loop control of the dispatching center will be invalid, and will cause the cascading failure. Packs will be lost and a pack delivering error will appear. The network might be attacked maliciously because of the packs’ abnormal delivering in the communication network, such as by the defense of service attack [23] and false data attack [24]. The correct optimization and control information from the dispatching center cannot be sent to the corresponding nodes in time because of the transmission delay or loss, which leads to the failure of the power grid optimization. Eventually, this causes the vicious cycle of the cascading failures.
The mechanism of cascading failure propagation under the interaction of two networks is shown in Figure 5. In the CPS, the failure of the power grid optimization will cause the power flow transfer. There are some wrong actions produced by the improper software configuration or hardware damage of the relay protection device. These actions will cause not only the failed lines, but also other lines to be cut. Therefore, the topological structure of the power grid will be changed and the corresponding communication network nodes will fail at the same time. Moreover, it will affect the routing of information packs. When the increase in the information packs outnumbers the bandwidth limitation of the transmission lines, or the physical equipment fails, it will cause the blockage of communication links. Then, the corresponding information cannot reach the dispatching center. The closed-loop control of the dispatching center will be invalid, and will cause cascading failures. Packs will be lost and a transmission error will appear. The network might receive malicious attacks because of the abnormal transmission of the communication network (for example, the defense of service attack and false data attack). The correct optimization information of the network cannot be sent to the corresponding nodes in time because of the transmission delay, which leads to the failure of the power grid optimization. Eventually, this causes the vicious cycle of cascading failures.

2.5. Cascading Failure Model Based on the Partial Interdependency

In the physical layer: when the dispatching center obtains the abnormal information, the minimum load loss of the partial interdependent power CPS is calculated based on the DC power flow calculation.
In the cyber layer: the improved routing strategy for information transmission is applied in the communication network to deliver the information pack [26,27], in which the distance from Node i to the target node is Hi.
Hi = hd di + (1 − hd) ci
where di is the length between Node i and the target node (which is the shortest path length), ci is the length of the information packs’ queue, and hd is the routing control strategy.
In the next stage, the probability Pj is given by:
P j = e β H j m L i e β H j
where Pj is the probability that the neighbor node j of Node i is selected to receive information packs produced by the source node, β is the routing probability control coefficient, and Li is the neighbor node set of Node i.
The basic simulation process is shown as follows:
  • Initialize the power grid, and the grid evolves with the probability p in Equation (3) to obtain the corresponding power communication network.
  • Choose an initial line or lines from the power grid randomly, then remove it/them and trigger the cascading failure.
  • When the initial transmission line or lines are cut, calculate the DC power flow according to the parameters of the power grid.
  • Overloaded lines will appear in the power grid due to the power flow transferring from the initial transmission line to others. The corresponding information nodes will produce abnormal information packs.
  • Judge whether the power flow of overloaded lines is beyond the thermal stability limit. If the power flow of overloaded lines exceeds the thermal stability limit, it will be cut off, and the corresponding information node will produce the outage information packs.
  • Send all information from steps 3, 4, and 5 to the dispatching center.
  • The dispatching center makes decisions to balance the generation and load with the purpose of minimizing the cut-off load. Then, the control information is sent to the corresponding physical devices.
  • Judge whether the power grid is disconnected. If it is disconnected, that will be the end of the cascading failure simulation. Otherwise, go back to step 3.

3. Case Studies

3.1. The Partial Interdependency of the Provincial Grids

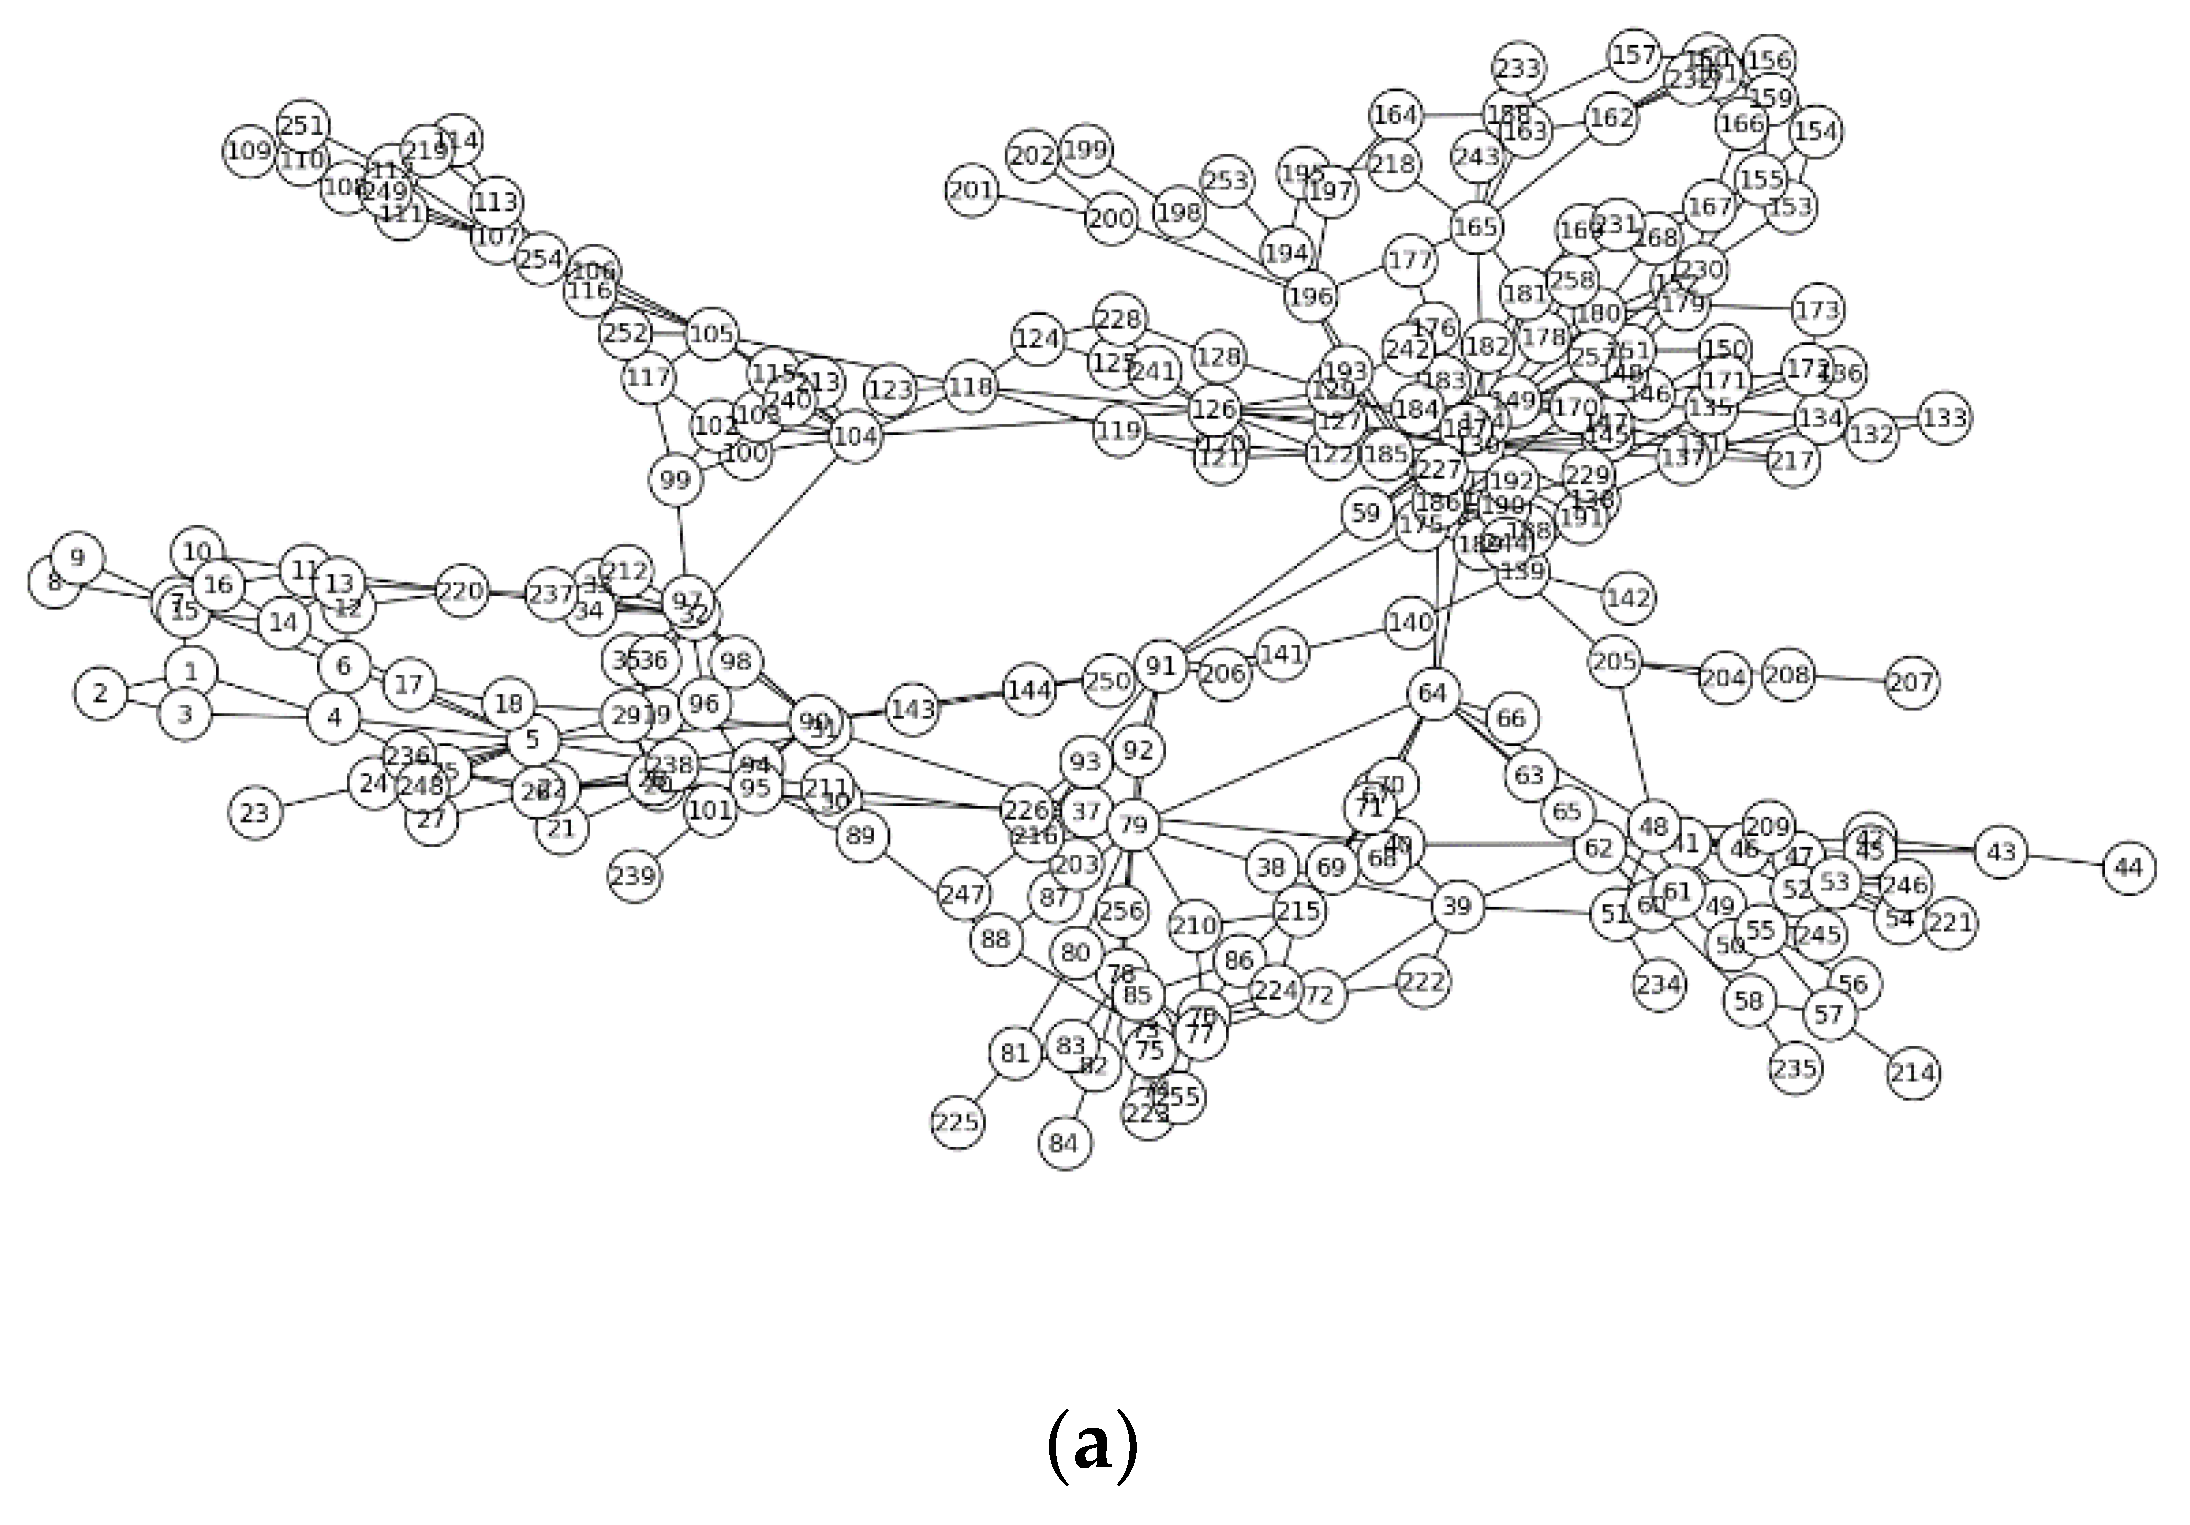
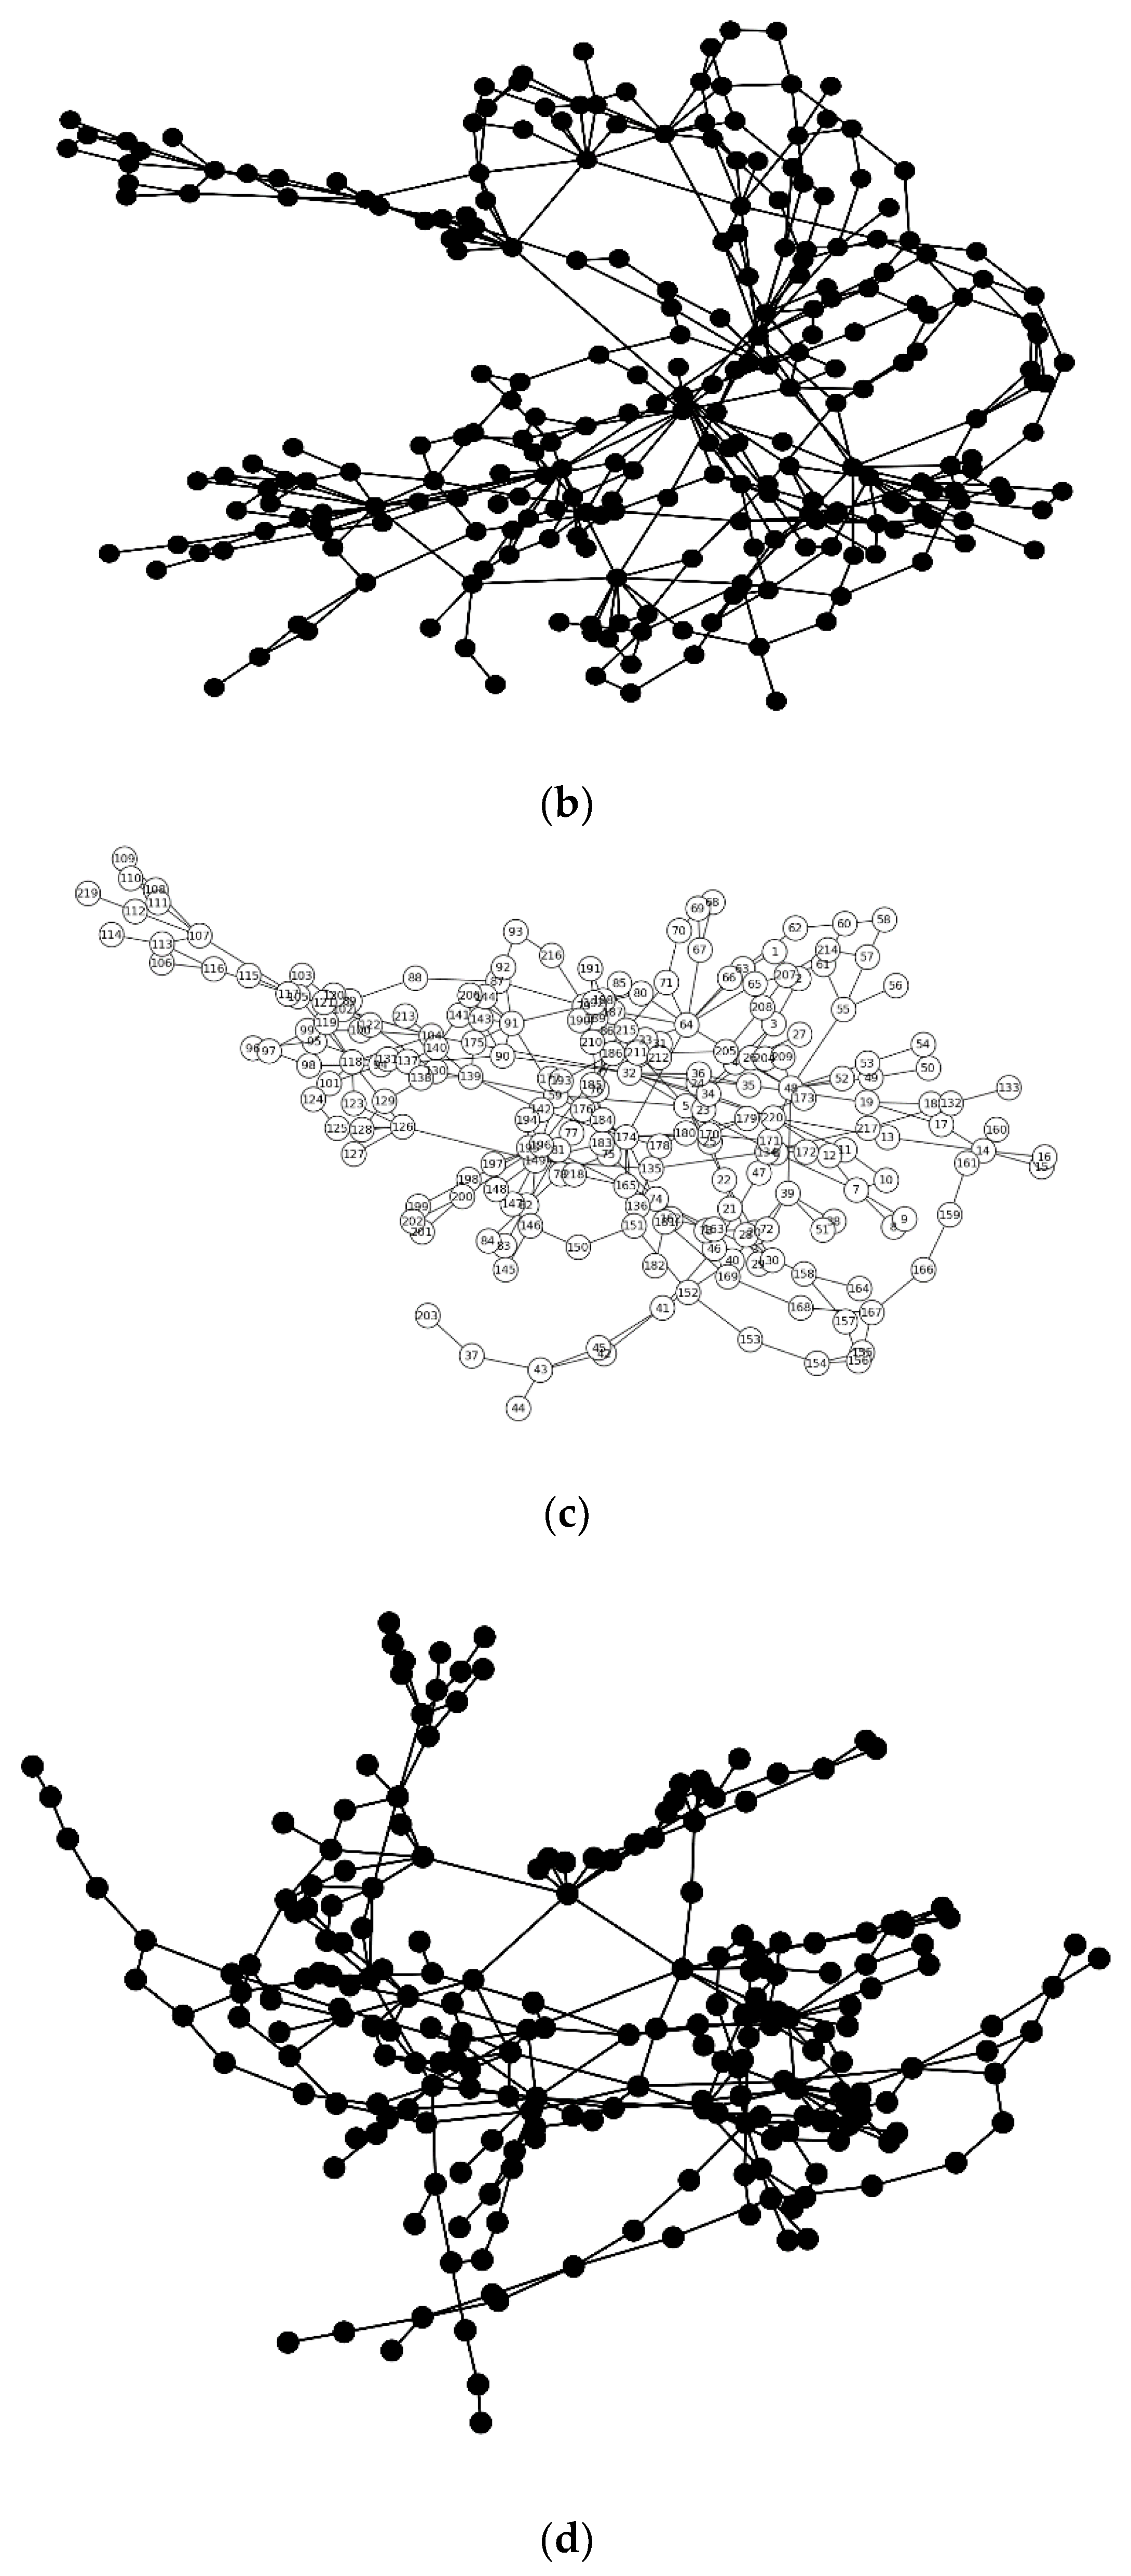
A provincial power grid is shown as an example. The corresponding power grid and communication network topological model is established in Figure 6a, and 6c. There are 258 nodes and 414 edges in the province’s power grid, and 220 nodes and 294 edges in the communication network. The scale of the nodes and links of the power grid and the communication network is different. It is obvious that the topology interdependency of the power grid and the communication networks is not exactly “one to one correspondence” relationship. The number of nodes and edges in the power grid is more than that in the communication networks.
The structure characteristic parameters of the provincial power grid and the communication network are shown in Table 1. N is the number of the network’s nodes. M is the number of the network’s edges. <k> is the average degree of the network. L is the shortest path length of the network. C is the network convergence factor. Lrandom is the shortest path length of the random network, which has the same number of nodes and edges as that network. Crandom is the convergence factor of the random network which has the same number of nodes and edges as that network.
The small-world network is between the regular network and random network. Its characteristic is that very few remote connections are introduced with probability p. According to the small-world network criteria LLrandom and C >> Crandom, it is found that the average shortest distance between the power grid and the communication network is longer than that of their corresponding random network, whereas the clustering coefficient is 10 times to 20 times bigger than the clustering coefficient of the corresponding random network. Thus, it is assumed that the provincial power grid and the communication network are basically consistent with the small-world characteristic.
This illustrates that the characteristic of strong interdependence and interaction exists between the physical network and the communication network in the provincial power grid. Even a local change in the communication network might cause a global chain reaction in the physical network. Therefore, it is essential to reveal the failure propagation mechanism in the interaction between the communication network and the physical network.

3.2. Evolution Results of Communication Network in the Provincial Power CPS

The relationship of “one-to-one correspondence” between power grids and information networks can be realized by applying the evolution method proposed in Section 2. In the simulation, each topological structure of the power grid with a reconnection probability of p = 0.00, p = 0.02, p = 0.04, p = 0.06, p = 0.08, and p = 0.10 is established separately. Table 2 shows the structure characteristic parameters of the power communication network with different reconnection probabilities.
From Table 2, it is clear that the communication network, which evolves with different reconnection probabilities, has the same number of nodes and edges. This means the average degrees of the networks are equivalent. The average shortest path length L of the power communication network with a reconnection probability of p = 0.00 is 7.4462, and the clustering coefficient C is 0.1625. The average shortest path length L of the power communication network with a reconnection probability of p = 0.10 is 6.2422, and the clustering coefficient C is 0.1326.
With the increase in the reconnection probability, the average shortest length L and the clustering coefficient C decrease consistently. With the decrease in the average shortest path length L, the transmission efficiency increases as well. Thus, if the information can be transmitted to the dispatching center more rapidly while the links break down, a cascading failure can be avoided efficiently.

3.3. Cascading Failure of Partial Interdependent Power CPS

Figure 7 shows the complementary cumulative probability of the load loss by employing a cascading failure simulation. The x-axis is the whole system load loss. The y-axis is the complementary cumulative probabilities which correspond to different load losses.
λ = 1 C i = 1 N 1 P l o a d i P s
Equation (4) is the power grid’s load loss after the cascading failure. Pload (i) is the load of Node i. Ps is the total load. N1 is the number of the power grid nodes.
It is noticed that the load loss is less than 0.8 at the beginning of the cascading failure. In this stage, considering the same load loss, the possibility of a big blackout occurrence is the smallest when the reconnection probability p = 0.06.
In the later stage, while the load loss is greater than 0.8, the cumulative probability of occurrence decreases rapidly, and the probability of the power CPS, which evolves with the reconnection probability p = 0.06, having a big blackout occur is still the smallest. Thus, for this provincial power CPS, it is shown that when the reconnection probability of the communication network is around p = 0.06, there might be the best reconnection probability which can make the load loss probability the lowest.

3.4. Resistance to Cascading Failure Based on the Power Flow Entropy

After the evolution of the communication network, it is clear that the nodes in communication networks form a “one-to-one correspondence” with the nodes in power physical networks. However, the number of power grid transmission lines is 44 more than the number of communication links. In Table 2, with the reconnection probability p = 0.06, the number of communication links is 372, whereas the number of power grid transmission lines is 414.
Thus, when the transmission lines without communication links fail, the power flow entropy is bigger, which means the original transmission line would lead to a bigger load loss. Table 3 shows the results of the power flow entropy after triggering the transmission lines without communication links. That is, the system power flow entropy reaches a maximum of 3.26 when the transmission lines (18, 20) fail. It can be noted that these lines do not correspond with any communication link. The next are (12, 8) and (67, 211), in which the power flow entropy of these is greater than 2.0 as well. These transmission lines’ failures have the biggest effects on the power grid reliability.
Thus, based on the results of power flow entropy, a plan of adding the smallest number of communication links can be concluded to resist cascading failure.
  • Plan A: add the communication link (18, 20);
  • Plan B: based on Plan A, then add the communication link (12, 8);
  • Plan C: based on Plan B, then add the communication link (67, 211).
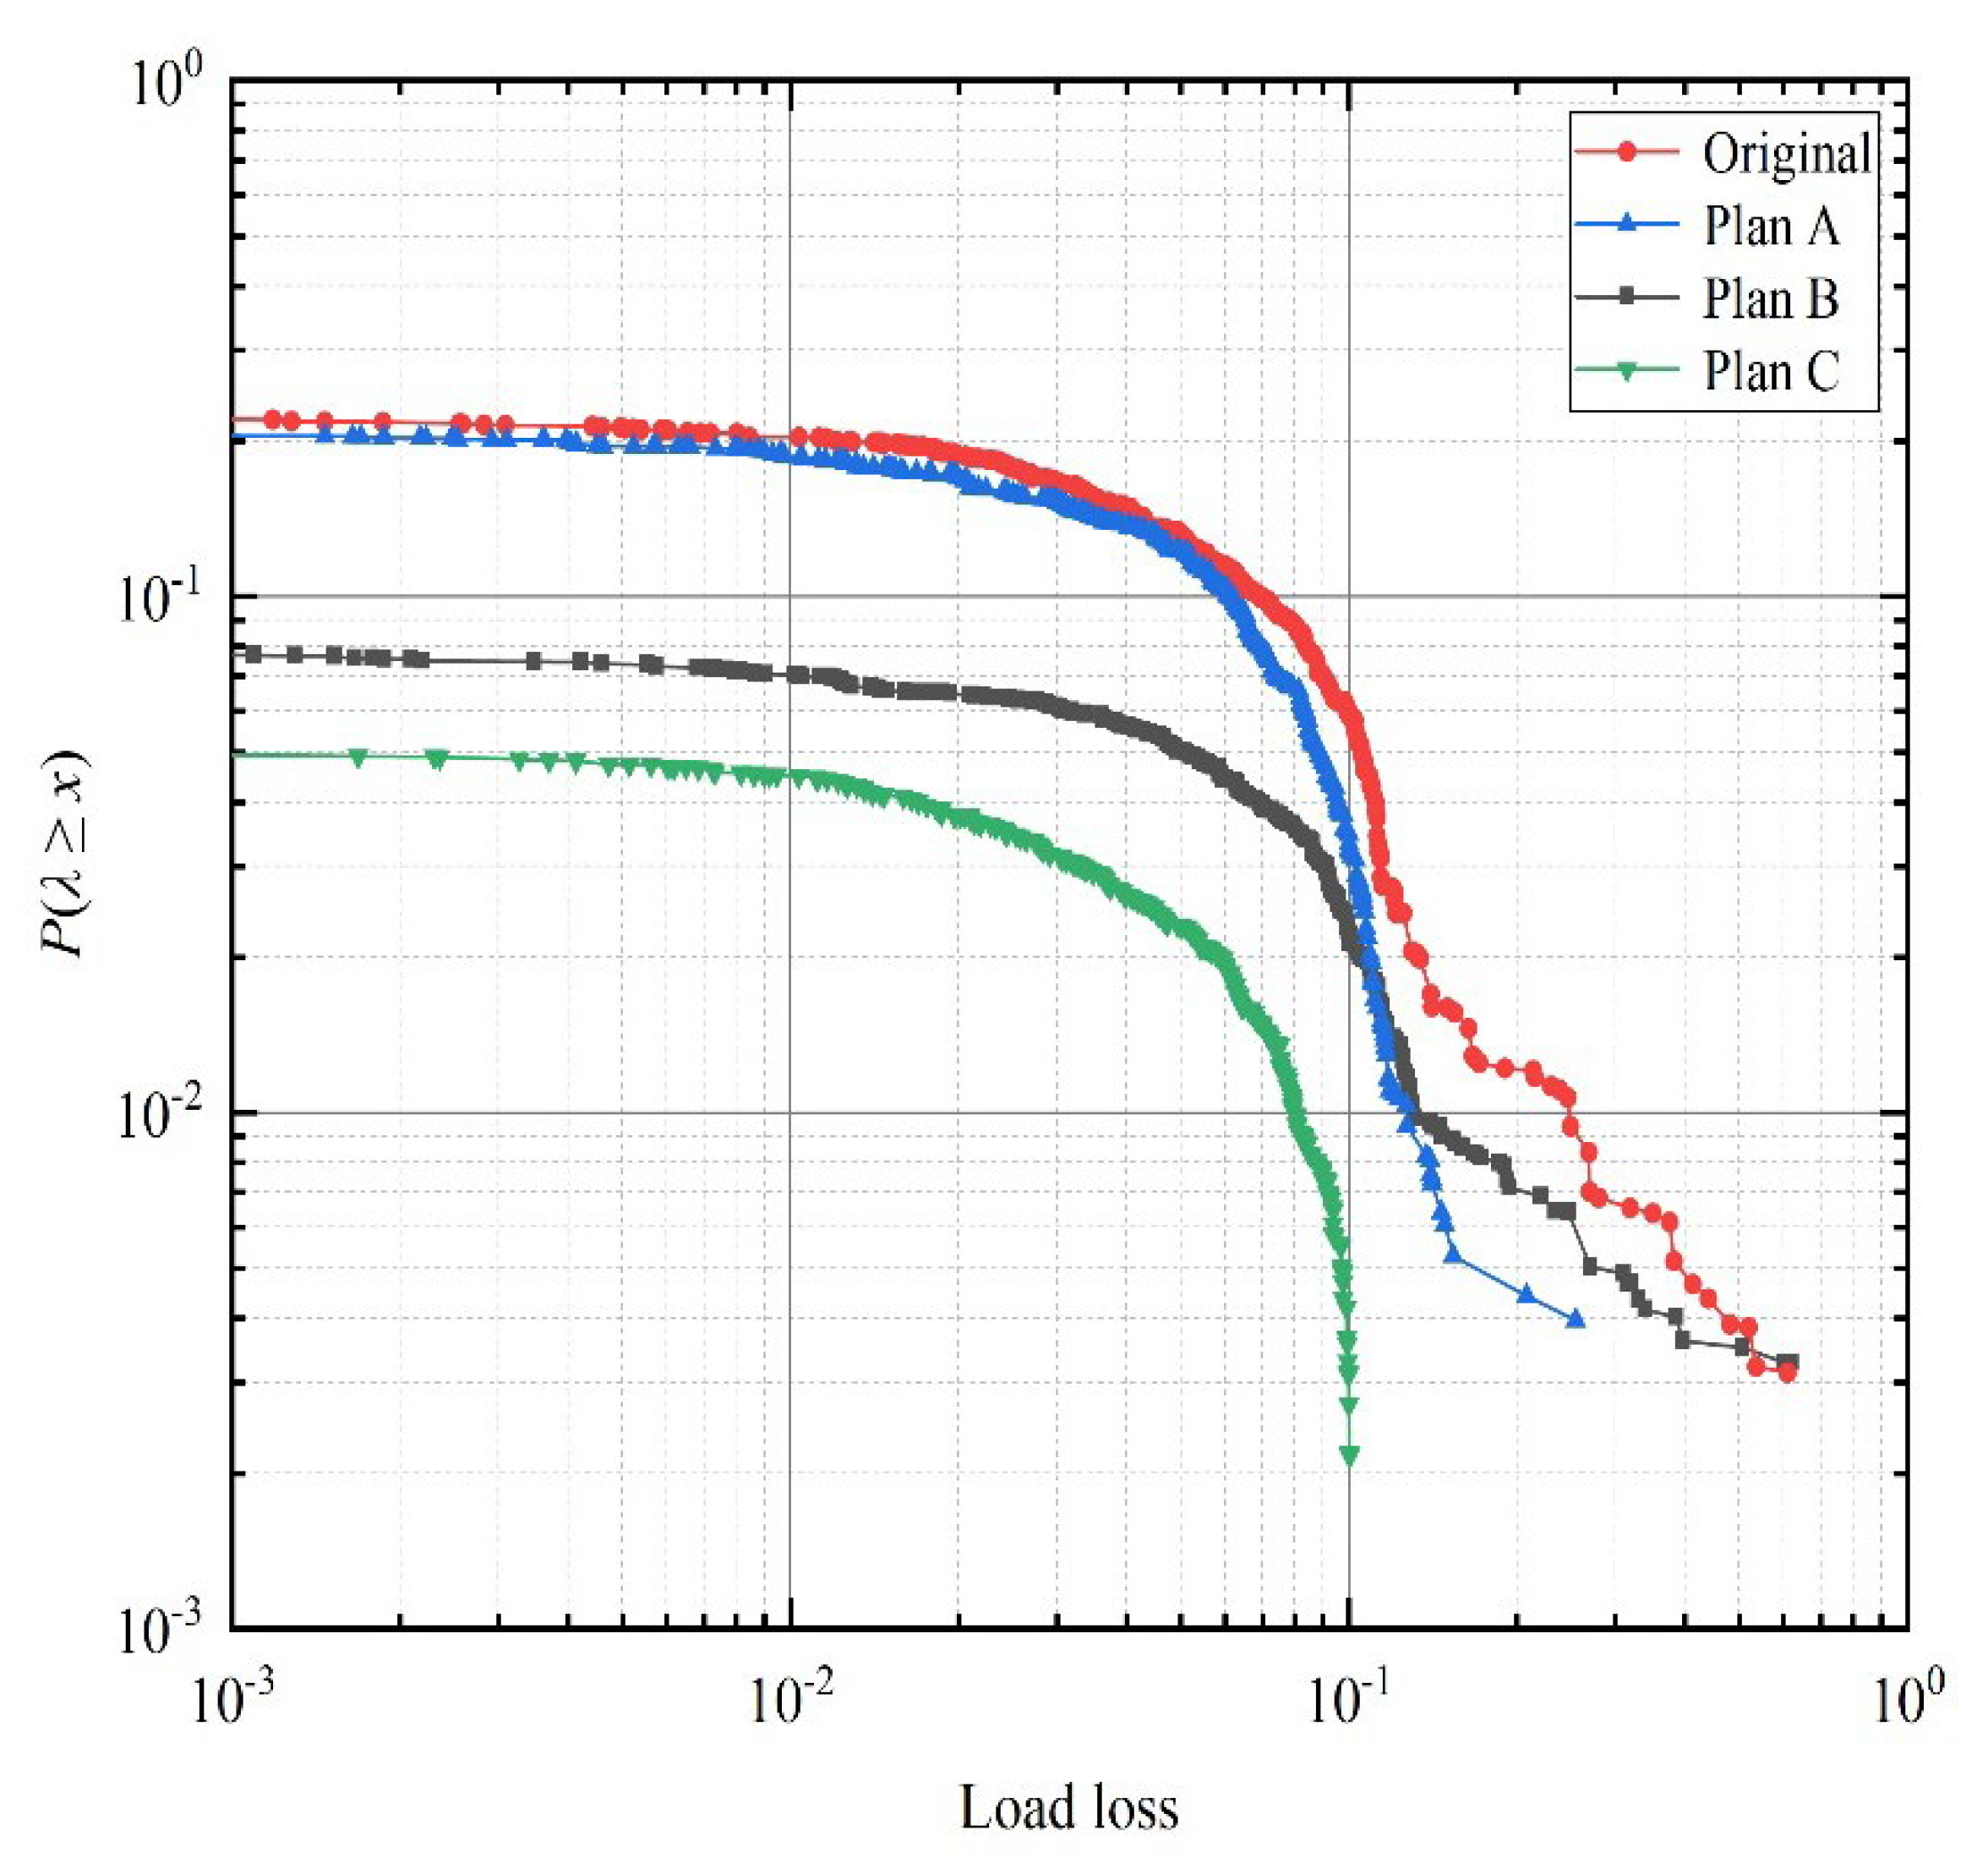
The results of load loss in the power CPS are shown in Figure 8.
In Figure 8, it is clear that the power CPS of the original system and the systems of Plan A and Plan C enter the self-organized critical state. This means the power CPS is facing the risk of cascading failures and a big blackout under three such kinds of situations. Plan B has the smallest probability of a big blackout.
Although adding two communication links can improve the ability of the power CPS against the cascading failure, in the case of Plan C, the power CPS does not enter a self-organized critical state. It is found that the power CPS will not face the risk of cascading failure when at least three communication links are added. Thus, the reliability of the power CPS is the highest in this case.

4. Conclusions

Regarding the situation where the power grid and the communication network are not exactly in a relationship of “one to one correspondence”, but rather, partial interdependency in the power CPS, an evolution model is proposed in this paper. It adds new nodes and communication links into the communication network to achieve the relationship of “one to one correspondence”. Then, the comprehensive observability and controllability of power systems is realized, and the risk of cascading failures is decreased. The relevant results are concluded as follows:
  • In the practical power system, there exists an optimal reconnection probability p = 0.06 of adding new communication nodes to the power CPS to realize the “one to one correspondence”, but also to minimize the cumulative probability of the load loss.
  • In the case of “one-to-one correspondence”, by comparing the power entropy of different power CPSs, the best plan that adds the smallest number of communication links can be made, so that the power CPS will not enter the self-organized critical state.
Through the continuation of this research, the optimal model to obtain the best evolution results will be studied in the coming work.

Author Contributions

Conceptualization, Y.C.; methodology, X.T.; Software, Y.C. and X.T.; validation, Y.C., W.W., Y.F. and L.T.; formal analysis, X.T.; writing—original draft, Y.F.; writing—review and editing, X.T. and W.W.; project administration, X.T. All authors have read and agreed to the published version of the manuscript.

Funding

This research was funded by the National Natural Science Foundation of China, No. 52277076, by the Joint Funds of the National Natural Science Foundation of China, No. U1966207, and by the Natural Science Foundation of Hunan Province under grant number 2020JJ5585.

Institutional Review Board Statement

Not applicable.

Informed Consent Statement

Not applicable.

Data Availability Statement

The data that support the findings of this study are available from the State Grid. Restrictions apply to the availability of these data, which were used under license for this study. Data are available with the permission of the State Grid.

Conflicts of Interest

The authors declare no conflict of interest.

References

  1. Zografopoulos, I.; Ospina, J.; Liu, X.; Konstantinou, C. Cyber-Physical Energy Systems Security: Threat Modeling, Risk Assessment, Resources, Metrics, and Case Studies. IEEE Access 2021, 9, 29775–29818. [Google Scholar] [CrossRef]
  2. Liang, G.; Weller, S.R.; Zhao, J.; Luo, F.; Zhao, Y. The 2015 Ukraine Blackout: Implications for False Data Injection Attacks. IEEE Trans. Power Syst. 2017, 32, 3317–3318. [Google Scholar] [CrossRef]
  3. Sun, Y.; Wang, Z.; Long, C.; Li, G.; Xia, D.; Li, Y. Method for Power Flow Controller Location-Allocation and Optimized Flow Control method of Meshed DC Grid. In Proceedings of the 2019 4th IEEE Workshop on the Electronic Grid (eGRID), Xiamen, China, 11–14 November 2019. [Google Scholar]
  4. Li, F.; Yan, X.; Xie, Y.; Sang, Z.; Yuan, X. A Review of Cyber-Attack Methods in Cyber-Physical Power System. In Proceedings of the 2019 IEEE 8th International Conference on Advanced Power System Automation and Protection (APAP), Xi’an, China, 21–24 October 2019. [Google Scholar]
  5. Johansson, J.; Hassel, H. An approach for modelling interdependent infrastructures in the context of vulnerability analysis. Reliab. Eng. Syst. Saf. 2010, 95, 1335–1344. [Google Scholar] [CrossRef]
  6. Hu, J.; Yu, J.; Cao, J.; Ni, M.; Yu, W. Topological interactive analysis of power system and its communication module: A complex network approach. Phys. A Stat. Mech. Its Appl. 2014, 416, 99–111. [Google Scholar] [CrossRef]
  7. Cheng, Z.; Cao, J.; Hayat, T. Cascade of failures in interdependent networks with different average degree. Int. J. Mod. Phys. C 2014, 25, 1440006. [Google Scholar] [CrossRef]
  8. Wang, W.; Chen, J.; Lin, L.; Liu, X.; Nie, Q. Vulnerability Assessment Method of Electrical Cyber–Physical Interdependent Network Considering Node Heterogeneity. In Proceedings of the 2020 IEEE 4th Conference on Energy Internet and Energy System Integration (EI2), Wuhan, China, 30 October–1 November 2020. [Google Scholar]
  9. Chen, Z.; Du, W.; Cao, X.; Zhou, X. Cascading failure of interdependent networks with different coupling preference under targeted attack. Chaos Solitons Fractals 2015, 80, 7–12. [Google Scholar] [CrossRef]
  10. Yin, M.; Wang, L.; Yao, C.; Wu, X.; Song, Y.; Zhang, Y. Research on an Cascade Failure Model of Improved Scale-Free Network. In Proceedings of the 2021 7th International Conference on Computer and Communications (ICCC), Chengdu, China, 10–13 December 2021. [Google Scholar]
  11. Wang, C.; Guo, J.; Shen, A.; Zhang, D. Research on Robustness Simulation of Interdependent Networks. In Proceedings of the 2020 International Conference on Computer Science and Management Technology (ICCSMT), Shanghai, China, 20–22 November 2020. [Google Scholar]
  12. Wang, Y.; Liu, D.; Xu, X.; Dai, H. Cyber-physical Power System Modeling for Timing-driven Control of Active Distribution Network. J. Mod. Power Syst. Clean Energy 2020, 8, 549–556. [Google Scholar] [CrossRef]
  13. Liu, S.; Yin, C.; Chen, D.; Lv, H.; Zhang, Q. Cascading Failure in Multiple Critical Infrastructure Interdependent Networks of Syncretic Railway System. IEEE Trans. Intell. Transp. Syst. 2021, 99, 5740–5753. [Google Scholar] [CrossRef]
  14. Sturaro, A.; Silvestri, S.; Conti, M.; Das, S.K. A Realistic Model for Failure Propagation in Interdependent Cyber-Physical Systems. IEEE Trans. Netw. Sci. Eng. 2018, 7, 817–831. [Google Scholar] [CrossRef]
  15. Wang, Y.; Yu, J.; Baroud, H. Generating Synthetic Systems of Interdependent Critical Infrastructure Networks. IEEE Syst. J. 2022, 16, 3191–3202. [Google Scholar] [CrossRef]
  16. Marot, A.; Kelly, A.; Naglic, M.; Barbesant, V.; Cremer, J.; Stefanov, A.; Viebahn, J. Perspectives on Future Power System Control Centers for Energy Transition. J. Mod. Power Syst. Clean Energy 2022, 10, 328–344. [Google Scholar] [CrossRef]
  17. Zhu, W.; Milanovic, J. Cyber-physical system failure analysis based on Complex Network theory. In Proceedings of the 17th IEEE International Conference on Smart Technologies, Ohrid, Macedonia, 6–8 July 2017. [Google Scholar]
  18. Wang, J.; Peng, Y. Distributed Optimal Dispatching of Multi-Entity Distribution Network with Demand Response and Edge Computing. IEEE Access 2020, 8, 141923–141931. [Google Scholar] [CrossRef]
  19. Watts, D.J.; Strogatz, S.H. Collective dynamics of ‘small-world’ networks. Nature 1998, 393, 440–442. [Google Scholar] [CrossRef] [PubMed]
  20. Cao, N.; Cao, S.; Yu, Q.; He, Q. Risk measurement and forewarning of power blackouts based on the entropy theory. In Proceedings of the 2016 International Conference on Probabilistic Methods Applied to Power Systems (PMAPS), Beijing, China, 16–20 October 2016. [Google Scholar]
  21. Zhang, S.; Li, Y.; Jin, T.; Yu, H.; Yang, G.; Liu, Z. Analysis and Research on Power Flow Entropy Index of Power System. In Proceedings of the 2018 IEEE 3rd Advanced Information Technology, Electronic and Automation Control Conference (IAEAC), Chongqing, China, 12–14 October 2018. [Google Scholar]
  22. Zhao, L.; Li, X.; Ni, M.; Li, T.; Cheng, Y. Review and prospect of hidden failure: Protection system and security and stability control system. J. Mod. Power Syst. Clean Energy 2019, 7, 1735–1743. [Google Scholar] [CrossRef] [Green Version]
  23. Mukherjee, D.; Chakraborty, S. Real-time Identification of False Data Injection Attack in Smart Grid. In Proceedings of the 2021 IEEE Region 10 Symposium (TENSYMP), Jeju, Korea, 23–25 August 2021. [Google Scholar]
  24. Fu, J.; Wang, L.; Hu, B.; Xie, K.; Chao, H.; Zhou, P. A Sequential Coordinated Attack Model for Cyber-Physical System Con-sidering Cascading Failure and Load Redistribution. In Proceedings of the 2018 2nd IEEE Conference on Energy Internet and Energy System In-tegration (EI2), Beijing, China, 20–22 October 2018. [Google Scholar]
  25. Zhao, T.; Wang, D.; Lu, D.; Zeng, Y.; Liu, Y. A risk assessment method for cascading failure caused by electric cyber-physical system (ECPS). In Proceedings of the 2015 5th International Conference on Electric Utility Deregulation and Restructuring and Power Technologies (DRPT), Changsha, China, 26–29 November 2015. [Google Scholar]
  26. Jia, W.; Jiang, T. Information-defined networks: A communication network approach for network studies. China Commun. 2021, 18, 197–210. [Google Scholar] [CrossRef]
  27. Li, X.; Cheng, T. Cascading Failure Analysis of Cyber-Physical Power Systems under Communication Congestion. In Proceedings of the 2021 International Conference on Cyber-Physical Social Intelligence (ICCSI), Beijing, China, 18–20 December 2021. [Google Scholar]
Figure 1. Two types of interdependent networks. (a) One-to-one correspondent interdependent network; (b) Partial interdependent network.
Energies 15 07876 g001
Figure 2. Schematic diagram of coupling network and correct reconnection. (a) The nearest-neighbor coupling network; (b) correct reconnection.
Energies 15 07876 g002
Figure 3. Schematic diagram of repeated edges and disconnection. (a) Schematic diagram of repeated edges; (b) schematic diagram of disconnection.
Energies 15 07876 g003
Figure 4. The simulation flow chart of cascading failure.
Energies 15 07876 g004
Figure 5. Mechanism diagram of cascading failure propagation under the interaction of two networks [25].
Energies 15 07876 g005
Figure 6. The power grid and the communication network of the province. (a) The power grid of the province; (b) the power grid of the province without numbers; (c) the communication network of the province; (d) the communication network of the province without numbers.
Energies 15 07876 g006aEnergies 15 07876 g006b
Figure 7. Complementary cumulative probability distribution diagram of load loss in power CPS with different reconnection probabilities.
Energies 15 07876 g007
Figure 8. The result after adding the communication links.
Energies 15 07876 g008
Table 1. The structure characteristic parameters of a complex network between the power grid and the communication network in the province.
NetworkNM<k>LCLrandomCrandom
Power grid2584143.2605.7050.2094.7740.013
Communication network2202942.6736.1100.1025.4860.012
Table 2. The communication network of the province and the complex network structure’s characteristic parameters of the communication networks with different reconnection probability evolutions.
Communication NetworkNM<k>LC
Original communication network2202942.67276.28960.1019
p = 0.00 2583722.88377.44620.1625
p = 0.02 2583722.88376.69700.1527
p = 0.04 2583722.88376.59810.1484
p = 0.06 2583722.88376.52200.1496
p = 0.08 2583722.88376.41220.1344
p = 0.10 2583722.88376.24220.1326
Table 3. The power flow entropy after the cascading failure.
NumberTransmission Lines without Communication LinksPower Flow Entropy
1(18, 20)3.267269469
2(12, 8)3.262736109
3(67, 211)2.521364395
4(128, 196)1.7862966
5(9, 25)1.590954952
Publisher’s Note: MDPI stays neutral with regard to jurisdictional claims in published maps and institutional affiliations.