Article

Numerical and Experimental Spray Analysis of Castor and Jatropha Biodiesel under Non-Evaporating Conditions

1
Faculty of Mechanical Engineering, Ghulam Ishaq Khan Institute of Engineering Sciences and Technology, Topi 23640, Pakistan
2
Faculty of Mechanical Engineering, University of Engineering and Technology, Lahore 54890, Pakistan
3
Department of Mechanical Engineering, Sejong University, Seoul 05006, Korea
*
Authors to whom correspondence should be addressed.
Energies 2022, 15(20), 7808; https://doi.org/10.3390/en15207808
Submission received: 17 September 2022 / Revised: 14 October 2022 / Accepted: 19 October 2022 / Published: 21 October 2022

Abstract

:
Fuel spray characteristics influence combustion, which in turn has a direct impact on engine performance and emissions. Recently, there has been an increasing interest in novel castor oil biodiesel. However, few investigations have been performed that combine both numerical and experimental biodiesel spray analyses. Hence, in this paper, we aim to explore the spray behavior of castor and jatropha biodiesel by employing numerical and experimental methods under non-evaporating, varying injection, and ambient conditions. The experimental study was carried out in a control volume vessel (CVV) at high injection and ambient pressures. The fuel atomization was modelled in ANSYS Fluent using a Lagrangian/Eulerian multiphase formulation. The results revealed that the Kelvin–Helmholtz and Rayleigh–Taylor (KHRT) model coupled with the Taylor Analogy Breakup (TAB) model provide a better estimation of the penetration length (PL) and spray cone angle (SCA) compared to the KH and TAB models. On average, Jatropha biodiesel (JB-20) and castor biodiesel (CB-20) showed a 10% to 22% longer PL, 8% to 10.6% narrower spray cone angles, and 3% to 6% less spray area, respectively, compared to diesel. The numerical predictions showed that JB-20 and CB-20 had an around 24.7–48.3% larger Sauter mean diameter (SMD) and a 38.6–73.3% average mean diameter (AMD).

1. Introduction

The world has seen rapid population growth in recent years that has led to the highest recorded rate of energy consumption, especially in the transportation sector. The major source of energy in the transportation sector is fossil fuels. Fossil fuels are depleting at a faster rate than ever before, which is a real threat to our energy security. In addition, they are a major source of air pollution and environmental degradation on a global level. It is due to these reasons that researchers are in search of alternative fuels that can reduce our reliance on petroleum-based fuels and reduce exhaust emissions. Biodiesel fuels are a renewable source of energy that have become quite popular in recent years because they do not require any engine modification. Biodiesels are oxygenated fat mono-alkanoic acids with long chains that can be extracted from various sources such as animal fats, waste oils, and vegetable oils [1]. Recent studies have revealed that biodiesel can reduce particulate matter (PM), carbon monoxide (CO), and unburned hydrocarbons (UHC); however, the number of nitrogen oxides (NOx) are increased slightly [2,3,4,5].
Biodiesels have varying physiochemical properties compared to diesel that influence their spray behavior [6,7,8,9]. These properties affect fuel atomization, which is a critical process that affects fuel–air mixing, combustion, and emissions. Hence, it is imperative to study the fuel spray characteristics of any renewable fuel prior to its use in a diesel engine. Several authors have experimentally investigated the spray behavior in a constant volume vessel using different flow visualization methods [10,11,12,13,14]. Gao et al. [1] revealed the spray properties of jatropha, palm, and waste cooking oil biodiesel and observed a smaller SMD and narrower SCA owing to the higher viscosity and surface tension. Yu et al. [7] showed similar results using various nozzle geometries. Das et al. [9] studied the effect of surface tension and viscosity on the spray behavior of castor, neem oil, and sunflower oil. Mohan et al. [12] investigated the fuel spray properties of waste cooking oil biodiesel with diesel fuel. Their results showed that the PL and momentum flux were greater for the biodiesel and both properties increased with the enhancement of the injection pressure (IP). Agarwal et al. [15] analyzed the spray properties of karanja and jatropha biodiesel. They concluded that diesel had better atomization and evaporation behaviors than biodiesel. Ulu et al. [11] investigated the fuel spray properties of canola, corn, cottonseed, and sunflower biodiesel. They observed a higher PL and SMD and a reduced SCA and spray area for biodiesel compared to diesel. The spray characteristics of palmorsa biodiesel blends with diesel fuel were studied by Ramlingam et al. [16], and they found the shortest PL for neat biodiesel and diesel. The SMD decreased while the spray area was increased with the enhancement of the IP. The fuel spray behaviors of palm, soybean, used cooking oil biodiesel, and hydrogenated vegetable oil were revealed by Bohl et al. [17]. They concluded that the denser and more viscous fuels had a longer PL. the effect of fuel properties on spray behavior has also been studied in the literature [18,19,20,21]. There is a variation in the flow patterns of biodiesel and diesel for both in-nozzle flow and spray behavior. It has been reported that biodiesel showed poor atomization quality as it has a longer PL, narrow SCA, and larger SMD compared to diesel.
The biofuels extracted from nonedible sources have gained much more attention recently because they do not pose any threat to food security. The castor bean plant is poisonous for both humans and animals [22]. It has a low production cost and grows easily under tough climates. Castor Methyl Esters (CaME) have a high flash point, density, viscosity, and lubricity. They have gained significant attention recently because of their high oxygen content and cetane number, which improve ignition quality and help to achieve complete combustion [23]. The literature available on the engine performance, emissions, and spray properties for castor biodiesel is quite scant. Further research related to spray properties and engine performance when using castor oil biodiesel is required before producing it on a commercial scale [24].
Fuel spray dynamics include several physical processes such as in-nozzle cavitation, turbulence, liquid breakup, coalescence, collision, and evaporation on micro time and length scales. The injection conditions have a strong influence on the processes carried out in an engine cylinder, such as fuel breakup, atomization, mixture formation, evaporation, combustion, and soot emissions in diesel engines [25,26,27]. A schematic of the fuel injection process is shown in Figure 1. As the fuel is injected from the nozzle, it disintegrates into droplets and ligaments known as the primary breakup, while the further breakup into smaller droplets is known as secondary breakup. Such a rapid and instantaneous process of high energy droplet disintegration, the formation of jet vortices, and air fuel mixing shows the complexity of the process [28].
Several authors have studied these phenomena and their effects on external flow [8,29,30]. Fuel spray is also greatly affected by the conditions in an engine cylinder, such as the pressure [31], temperature [32], and flow field patterns [33]. The literature shows various schemes to model spray behavior and spray properties such as the Eulerian–Eulerian approach [34] and Lagrangian–Eulerian approach [35]. The first approach proved quite effective in capturing the near nozzle flow and the primary breakup of the liquid jet. However, its computational cost was high. On the other hand, the Lagrangian–Eulerian method is not very computationally intensive and predicts spray behavior with high accuracy [36,37].
Several breakup models for modelling fuel spray have been proposed, such as the Blob, Taylor Analogy Breakup (TAB), WAVE or Kelvin–Helmholtz (KH), Kelvin–Helmholtz and Rayleigh–Taylor (KH–RT), linearized instability sheet atomization (LISA), Kelvin–Helmholtz aerodynamic cavitation turbulence (KHACT), and enhanced aerodynamic cavitation turbulence (EACT) models in an internal combustion engine [38,39,40,41]. Ghasemi et al. [42] employed the Wave and KHRT models for analyzing the spray behavior of biodiesel and diesel. The results for the KHRT model were closer to the experimental results because of additional Rayleigh–Taylor (RT) instabilities with respect to incorporating the secondary breakup. Jing et al. [40] investigated the spray behavior of dieseline fuel using the KHRT, KHACT, and EACT models. Both the KHACT and EACT models incorporate the effects of in-nozzle turbulence and cavitation into the fuel spray. However, EACT also controlled the influence of in-nozzle flow on atomization and due to which it showed better agreement with the experimental results.
It was observed from the literature that few researchers have revealed the spray properties of various biodiesels employing both numerical and experimental techniques as well as the coupling of various sub models and the tuning of model constants to provide better estimation of fuel spray behavior. According to our survey, no comparative study related to the fuel spray characteristics of castor oil biodiesel with other second-generation biofuels and diesel has been performed.
Hence, in this study, we have explored the spray characteristics of castor oil biodiesel compared to jatropha biodiesel and diesel. A unique combination of the KHRT and TAB models along with various sub models for modelling fuel atomization, droplet drag, drop collision, coalescence, and turbulence were adopted using Lagrangian–Eulerian multiphase formulation. The fuel spray characteristics were observed using different breakup models. The results were also compared with the experiments and the most suited model was further used for the estimation of the SMD and AMD. The PL, SCA, and spray area were investigated under various injection and ambient conditions in a CVV.

2. Numerical Methodology

Lagrangian particle-tracking approach was used for spray simulation in ANSYS Fluent. Eulerian scheme was used to determine gas phase while the parcels of droplets were tracked using Lagrangian methodology [43]. Lagrangian–Eulerian multiphase formulation was employed to model the discrete and continuous phase interaction. Flow characteristics such as velocity, pressure, density, and temperature for the entire 3D domain were defined using Eulerian approach. In Lagrangian framework, each particle was tracked individually as it moved across a continuous gas phase. Both the phases continuously exchanged momentum, energy, and mass, and were affected by each other. The extent of the effect was calculated by solving the continuous and discrete phase equations. The drops were decelerated, and the mass was reduced due to breakup and evaporation. The discrete phase model (DPM) assumes that the volume fraction of the discrete phase in each computational cell is less than 0.4. If the value was greater than 0.4, then the software itself assumed it to be 0.4 and carried on with further calculation. This problem usually occurs close to the nozzle and, therefore, the Eulerian approach is more suited to the near nozzle flow.

2.1. Injection Model

Cone injection model was used to inject fuel into the cylinder. First, the injection coordinates and the direction were given. Afterwards, the properties such as flow velocity, flow duration, mass flow rate, half cone angle, and temperature were provided. Velocity vector of the particles was directed according to the SCA defined by the user. The particles were distributed randomly for solid cone injection of the stream; thus, the same injection conditions did not necessarily yield the same particle distribution at the same location.

2.2. Primary Atomization Model (Wave Model)

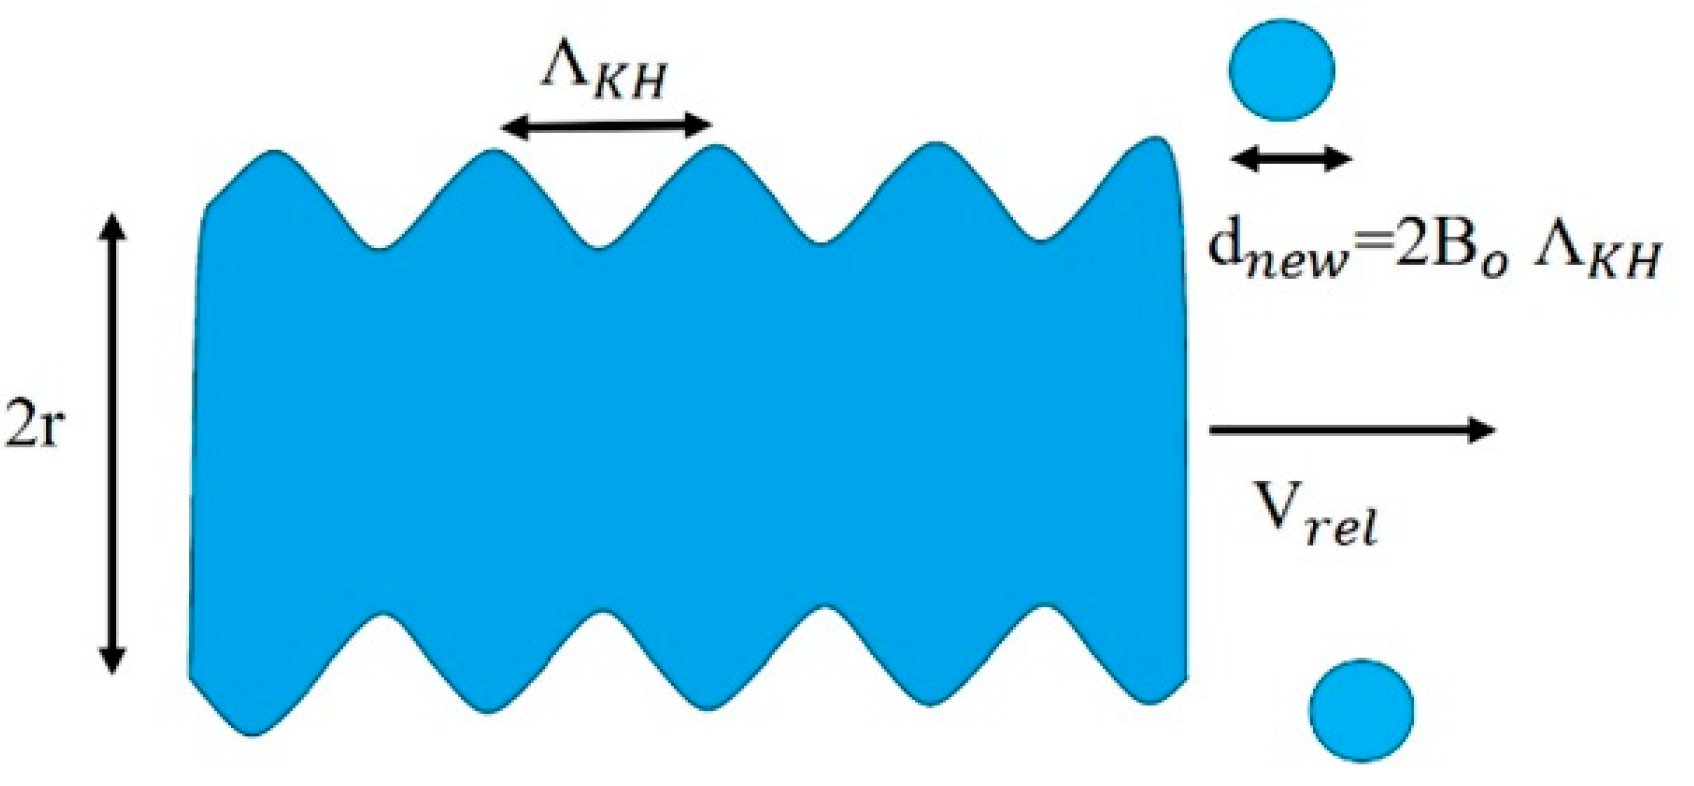
Wave model, also known as Kelvin–Helmholtz (KH) model, presents KH instabilities to the blob model, and the liquid breakup is mostly induced by aerodynamic forces [44]. The KH model assumes that KH instabilities grow on the surface of the liquid and cause the droplets to shear off from the surface. Figure 2 shows the schematic of the wave model. Rate of reduction of the parent drop radius and the size of the new child droplet formed are related to maximum wavelength (ΛKH) and growth rate (ΩKH) of the fastest-growing wave on the liquid’s surface, as given below [44]:
Ω K H = 0.34 + 0.38 ( W e g ) 1.5 ( 1 + Z ) ( 1 + 1.4 ( T ) 0.6 ) σ ρ l ( r ) 3
Λ K H = 9.02 r ( 1 + 0.45 ( Z ) 1 / 2 ) ( 1 + 1.4 ( T ) 0.7 ) ( 1 + 0.865 ( W e g 1.67 ) 0.6
r” is the radius of the parent drop, “ ρ l ” is the liquid density, “σ” is the surface tension of liquid, the gas’ Weber number is denoted as “W e g , the Ohnesorge number is given as “Z”, and the Taylor number is denoted as “T”.
W e g = ρ l V r e l   2 r σ       ,   O h = μ   l ρ l σ r     ,   T = Z W e g
Size reduction rate of the parent drop is given by:
d r d t = r r K H τ K H       , r K H r
The size of the parent droplet will reduce continuously until it meets the criteria of the KH breakup according to Equation (3) [43]. The size of the daughter drop r K H and time for breakup τ K H are given by [44]:
τ K H = 3.276 B 1 Ω K H   Λ K H
r K H   =   B 0 Λ K H
B0 and B1 are the model constants.
A new droplet parcel with a drop radius r K H   is formed when 5% of the mass is shed from the initial parcel mass. This is known as KH breakup.

2.3. Secondary Breakup Model (KH–RT)

The KH–RT hybrid model [45,46] was presented by Baele and Reitz. This model combines the effect of KH instabilities with the Rayleigh–Taylor instability. The KH model governs the primary breakup while the KH–RT model predicts the secondary breakup of the liquid jet. “Rayleigh–Taylor instability” was introduced by Su et al. [47]. These instabilities are generated when a fluid of high density accelerates into the medium with less density like fuel penetrating into air inside the chamber. The breakup of droplets is related to the instabilities of the fastest-growing wavelengths. The frequency of such a fastest-growing wavelength is given by:
Ω R T = 2 [ g t ( ρ l ρ g ) ] 3 / 2 3 3 σ ( ρ l ρ g )
with corresponding wavelength:
λ = 3 σ g t ( ρ l ρ g )
Here, g t is the acceleration along the direction of drop motion, and it is defined as:
g t = g ¯ · j ¯ + a ¯ · j ¯
Here, the drop acceleration is a ¯ and j ¯ is the unit vector tangent to drop trajectory. The model is called “RT Model” after the Rayleigh–Taylor instability theory. The RT breakup time is given by:
t R T = 1 Ω R T
Whilst for predicting the diameter of the droplets produced by this process, a statistical approach is applied based on Gaussian distributions centered upon values proportional to the wavelength responsible for the breakup. Therefore, if the RT perturbations have been developing for a time longer than the breakup time, the disaggregation of the droplets is imposed, and the radius of the droplets so produced is given by:
r R T = C R T λ
Both KH and RT models are inter-related, thus yielding a critical improvement in the detailed description of atomization processes.

2.4. TAB Breakup Model

This model is mostly used for low Weber number flows as it is established on an analogy between a deforming droplet and spring mass-damping system. The drop breakup equation is analogous to the spring mass-damping system:
y ¨ = 2 ρ w 2 3 ρ l r 2 8 σ ρ l r 3 y 5 μ   l ρ l r 2 y ˙
The deformation parameter y is then correlated both with the breakup of the droplet and with the drag force due to the droplet’s shape in a streaming air flow. When, for a single droplet, the distortion parameter reached the critical value 1, the drop was assumed to breakup, forming a cloud of smaller droplets. The new droplet radii were sampled from a normal distribution, the mean value was calculated by superficial energy consideration, and the number of new droplets was simply derived from the law of conservation of mass.

2.5. O’Rourke Collision Model

This approach is more of a statistical approach than deterministic. The number, nature of collisions, and coalescence in the flow field are governed by a probability density function. The only parcels that can collide are those present in the same computational cell. This reduces the computational time, but grid dependency is increased. A Poisson distribution predicts whether a collision of drops is within the same parcel or between different parcels. If several collisions occurred in droplets from different parcels, then another random number was compared with a parameter containing droplet diameters. The nature of the collision was identified with the help of relative velocity between the colliding droplets. Coalescence occurred when these parameters were greater than that of the random number. If it was lower, then grazing collision [48] would occur, after which droplets only undergo velocity change but maintain their sizes and temperature. When collision occurred between different parcels, droplets that underwent collision were removed from the parcels and the properties of remaining droplets were modified on the basis of conservation of mass, momentum, and energy.

2.6. Drag Model

It is necessary to determine droplets’ drag coefficients for modelling sprays. ANSYS Fluent calculates the drag coefficient considering the deformation of droplets. Droplets prior to breakup took a disc-like shape, which changed the drag coefficient significantly. Liu et al. [49] proposed a dynamic drag model that replicates the drag coefficient for the deformed droplet using TAB or WAVE models. If both the collision model and the drag model are turned on, then drop distortion and distortion velocities are reset after collision. Mostly, drag model assumes that all the drops are spherical, and the drag for a spherical object, C d , s p h , is calculated by [49]:
C d , s p h = { 0.424                                 R e > 1000 24 R e ( 1 + 1 6 R e 0.6 )             R e 1000
However, at higher Weber numbers, the droplet profile will resemble that of a disk and the drag associated with the disk is much higher than the drag of a sphere. So, the assumption of all the droplets being spherical is unsatisfactory. Droplet distortion effects were included in the dynamic drag model, whereby the drag force intermediates between the drag of a disk and a sphere. The coefficient of drag, C d , was given by
C d = C d , s p h ( 1 + 2.63 y )
Here, y is the droplet distortion from the TAB model, as determined by the solution of Equation (10).

2.7. Governing Equations

Incompressible continuity equation was used for mass exchange between the discrete and the gas phases.
ρ t + ( ρ u i ) x i = 0
Momentum equation deals with the exchange of momentum among two phases. Left-hand side of the equation shows the rate of change of momentum and the convective transport of momentum, while on the other side we have the pressure force, shear force, and the body force.
ρ v t + · ( ρ v v ) = ( p ) + · ( τ ¯ ) + F
Exchange of energy between the two faces was governed by the energy equation. On the left-hand side, we have the rate of change of energy along with the convective transport of energy. On the right side, we have the energy transfer terms due to conduction, viscous dissipation, mass diffusion, and the pressure force.
ρ E t + · [ v ( ρ E ) ] = ·   [ ( k + k t ) T + ( τ · ¯ v ) j h j J j ( v · p ) ] + S e  
There were two species in our flow: one was the discrete phase or fuel droplets and the other was the continuous phase or the gas phase. For N number of species (N-1), the equation regarding the number of species was solved. Hence, the one-species transport equation. On the left-hand side of Equation (17), we have the rate of change of species i and the convective transport of that species. On the other side, we have the diffusion flux of species i, which is further determined by Fick’s law.
ρ Y i t + · ( ρ v Y i ) = · ( J i )  
Realizable k-ε model [50] was used for modelling turbulence. It is a modified form of standard k-ε model that was focused to overcome its shortcomings. Several researchers have applied this model to a variety of flow regimes, particularly jet sprays at high pressure gradients [51,52,53]. The performance of realizable k-ε model is much better compared to the standard k-ε model when dealing with high pressure gradients such as those in jet sprays.
( ρ k ) t + ( ρ k u j ) x i = x i [ ( μ + μ t σ k ) k x j ] + G k ρ ε Y M + S k  
( ρ k ) t + ( ρ k u j ) x j = x j [ ( μ + μ t σ ε ) ( k ) x j   ] + ρ C 1 S ε ρ C 2 ε 2 k + ( ε ν ) 0.5 + S ε  

3. Simulation Setup

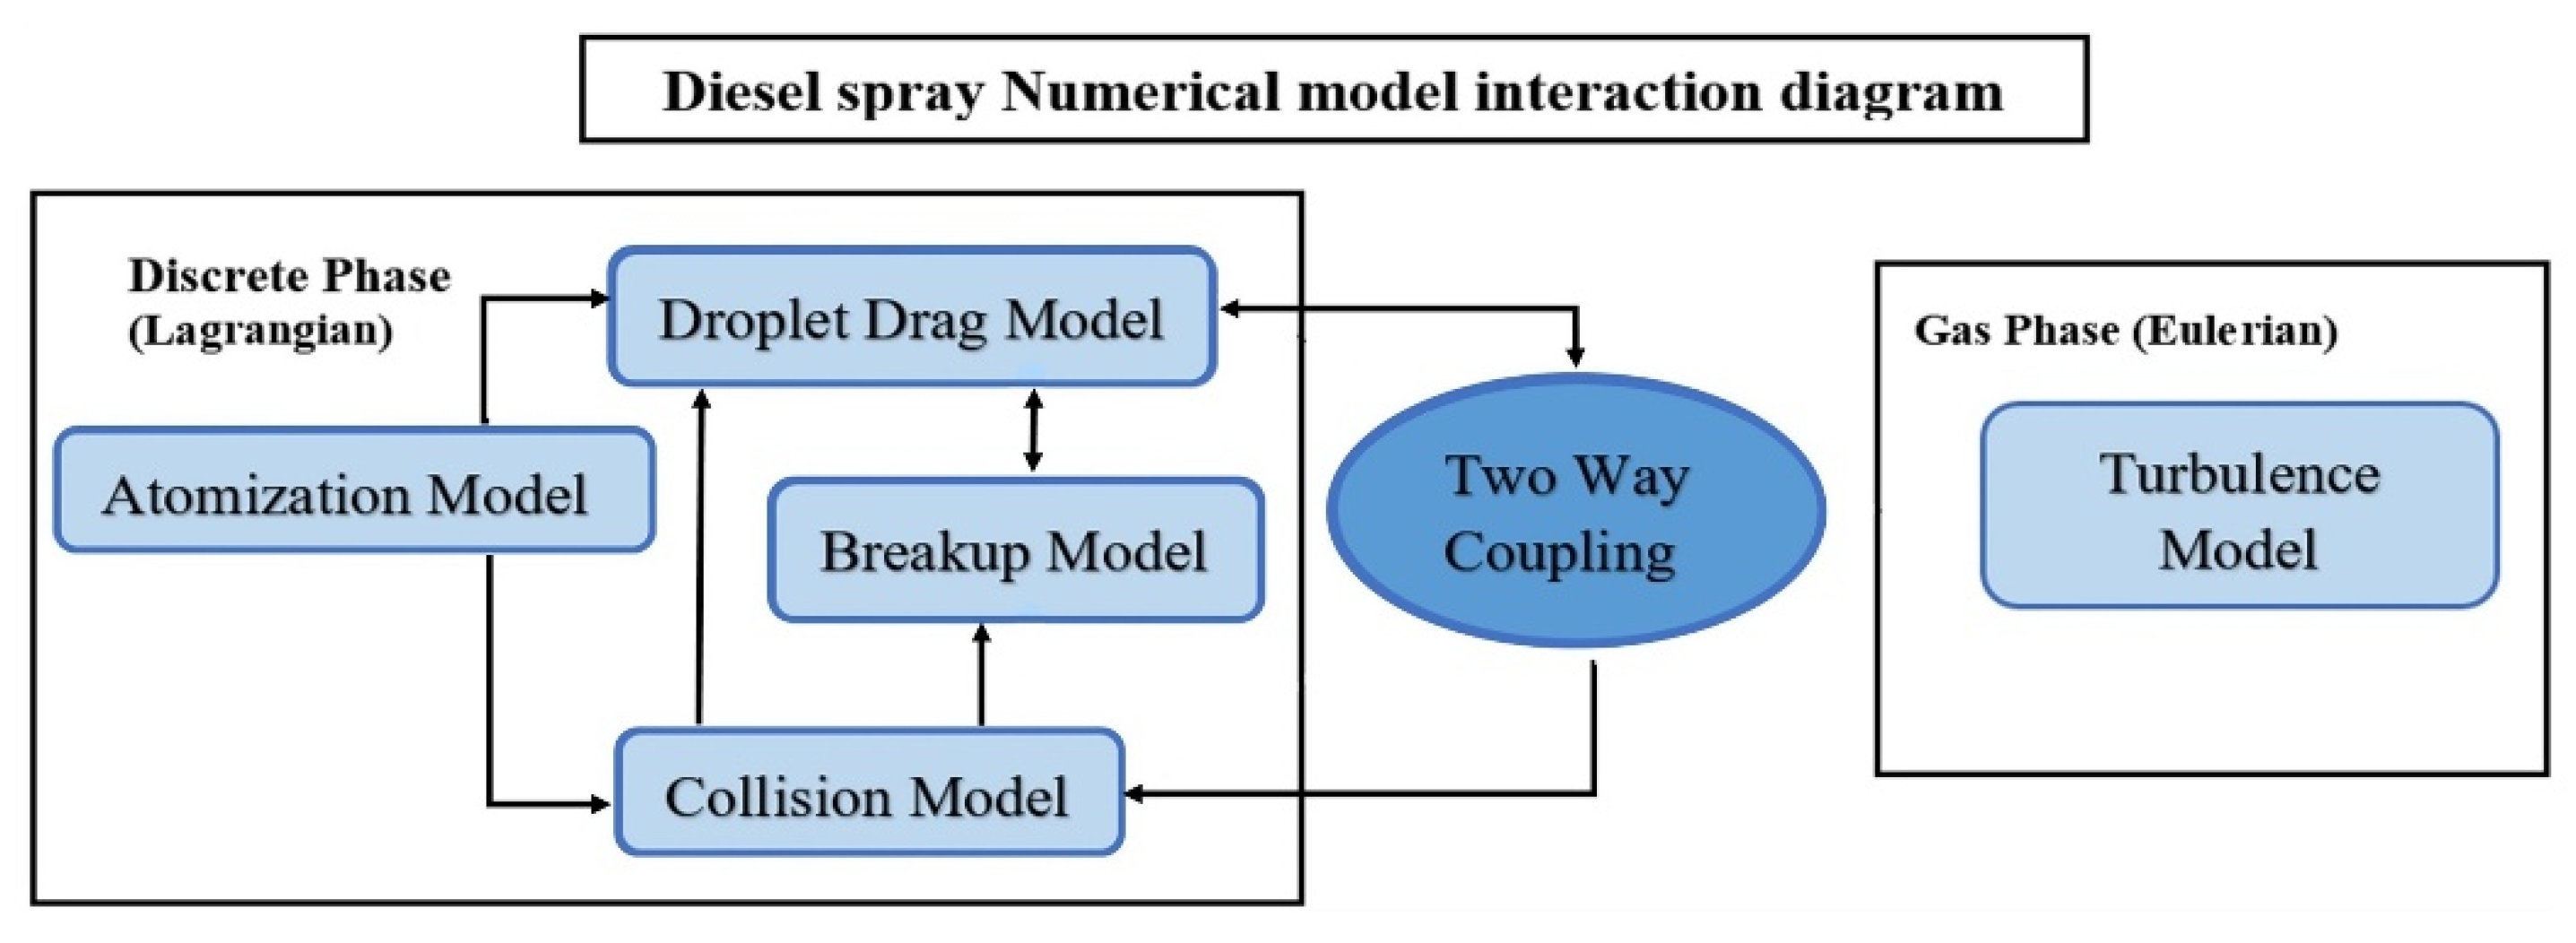
The droplets are injected using the cone injection model, employing the user-defined injection properties such as the droplet size, velocity, distribution, and spray cone angle. The injected droplets are then influenced by the drag, collision, and the breakup models, as shown in Figure 3. The spray characteristics are dependent on the accuracy of these sub-models and the injection properties. The drops injected then interact with the turbulence model of the continuous gas phase, which causes the exchange of mass, momentum, and energy. At the same time, the relative velocity between the two fluids causes the breakup model to reduce the drop size. The two-way interaction changes the drops’ direction and enhances the collision rate, which further affects the droplet drag and breakup phenomena. The collision model works until the droplet density is high and the velocity of the droplet is significant. The drag model operates until there is a finite velocity difference between the droplets and the gas, and the breakup model will continue to simulate the drop breakup until the Weber number is almost 12. Fluent computes the particle trajectory and keeps track of its mass, momentum, and heat lost or gained as the particle moves across the continuous phase. These quantities were incorporated into the calculations of the continuous phase. In the two-way coupling, both the discrete and the continuous phase equations were solved alternatively until the solution was converged. The discrete phase possesses significant momentum at the beginning of injection, so it affects the continuous phase considerably. That is the reason for using two-way coupling for numerical simulations.

Mesh Study

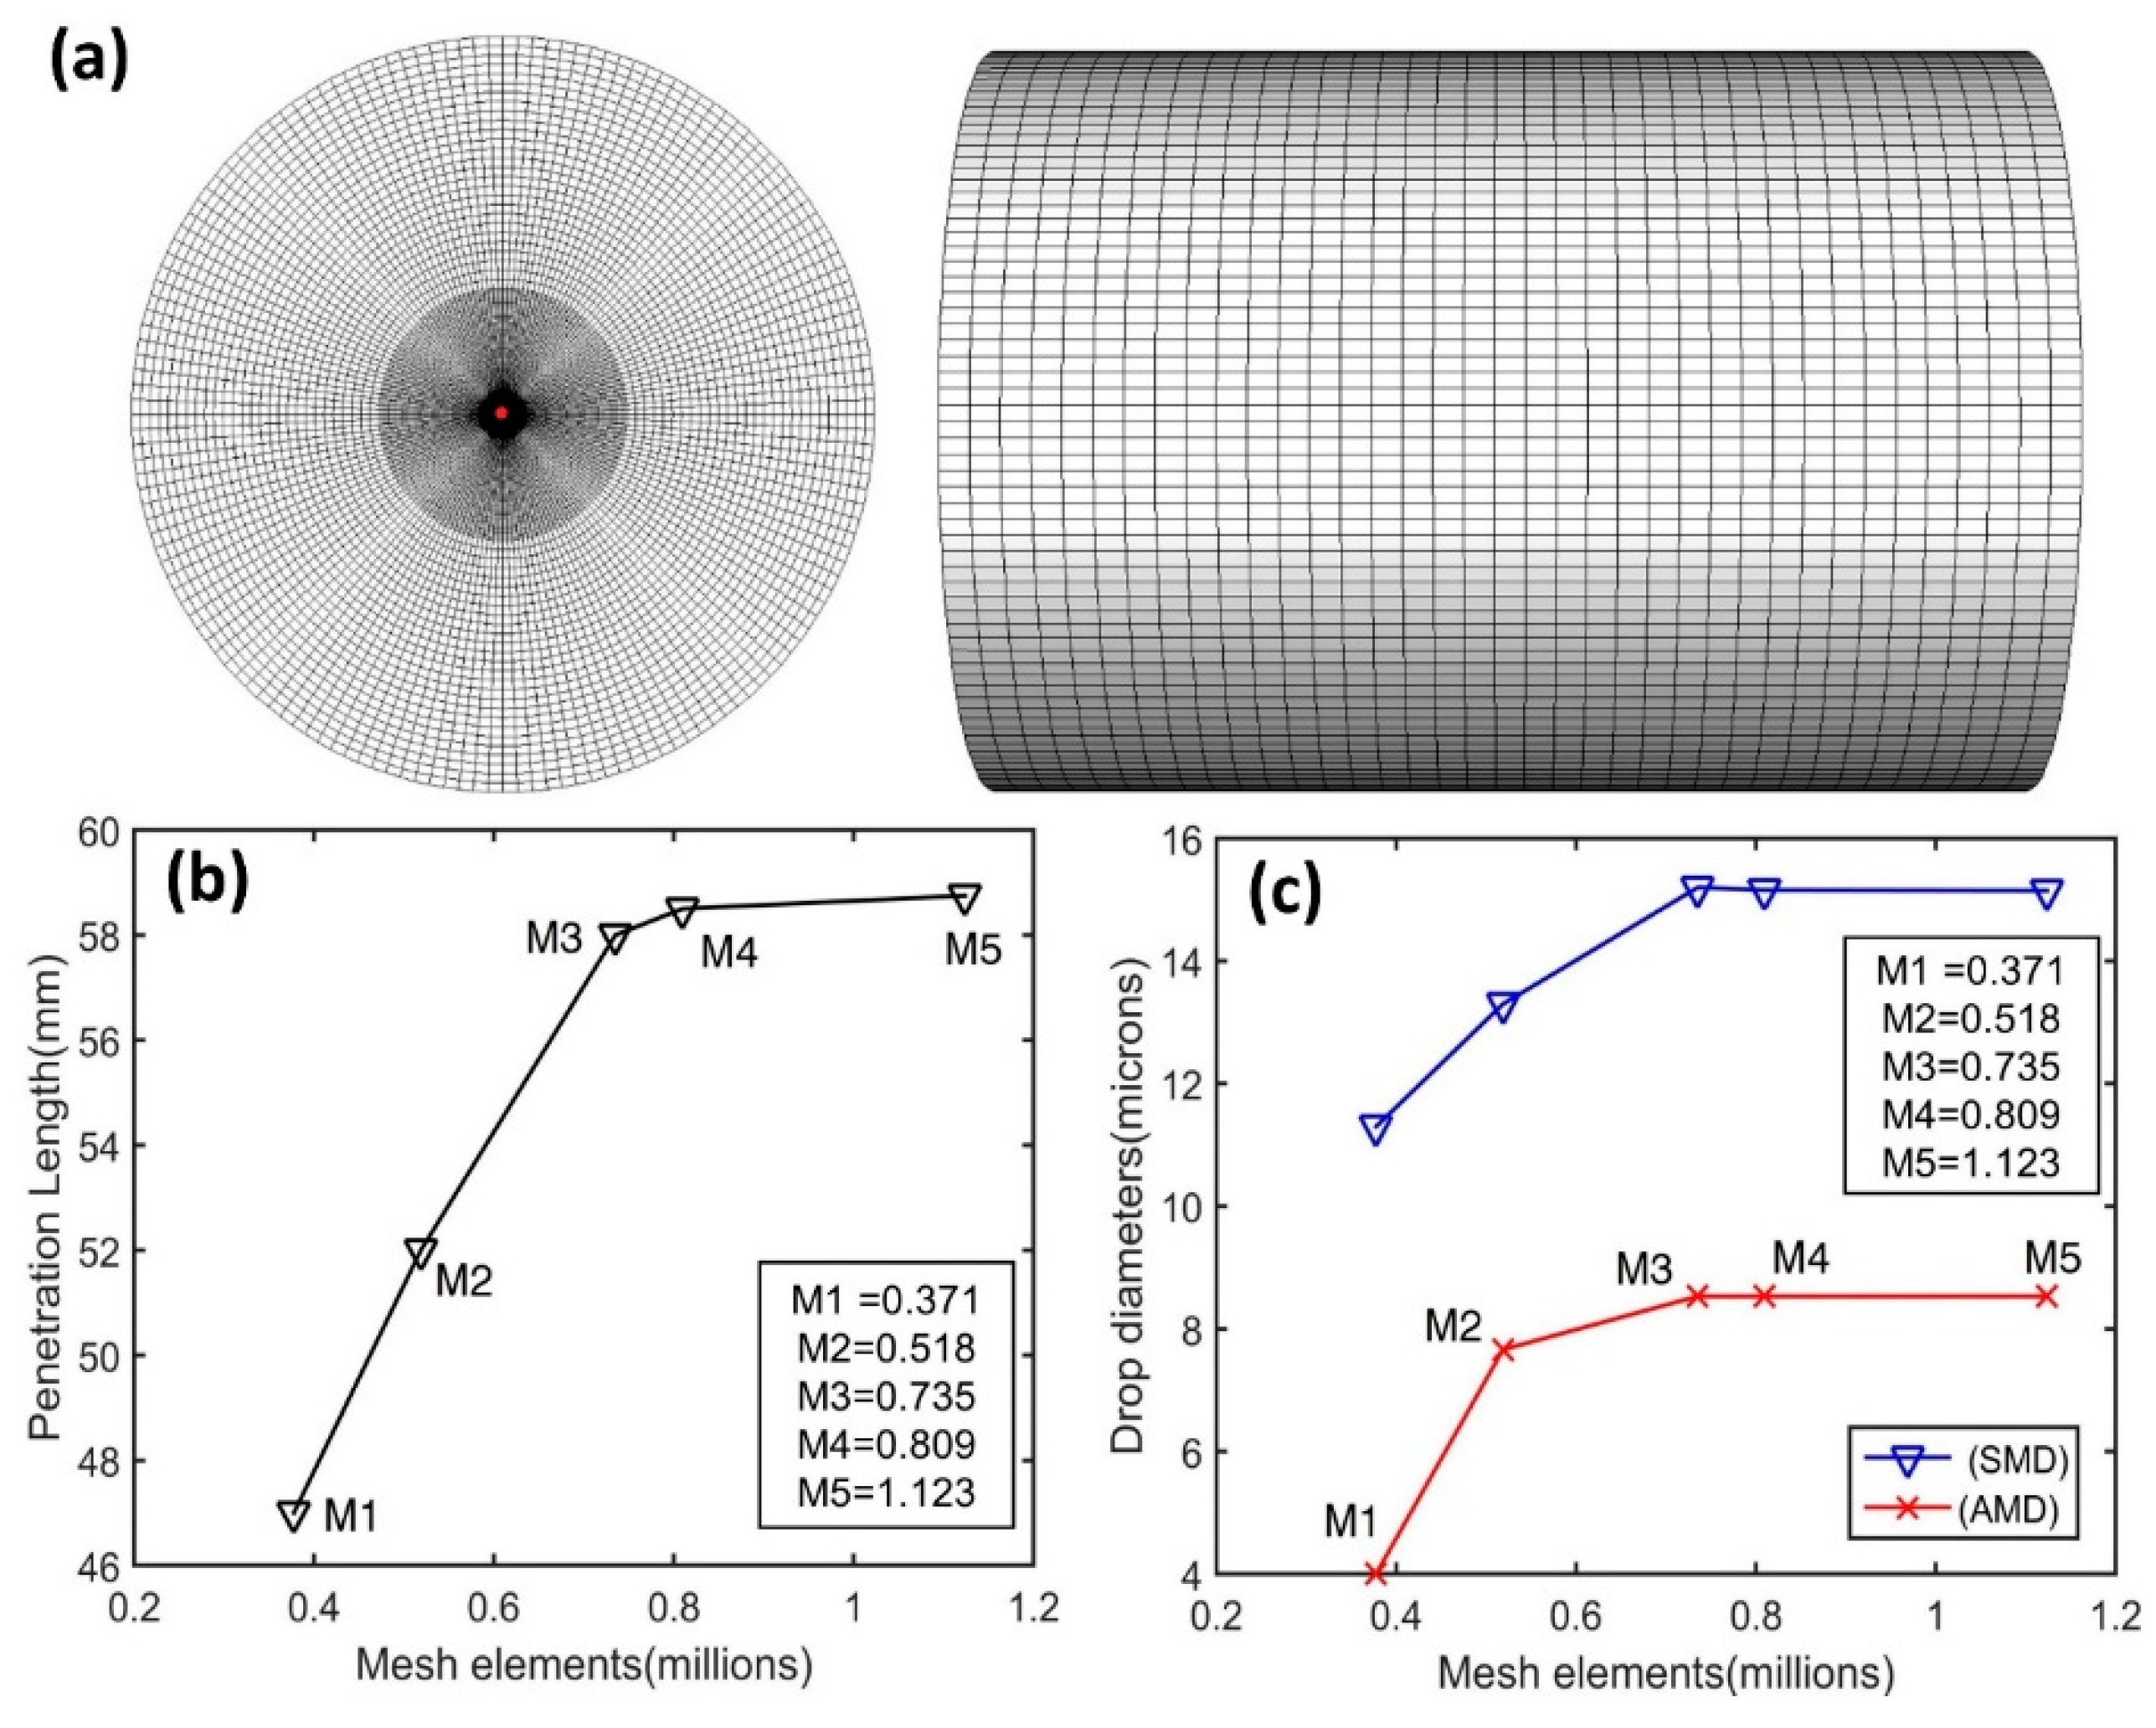
Structured mesh was used, which becomes finer as we move from the periphery to the center of the cylinder. The injection takes place in the center of the left face marked by the red dot in Figure 4a. Only one jet of the spray is simulated, which is sufficient to study the spray characteristics and simplifies the modelling process. Five different mesh sizes were used for the mesh study. Figure 4b,c show that the results were independent of mesh size after M3, which has 0.753 million cells; hence, it was used for the spray simulations.

4. Experimental Setup

The experimental setup consists of the spray visualization and fuel injection schemes, as seen in Figure 5. The spray visualization setup consists of a control volume vessel (CVV) with three windows for flow illumination and visualization. A pressure gauge and two valves are mounted on top for the pressurizing and draining of the CVV. Side windows were used for illuminating the spray field using two led lights of 100 W each, and the images were captured from the bottom window with a high-speed camera capable of capturing 1000 frames per second. The fuel was injected at high pressure with the help of an injection pump through a common rail injection system. The IP was varied by controlling the motor speed that drives the fuel injection pump.
A six-hole Denso injector was used to study the fuel spray characteristics with hole diameters of 0.25 mm each. The injector was controlled by the injector driver CR 1000, the width of the pulse was 600, and the frequency was 10 Hz. The operating conditions for the numerical and experimental investigations are detailed in Table 1. The spray characteristics at room temperature were observed at three different injection and ambient pressures.
The fuel properties and blending ratios of diesel (D100), jatropha, and castor biodiesel are shown in Table 2. The diesel was purchased from Pakistan State Oil (2022), Rawalpindi, with a Euro 5 standard. The castor oil was purchased from a local oil mill in Multan, Pakistan. The Jatropha oil was extracted using mechanical pressing. The biodiesel was produced using transesterification. The spray characteristics of the JB-20 and CB-20 biofuels were then compared to diesel. Among the three fuels, CB-20 had the highest viscosity, density, and surface tension followed by JB-20 and diesel fuel.

Image Processing

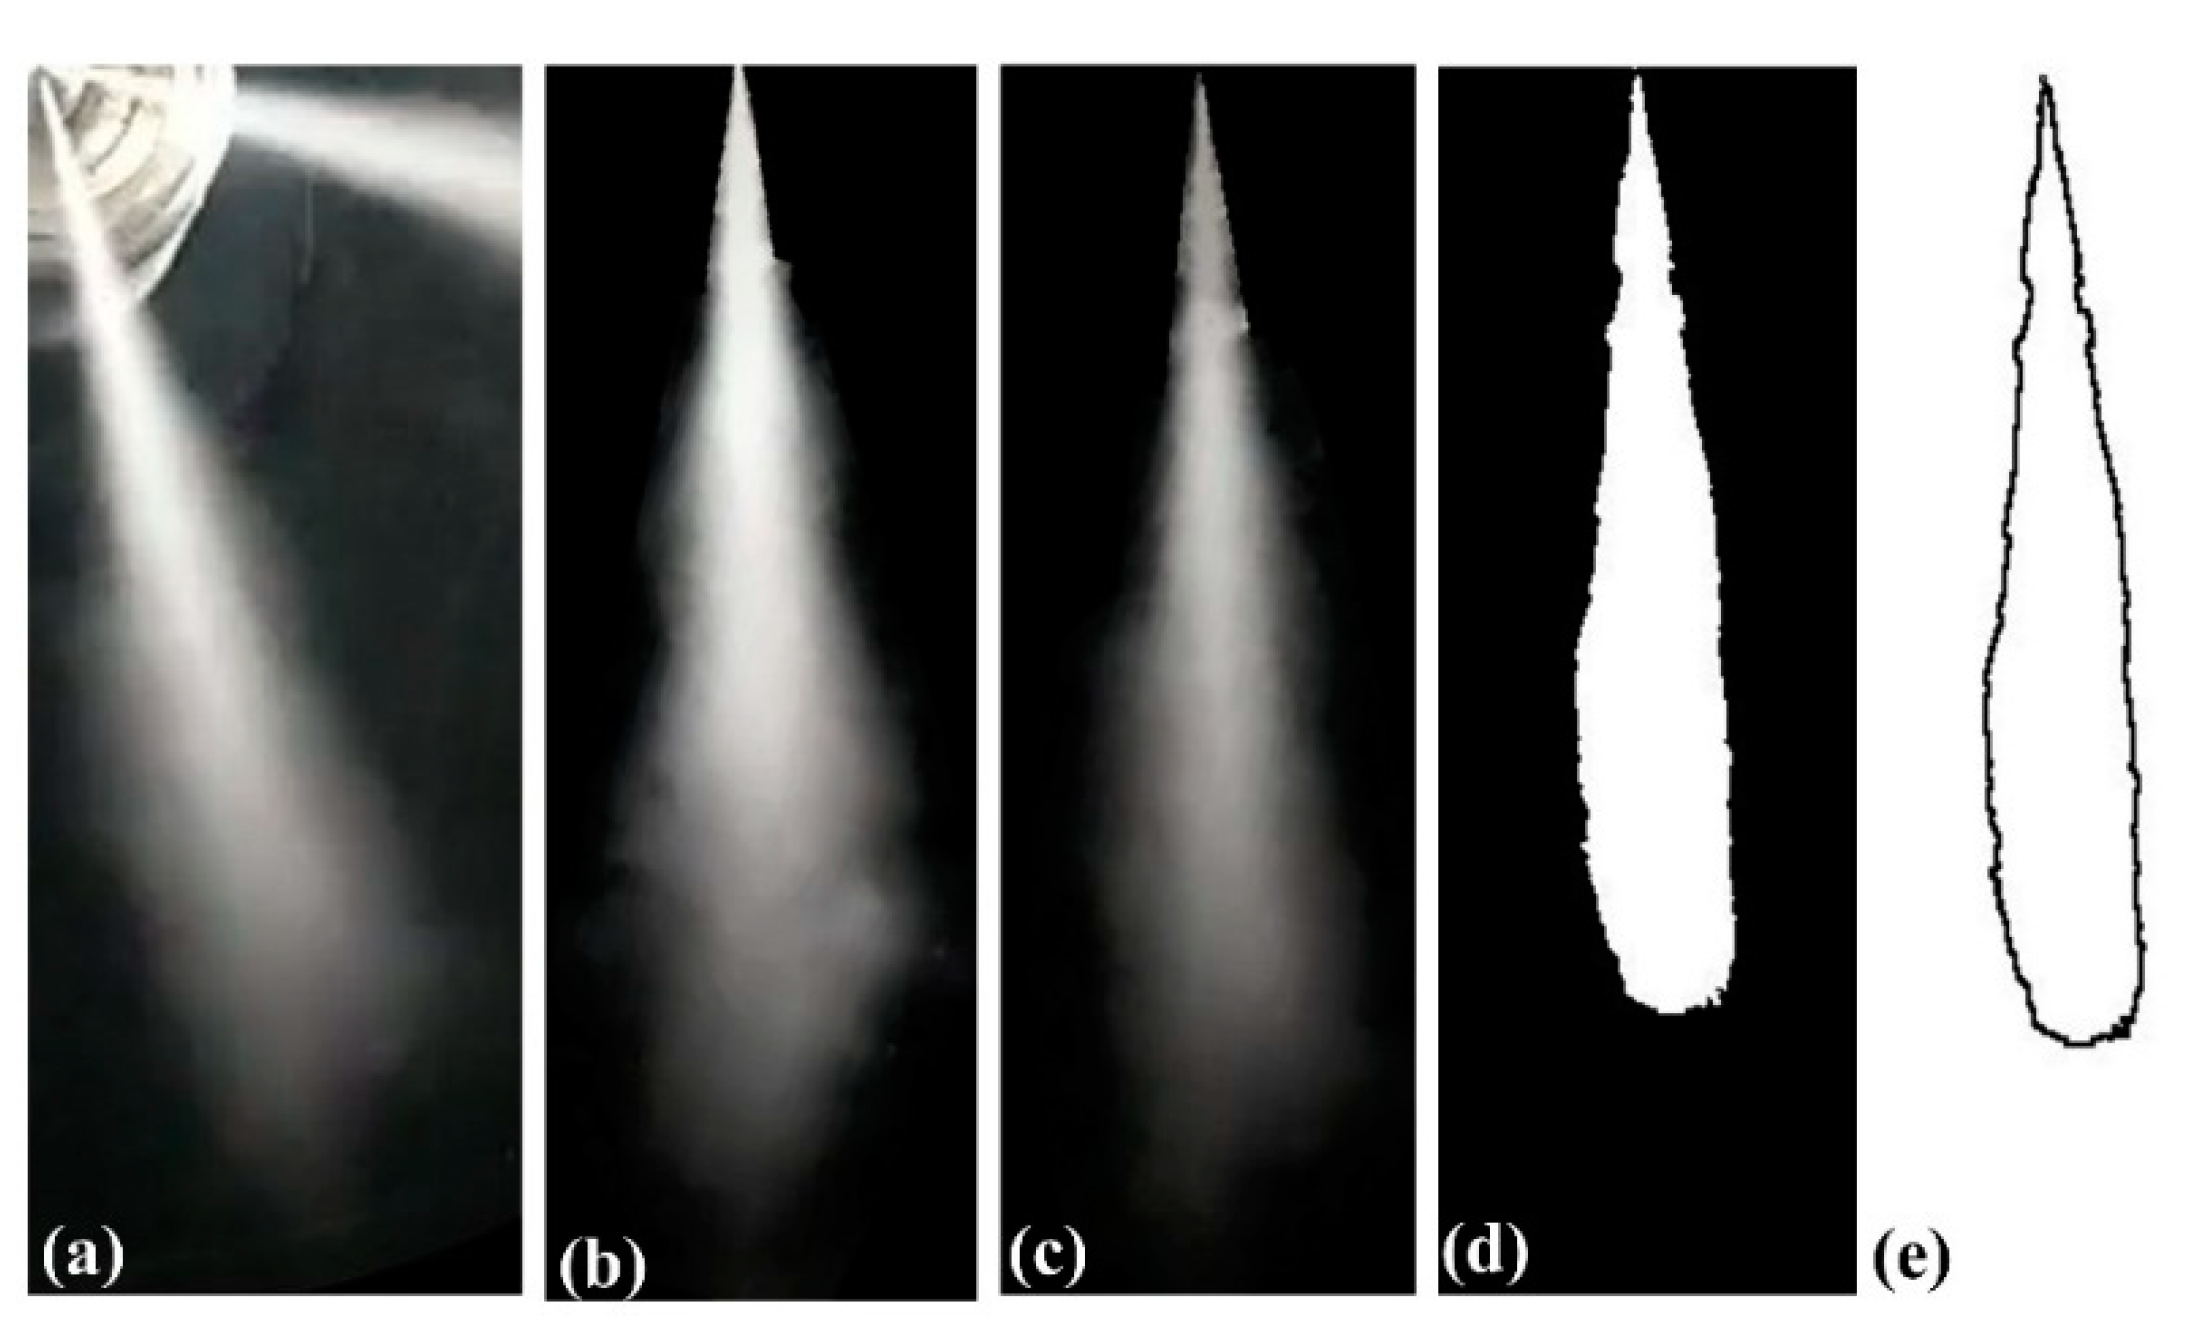
The fuel spray was captured in the CVV. To analyze the captured raw images, it is necessary to separate the spray area using image processing. The sequence of steps for image processing are detailed in Figure 6. The raw images were captured by the camera and analyzed by ImageJ software in three stages to quantify the macroscopic spray characteristics. First, the background was removed, and the figure was cropped and rotated (Figure 6b). It was then converted to grayscale and a binary image, as shown in Figure 6c,d, respectively. The spray outline (edge) was determined from the binary image (Figure 6d,e) using edge detection to obtain the final image used to measure the spray properties. Finally, the pixels at the edge of this image were identified to quantify spray characteristics such as the PL and SCA.

5. Results

5.1. Comparison of Breakup Models

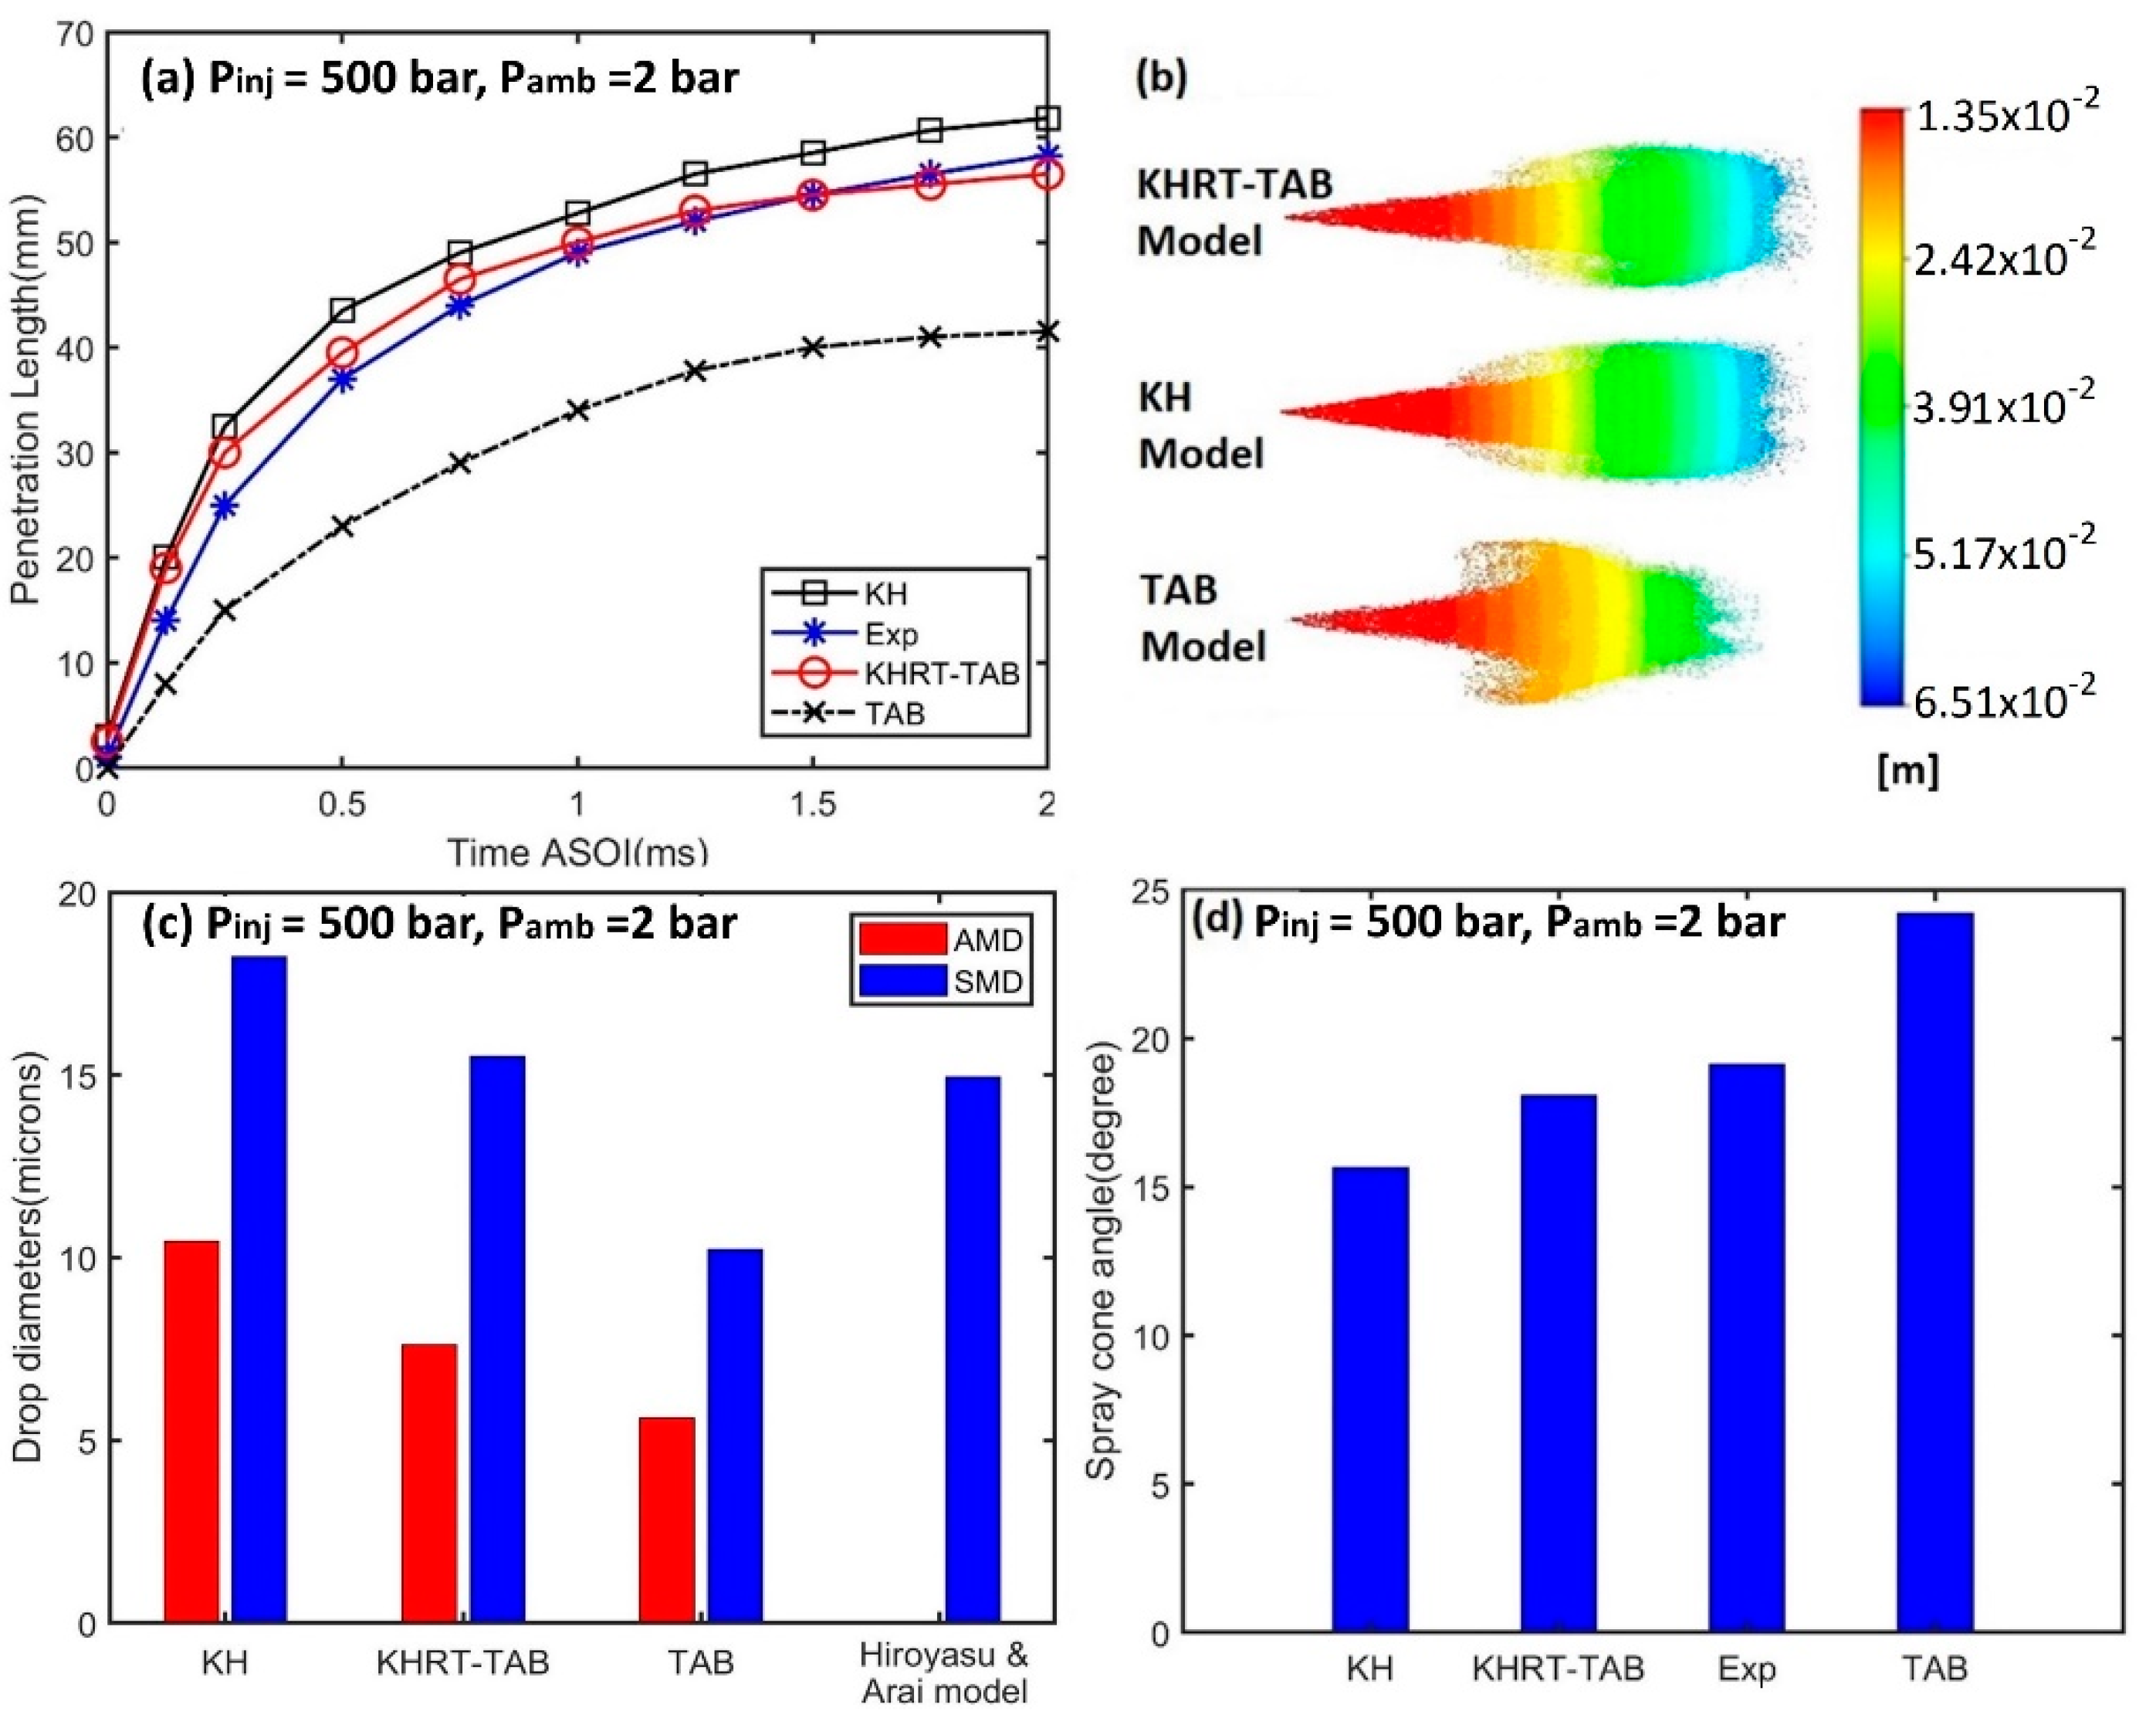
Three different breakup models were used for analyzing the fuel spray behavior of diesel. Figure 7a,b demonstrate that the greatest PL was for the KH model as it did not include the effect of secondary breakup. The KHRT–TAB model showed a reduced PL compared to the KH model due to the inclusion of Rayleigh–Taylor (RT) instabilities, which are induced when one fluid accelerates into another fluid causing the generation of waves in the interface. This led to liquid breakup producing more child droplets with smaller diameters. The droplet distortion leading up to the breakup is mediated by the TAB model. However, the TAB model alone showed the lowest PL because of the wide cone angle and small droplet size that reduced the penetration into the ambient atmosphere.
Figure 7c shows the comparison of the drop diameters for various breakup models with the Hiroyasu and Arai Model [54]. The smallest drop size was observed for the TAB model followed by the KHRT–TAB and KH models. Greater drop diameters for the KH model were observed because it only catered to the primary breakup and, hence, over predicted the droplet sizes. The TAB model showed the smallest drop sizes as the mode of breakup for the TAB model was uniform near and far from the nozzle unlike the KHRT and KH models. The TAB model only mediated the single mode of oscillation, with no other mode to counter that breakup phenomenon. The greatest spray cone angle (SCA) was observed for the TAB model, which was almost 24.6° as shown in Figure 7d, while the lowest SCA was observed for the KH model. Finally, the KHRT–TAB model showed good agreement between the SCA and SMD as compared to the experimental results and the analytical model [54], respectively. Hence, it was used for the simulations in the subsequent sections to compare microscopic properties.

5.2. Penetration Length

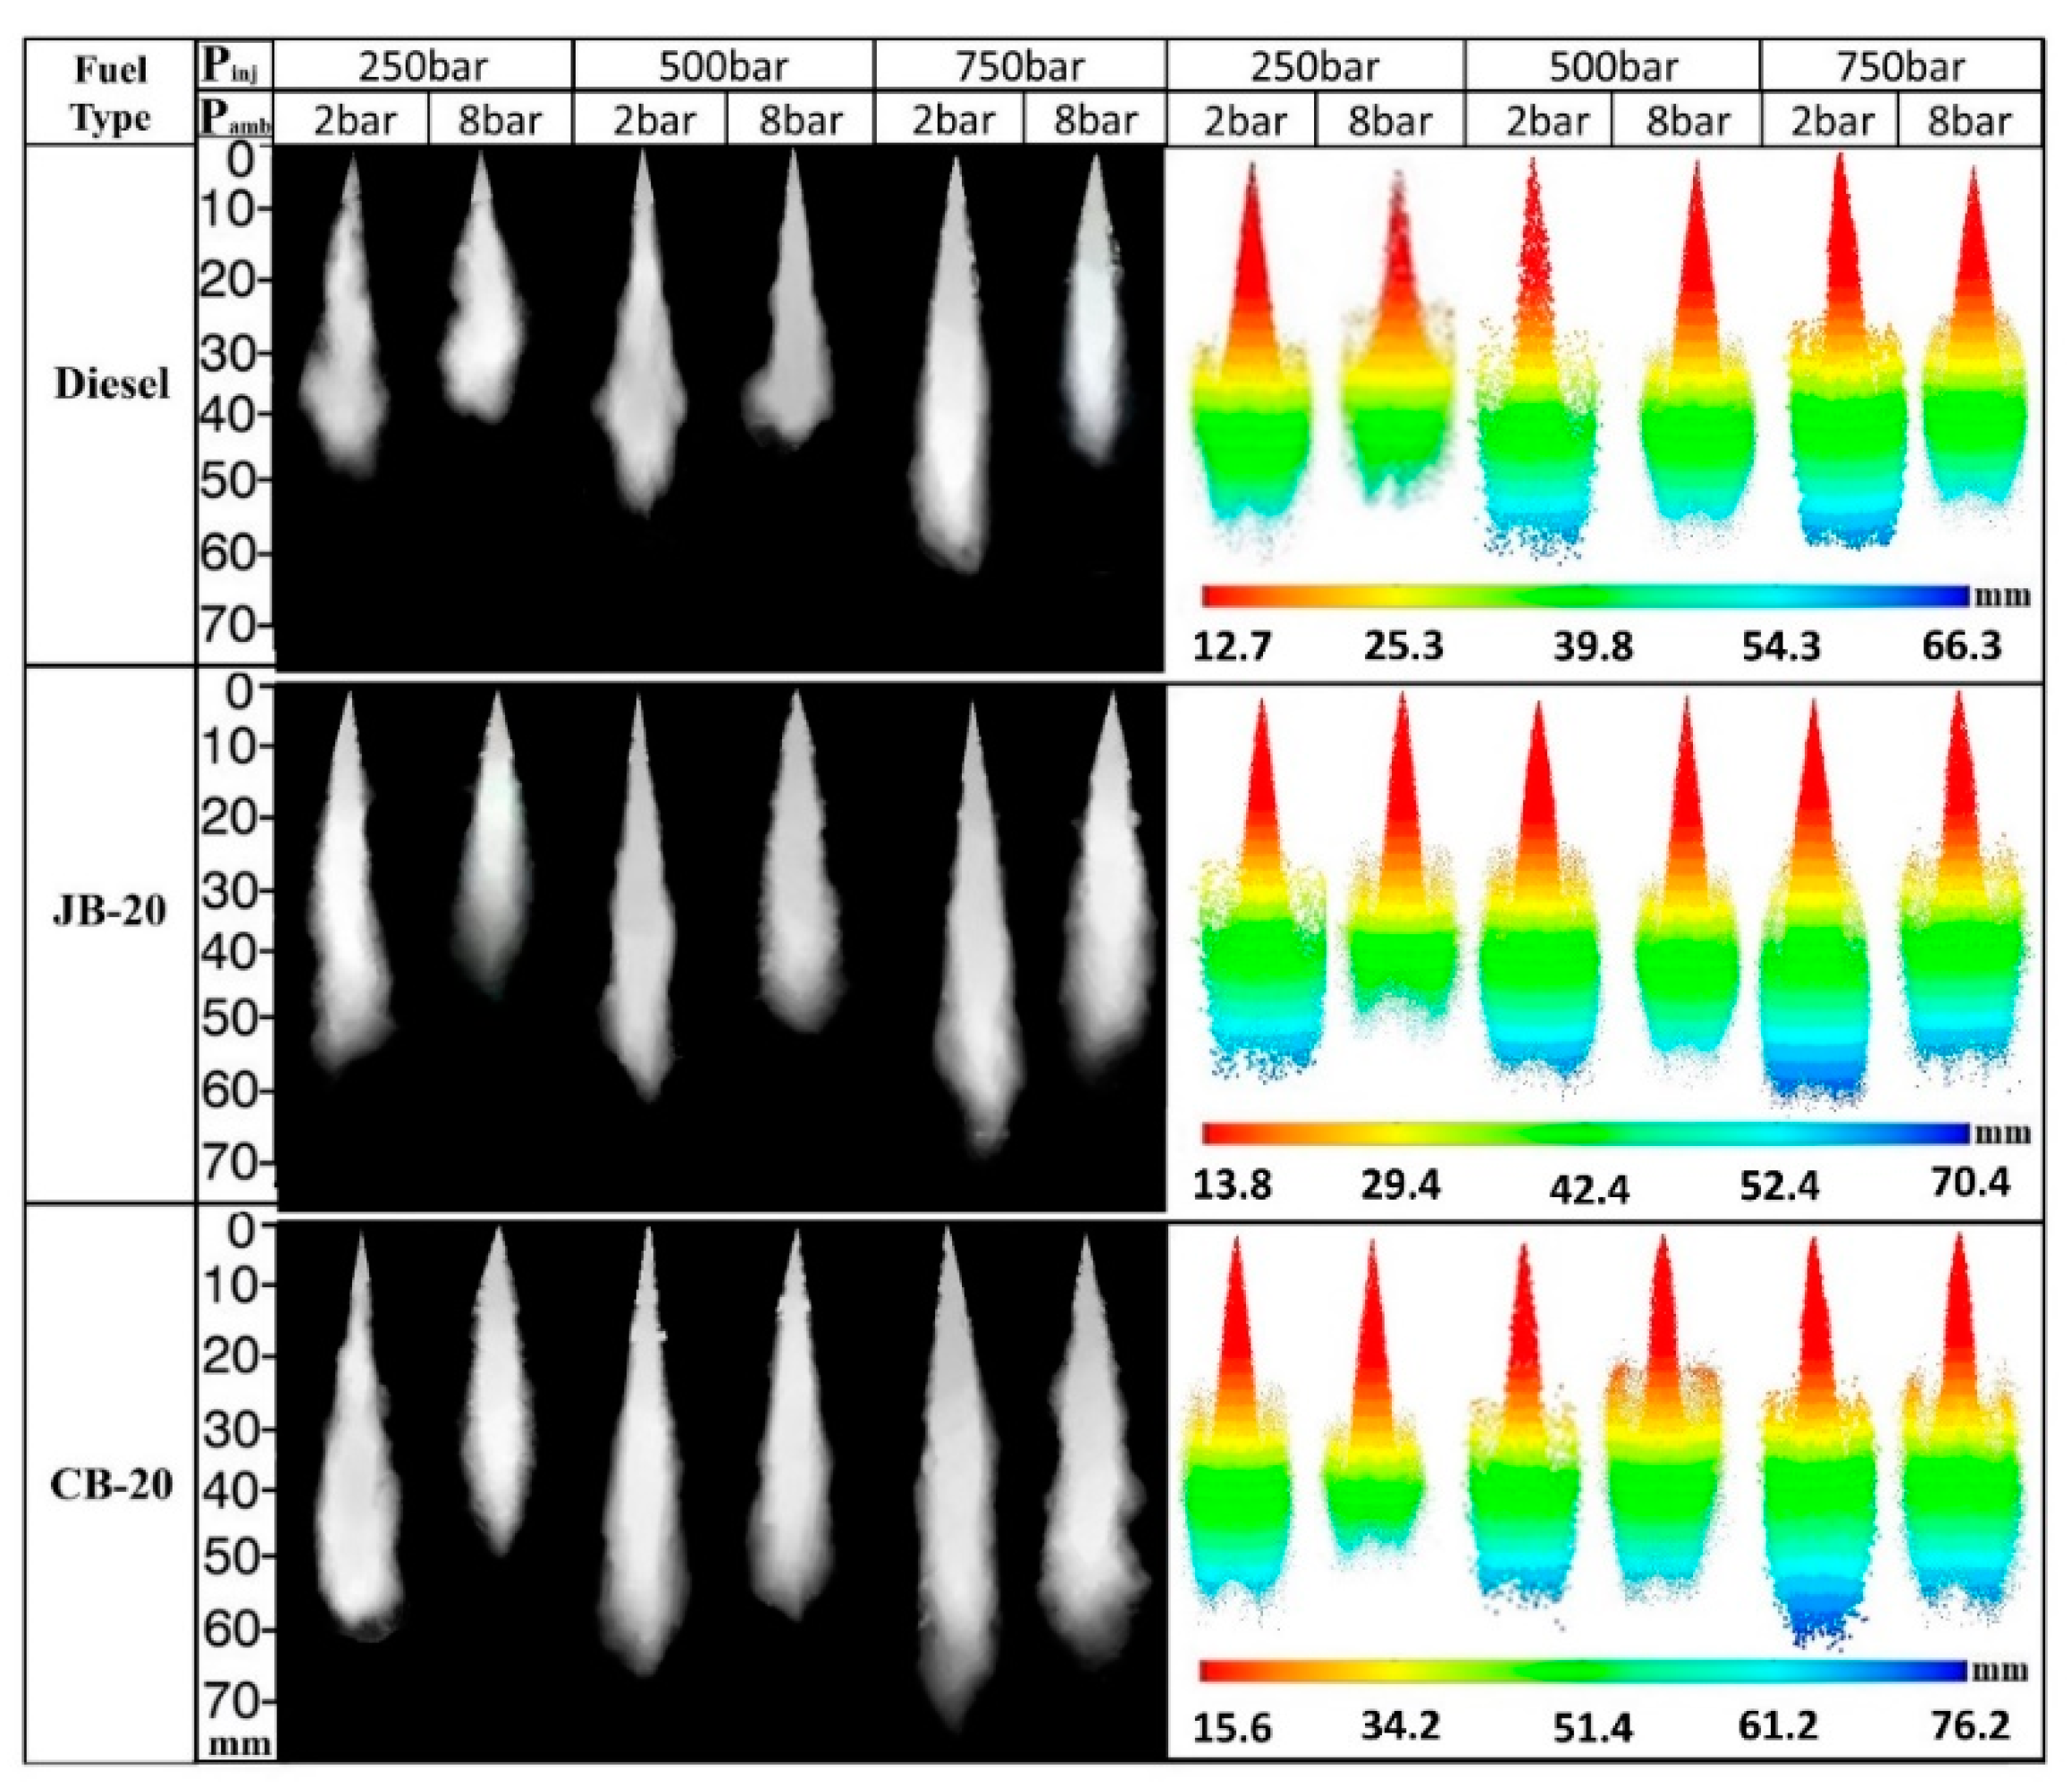
Figure 8 shows the comparison of the simulated and experimental results for three different injection and 2-bar ambient pressures. As observed, the simulation accurately matches the experimental data. The effect of the injection and ambient pressure on the PL is depicted in Figure 9a–c. Increasing the ambient pressure had a negligible effect on the PL at the initial stages of the spray. This is because the spray is quite dense in the beginning and the IPs are much higher in comparison to the ambient pressure. Thus, the effect of ambient pressure may be neglected. After the initial stage, however, the spray becomes thinner and dilutes because of the liquid breakup. The effects of the aerodynamic forces and the ambient condition then increase gradually. The incoming fuel experiences higher drag at this stage because of the increased probability of drop collision in the diluted region of the spray. The higher ambient pressure yielded higher ambient densities that led to greater drag force. Hence, the penetration length decreased remarkably after the initial stage. Under similar operating conditions, CB-20 showed the greatest PL because of its higher density and viscosity compared to JB-20 and diesel. The viscous fuels were less affected by the drag force, whereby the breakup process was reduced. Moreover, the higher density caused greater momentum, allowing the fuel to penetrate farther. Among both biodiesels, the PL for JB-20 was closer to diesel because the differences among the viscosity and density were less in comparison to CB-20.
Increasing the mass flow rate and injection duration increased the momentum of the fuel that was injected from the nozzle hole, which in turn increased the PL. Figure 9d shows the penetration length at 500-bar IP and 2-bar ambient pressures at three different injection durations and mass flow rates for diesel fuel. It was observed that the injection duration had a negligible effect on the PL at the start of injection until 0.25 ms. This is because at the initial stage, the PL entirely depends upon the velocity at the exit of the nozzle and the same IP yields the same jet velocity. After the initial stage, the injection duration started to affect the PL, as a longer injection duration caused more fuel to exit the nozzle and the higher momentum of the fuel caused the jet to penetrate further. For the shorter injection durations, the spray momentum was not enough to assist the further penetration of fuel. Thus, longer penetrations were observed for 2.5 ms, followed by 2 ms and 1.5 ms. For much shorter injection durations, the aerodynamic resistance is much more significant, which caused shorter penetration lengths.

5.3. Drop Diameter

The Sauter mean diameter is the most critical parameter used to assess the quality of spray. It gives a global description of the drop diameter in terms of the drop volume and surface area. Figure 10a,b reveal that increasing the IP and ambient pressure decreased the SMD and AMD. A high IP led to a higher injection velocity and greater turbulence, while the higher ambient densities offered greater drag towards the incoming fuel. Both cases enhanced the liquid breakup process and yielded smaller droplet diameters for the biodiesel and diesel fuels. This caused improved atomization and evaporation, which are favorable for combustion. CB-20 showed the largest SMD and AMD among the three fuels owing to its higher viscosity and surface tension in comparison to the other fuels. Higher viscosity retards the drop breakup phenomenon and decreases the atomization quality. The drop diameter for JB-20 was almost mid-way between CB-20 and diesel, which is in accordance with the physical properties of the tested fuels. At IPs of 250 and 500 bar, the droplet size variation was more prominent. However, at an IP of 750 bar, the variation in the droplet diameters was greatly reduced in terms of both the ambient pressure and fuel type. Hence, the mean diameter was less affected by the individual large droplets. The SMD was not greatly affected by the individual droplets compared to the AMD. That is why it is mostly used to assess atomization performance. The comparison of these droplets provides a better understanding of the drop size distribution within the computational domain.
Figure 10c,d show the SMD and AMD at various axial locations in the spray regime. Greater drop diameters were observed closer to the nozzle at the axial distance of 5 mm because the spray was dense at this distance and the effect of ambient pressure was not significant. Afterwards, as the drops moved further, the spray became less dense, and the drops were influenced by the ambient pressure. Hence, the drop diameter decreased and almost remained constant up to 40 mm. At the farthest position, a slight increase was observed because of the large droplets present at the tip of the spray. They possessed higher mass to surface area ratios and were more resistant to drag force. Thus, the large droplets readily penetrate the gas phase.

5.4. Spray Cone Angle

A greater SCA was observed at higher ambient pressure, as seen in Figure 11a, because of the greater drag offered to the fuel jet. This slows the axial movement of the jet and causes it to spread radially. A wider SCA was observed for diesel followed by JB-20 and CB-20. Owing to the reduced viscosity and density of diesel, it was more affected by the drag force. Hence, the drop spread in the radial direction was more than that of the biodiesels. Figure 11b shows the variation in the cone angle with respect to time after the start of injection at a 500-bar IP. As the injection started, the cone angle increased rapidly and reached its maximum value and then dropped and became stable after a slight variation at the start of the injection. The SCA was almost insensitive to the change in the IP. However, the ambient pressure, nozzle geometry, and in-nozzle flow parameters had a prominent effect compared to the IP and physical properties of the fuel.

5.5. Spray Area

Figure 12a,b show the spray area with respect to time after start of injection at 500- and 750-bar Ips, respectively. It was observed that higher injection and ambient pressures caused greater spray areas because a higher amount of drag was offered in the case of each fuel. The exchange of momentum between the droplets and compressed air was more intense. This enhanced the disintegration process and a greater number of droplets was formed; hence, the spray area was increased.
CB-20, with the highest viscosity and surface tension, underwent the least amount of drop disintegration and thus showed the smallest spray area for every tested condition. The spray area for JB-20 was in between diesel and CB-20. Diesel showed the maximum spray area because of the wider SCA and smaller drop sizes owing to its lowest viscosity and density among the tested fuels. The differences among the spray areas for the three fuels reduced at a 750-bar IP. The effect of the injection and ambient pressures was more prominent for the spray area than the fuel type.

6. Conclusions

An integrated numerical and experimental study was carried out to analyze the macroscopic and microscopic spray characteristics of diesel, castor, and jatropha biodiesels for a single-hole nozzle with a common rail injection system. The DPM model along with various sub models were used to ensure realistic spray simulations. The effects of various injection and ambient conditions on the fuel spray characteristics were studied. The results revealed that a longer penetration length was obtained with the KH breakup model as it did not correspond to the secondary breakup of the liquid jet. The KH’s breakup occurred close to the nozzle that governs the primary breakup while the RT’s breakup corresponded to the secondary breakup and caused a reduction in the PL for the KHRT–TAB model. Moreover, the fuel PL was dependent on the initial IP and the back pressure in an engine cylinder. Higher injection velocities were induced because of higher Ips; however, at a higher back pressure, the deceleration rate was higher, and the fuel penetration was reduced. Increasing the mass flow rate and injection duration had a positive effect on the penetration length, while increasing the cone angle decreased the penetration length. Increasing the ambient pressure had a pronounced effect by decreasing the SMD and AMD due to the increased drag faced by the incoming fuel jet. Finally, the smallest droplet sizes were obtained using the KHRT–TAB model because of the additional effect of RT instabilities and the drop distortion parameter as it provided a better estimation of the fuel spray properties compared to the other models.
Hence, the physical properties of fuel produce a significant effect on spray behavior. The higher viscosity, surface tension, and density of CB-20 and JB-20 caused longer PL, larger drop diameters, narrower SCA, and reduced spray areas compared to diesel.
This study could be beneficial to researchers simulating spray behavior including the effect of in-nozzle flow and nozzle geometry to account for the swirling action of air and the piston dynamics at high ambient temperatures using novel biodiesel fuel blends and additives.

Author Contributions

Conceptualization, M.u.H. and A.T.J.; methodology, M.u.H. and A.T.J.; software, M.u.H., M.S.A. and T.A.C.; validation, T.A.C. and N.A.; investigation, M.u.H. and M.J.; resources, S.A.; writing—original draft preparation, M.u.H.; writing—review and editing, M.u.H., A.T.J., M.J. and N.A.; visualization, S.A.; supervision, A.T.J. and T.A.C. All authors have read and agreed to the published version of the manuscript.

Funding

This research received no external funding.

Data Availability Statement

The data presented in this study are available on request from the corresponding author.

Conflicts of Interest

The authors declare no conflict of interest.

Nomenclature

IPInjection pressure
TABTaylor Analogy Breakup
KHRTKelvin–Helmholtz and Rayleigh–Taylor
AMDAverage mean diameter
SMDSauter mean diameter
PMParticulate matter
UHCUnburned hydrocarbons
COCarbon monoxide
NOxNitrogen oxides
PLPenetration length
SCASpray cone angle
CVVControl volume vessel
JB-100100% Jatropha biodiesel
CB-100100% Castor biodiesel
JB-20 20% Jatropha biodiesel and 80% diesel
CB-2020% Castor biodiesel & 80% diesel
CaMECastor methyl esters
KHACTKelvin–Helmholtz aerodynamic cavitation turbulence
EACTEnhanced aerodynamic cavitation turbulence
LISALinearized instability sheet atomization
ΛKHMaximum wavelength
ΩKHGrowth rate
ΩRTFrequency of the fastest growing wave
ρ Density
u i Velocity in i direction
τ ¯ Shear Stresses
F Body Force
E Total energy
k Rate of production of kinetic energy
k t Kinetic energy production rate due to turbulence
h j Enthalpy
J j Diffusion Flux
μ Viscosity
μ t Turbulent Viscosity
σ k   , σ ε   Prandtl numbers for k and ε
G k Production of k t because of mean velocity gradients
S e , S k ,   S ε   User-defined source terms
YM Fluctuating dilation factor

References

  1. Gao, Y.; Deng, J.; Li, C.; Dang, F.; Liao, Z.; Wu, Z.; Li, L. Experimental study of the spray characteristics of biodiesel based on inedible oil. Biotechnol. Adv. 2009, 27, 616–624. [Google Scholar] [CrossRef] [PubMed]
  2. Fu, W.; Song, L.; Yi, B.; Liu, T.; Li, F.; Lin, Q. Experimental and theoretical analysis of the spray characteristics of a high-pressure common-rail injection system fueled with neat biodiesel, ethanol-biodiesel blends, and neat diesel fuel. J. Energy Eng. 2017, 143, 04017060. [Google Scholar] [CrossRef]
  3. Nirmala, N.; Dawn, S.S.; Harindra, C. Analysis of performance and emission characteristics of Waste cooking oil and Chlorella variabilis MK039712.1 biodiesel blends in a single cylinder, four strokes diesel engine. Renew. Energ. 2020, 147, 284–292. [Google Scholar] [CrossRef]
  4. Nabi, M.N.; Rasul, M.G. Influence of second generation biodiesel on engine performance, emissions, energy and exergy parameters. Energy Convers. Manag. 2018, 169, 326–333. [Google Scholar] [CrossRef]
  5. Asokan, M.A.; Senthur Prabu, S.; Bade, P.K.K.; Nekkanti, V.M.; Gutta, S.S.G. Performance, combustion and emission characteristics of juliflora biodiesel fuelled DI diesel engine. Energy 2019, 173, 883–892. [Google Scholar] [CrossRef]
  6. Zhong, W.; Tamilselvan, P.; Wang, Q.; He, Z.; Feng, H.; Yu, X. Experimental study of spray characteristics of diesel/hydrogenated catalytic biodiesel blended fuels under inert and reacting conditions. Energy 2018, 153, 349–358. [Google Scholar] [CrossRef]
  7. Yu, S.; Yin, B.; Deng, W.; Jia, H.; Ye, Z.; Xu, B.; Xu, H. Experimental study on the diesel and biodiesel spray characteristics emerging from equilateral triangular orifice under real diesel engine operation conditions. Fuel 2018, 224, 357–365. [Google Scholar] [CrossRef]
  8. Yu, S.; Yin, B.; Jia, H.; Wen, S.; Li, X.; Yu, J. Theoretical and experimental comparison of internal flow and spray characteristics between diesel and biodiesel. Fuel 2017, 208, 20–29. [Google Scholar] [CrossRef]
  9. Das, M.; Sarkar, M.; Datta, A.; Santra, A.K. Study on viscosity and surface tension properties of biodiesel-diesel blends and their effects on spray parameters for CI engines. Fuel 2018, 220, 769–779. [Google Scholar] [CrossRef]
  10. Xie, H.; Song, L.; Xie, Y.; Pi, D.; Shao, C.; Lin, Q. An experimental study on the macroscopic spray characteristics of biodiesel and diesel in a constant volume chamber. Energies 2015, 8, 5952–5972. [Google Scholar] [CrossRef]
  11. Ulu, A.; Yildiz, G.R.; Rodriguez, A.D.; Özkol, U. Spray Analysis of Biodiesels Derived from Various Biomass Resources in a Constant Volume Spray Chamber. ACS Omega 2022, 7, 19365–19379. [Google Scholar] [CrossRef]
  12. Mohan, B.; Yang, W.; Tay, K.L.; Yu, W. Experimental study of spray characteristics of biodiesel derived from waste cooking oil. Energy Convers. Manag. 2014, 88, 622–632. [Google Scholar] [CrossRef]
  13. Patel, C.; Lee, S.; Tiwari, N.; Agarwal, A.K.; Lee, C.S.; Park, S. Spray characterization, combustion, noise and vibrations investigations of Jatropha biodiesel fuelled genset engine. Fuel 2016, 185, 410–420. [Google Scholar] [CrossRef]
  14. Lee, S.; Lee, C.S.; Park, S.; Gupta, J.G.; Maurya, R.K.; Agarwal, A.K. Spray characteristics, engine performance and emissions analysis for Karanja biodiesel and its blends. Energy 2017, 119, 138–151. [Google Scholar] [CrossRef]
  15. Agarwal, A.K.; Som, S.; Shukla, P.C.; Goyal, H.; Longman, D. In-nozzle flow and spray characteristics for mineral diesel, Karanja, and Jatropha biodiesels. Appl. Energy 2015, 156, 138–148. [Google Scholar] [CrossRef] [Green Version]
  16. Sathiyamoorthi, R.; Sankaranarayanan, G.; Munuswamy, D.B.; Devarajan, Y. Experimental study of spray analysis for Palmarosa biodiesel-diesel blends in a constant volume chamber. Environ. Prog. Sustain. Energy 2021, 40, e13696. [Google Scholar] [CrossRef]
  17. Bohl, T.; Tian, G.; Smallbone, A.; Roskilly, A.P. Macroscopic spray characteristics of next-generation bio-derived diesel fuels in comparison to mineral diesel. Appl. Energy 2017, 186, 562–573. [Google Scholar] [CrossRef]
  18. Cai, G.; Abraham, J. Multidimensional simulations of non-reacting and reacting diesel and biodiesel sprays. Energy 2017, 119, 1221–1229. [Google Scholar] [CrossRef]
  19. Battistoni, M.; Grimaldi, C.N. Numerical analysis of injector flow and spray characteristics from diesel injectors using fossil and biodiesel fuels. Appl. Energy 2012, 97, 656–666. [Google Scholar] [CrossRef]
  20. Som, S.; Longman, D.E.; Ramírez, A.I.; Aggarwal, S.K. A comparison of injector flow and spray characteristics of biodiesel with petrodiesel. Fuel 2010, 89, 4014–4024. [Google Scholar] [CrossRef]
  21. Moon, S. Novel insights into the dynamic structure of biodiesel and conventional fuel sprays from high-pressure diesel injectors. Energy 2016, 115, 615–625. [Google Scholar] [CrossRef]
  22. Ogunniyi, D.S. Castor oil: A vital industrial raw material. Bioresour. Technol. 2006, 97, 1086–1091. [Google Scholar] [CrossRef] [PubMed]
  23. Keera, S.T.; El Sabagh, S.M.; Taman, A.R. Castor oil biodiesel production and optimization. Egypt. J. Pet. 2018, 27, 979–984. [Google Scholar] [CrossRef]
  24. Azad, A.K.; Rasul, M.G.; Khan, M.M.K.; Sharma, S.C.; Mofijur, M.; Bhuiya, M.M.K. Prospects, feedstocks and challenges of biodiesel production from beauty leaf oil and castor oil: A nonedible oil sources in Australia. Renew. Sustain. Energy Rev. J. 2016, 61, 302–318. [Google Scholar] [CrossRef]
  25. Som, S.; Aggarwal, S.K. Effects of primary breakup modeling on spray and combustion characteristics of compression ignition engines. Combust. Flame 2010, 157, 1179–1193. [Google Scholar] [CrossRef]
  26. Fu, W.; Li, F.; Meng, K.; Liu, Y.; Shi, W.; Lin, Q. Experiment and analysis of spray characteristics of biodiesel blending with di-n-butyl ether in a direct injection combustion chamber. Energy 2019, 185, 77–89. [Google Scholar] [CrossRef]
  27. Zhang, J.; Fang, T. Spray Combustion of Biodiesel and Diesel in a Constant Volume Combustion Chamber. SAE Tech. Pap. 2011, 2011-011380. [Google Scholar] [CrossRef]
  28. Baumgarten, C. Mixture Formation in Internal Combustion Engines; Springer Science & Business Media: Berlin/Heidelberg, Germany, 2006. [Google Scholar]
  29. Som, S.; Aggarwal, S.K.; El-Hannouny, E.; Longman, D. Investigation of nozzle flow and cavitation characteristics in a diesel injector. J. Eng. Gas Turbines Power 2010, 132, 042802. [Google Scholar] [CrossRef]
  30. Zeidi, S.J.; Dulikravich, G.S.; Reddy, S.R.; Darvish, S. Effects of needle lift and fuel type on cavitation formation and heat transfer inside diesel fuel injector nozzle. In Proceedings of the CHT-17 ICHMT International Symposium on Advances in Computational Heat Transfer, Napoli, Italy, 28 May–1 June 2017. [Google Scholar]
  31. Chaudhari, V.; Kulkarni, A.; Deshmukh, D. Spray characteristics of biofuels for advance combustion engines. Cleaner Eng. Technol. 2021, 5, 100265. [Google Scholar] [CrossRef]
  32. Park, S.H.; Kim, H.J.; Lee, C.S. Comparison of experimental and predicted atomization characteristics of high-pressure diesel spray under various fuel and ambient temperature. J. Mech. Sci. Technol. 2010, 24, 1491–1499. [Google Scholar] [CrossRef]
  33. Ghasemi, A.; Djavareshk, M. Investigation of the effects of natural gas equivalence ratio and piston bowl flow field on combustion and pollutant formation of a DI dual fuel engine. J. Appl. Sci. 2010, 10, 1369–1379. [Google Scholar] [CrossRef] [Green Version]
  34. Diviš, M.; Macek, J. Fuel injection process computations using the eulerian multidimensional model. SAE Tech. Pap. 2005, 01-1243. [Google Scholar] [CrossRef] [Green Version]
  35. Wang, Y.; Lee, W.G.; Reitz, R.D.; Diwakar, R. Numerical Simulation of Diesel Sprays Using an Eulerian-Lagrangian Spray and atomization (ELSA) model coupled with nozzle flow. SAE Tech. Pap. 2011, 2011-01-0386. [Google Scholar] [CrossRef]
  36. Lin, S.; Ding, L.; Zhou, Z.; Yu, G. Discrete model for simulation of char particle gasification with structure evolution. Fuel 2016, 186, 656–664. [Google Scholar] [CrossRef]
  37. Thiruvengadam, M.; Zheng, Y.; Tien, J.C. DPM simulation in an underground entry: Comparison between particle and species models. Int. J. Min. Sci. Technol. 2016, 26, 487–494. [Google Scholar] [CrossRef]
  38. Djavareshkian, M.H.; Ghasemi, A. Investigation of jet break-up process in diesel engine spray modelling. J. Appl. Sci. 2009, 9, 2078–2087. [Google Scholar] [CrossRef] [Green Version]
  39. Fu-shui, L.; Lei, Z.; Bai-gang, S.; Zhi-jie, L.; Schock, H.J. Validation and modification of WAVE spray model for diesel combustion simulation. Fuel 2008, 87, 3420–3427. [Google Scholar] [CrossRef]
  40. Jing, D.; Zhang, F.; Li, Y.; Xu, H.; Shuai, S. Experimental investigation on the macroscopic and microscopic spray characteristics of dieseline fuel. Fuel 2017, 199, 478–487. [Google Scholar] [CrossRef]
  41. Pees, S.; Hoffmann, A.; Zivojnovic, V.; Meyr, H. LISA—Machine description language for cycle-accurate models of programmable DSP architectures. In Proceedings of the 36th Annual ACM/IEEE Design Automation Conference, New Orleans, LA, USA, 21–25 June 1999; pp. 933–938. [Google Scholar]
  42. Ghasemi, A.; Fukuda, K.; Balachandar, R.; Barron, R. Numerical Investigation of Spray Characteristics of Diesel Alternative Fuels. SAE Tech. Pap. 2012, 2012-01-1265. [Google Scholar] [CrossRef]
  43. Beck, J.; Watkins, A. The droplet number moments approach to spray modelling: The development of heat and mass transfer sub-models. Int. J. Heat Fluid Flow 2003, 24, 242–259. [Google Scholar] [CrossRef]
  44. Reitz, R.D. Modeling atomization processes in high-pressure vaporizing sprays. At. Sprays Technol. 1987, 3, 309–337. [Google Scholar]
  45. Beale, J.C.; Reitz, R.D. Modeling spray atomization with the Kelvin-Helmholtz/Rayleigh-Taylor hybrid model. At. Sprays 1999, 9, 623–650. [Google Scholar]
  46. Lee, C.S.; Park, S.W. An experimental and numerical study on fuel atomization characteristics of high-pressure diesel injection sprays. Fuel 2002, 81, 2417–2423. [Google Scholar] [CrossRef]
  47. Su, T.; Patterson, M.; Reitz, R.D.; Farrell, P. Experimental and numerical studies of high pressure multiple injection sprays. SAE Trans. 1996, 105, 1281–1292. [Google Scholar]
  48. Ashgriz, N.; Poo, J. Coalescence and separation in binary collisions of liquid drops. J. Fluid Mech. 1990, 221, 183–204. [Google Scholar] [CrossRef]
  49. Liu, A.B.; Mather, D.; Reitz, R.D. Modeling the effects of drop drag and breakup on fuel sprays. SAE Trans. 1993, 102, 83–95. [Google Scholar]
  50. Shih, T.-H.; Liou, W.W.; Shabbir, A.; Yang, Z.; Zhu, J. A new k-ϵ eddy viscosity model for high reynolds number turbulent flows. Comput. Fluids 1995, 24, 227–238. [Google Scholar] [CrossRef]
  51. Passaras, D.; Amanatides, E.; Kokkoris, G. Predicting the flow of cold plasma jets in kINPen: A critical evaluation of turbulent models. J. Phys. D Appl. Phys. 2020, 53, 265202. [Google Scholar] [CrossRef]
  52. Kumar, A.; Ghobadian, A.; Nouri, J. Numerical simulation and experimental validation of cavitating flow in a multi-hole diesel fuel injector. Int. J. Engine Res. 2021, 23, 958–973. [Google Scholar] [CrossRef]
  53. Pattamatta, A.; Singh, G. Assessment of turbulence models in the prediction of flow field and thermal characteristics of wall jet. Front. Heat Mass Transf. 2012, 3, 023005. [Google Scholar] [CrossRef]
  54. Hiroyasu, H.; Arai, M.; Tabata, M. Empirical equations for the sauter mean diameter of a diesel spray. SAE Trans. 1989, 98, 868–877. [Google Scholar]
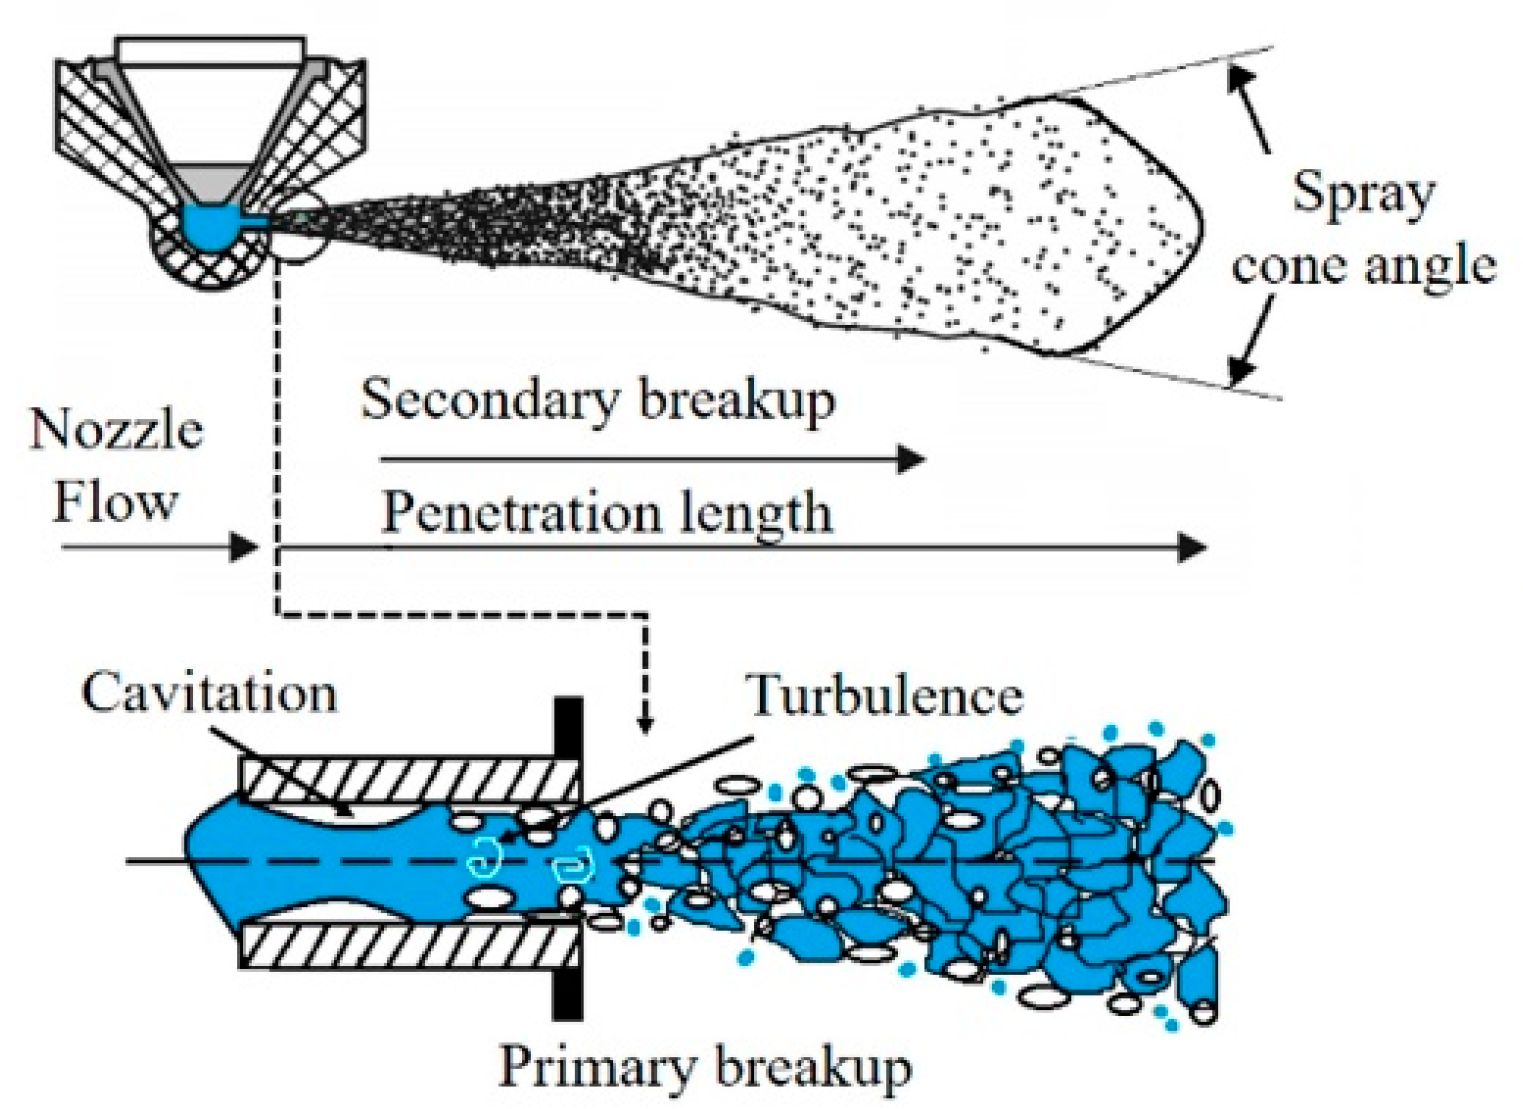
Figure 1. Full conical spray structure of a fuel jet.
Energies 15 07808 g001
Figure 2. Schematic of KH instabilities.
Energies 15 07808 g002
Figure 3. Numerical model interaction diagram for spray simulation.
Energies 15 07808 g003
Figure 4. (a) Computational domain showing front and side views. (b) Penetration length at different mesh sizes. (c) Droplet diameters at different mesh sizes.
Energies 15 07808 g004
Figure 5. Schematic of experimental setup showing the high-pressure control volume vessel (CVV) for fuel spray visualization.
Energies 15 07808 g005
Figure 6. Image processing of fuel spray in a CVV used to find macroscopic spray parameters. (a) Raw image, (b) processed image with background removed, (c) grayscale image, (d) binary image, and (e) measurement of image after edge detection.
Energies 15 07808 g006
Figure 7. Comparison of spray simulation with experimental results at IP of 500 bar with 2 bar ambient pressure for: (a,b) Spray penetration length, (c) numerical results showing AMD (red) and SMD (blue) for various breakup models compared with Hiroyasu and Arai Model [54], and (d) spray cone angle and its comparison with experimental observations.
Energies 15 07808 g007
Figure 8. Experimental and simulated results for penetration length of diesel, JB-20, and CB-20 at 2-bar and 8-bar ambient pressures with IP of 250 bar, 500 bar, and 750 bar.
Energies 15 07808 g008
Figure 9. Spray PL at (a) 2-bar, (b) 5-bar, and (c) 8-bar ambient pressures. (d) Effect of mass flow rate and injection duration on PL at 500-bar injection and 8-bar ambient pressure for diesel.
Energies 15 07808 g009
Figure 10. Numerical results for (a) SMD and (b) AMD at three different injection and two different ambient pressures, respectively. (c) SMD and (d) AMD with respect to various axial positions at 500 bar IP.
Energies 15 07808 g010
Figure 11. Experimental results for (a) SCA at three different injection and ambient pressures. (b) SCA with respect to time ASOI at 500 bar IP.
Energies 15 07808 g011
Figure 12. Experimental results for (a) spray area at 500-bar IP. (b) Spray area at 750-bar IP.
Energies 15 07808 g012
Table 1. Injection parameters for spray analysis.
ParameterQuantity
Injection pressure (bar)250, 500, 750
Injection temperature (K)300
Back pressure (bar)2, 5, 8
Nozzle diameter (mm)0.290
Nozzle length (mm)1.8
Mass flow rate (g/s)4, 5, 6
Injection duration (ms)1.5, 2, 2.5
Chamber length (mm)180
Chamber diameter (mm)150
Chamber temperature (K)300
Table 2. Fuel properties of diesel, jatropha and castor biodiesel.
PropertyCastor Biodiesel (CB-100)Jatropha Biodiesel (JB-100)Diesel D10020% Jatropha Biodiesel & 80% Diesel (JB-20)20% Castor Biodiesel & 80% Diesel (CB-20)
Density (kg/m3)915.7881828841.6858.2
Viscosity (mPa.s)14.726.892.603.473.86
Surface tension (mN/m)34.1031.227.8028.729.11
Calorific value (MJ/kg)38.26240.07 [13]45.79642.47 [13]43.89
Publisher’s Note: MDPI stays neutral with regard to jurisdictional claims in published maps and institutional affiliations.