
SSA-LSTM: Short-Term Photovoltaic Power Prediction Based on Feature Matching

Abstract
1. Introduction
- To improve the quality of the utilized dataset, the PV output power obtained under different weather conditions is analyzed, the law of PV output power is summarized, and a new feature is constructed by combining the PV output law and weather data. The aim is to achieve improved prediction accuracy by mining higher-quality feature data;
- A short-term PV prediction model (SSA-LSTM) is proposed, in which SSA decomposes nonlinear PV sequences into more regular trend sequences, periodic sequences and noise sequences, reducing the learning complexity of LSTM; the model is combined with feature data to achieve improved prediction accuracy.
2. PV Power Generation Feature Extraction
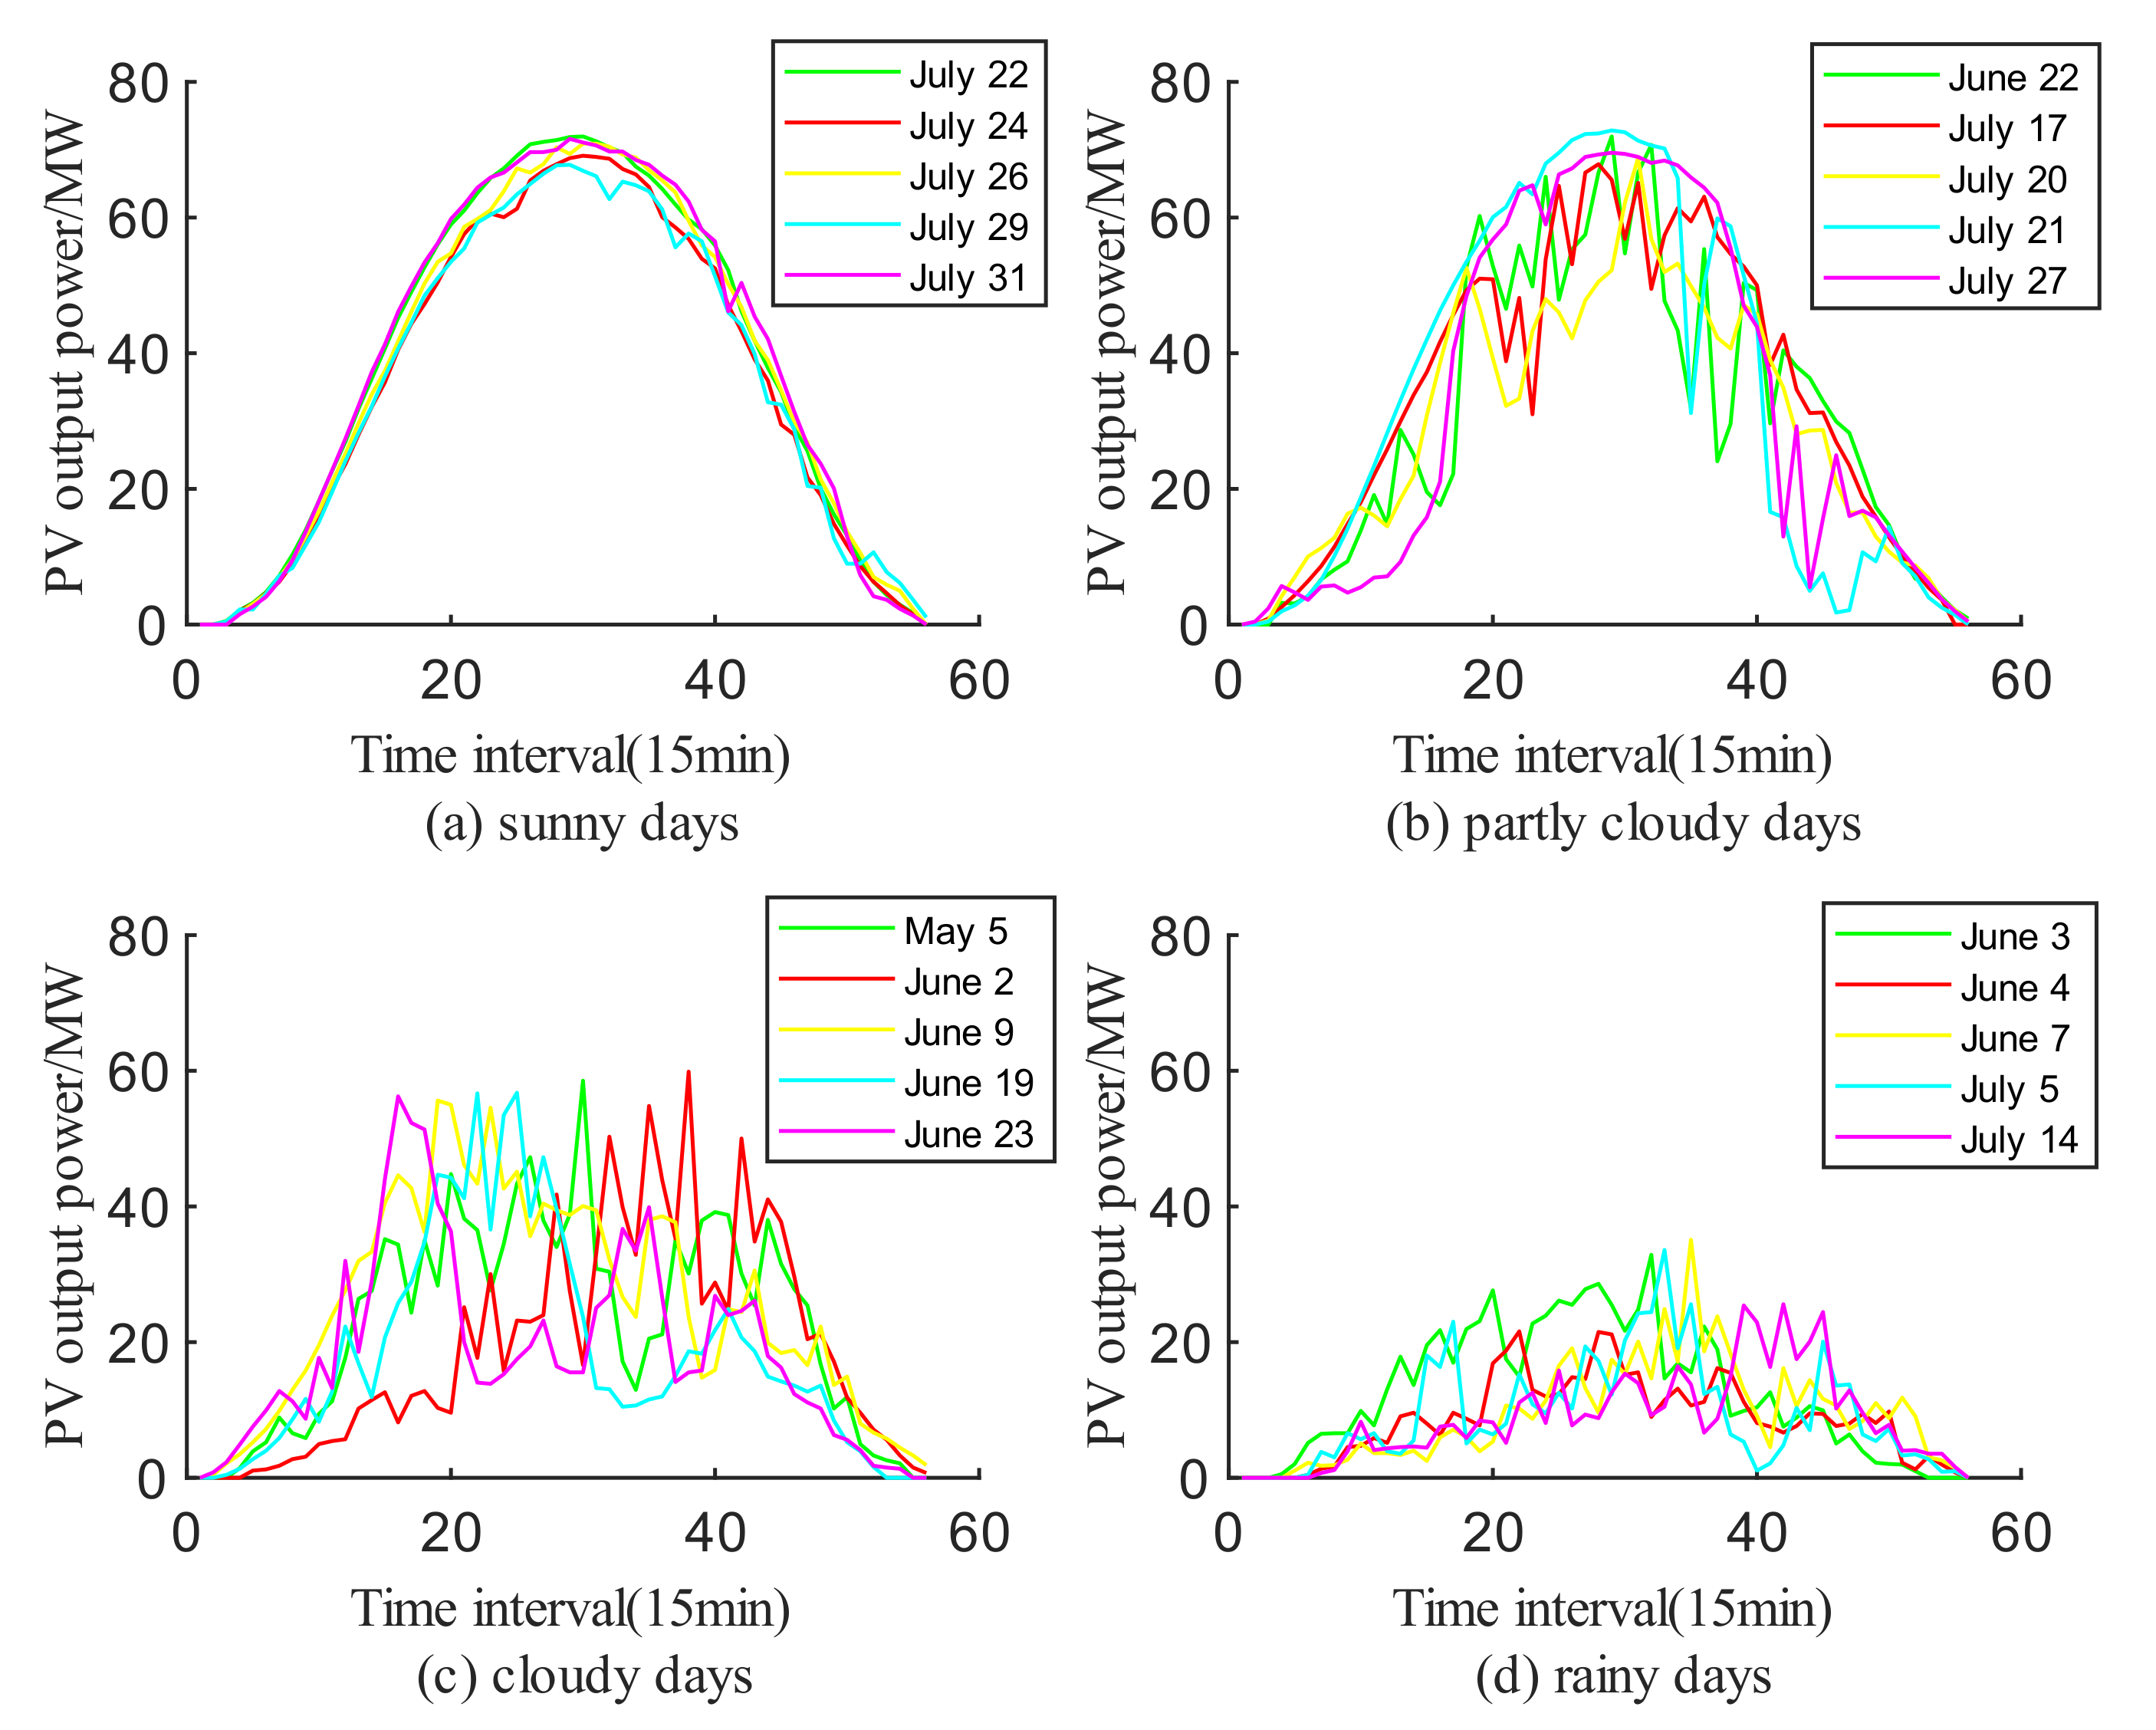
2.1. Typical Form of PV Power Generation
2.2. Short-Term Trend Correlation Analysis
2.3. Power Similarity Matching at the Same Moment
2.3.1. Relevance Calculation
2.3.2. Grey Relation Analysis
2.3.3. Process of Feature Selection
2.4. Optional Feature
3. Forecasting Methods
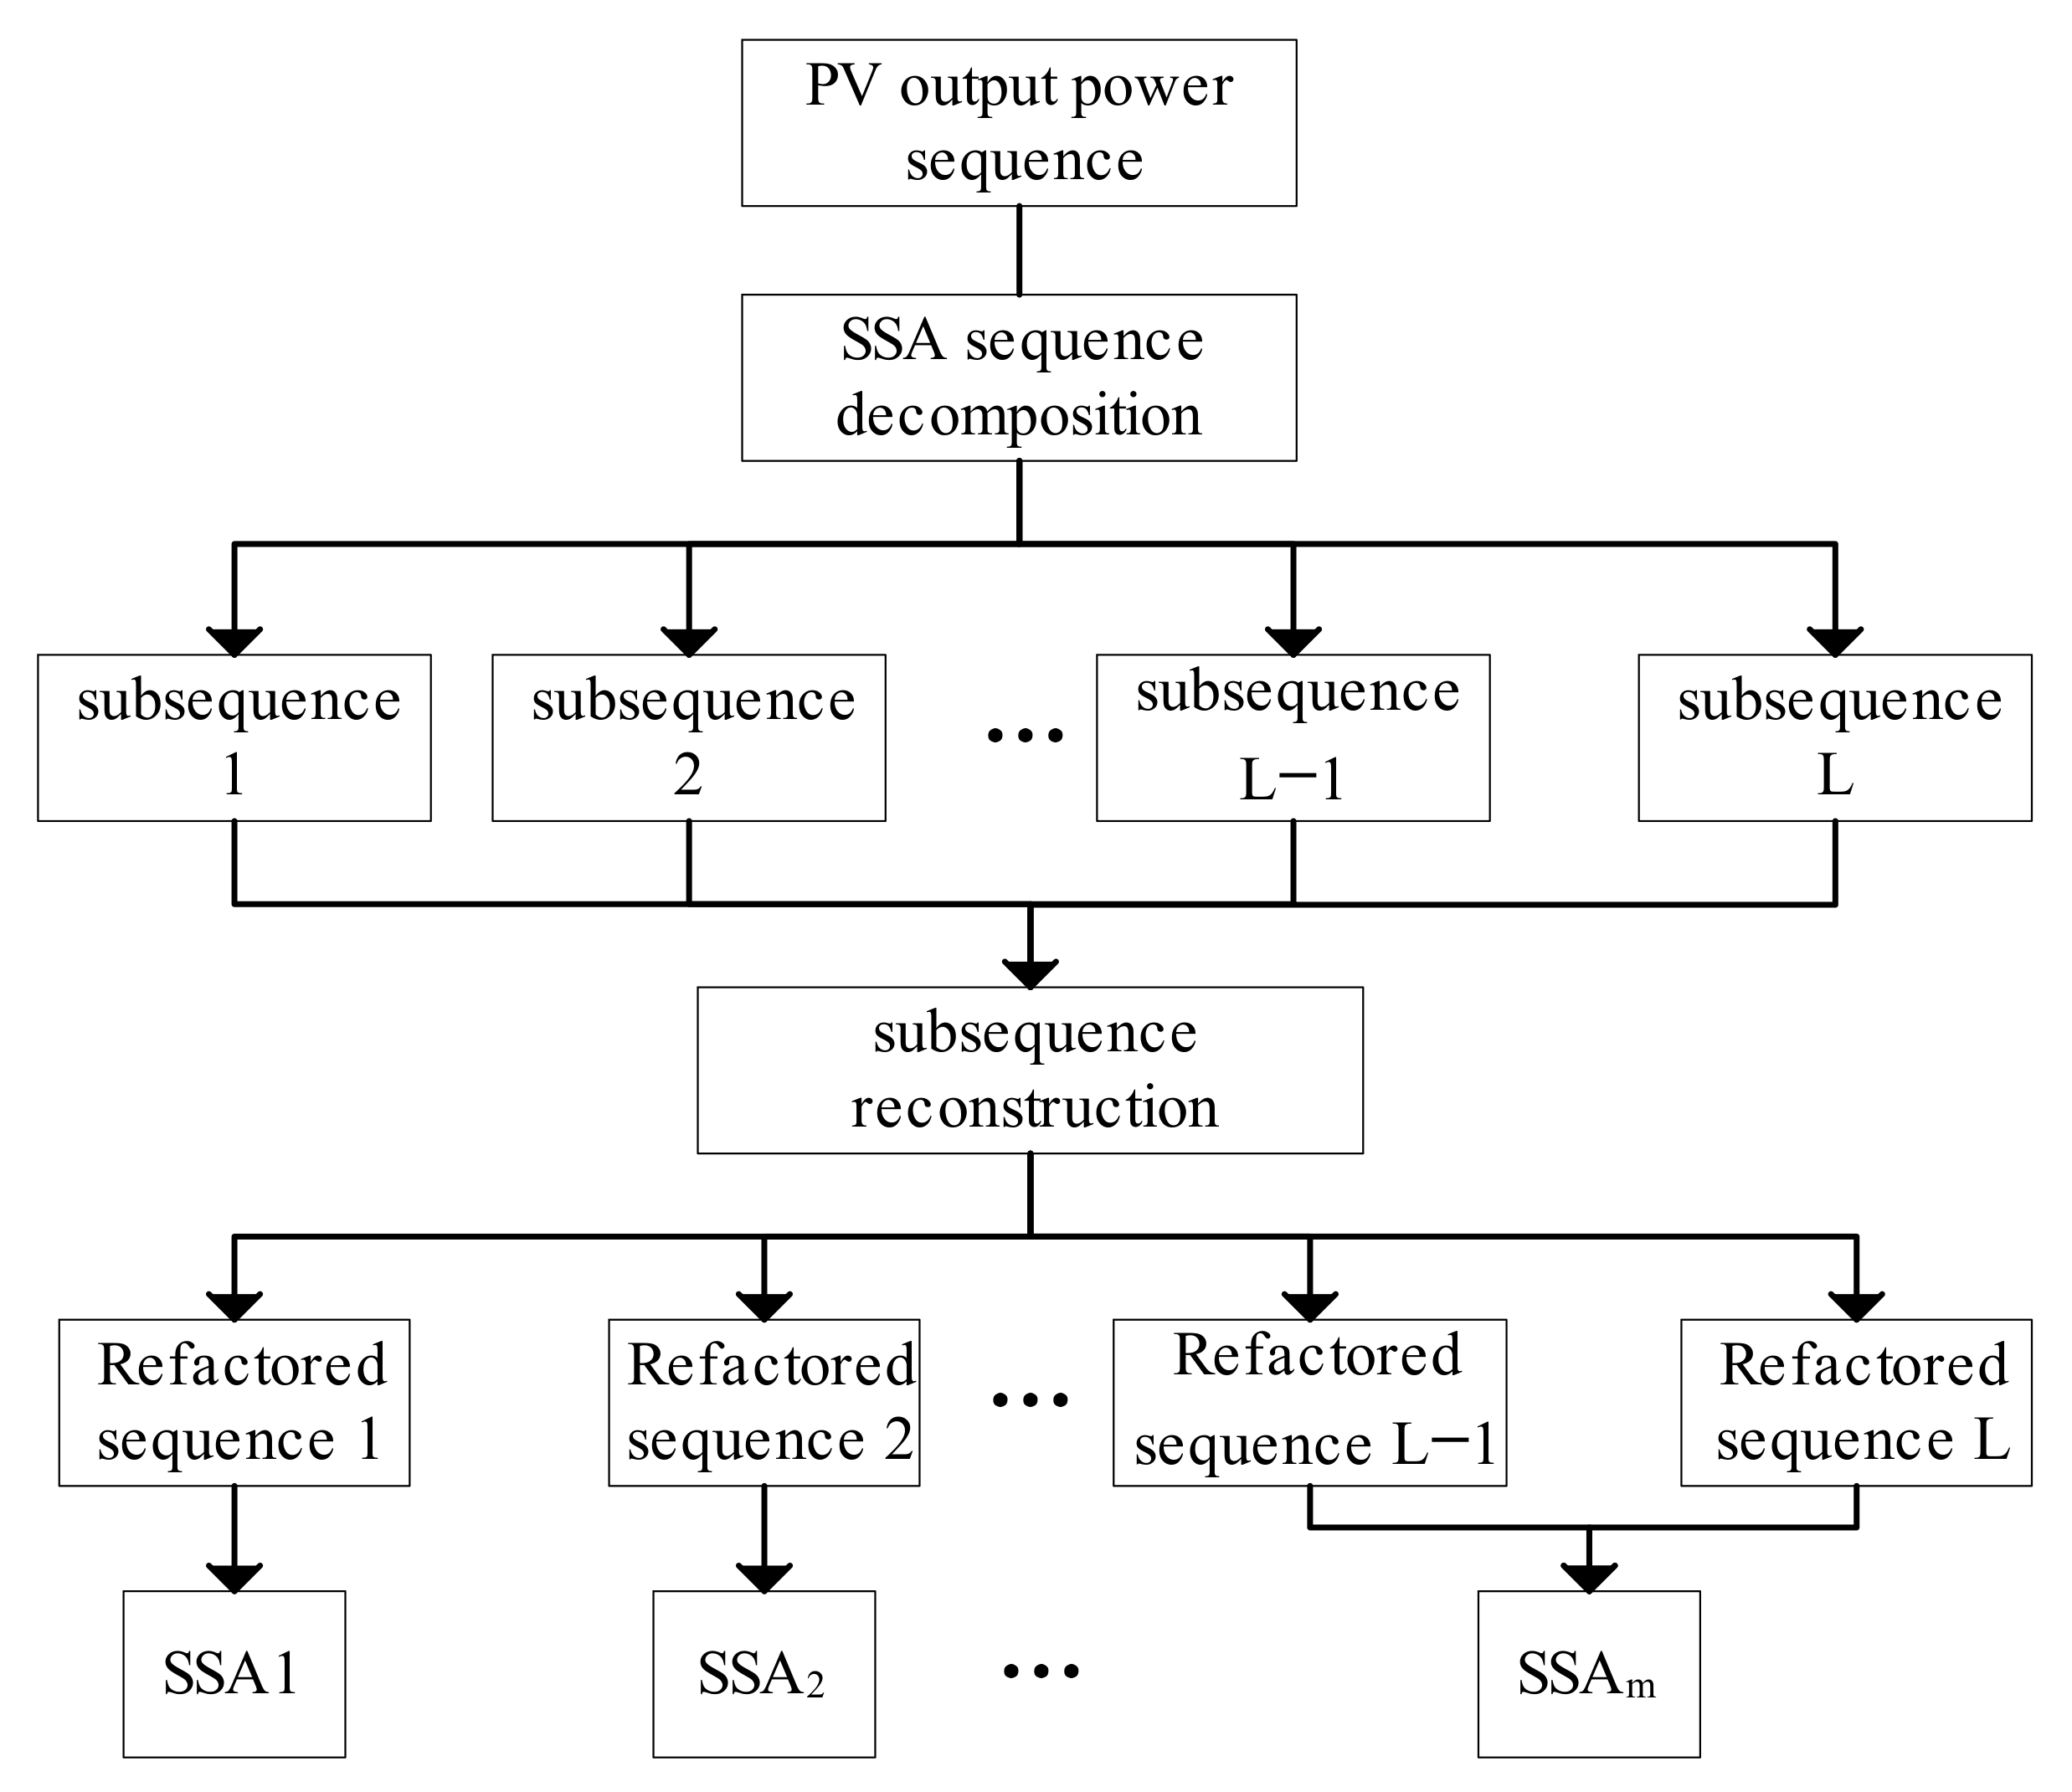
3.1. Singular Spectrum Analysis
3.1.1. Embedding
3.1.2. Decomposition
3.1.3. Reorganization
3.1.4. Diagonal Averaging
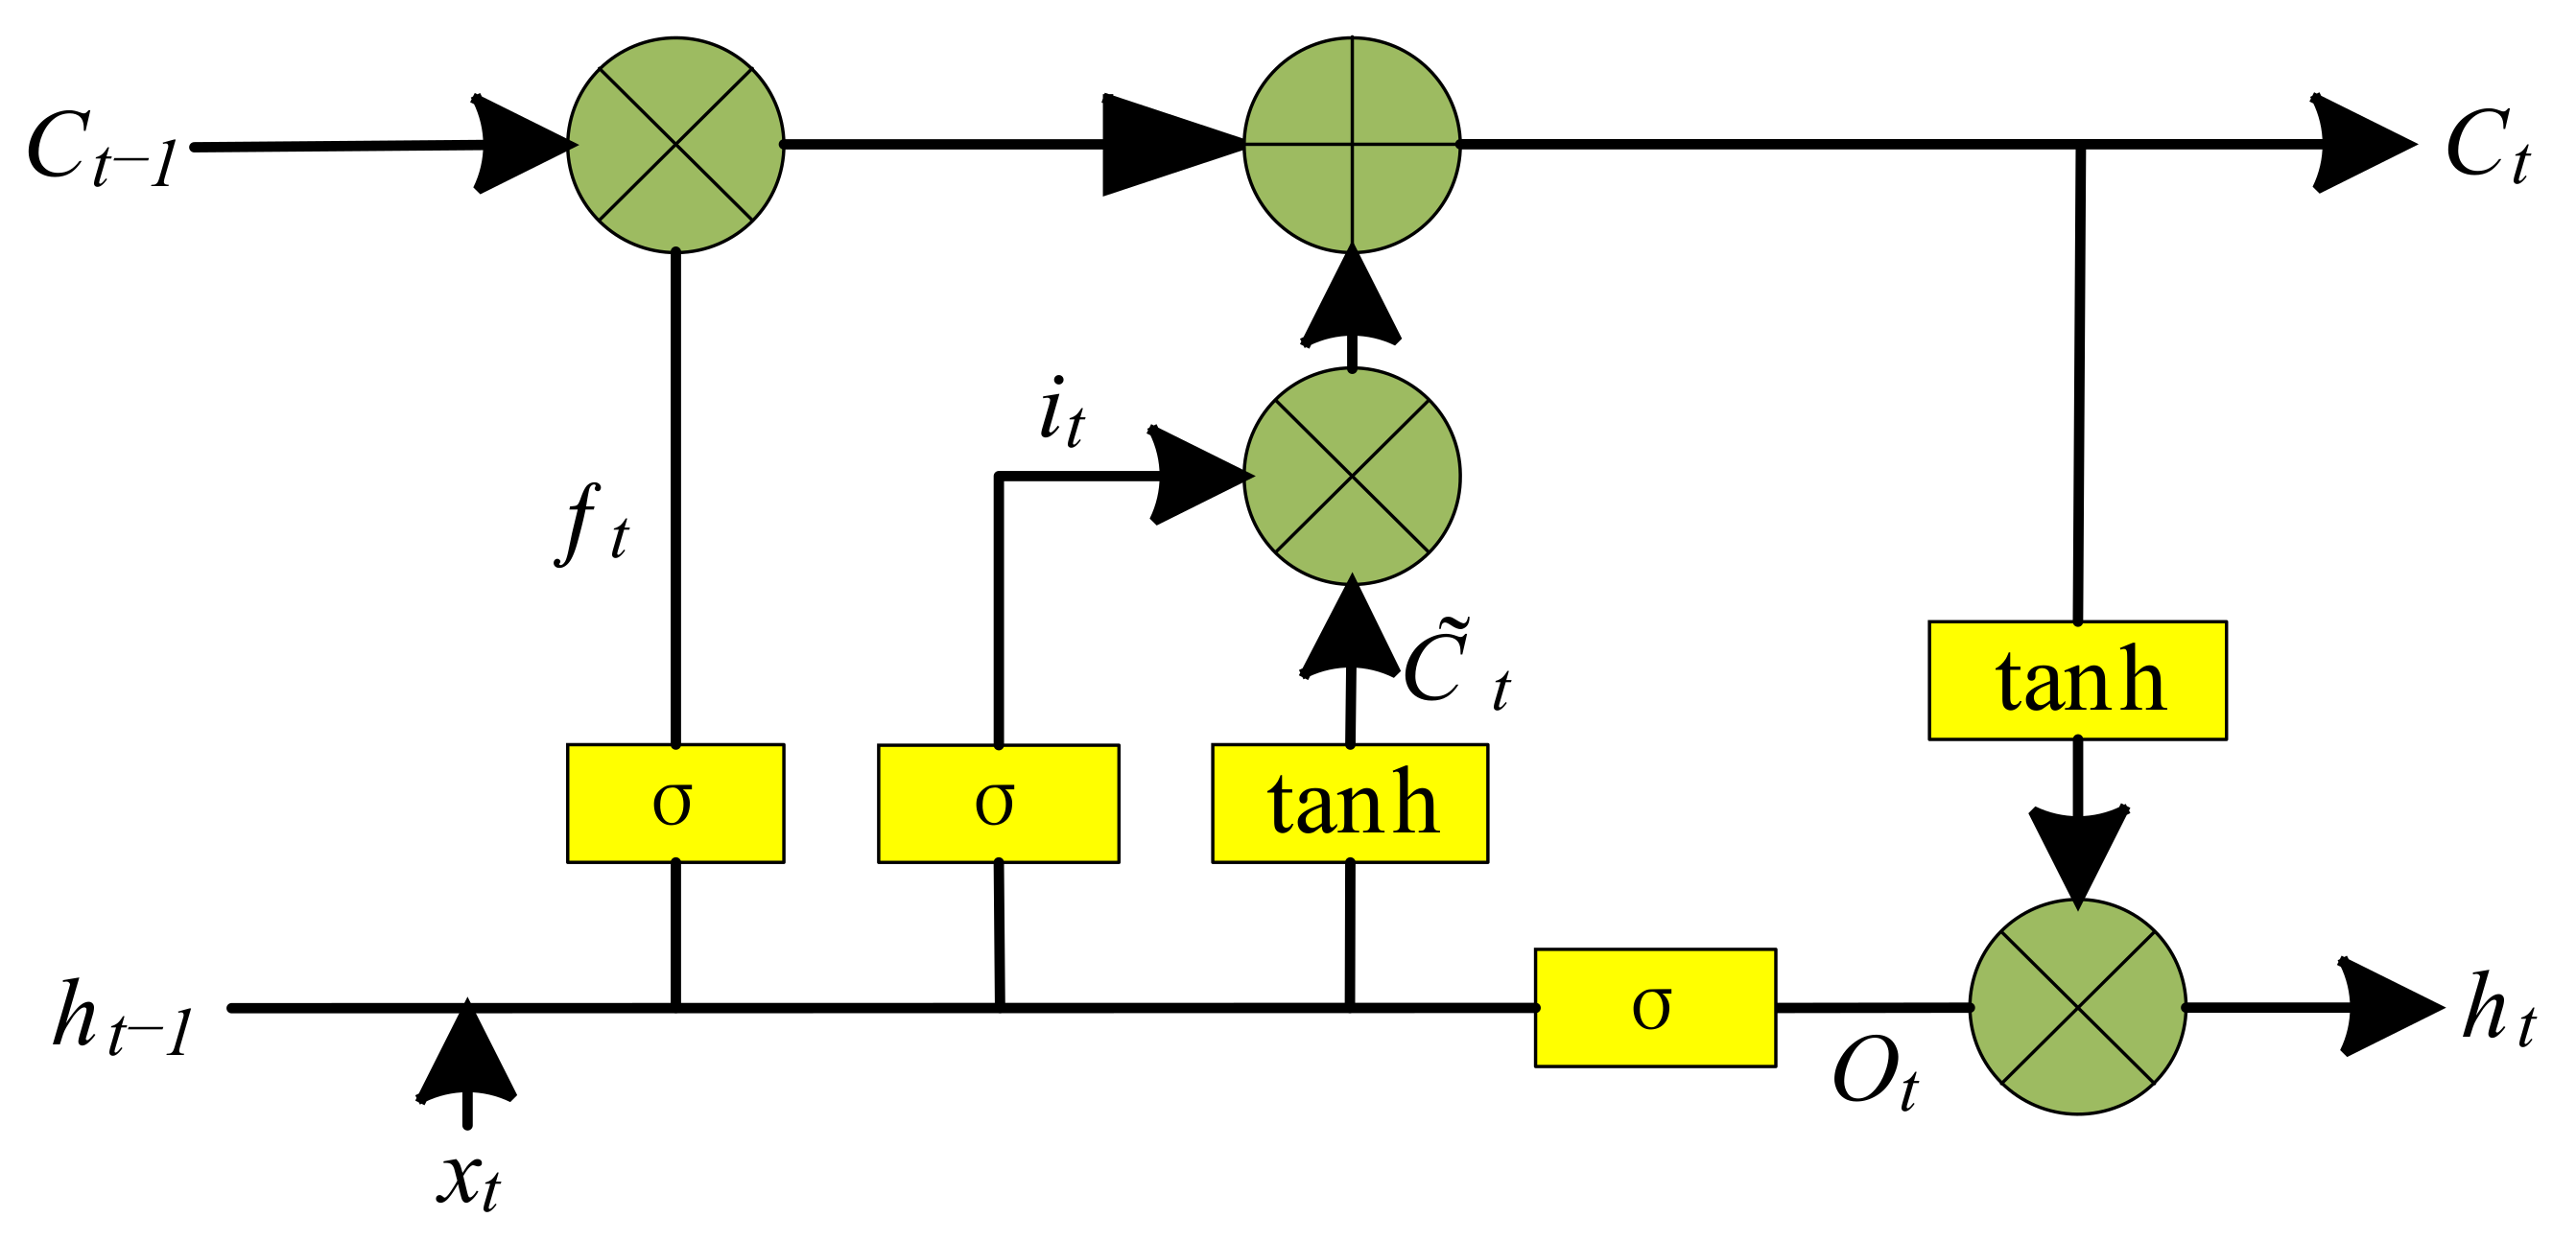
3.2. LSTM
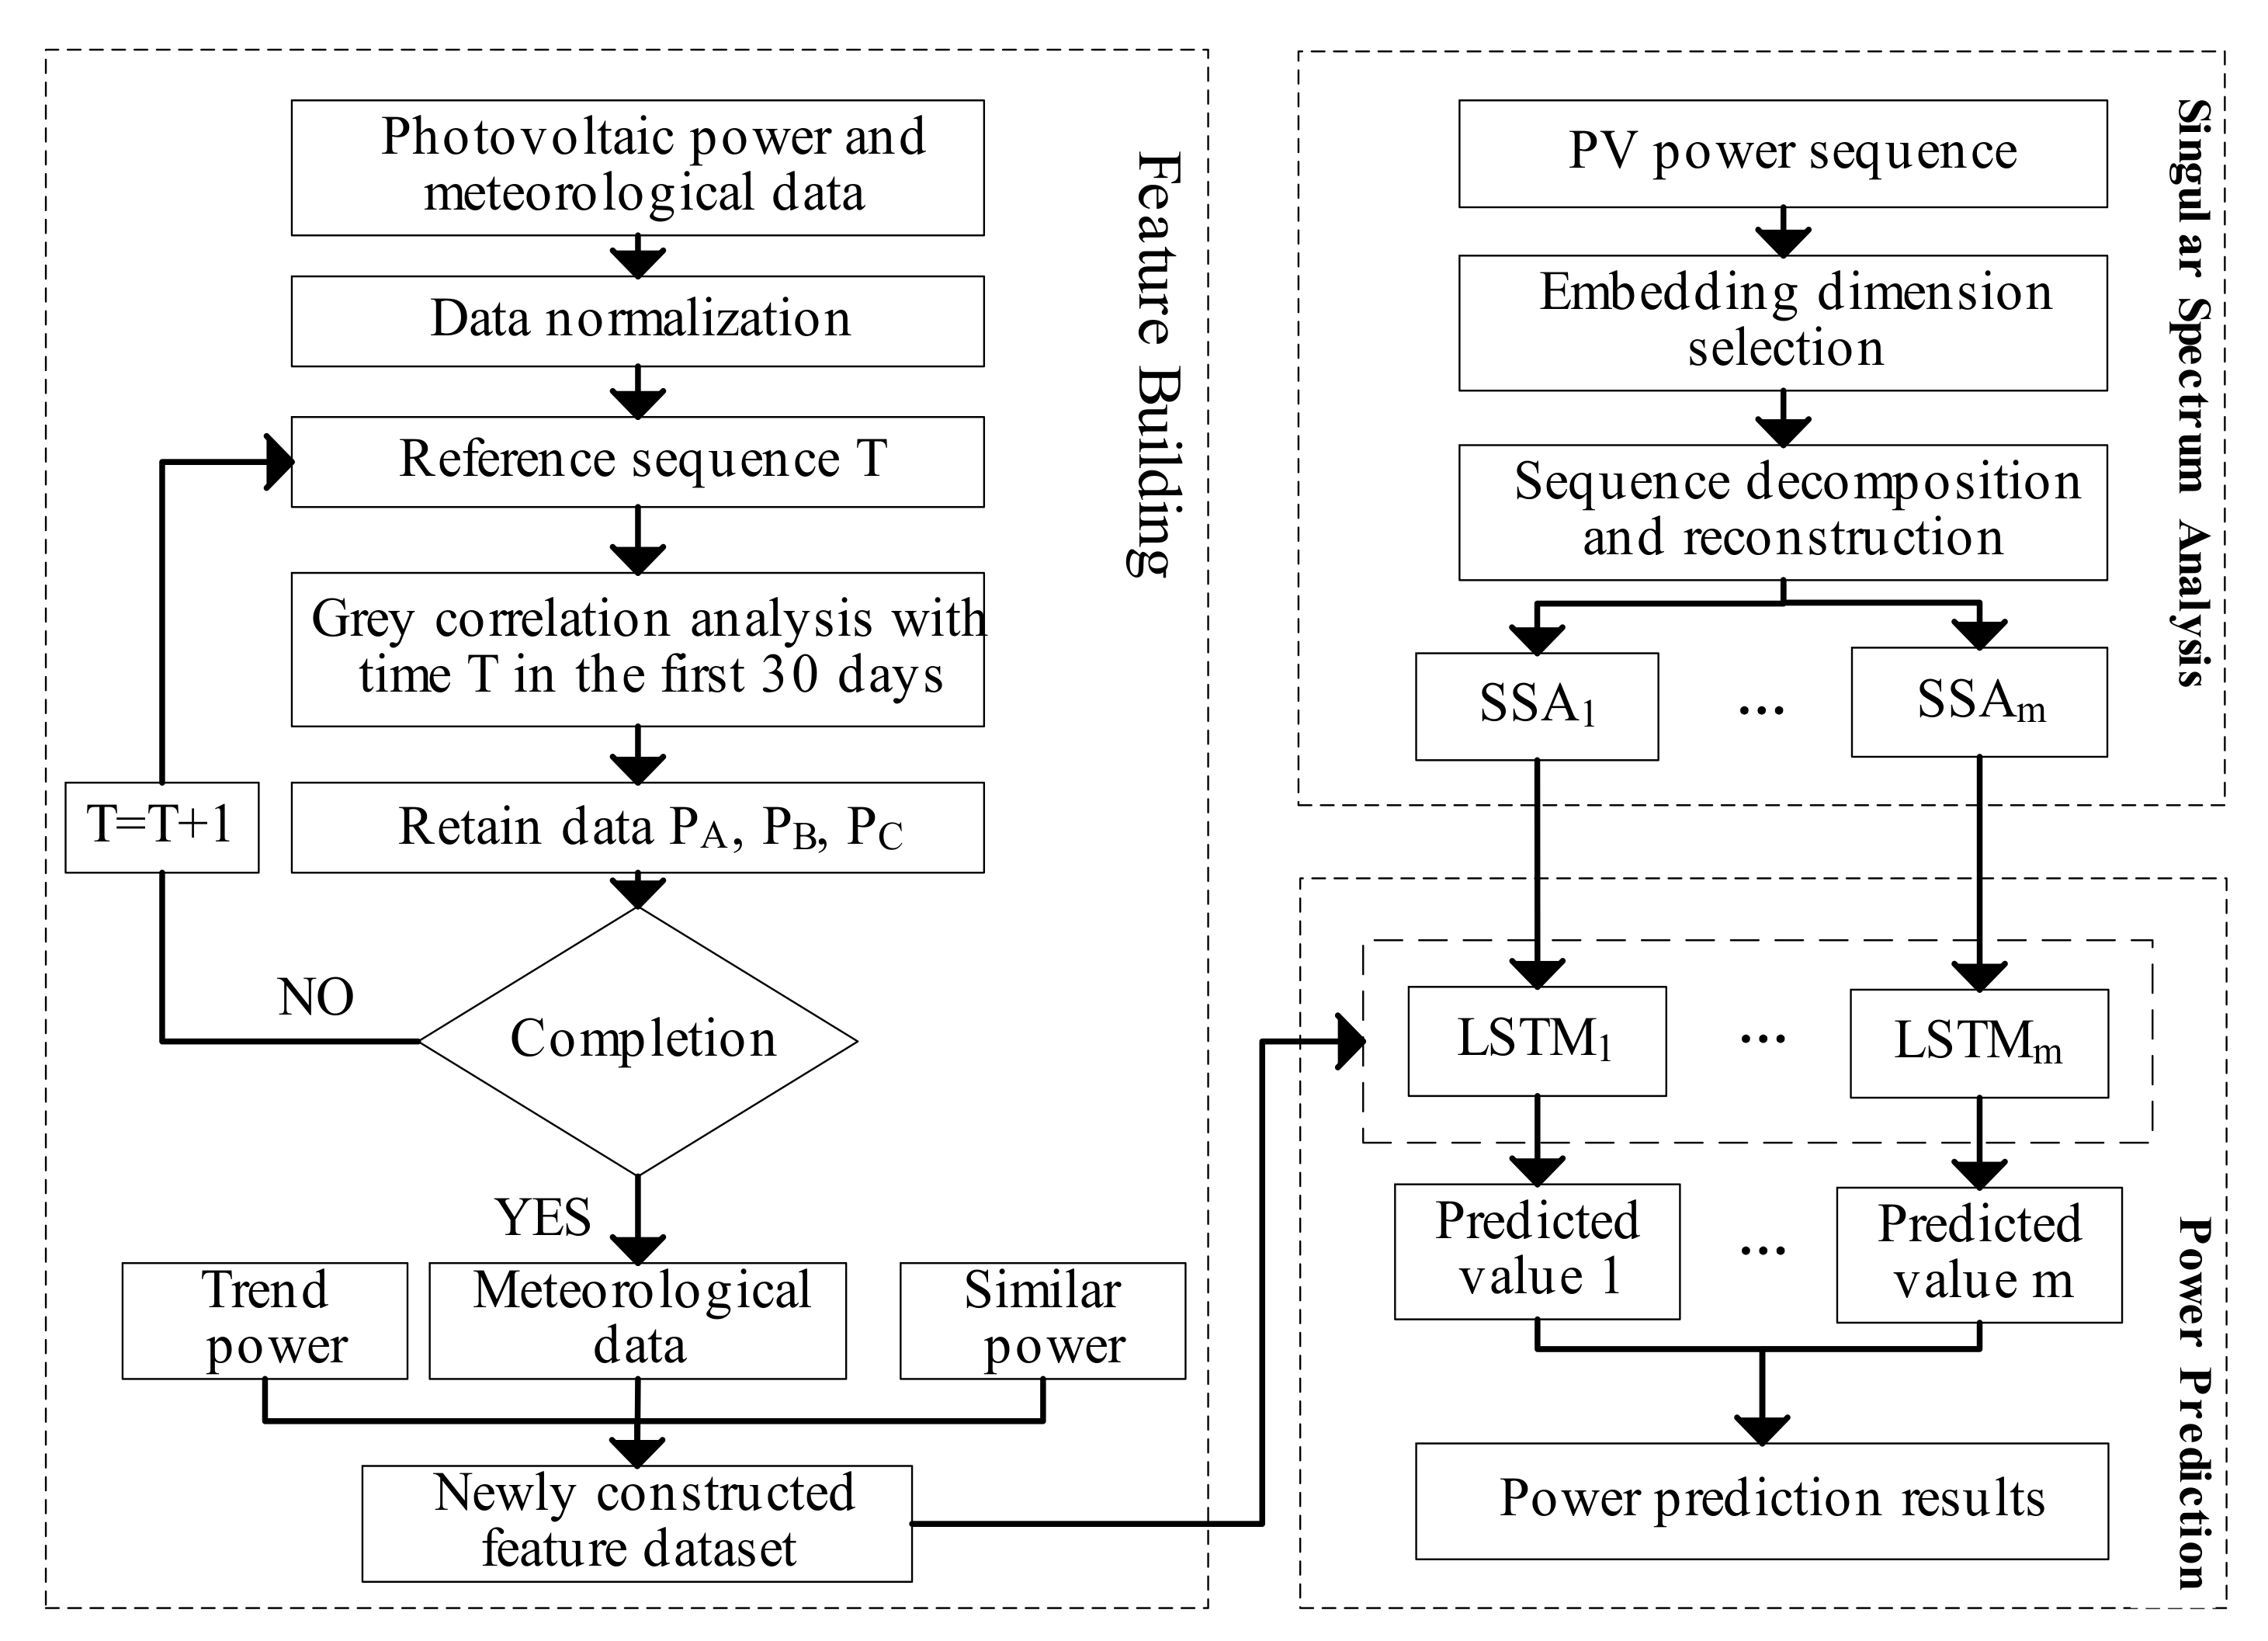
3.3. SSA-LSTM Prediction Model
4. Case Study
4.1. Data Preparation
4.2. Error Analysis and Comparison
4.3. Result and Discussion
5. Conclusions
- (1)
- Through the SSA decomposition method, the original high volatility and stochastic PV power output curve is decomposed into a series of smoother subsequences, which makes PV power prediction under fluctuating weather conditions much less difficult and improves the resulting prediction accuracy;
- (2)
- A reasonable feature selection process can highlight the key features of the input data, and the dataset obtained after feature matching can effectively improve the model prediction accuracy;
- (3)
- In an experimental results comparison, this paper adopts comparison tests between single-input models and multi-input models to evaluate the integrated prediction accuracy, and the results show that the SSA-LSTM prediction effect achieved after incorporating the new features is optimal.
Author Contributions
Funding
Data Availability Statement
Conflicts of Interest
References
- Renewable Power Generation Costs in 2019. 2020. Available online: https://www.irena.org/publications/2020/Jun/Renewable-Power-Costs-in-2019 (accessed on 20 August 2022).
- IRENA. Future of Solar Photovoltaic: Deployment, Investment, Technology, Grid Integration and Socio-Economic Aspects (A Global Energy Transformation: Paper); International Renewable Energy Agency: Abu Dhabi, United Arab Emirates, 2019. [Google Scholar]
- Blaga, R.; Sabadus, A.; Stefu, N.; Dughir, C.; Paulescu, M.; Badescu, V. A current perspective on the accuracy of incoming solar energy forecasting. Prog. Energy Combust. Sci. 2019, 70, 119–144. [Google Scholar] [CrossRef]
- Turchenko, V.A.; Trukhanov, S.V.; Kostishin, V.G.; Damay, F.; Porcher, F.; Klygach, D.S.; Vakhitov, M.G.; Lyakhov, D.; Michels, D.; Bozzo, B.; et al. Features of structure, magnetic state and electrodynamic performance of SrFe12−xInxO19. Sci. Rep. 2021, 11, 18342. [Google Scholar] [CrossRef] [PubMed]
- Kozlovskiy, A.L.; Alina, A.; Zdorovets, M.V. Study of the effect of ion irradiation on increasing the photocatalytic activity of WO3 microparticles. J. Mater. Sci. Mater. Electron. 2021, 32, 3863–3877. [Google Scholar] [CrossRef]
- Kozlovskiy, A.L.; Shlimas, D.I.; Zdorovets, M.V. Synthesis, structural properties and shielding efficiency of glasses based on TeO2-(1-x) ZnO-xSm2O3. J. Mater. Sci. Mater. Electron. 2021, 32, 12111–12120. [Google Scholar] [CrossRef]
- Almessiere, M.A.; Algarou, N.A.; Slimani, Y.; Sadaqat, A.; Baykal, A.; Manikandan, A.; Trukhanov, S.V.; Trukhanov, A.V.; Ercan, I. Investigation of exchange coupling and microwave properties of hard/soft (SrNi0. 02Zr0. 01Fe11. 96O19)/(CoFe2O4) x nanocomposites. Mater. Today Nano 2022, 18, 100186. [Google Scholar] [CrossRef]
- Zambrano, A.F.; Giraldo, L.F. Solar irradiance forecasting models without on-site training measurements. Renew. Energy 2020, 152, 557–566. [Google Scholar] [CrossRef]
- Dorado-Moreno, M.; Navarin, N.; Gutiérrez, P.A.; Prieto, L.; Sperduti, A.; Salcedo-Sanz, S.; Hervás-Martínez, C. Multi-task learning for the prediction of wind power ramp events with deep neural networks. Neural Netw. 2020, 123, 401–411. [Google Scholar] [CrossRef]
- Aslam, M.; Lee, J.-M.; Kim, H.-S.; Lee, S.-J.; Hong, S. Deep learning models for long-term solar radiation forecasting considering microgrid installation: A comparative study. Energies 2019, 13, 147. [Google Scholar] [CrossRef]
- Rana, M.; Rahman, A. Multiple steps ahead solar photovoltaic power forecasting based on univariate machine learning models and data re-sampling. Sustain. Energy Grids Netw. 2020, 21, 100286. [Google Scholar] [CrossRef]
- Al-Dahidi, S.; Ayadi, O.; Adeeb, J.; Louzazni, M. Assessment of artificial neural networks learning algorithms and training datasets for solar photovoltaic power production prediction. Front. Energy Res. 2019, 7, 130. [Google Scholar] [CrossRef]
- Buwei, W.; Jianfeng, C.; Bo, W.; Shuanglei, F. A solar power prediction using support vector machines based on multi-source data fusion. In Proceedings of the 2018 International Conference on Power System Technology (POWERCON), Guangzhou, China, 6–8 November 2018; pp. 4573–4577. [Google Scholar]
- Ahmad, M.W.; Mourshed, M.; Rezgui, Y. Tree-based ensemble methods for predicting PV power generation and their comparison with support vector regression. Energy 2018, 164, 465–474. [Google Scholar] [CrossRef]
- Fan, J.; Wu, L.; Ma, X.; Zhou, H.; Zhang, F. Hybrid support vector machines with heuristic algorithms for prediction of daily diffuse solar radiation in air-polluted regions. Renew. Energy 2020, 145, 2034–2045. [Google Scholar] [CrossRef]
- Munawar, U.; Wang, Z. A framework of using machine learning approaches for short-term solar power forecasting. J. Electr. Eng. Technol. 2020, 15, 561–569. [Google Scholar] [CrossRef]
- Andrade, J.R.; Bessa, R.J. Improving renewable energy forecasting with a grid of numerical weather predictions. IEEE Trans. Sustain. Energy 2017, 8, 1571–1580. [Google Scholar] [CrossRef]
- LeCun, Y.; Bengio, Y.; Hinton, G. Deep learning. Nature 2015, 521, 436–444. [Google Scholar] [CrossRef]
- Sun, Y.; Venugopal, V.; Brandt, A.R. Short-term solar power forecast with deep learning: Exploring optimal input and output configuration. Sol. Energy 2019, 188, 730–741. [Google Scholar] [CrossRef]
- Ghimire, S.; Deo, R.C.; Raj, N.; Mi, J. Deep learning neural networks trained with MODIS satellite-derived predictors for long-term global solar radiation prediction. Energies 2019, 12, 2407. [Google Scholar] [CrossRef]
- Zhang, C.; Liang, M.; Song, X.; Liu, L.; Wang, H.; Li, W.; Shi, M. Generative adversarial network for geological prediction based on TBM operational data. Mech. Syst. Signal Processing 2020, 162, 108035. [Google Scholar] [CrossRef]
- Zhang, J.; Verschae, R.; Nobuhara, S.; & Lalonde, J.F. Deep photovoltaic nowcasting. Sol. Energy 2018, 176, 267–276. [Google Scholar] [CrossRef]
- Qing, X.; Niu, Y. Hourly day-ahead solar irradiance prediction using weather forecasts by LSTM. Energy 2018, 148, 461–468. [Google Scholar] [CrossRef]
- He, W. Load forecasting via deep neural networks. Procedia Comput. Sci. 2017, 122, 308–314. [Google Scholar] [CrossRef]
- Taieb, S.B.; Bontempi, G.; Atiya, A.F.; Sorjamaa, A. A review and comparison of strategies for multi-step ahead time series forecasting based on the NN5 forecasting competition. Expert Syst. Appl. 2012, 39, 7067–7083. [Google Scholar] [CrossRef]
- Santhosh, M.; Venkaiah, C.; Kumar, D.V. Short-term wind speed forecasting approach using ensemble empirical mode decomposition and deep Boltzmann machine. Sustain. Energy Grids Netw. 2019, 19, 100242. [Google Scholar] [CrossRef]
- Wang, L.; Li, X.; Bai, Y. Short-term wind speed prediction using an extreme learning machine model with error correction. Energy Convers. Manag. 2018, 162, 239–250. [Google Scholar] [CrossRef]
- Golyandina, N.; Nekrutkin, V.; Zhigljavsky, A.A. Analysis of Time Series Structure: SSA and Related Techniques; CRC Press: Boca Raton, FL, USA, 2001. [Google Scholar]
- Broomhead, D.S.; King, G.P. Extracting qualitative dynamics from experimental data. Phys. D Nonlinear Phenom. 1986, 20, 217–236. [Google Scholar] [CrossRef]
- Moreno, S.R.; dos Santos Coelho, L. Wind speed forecasting approach based on singular spectrum analysis and adaptive neuro fuzzy inference system. Renew. Energy 2018, 126, 736–754. [Google Scholar] [CrossRef]
- Liu, H.; Mi, X.; Li, Y.; Duan, Z.; Xu, Y. Smart wind speed deep learning based multi-step forecasting model using singular spectrum analysis, convolutional Gated Recurrent Unit network and Support V ector Regression. Renew. Energy 2019, 143, 842–854. [Google Scholar] [CrossRef]
- Wang, C.; Zhang, H.; Ma, P. Wind power forecasting based on singular spectrum analysis and a new hybrid Laguerre neural network. Appl. Energy 2020, 259, 114139. [Google Scholar] [CrossRef]
- Moreno, S.R.; da Silva, R.G.; Mariani, V.C.; dos Santos Coelho, L. Multi-step wind speed forecasting based on hybrid multi-stage decomposition model and long short-term memory neural network. Energy Convers. Manag. 2020, 213, 112869. [Google Scholar] [CrossRef]
- Chen, C.; Duan, S.; Cai, T.; Liu, B. Online 24-h solar power forecasting based on weather type classification using artificial neural network. Sol. Energy 2011, 85, 2856–2870. [Google Scholar] [CrossRef]
- Wang, F.; Zhen, Z.; Wang, B.; Mi, Z. Comparative study on KNN and SVM based weather classification models for day ahead short term solar PV power forecasting. Appl. Sci. 2017, 8, 28. [Google Scholar] [CrossRef]
- Lin, P.; Peng, Z.; Lai, Y.; Cheng, S.; Chen, Z.; Wu, L. Short-term power prediction for photovoltaic power plants using a hybrid improved Kmeans-GRA-Elman model based on multivariate meteorological factors and historical power datasets. Energy Convers. Manag. 2018, 177, 704–717. [Google Scholar] [CrossRef]
- Gu, B.; Shen, H.; Lei, X.; Hu, H.; Liu, X. Forecasting and uncertainty analysis of day-ahead photovoltaic power using a novel forecasting method. Appl. Energy 2021, 299, 117291. [Google Scholar] [CrossRef]
- Zhang, N.; Ren, Q.; Liu, G.; Guo, L.; Li, J. Short-term PV Output Power Forecasting Based on CEEMDAN-AE-GRU. J. Electr. Eng. Technol. 2022, 17, 1183–1194. [Google Scholar] [CrossRef]
- Nam, K.; Hwangbo, S.; Yoo, C. A deep learning-based forecasting model for renewable energy scenarios to guide sustainable energy policy: A case study of Korea. Renew. Sustain. Energy Rev. 2020, 122, 109725. [Google Scholar] [CrossRef]
- Taiyangshan, W. Wuzhong Taiyangshan PV Power Station Annual Report; Taiyangshan Photovoltaic Power Station: WuZhong, China, 2016. [Google Scholar]
- Rocco, S.C.M. Singular spectrum analysis and forecasting of failure time series. Reliab. Eng. Syst. Saf. 2013, 114, 126–136. [Google Scholar] [CrossRef]
- Tan, M.; Yuan, S.; Li, S.; Su, Y.; Li, H.; He, F. Ultra-short-term industrial power demand forecasting using LSTM based hybrid ensemble learning. IEEE Trans. Power Syst. 2019, 35, 2937–2948. [Google Scholar] [CrossRef]
- Bianchi, F.M.; Maiorino, E.; Kampffmeyer, M.C.; Rizzi, A.; Jenssen, R. Recurrent Neural Networks for Short-Term Load Forecasting: An Overview and Comparative Analysis; Springer: Cham, Switzerland, 2017. [Google Scholar]
- Hutter, F.; Kotthoff, L.; Vanschoren, J. Automated Machine Learning: Methods, Systems, Challenges; Springer Nature: Berlin/Heidelberg, Germany, 2019; pp. 7–8, 219. [Google Scholar]
- Makridakis, S. Accuracy measures: Theoretical and practical concerns. Int. J. Forecast. 1993, 9, 527–529. [Google Scholar] [CrossRef]
- Stratigakos, A.; Bachoumis, A.; Vita, V.; Zafiropoulos, E. Short-Term Net Load Forecasting with Singular Spectrum Analysis and LSTM Neural Networks. Energies 2021, 14, 4107. [Google Scholar] [CrossRef]
- Bandara, K.; Bergmeir, C.; Hewamalage, H. LSTM-MSNet: Leveraging forecasts on sets of related time series with multiple seasonal patterns. IEEE Trans. Neural Netw. Learn. Syst. 2020, 32, 1586–1599. [Google Scholar] [CrossRef]


| Time | t−1 | t−2 | t−3 | t−4 | t−5 | t−6 | t−7 |
|---|---|---|---|---|---|---|---|
| Correlation coefficient | 0.95 | 0.92 | 0.88 | 0.85 | 0.81 | 0.76 | 0.71 |
| Input: PV output power history dataset. |
| 1. The process of data normalization; |
| 2. Select the PV outputs at time t as the reference series; |
| 3. Perform grey relation analysis with each t-moment for the previous 30 days; |
| 4. Sort r values from largest to smallest, and retain the powers of the three moments with the strongest correlations; |
| 5. t moments +1, and repeat steps 2–4 until the last data point is reached; |
| Output: PV power, Pa, Pb, Pc, complete feature construction. |
| Features | GHI | AT | CT | RH | t−1 | t−2 | t−3 | Pa | Pb | Pc |
|---|---|---|---|---|---|---|---|---|---|---|
| Power | 0.796 | 0.503 | 0.273 | −0.008 | 0.942 | 0.914 | 0.878 | 0.917 | 0.607 | 0.585 |
| Serial Number | Feature | Serial Number | Feature |
|---|---|---|---|
| 1 | Global horizontal irradiance | 6 | Power at moment t−2 |
| 2 | Ambient temperature | 7 | Power at moment t−3 |
| 3 | Component temperature | 8 | Similar power Pa |
| 4 | Relative humidity | 9 | Similar power Pb |
| 5 | Power at moment t−1 | 10 | Similar power Pc |
| Prediction Method | Univariate | Multivariate | ||||
|---|---|---|---|---|---|---|
| MAE/MW | RMSE/MW | R2 | MAE/MW | RMSE/MW | R2 | |
| XGBoost | 5.121 | 7.845 | 0.901 | 3.003 | 5.018 | 0.959 |
| LSTM | 3.913 | 5.374 | 0.953 | 2.256 | 2.672 | 0.988 |
| SSA-LSTM | 1.765 | 2.010 | 0.993 | 0.892 | 1.096 | 0.998 |
| Forecasting Date | Predictive Models | MAE/MW | RMSE/MW | R2 |
|---|---|---|---|---|
| July 5th | A | 3.946 | 5.452 | 0.523 |
| B | 1.163 | 1.486 | 0.964 | |
| C | 1.064 | 1.381 | 0.969 | |
| July 7th | A | 8.580 | 11.979 | 0.626 |
| B | 2.137 | 3.010 | 0.976 | |
| C | 1.778 | 2.411 | 0.984 | |
| July 10th | A | 6.801 | 10.15 | 0.722 |
| B | 2.038 | 2.863 | 0.977 | |
| C | 2.017 | 2.540 | 0.982 |
Publisher’s Note: MDPI stays neutral with regard to jurisdictional claims in published maps and institutional affiliations. |
© 2022 by the authors. Licensee MDPI, Basel, Switzerland. This article is an open access article distributed under the terms and conditions of the Creative Commons Attribution (CC BY) license (https://creativecommons.org/licenses/by/4.0/).
Share and Cite
Huang, Z.; Huang, J.; Min, J. SSA-LSTM: Short-Term Photovoltaic Power Prediction Based on Feature Matching. Energies 2022, 15, 7806. https://doi.org/10.3390/en15207806
Huang Z, Huang J, Min J. SSA-LSTM: Short-Term Photovoltaic Power Prediction Based on Feature Matching. Energies. 2022; 15(20):7806. https://doi.org/10.3390/en15207806
Chicago/Turabian StyleHuang, Zhengwei, Jin Huang, and Jintao Min. 2022. "SSA-LSTM: Short-Term Photovoltaic Power Prediction Based on Feature Matching" Energies 15, no. 20: 7806. https://doi.org/10.3390/en15207806
APA StyleHuang, Z., Huang, J., & Min, J. (2022). SSA-LSTM: Short-Term Photovoltaic Power Prediction Based on Feature Matching. Energies, 15(20), 7806. https://doi.org/10.3390/en15207806