Article

Partial Discharge Characteristics of C3F7CN Gas Mixture Using the UHF Method

1
Department of Electrical & Electronic Engineering, The University of Manchester, Manchester M13 9PL, UK
2
National Grid, Warwick CV34 6DA, UK
3
HVPD Ltd., Salford M50 2UW, UK
*
Author to whom correspondence should be addressed.
Energies 2022, 15(20), 7731; https://doi.org/10.3390/en15207731
Submission received: 13 September 2022 / Revised: 3 October 2022 / Accepted: 17 October 2022 / Published: 19 October 2022
(This article belongs to the Topic High Voltage Engineering)

Abstract

:
Manufacturing or assembly defects in gas-insulated equipment can introduce field enhancements that could lead to partial discharge (PD). This paper examines the PD characteristics of SF6 alternatives considered for potential application to retro-filling existing SF6-designed equipment. The PD performance of the C3F7CN/CO2 gas mixture and SF6 were characterised adopting the ultra-high frequency (UHF) method and investigated for different defect configurations, pressures, and gas mediums. Hemispherical rod-plane and plane-to-plane configurations with needle on the high-voltage (HV) and ground electrodes were used to mimic conductor and enclosure protrusion defects, respectively. The results demonstrate that with a needle length of 15 mm, the 20% C3F7CN/80% CO2 gas mixture had almost half the partial discharge inception and extinction voltages (PDIV/EV) of SF6. For less divergent fields, the 20% C3F7CN/80% CO2 gas mixture demonstrated a comparable PDIV/EV performance as SF6. The phase-resolved PD patterns of the 20% C3F7CN/80% CO2 gas mixture demonstrated a 3-stage transition phase that was not observed with SF6, which could be due to the discharge mechanism of the weakly attaching CO2 gas used within the mixture.

1. Introduction

Concurrent with the end of the second commitment period of the Kyoto Protocol in 2020, countries have stepped up their efforts in reducing their greenhouse gas (GHG) emissions [1]. A key contributor to the overall GHG emissions is sulphur hexafluoride (SF6), of which 1 kg released into the atmosphere is equivalent to 25.2 tonnes of CO2 emissions due to its high global warming potential (GWP) [2]. The gas SF6 is still heavily used by the power industry to provide dielectric insulation to electrical equipment, such as gas insulated switchgear (GIS) and gas insulated busbar (GIB), accounting for 80% of the annual global usage [3].
A mixture of C3F7CN and CO2 has emerged as a viable alternative to replace SF6 as it can reduce the equivalent CO2 footprint by up to 99% when consider the mass of gas used [4]. Extensive research has been conducted to evaluate the breakdown characteristics of different C3F7CN/CO2 gas mixtures in direct comparison to SF6. Some recent studies have focused on mixtures of 4% to 10% C3F7CN for new-build installations optimised by equipment manufacturers [3,4]. The use of mixtures in the range of 4% to 10% C3F7CN will inherently result in substantially lower dielectric strength than SF6 and would require an elevated operating pressure to attain a similar performance as SF6. It requires significant capital investment and time to replace all existing SF6-containing assets worldwide with new-build installations. An alternative approach is retro-filling existing SF6-designed equipment designed for non-switching applications with an environmentally friendlier alternative that possesses comparable dielectric performance, whilst avoiding the time and cost of replacing equipment that can function for many more years. There is some uncertainty on the long-term performance of a retro-fill solution as the ageing assets are likely to have defects such as protrusions. It is unknown whether there is a significant difference in the PD performance in new alternatives versus SF6 in the presence of defects.
Studies have shown that a mixture of 20% C3F7CN and 80% CO2 possesses similar breakdown strength as SF6 under quasi and uniform field configurations [5,6]. Previous work demonstrated that a 20% C3F7CN and 80% CO2 mixture successfully passed the IEC type tests for 550 kV rated equipment designed for SF6 tested with the same operating pressure [6,7]. The viability of this retro-fill approach was further demonstrated in the National Grid’s recently completed retro-fill project in Richborough substation, Kent [8]. However, limited research [9,10,11] has been carried out on the comparative PD analyses of SF6 and a 20% C3F7CN and 80% CO2 gas mixture that can deliver comparable performance as SF6.
The PDs are caused by localised regions of high electric field stress which can occur due to small protrusions found on the conductor or enclosure as well as floating metallic particles within the gas insulated equipment [12,13,14,15,16]. These defects are less likely to occur in modern equipment due to the improvement in the technical surface finish, assembly methods and quality assurance testing. However, the PD characteristic is still considered a key performance indicator for the design and condition monitoring of SF6-filled gas insulated equipment. There are several PD monitoring and diagnostic methods, such as apparent charge, ultra-high frequency (UHF), and acoustic emission [17,18,19]. The UHF method has been widely used due to its high sensitivity and resistance to external interferences in field environment [20]. As a result, this work utilises the UHF method for the comparative PD measurement of SF6 and C3F7CN/CO2 mixture.
This paper investigates the PD characteristics of the 20% C3F7CN/80% CO2 gas mixture and SF6 gas under AC voltage using external UHF sensors. Two electrode configurations, namely hemispherical rod-plane and plane-plane with varied needle lengths were used to vary the severity of electric field stress. This work is broadly categorised into: (a) PD behaviour characterised in terms of PD inception and extinction voltage (PDIV/EV) values; (b) PD characteristics of the C3F7CN/CO2 gas mixture and SF6 under varying field uniformities were analysed through their PRPD patterns; and (c) discussion of the influencing factors that could affect the PD behaviour in SF6 and the 20% C3F7CN/80% CO2 gas mixture. The results have provided a greater understanding on the fundamental difference in PD behaviour between SF6 and its alternatives, which is beneficial for developing appropriate PD monitoring systems or techniques tailored to new SF6 alternatives.

2. Electrode Design and Maximum Electric Field (Emax) Simulations

Electrode defects were developed with the use of needles to represent two types of PD defects commonly found in practical gas insulated equipment [13,14,15,16]. The configurations were fabricated to mimic a protrusion-on-conductor (POC) and a protrusion-on-enclosure (POE). Figure 1 shows the different electrode configurations experimentally investigated in this paper.
For the POC tests, the needle was attached onto the HV electrode as shown in Figure 1a,b. Two different needle lengths of 5 and 15 mm were used to vary the field uniformity of the electrode configurations. The gap spacing from the needle tip to the grounded plane was always kept constant at 10 mm. For the POE tests, the needle was inserted into the ground electrode as illustrated in Figure 1c. The needle length and the gap spacing of needle-to-plane configuration were kept constant at 15 and 10 mm, respectively. As shown in Figure 1d, the needle had a diameter of 1 mm and a tip radius of 5 μm. All electrodes were made of aluminium while the needles were fabricated in tungsten.
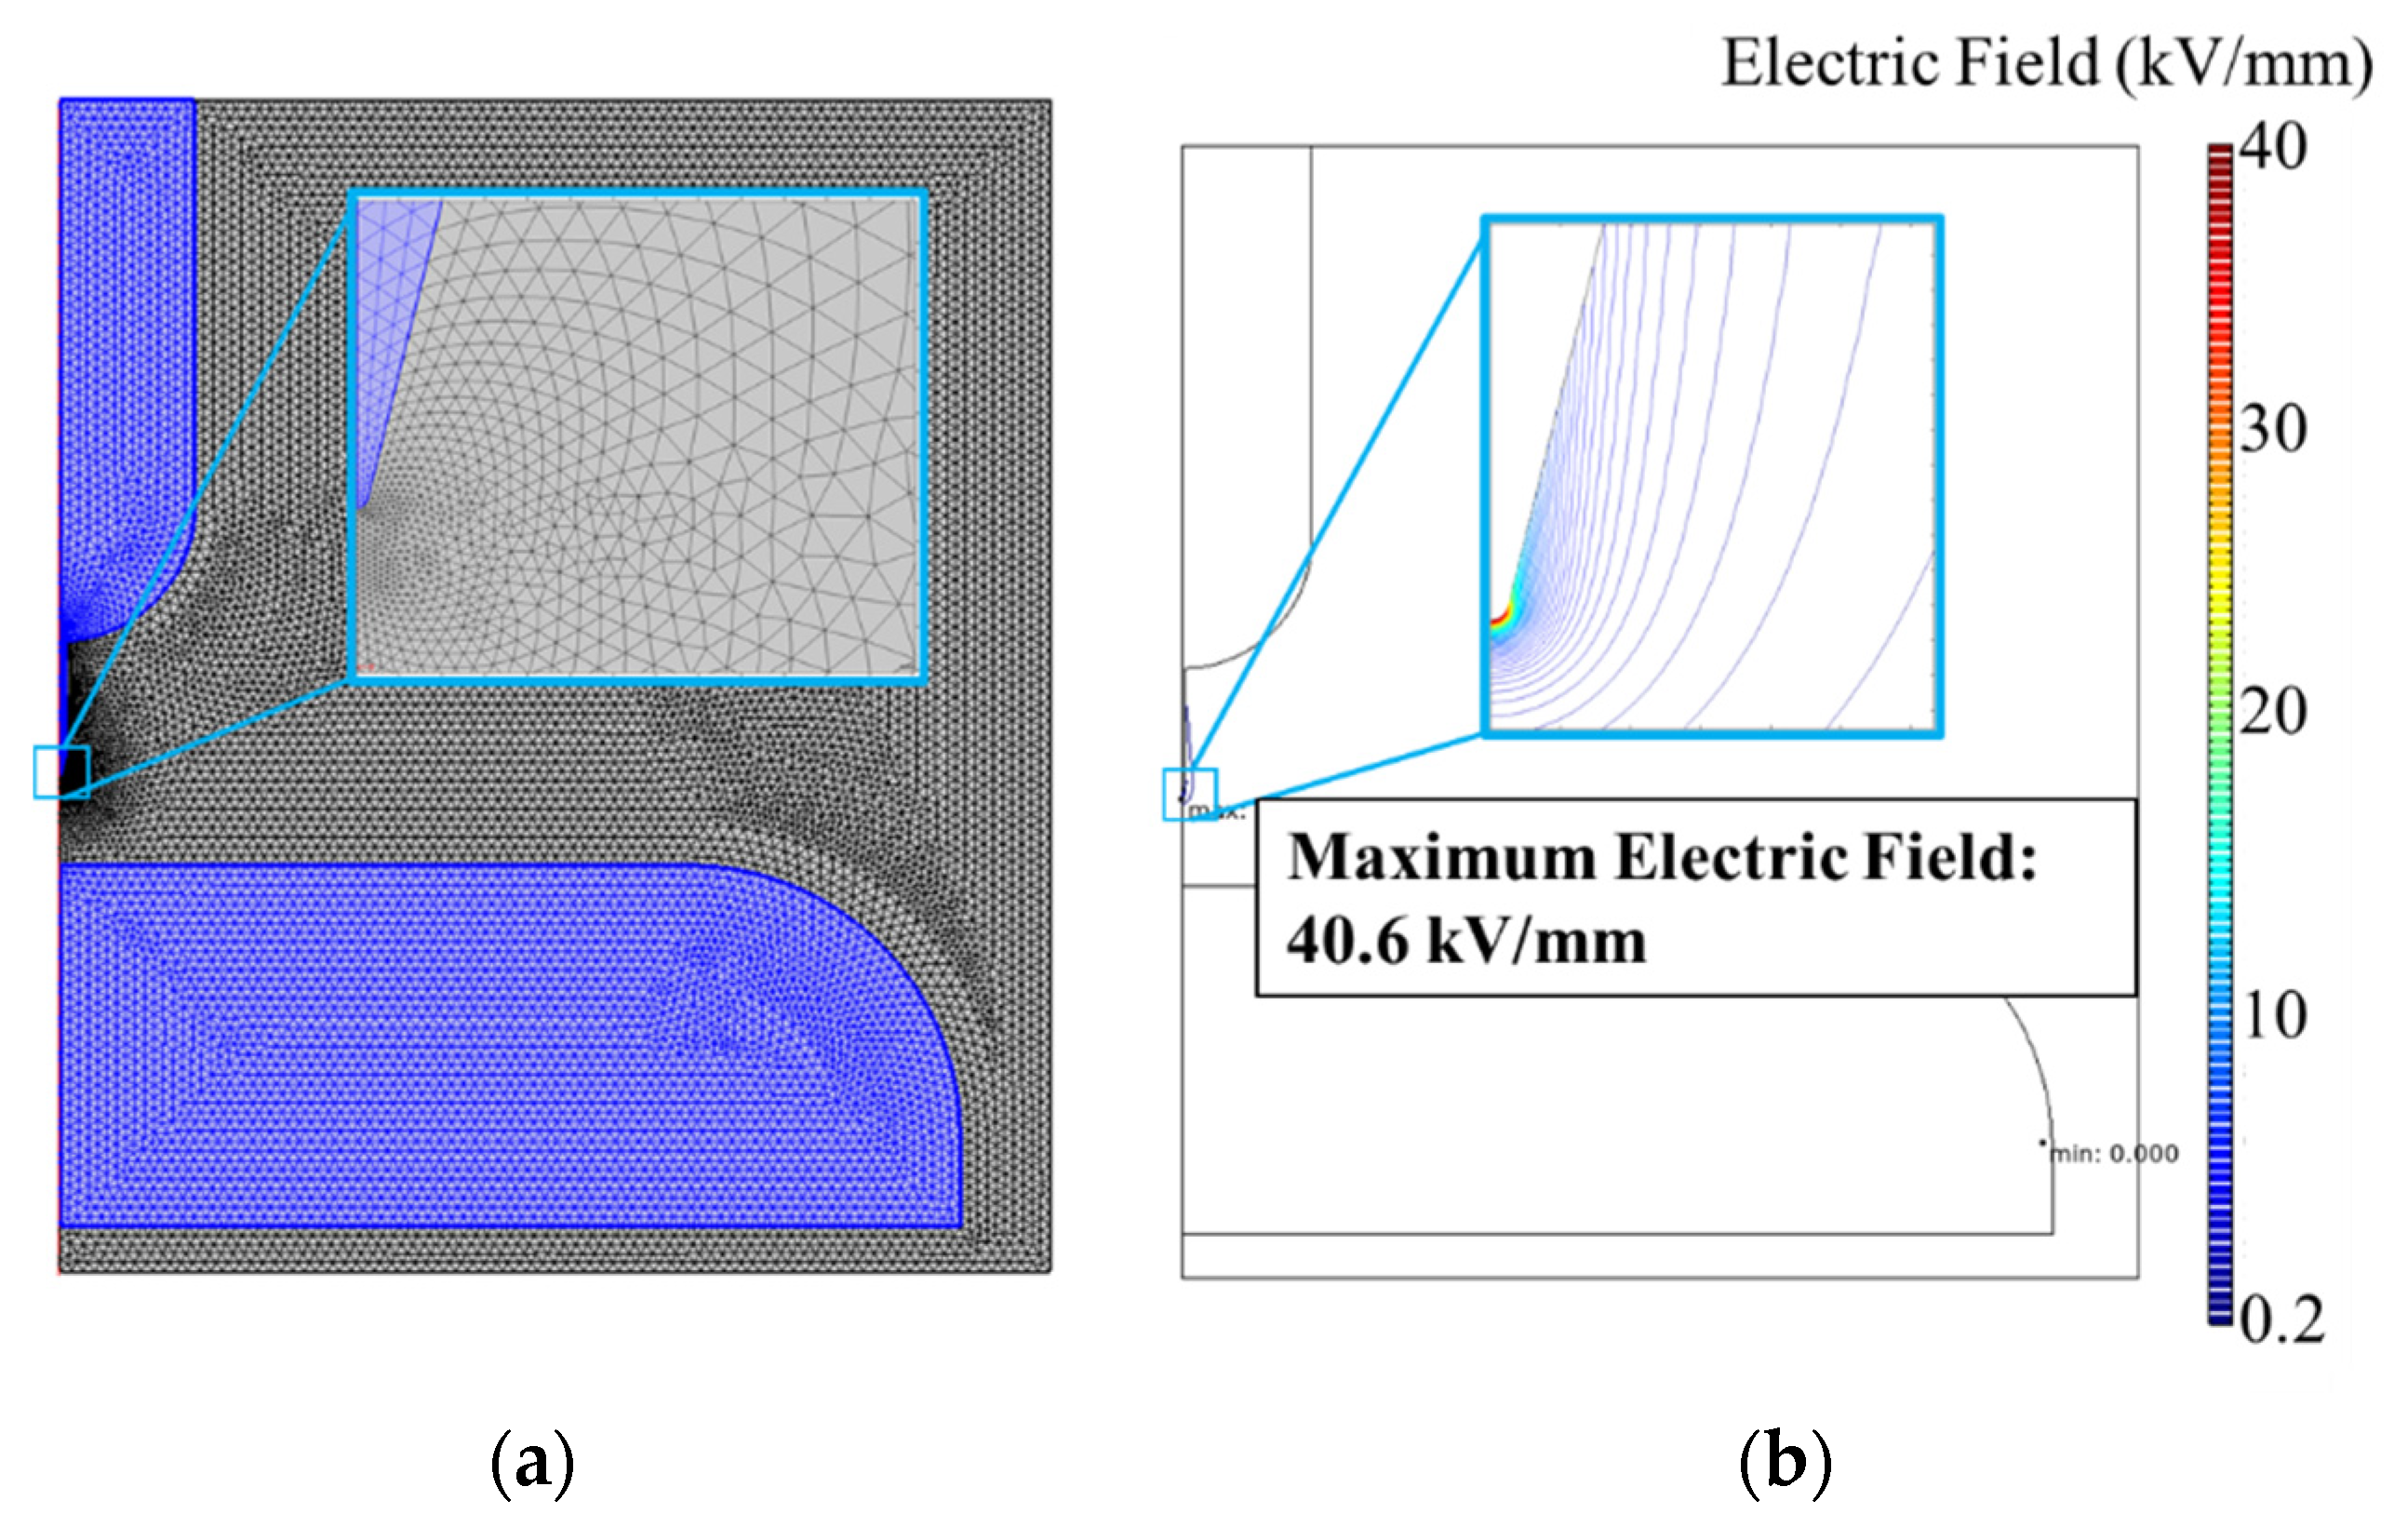
Simulations were conducted using the software COMSOL Multiphysics 5.5 to evaluate the change in field uniformity for different needle lengths and electrode configurations. A mesh refinement study was performed for each model to ensure that the simulation results were mesh independent [21]. An example of the electric field distribution of the electrode configuration RPC-15 mm is shown in Figure 2. An input voltage of 1 kV was applied to the HV electrode to obtain the maximum electric field value.
The field utilisation factor, f, is an indication of the field uniformity in an electrode configuration and was calculated using Equation (1):
f = E m e a n E m a x = U / d E m a x = U d · E m a x
where U is the applied voltage, d is the needle-to-plane distance (10 mm) and Emax was computed in COMSOL.
Table 1 illustrates the Emax, calculated f and abbreviations for all the configurations used for the PD experiments. The simulation has shown that the electrode configurations used in this work have covered a wide range of field uniformities used to investigate the PDIV/EV and PRPD characteristics of C3F7CN/CO2 mixture in comparison to SF6. Abbreviations will be used for all the configurations hereafter for simplicity.

3. Design of Experiment

3.1. Experimental Setup

Detailed description of the experimental setup for the PD tests using the UHF method in this paper can be found in [11]. Experiments were conducted in a stainless-steel vessel that has a maximum operating pressure of 10 bar absolute and a 325 kV ACRMS HV bushing. The AC voltage was generated using a 150 kV transformer. Note that all pressures used in this paper are absolute values.
The voltage reference value was taken though a capacitive divider connected in parallel with the pressure vessel and the transformer. Electrode configurations shown in Figure 1 were used to initiate PD activity. External UHF sensors were fixed onto the two viewing windows of the test vessel and were connected directly to a 4 GHz bandwidth oscilloscope using 15-metre, RG213 coaxial cables [22]. As shown in Figure 3, oscilloscopes were used for pulse waveform capture and to determine the PDIV/EV while a HVPD Kronos® Spot Tester combined with a UHF converter was used for the PRPD measurements [23]. The purpose of the UHF converter was for converting the high frequency PD signals (≈1 GHz) down to the 50 MHz bandwidth of the acquisition system.
A sensitivity check as detailed in [24,25] was performed to verify that the UHF sensors were able to accurately measure PD activity. Because of polarisation, combined with the fact that the polarisation of the incoming signals was unknown, the position of the sensors was adjusted to have a horizontal sensor being perpendicular to the needle and a vertical sensor being parallel to the needle. This helps in covering both directions of electromagnetic (EM) wave oscillation. The tests indicated that the horizontal sensor was comparatively more sensitive to the PD activity and hence used to acquire the subsequent UHF PD results.

3.2. PD Test Procedure

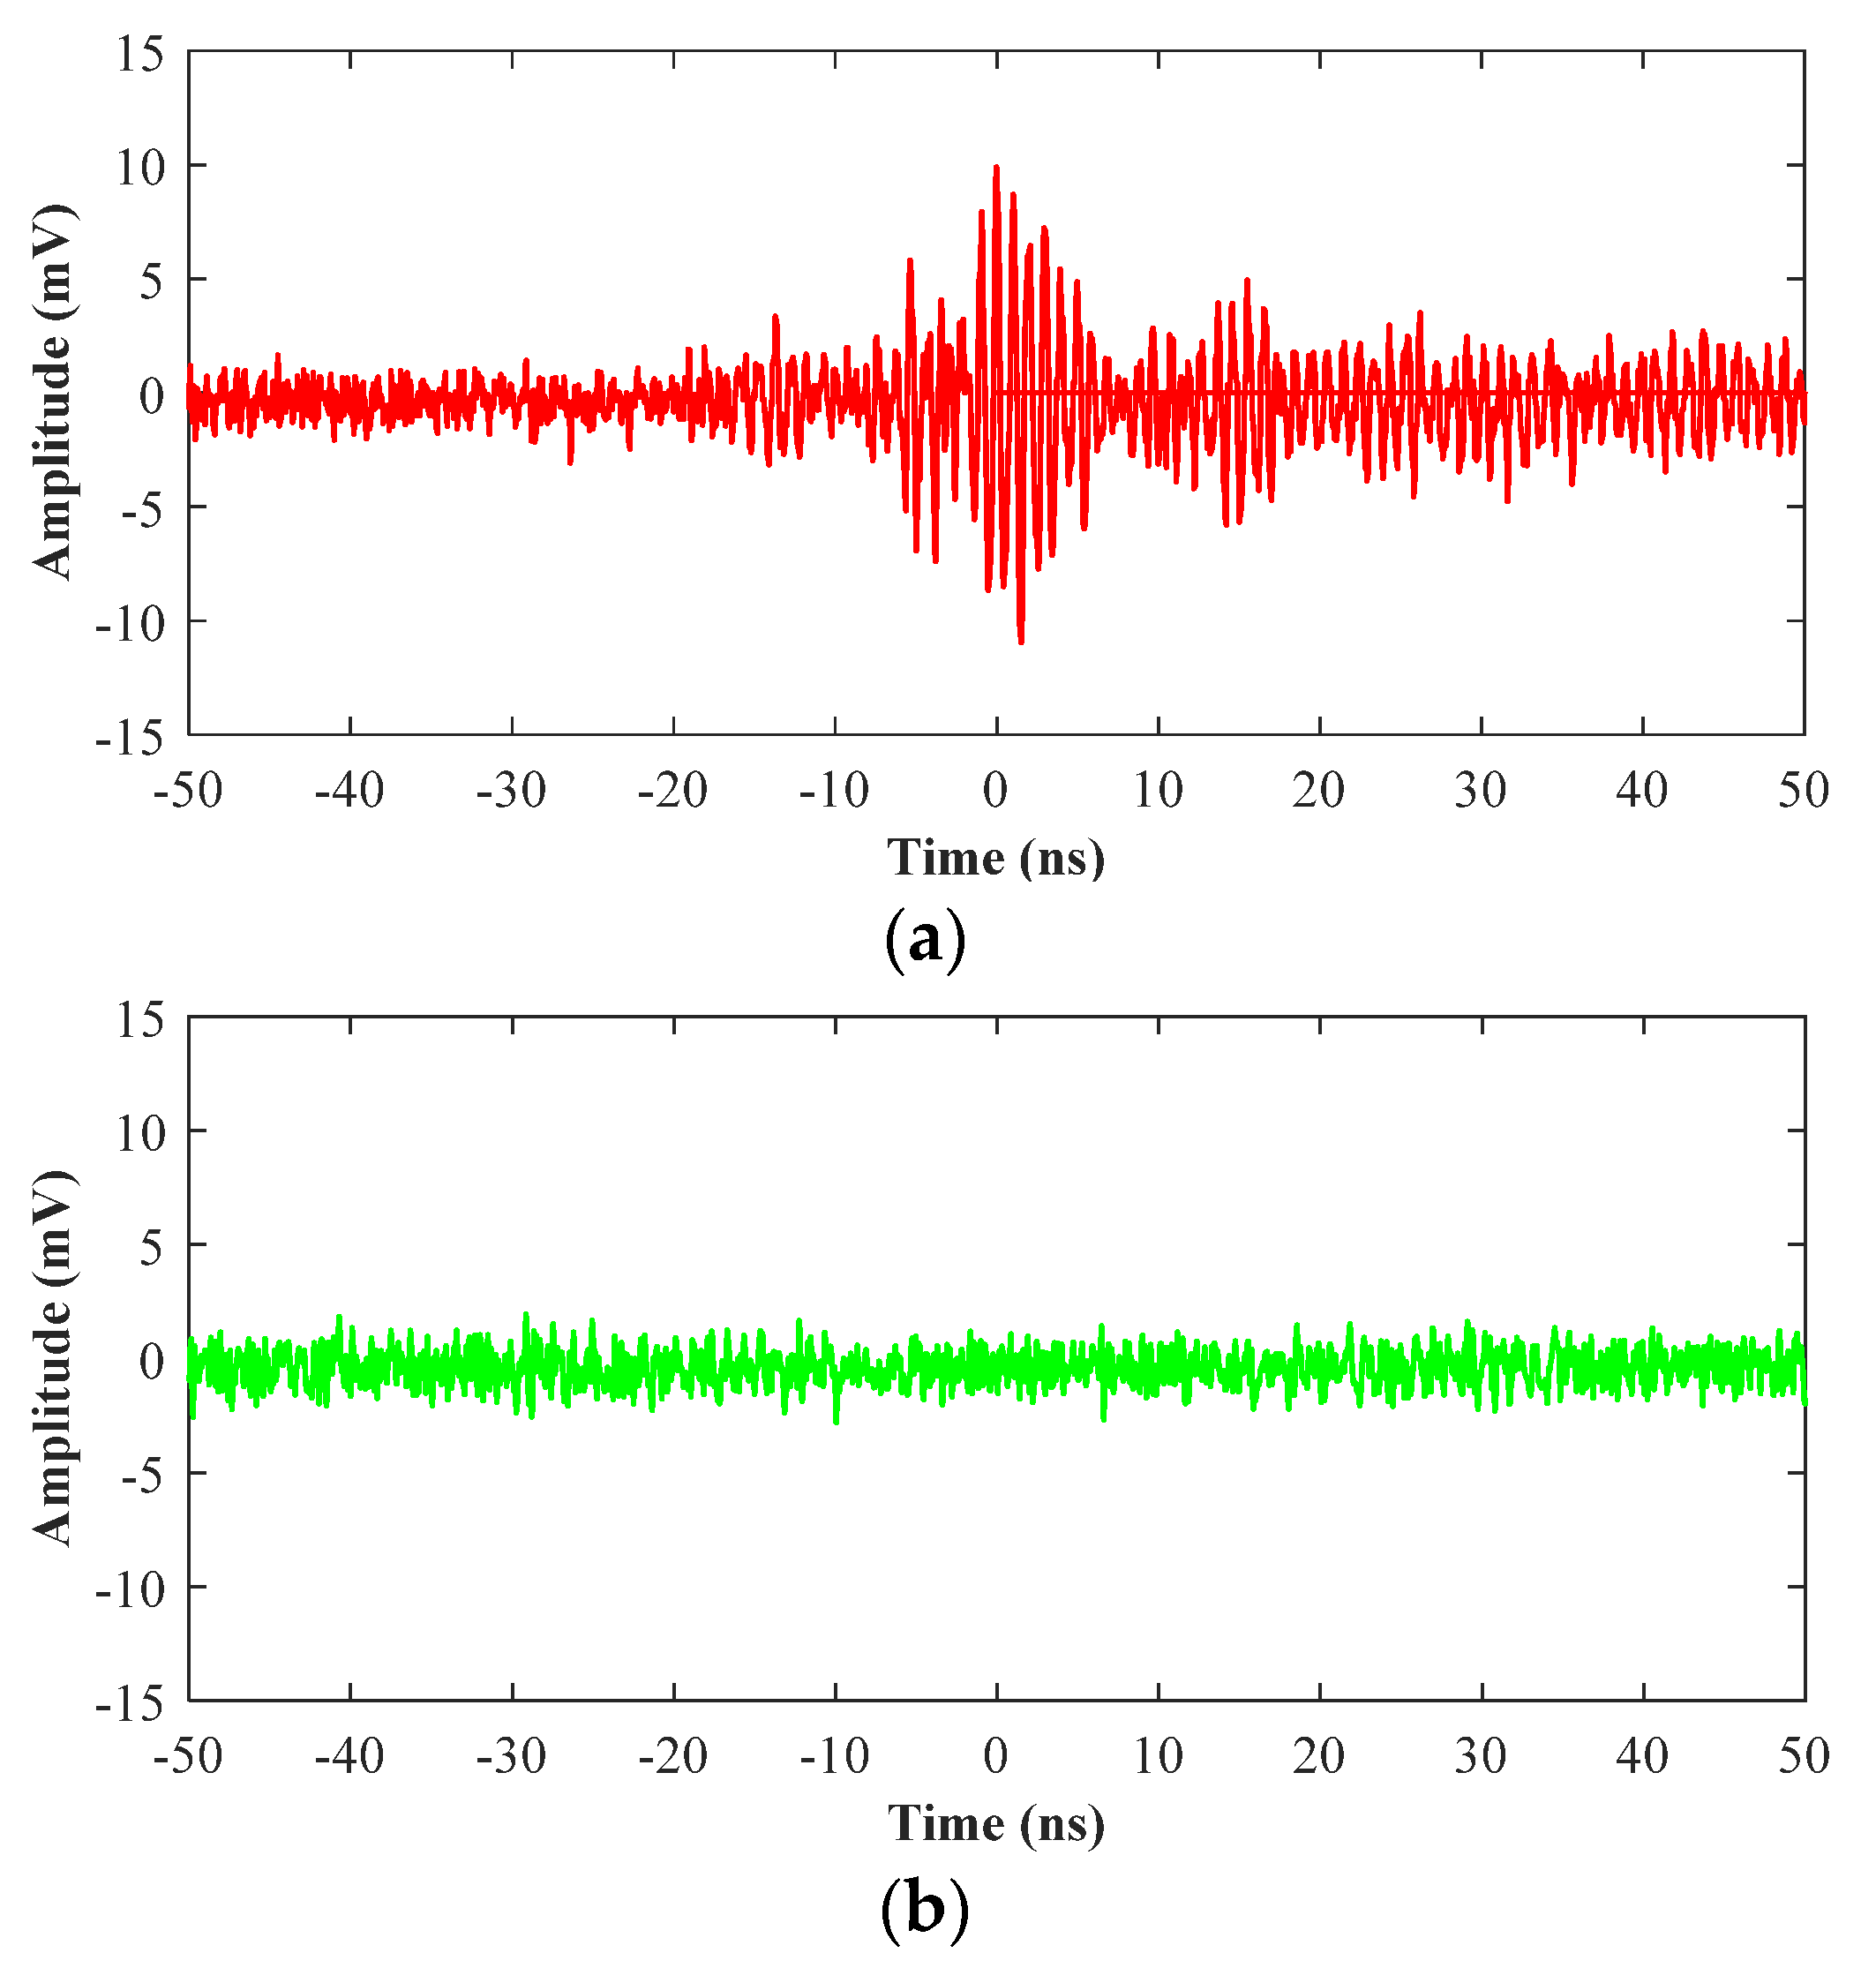
The voltage was raised from zero with ≈1 kV steps every 3 s which provided sufficient time interval for the oscilloscope to trigger on PD activity. The oscilloscope trigger level for the UHF method was set at 5 mV (10 mVpk-pk) and signals exceeding this level were categorised as PDs. Note that the background noise signals within the laboratory did not exceed 8 mVpk-pk. The threshold was determined through comparing the signals from the UHF sensor with the detailed procedure reported in [11]. An example of a PD signal with the specific setup is shown in Figure 4a. The PD signal is very distinctive from the maximum noise level detected in the lab which was around 8 mVpk-pk. A typical noise level signal during these experiments is also shown in Figure 4b.
In this study, the measured PDIV was the corresponding voltage level with consistent PD activity above the trigger level, whereas, the PDEV was recorded as the voltage level where PD signals above 5 mV were extinguished. The procedure was repeated for five times to obtain the average PDIV and PDEV values with their standard deviations.
Note that PDIV/EV measurement used an oscilloscope that was directly connected to UHF sensors and, therefore, is an ultra-wideband time domain measurement. The PRPD patterns and PD amplitudes were recorded through a UHF converter with HVPD Kronos® Spot Tester software, a zero-span frequency domain measurement, with a bandwidth of 1050 to 1150 MHz. The measurement methods are specified in IEC 62478:2016 [25].

4. PDIV and PDEV Characteristics

4.1. Hemispherical Rod-Plane Configuration

In the previous work by the authors using the RPC-15 mm configuration, it was found that SF6 has significantly higher inception and extinction voltages than the 20% C3F7CN and 80% CO2 gas mixture for 1 to 4 bar [11]. However, the difference between the gas mixture and SF6 reduced significantly under 5 bar. The SF6 demonstrated a relatively linear relationship with pressure increase throughout the investigated range. The C3F7CN/CO2 gas mixture appeared to be more affected by highly divergent fields than SF6 for 1 to 4 bar pressure, while a comparable PDIV to SF6 was observed under 5 bar.
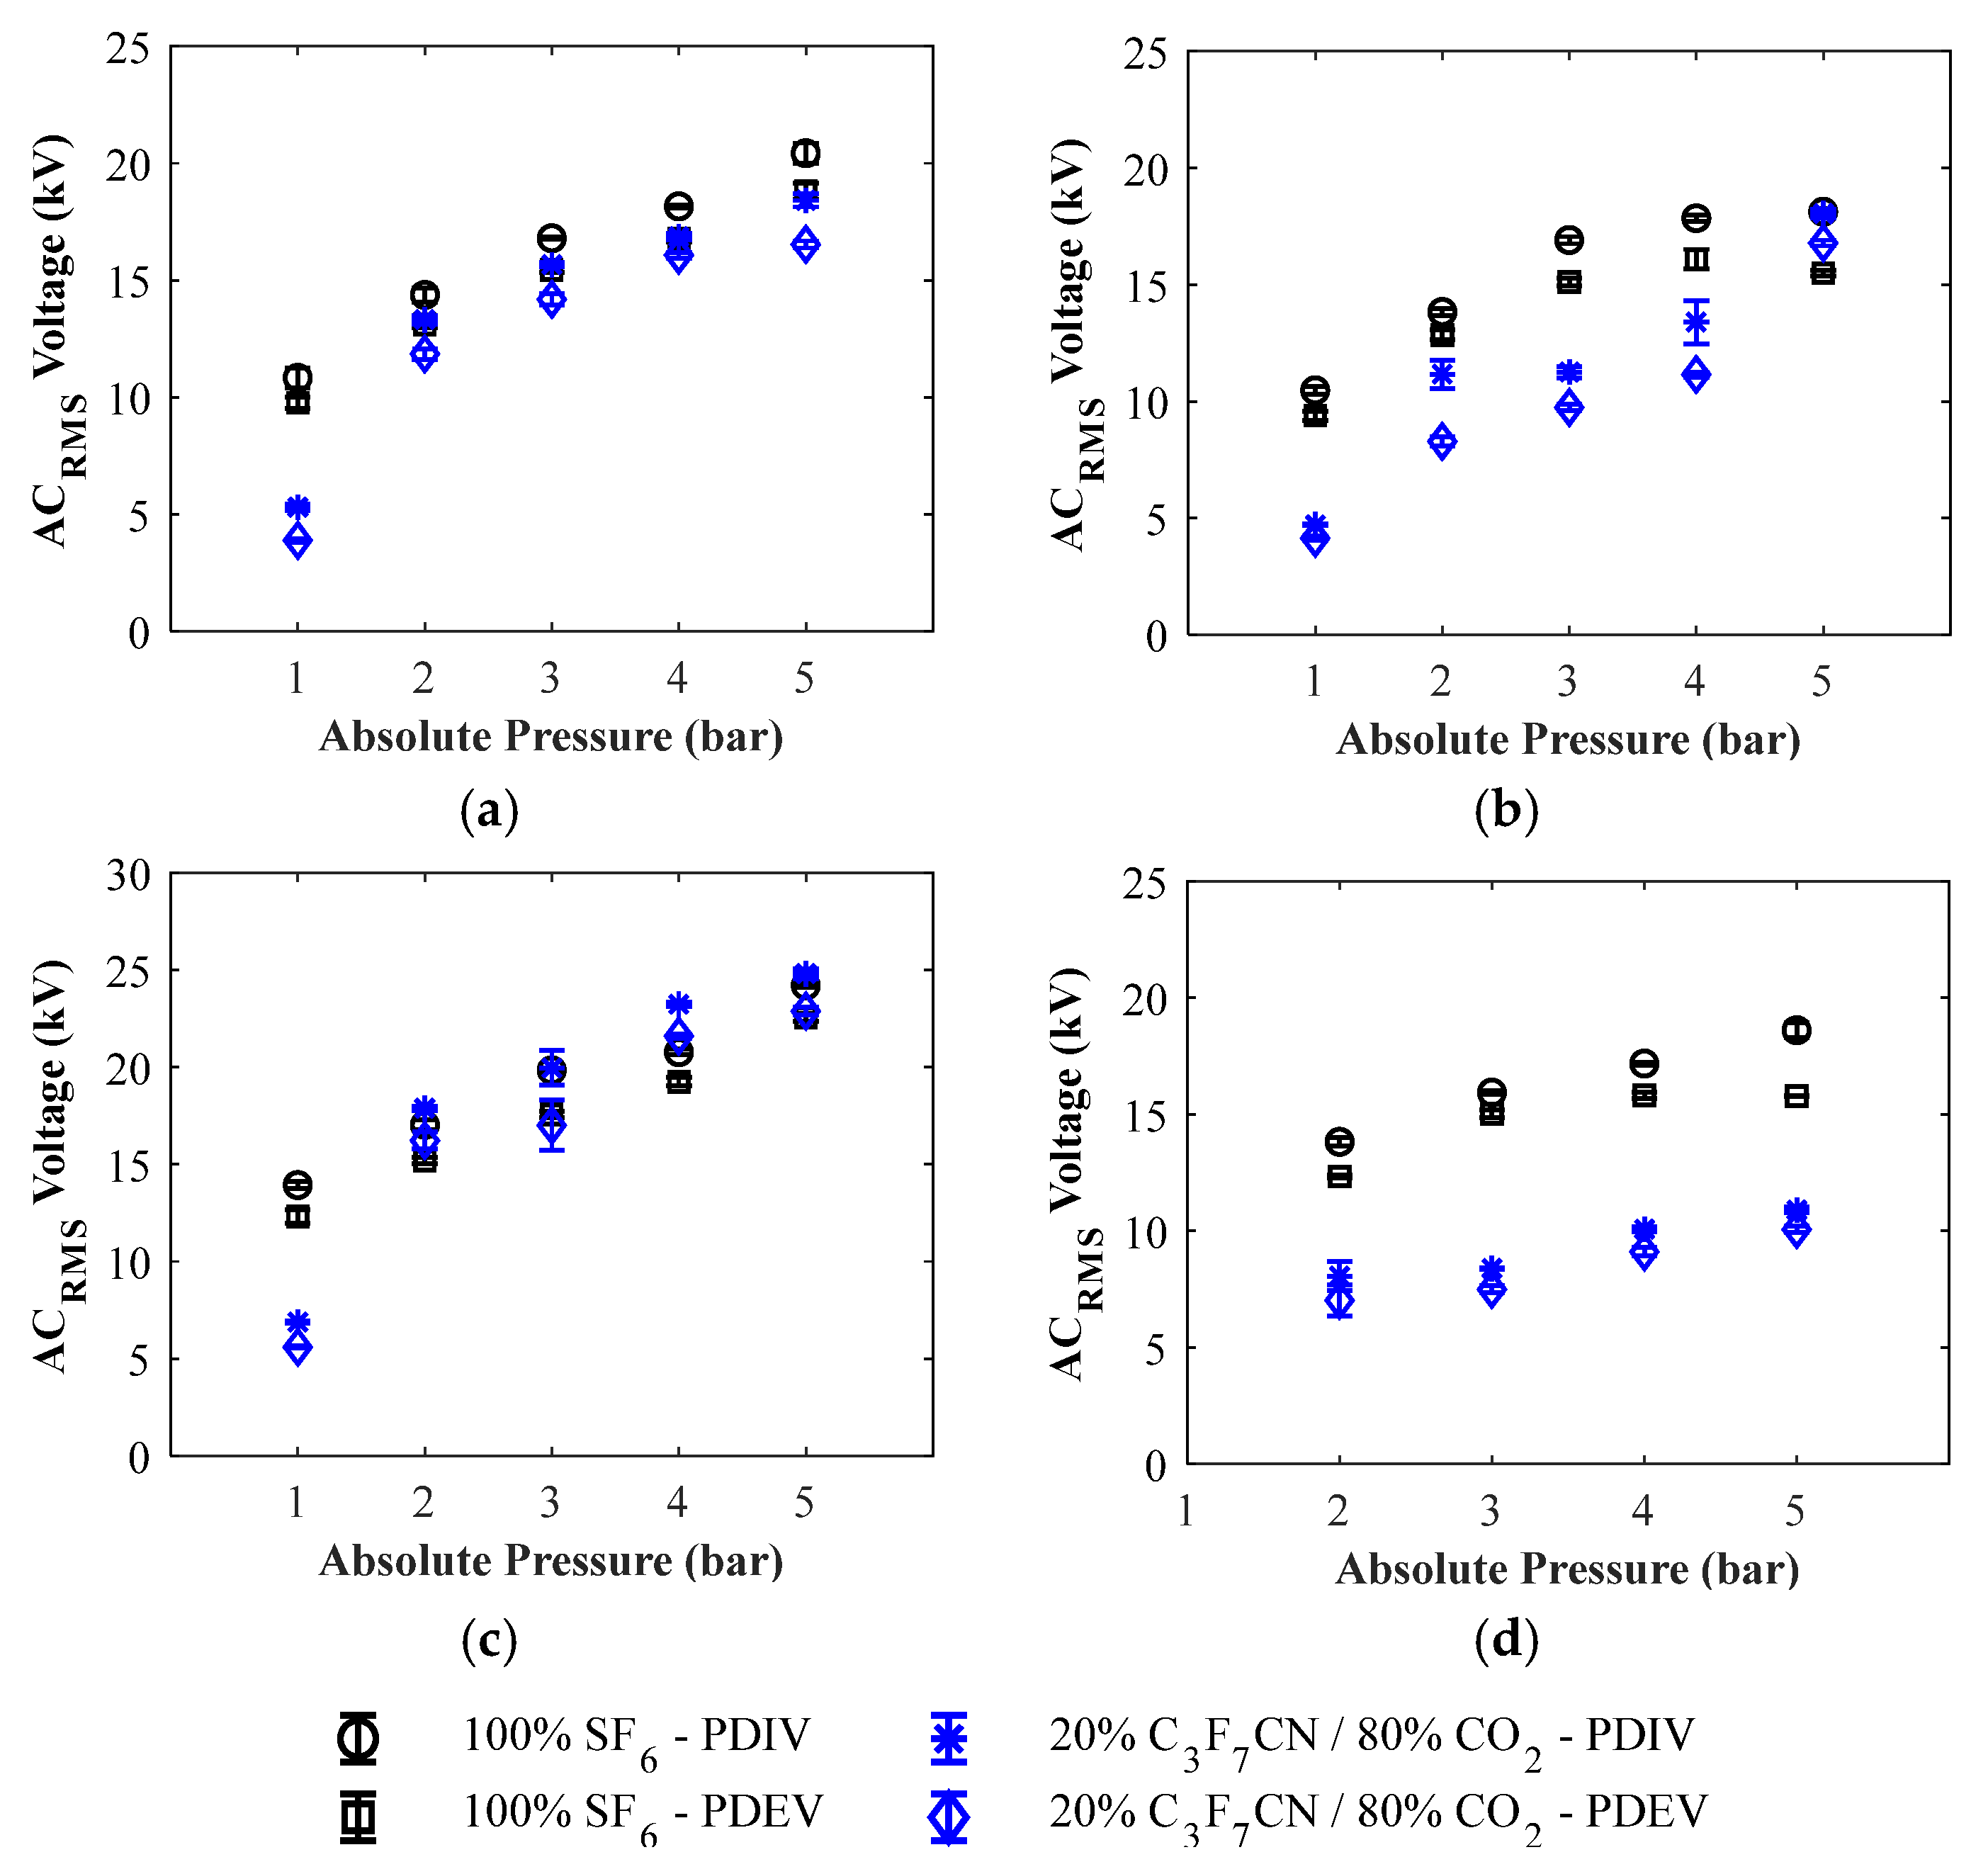
Figure 5 displays the PDIV/EV characteristics plotted using the RPC-5 mm, PPC-15 mm, PPC-5 mm, and PPE-15 mm electrode configurations. Figure 6 shows the 5 min average of signal amplitude energised at 100% PDIV after the prior PDIV/EV measurements. In Figure 5a, the PDIV/EV values for both gases demonstrate a fairly linear correlation with pressure except under the atmospheric pressure (1 bar). The signal amplitude in Figure 6a of 20% C3F7CN/80% CO2 is significantly higher than SF6 at 1 bar. Hence, the PDIV/EV results measured at 1 bar for 20% C3F7CN/80% CO2 is comparatively lower than SF6 due to the discharge signal emitted being more detectable.
Compared to results of RPC-15 mm (f = 0.0025) reported in [11], Figure 5a shows that there was a negligible effect on SF6 due to the change in f as the PDIV/EV values are comparable regardless of the needle length used. The PDIV/EV values of the 20% C3F7CN/80% CO2 gas mixture dramatically improved with a more uniform field and can be attributed to the needle length reduction (32% increase in the f value).
The strong attachment nature of the fluorine element in SF6 could be the reason for sustaining the PDs effectively regardless of the field uniformity investigated in this paper. As the gas mixture is mostly comprised of CO2 gas, the presence of a weakly attaching element such as carbon or oxygen could lead to PDs being initiated more readily under highly divergent fields. Therefore, the critical threshold of SF6 for PD inception under highly divergent fields appears to be higher than that of the C3F7CN/CO2 mixture.

4.2. Plane-Plane Configuration

Figure 5b shows the PDIV/EV of PPC-15 mm with a comparable f (0.0029) to RPC-15 mm (0.0025), which explains that both configurations exhibited comparable PDIV/EV values. The PDIV/EV values of the 20% C3F7CN/80% CO2 gas mixture were considerably lower than SF6 for pressures of 1 to 4 bar. The signal amplitude of 20% C3F7CN/80% CO2 in Figure 6b is much higher than SF6 under the atmospheric pressure, which indicates a stronger discharge signal was generated and resulted in a comparatively lower PDIV/EV than measured for SF6.
The PDIV of SF6 shown in Figure 5c for PPC-15 mm is similar to the PPE-15 mm configuration (needle protrusion on the earthed electrode) in Figure 5d. This specific configuration provides the most uniform electric field used in this paper with a calculated f value of 0.0043. As shown in Figure 5c, in the range of 2 to 5 bar, the PDIV/EV values of the 20% C3F7CN/80% CO2 gas mixture exceed that of SF6 using this electrode arrangement. This agrees with previous studies [10], where the use of a 2 mm needle resulted in comparable PDIV between the two gas mediums but was tested for a different pressure range. In contrast, the PDIV/EV values of the gas mixture were about half of SF6 under 1 bar.
The signal amplitude for the 20% C3F7CN/80% CO2 gas mixture was shown to be comparatively higher when the PDIV is lower than SF6, as shown in Figure 6a,b. The difference in discharge amplitude at 1 bar pressure is smaller in Figure 6c due to a more uniform electric field configuration tested. The increasing pressure dramatically improve the PDIV of the C3F7CN/CO2 gas mixture and exceeds that of SF6. Results obtained at 1 bar pressure for the 20% C3F7CN/80% CO2 gas mixture appear to be unaffected by the change in field uniformity as PDIV/EV values for all tested electrode configurations are almost identical. This observation indicates that at a low pressure, CO2 molecules are more influential in the discharge activity as there is an insufficient number of C3F7CN molecules. As the pressure increases, there are enough C3F7CN molecules to suppress PD activity. This suggests that discharge occurrences in 20% C3F7CN/80% CO2 can be readily detected using the UHF method as discharges under lower pressures are mainly attributed to CO2.
Figure 5b,c shows that the PDIV of SF6 improved with a reduction in the needle length. Likewise, the PDIV/EV values of the 20% C3F7CN/80% CO2 gas mixture increased with a shorter needle length. Similar to RPC-5 mm and RPC-15 mm configurations, field uniformity has a more profound influence on the 20% C3F7CN/80% CO2 gas mixture than SF6. This indicates that the PDIV of the 20% C3F7CN/80% CO2 mixture will be affected by a change in field uniformity.
Regardless of the defect location, SF6 has superior PD characteristics when compared to the 20% C3F7CN/80% CO2 gas mixture under highly divergent fields as shown in Figure 5d. The C3F7CN/CO2 gas mixture appears to be adversely affected by the needle location as the improvement in PDIV under 5 bar shown in Figure 5b was not observed in Figure 5d. Note that the varying pressure had little effect on the discharge amplitude in PPE-15 mm configuration.
It was observed for all tested configurations with the protrusion on the HV conductor, the signal amplitude of 20% C3F7CN/80% CO2 was higher than SF6 at low pressures, which corresponds to the lower PDIV/EV measured for the mixture than SF6. Similar observations on the effect of field uniformity on the dielectric performance of the two gas mediums were made in previous studies with breakdown experiments under non-uniform [26] and quasi-uniform electric fields [6,27]. The SF6 had a better performance than the 20% C3F7CN/80% CO2 gas mixture under non-uniform fields. However, with more uniform fields as found in GIL/GIB equipment, a 20% C3F7CN/80% CO2 gas mixture exhibited a comparable dielectric performance as SF6. It can be summarised that PDIV/EV measurements via the UHF method are dependent on insulating gas medium, pressure, field uniformity, and the signal amplitude emitted and transmitted during PD discharges.

5. PRPD Patterns

5.1. Hemispherical Rod-Plane Configuration

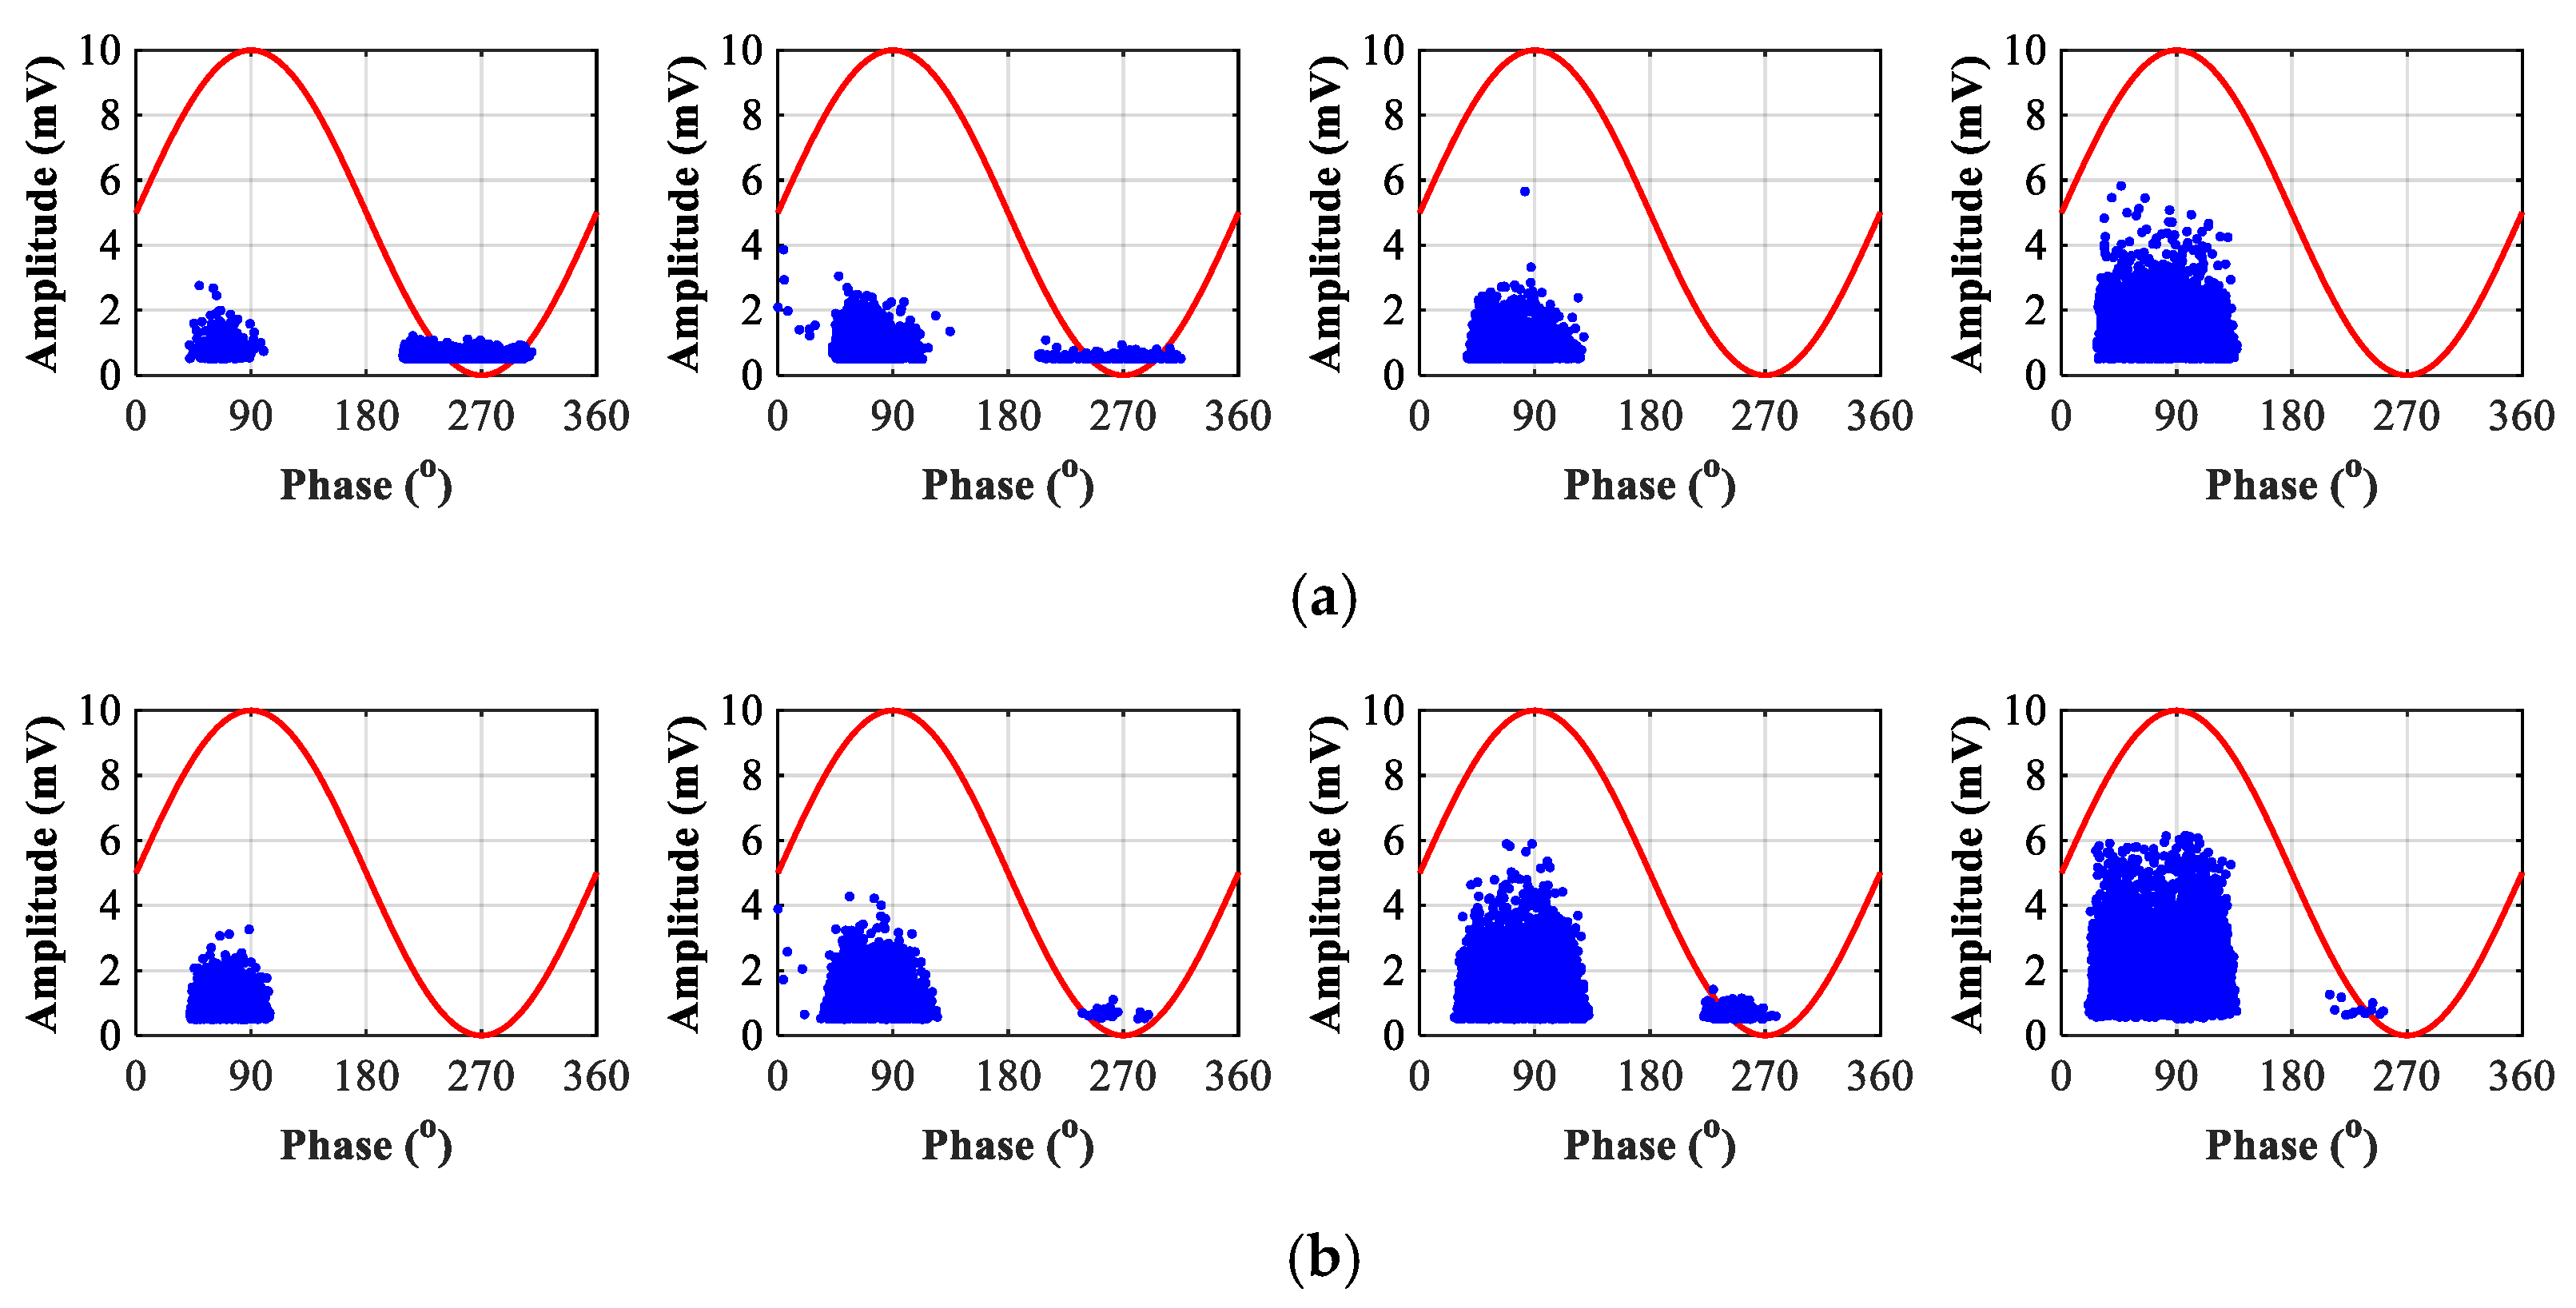
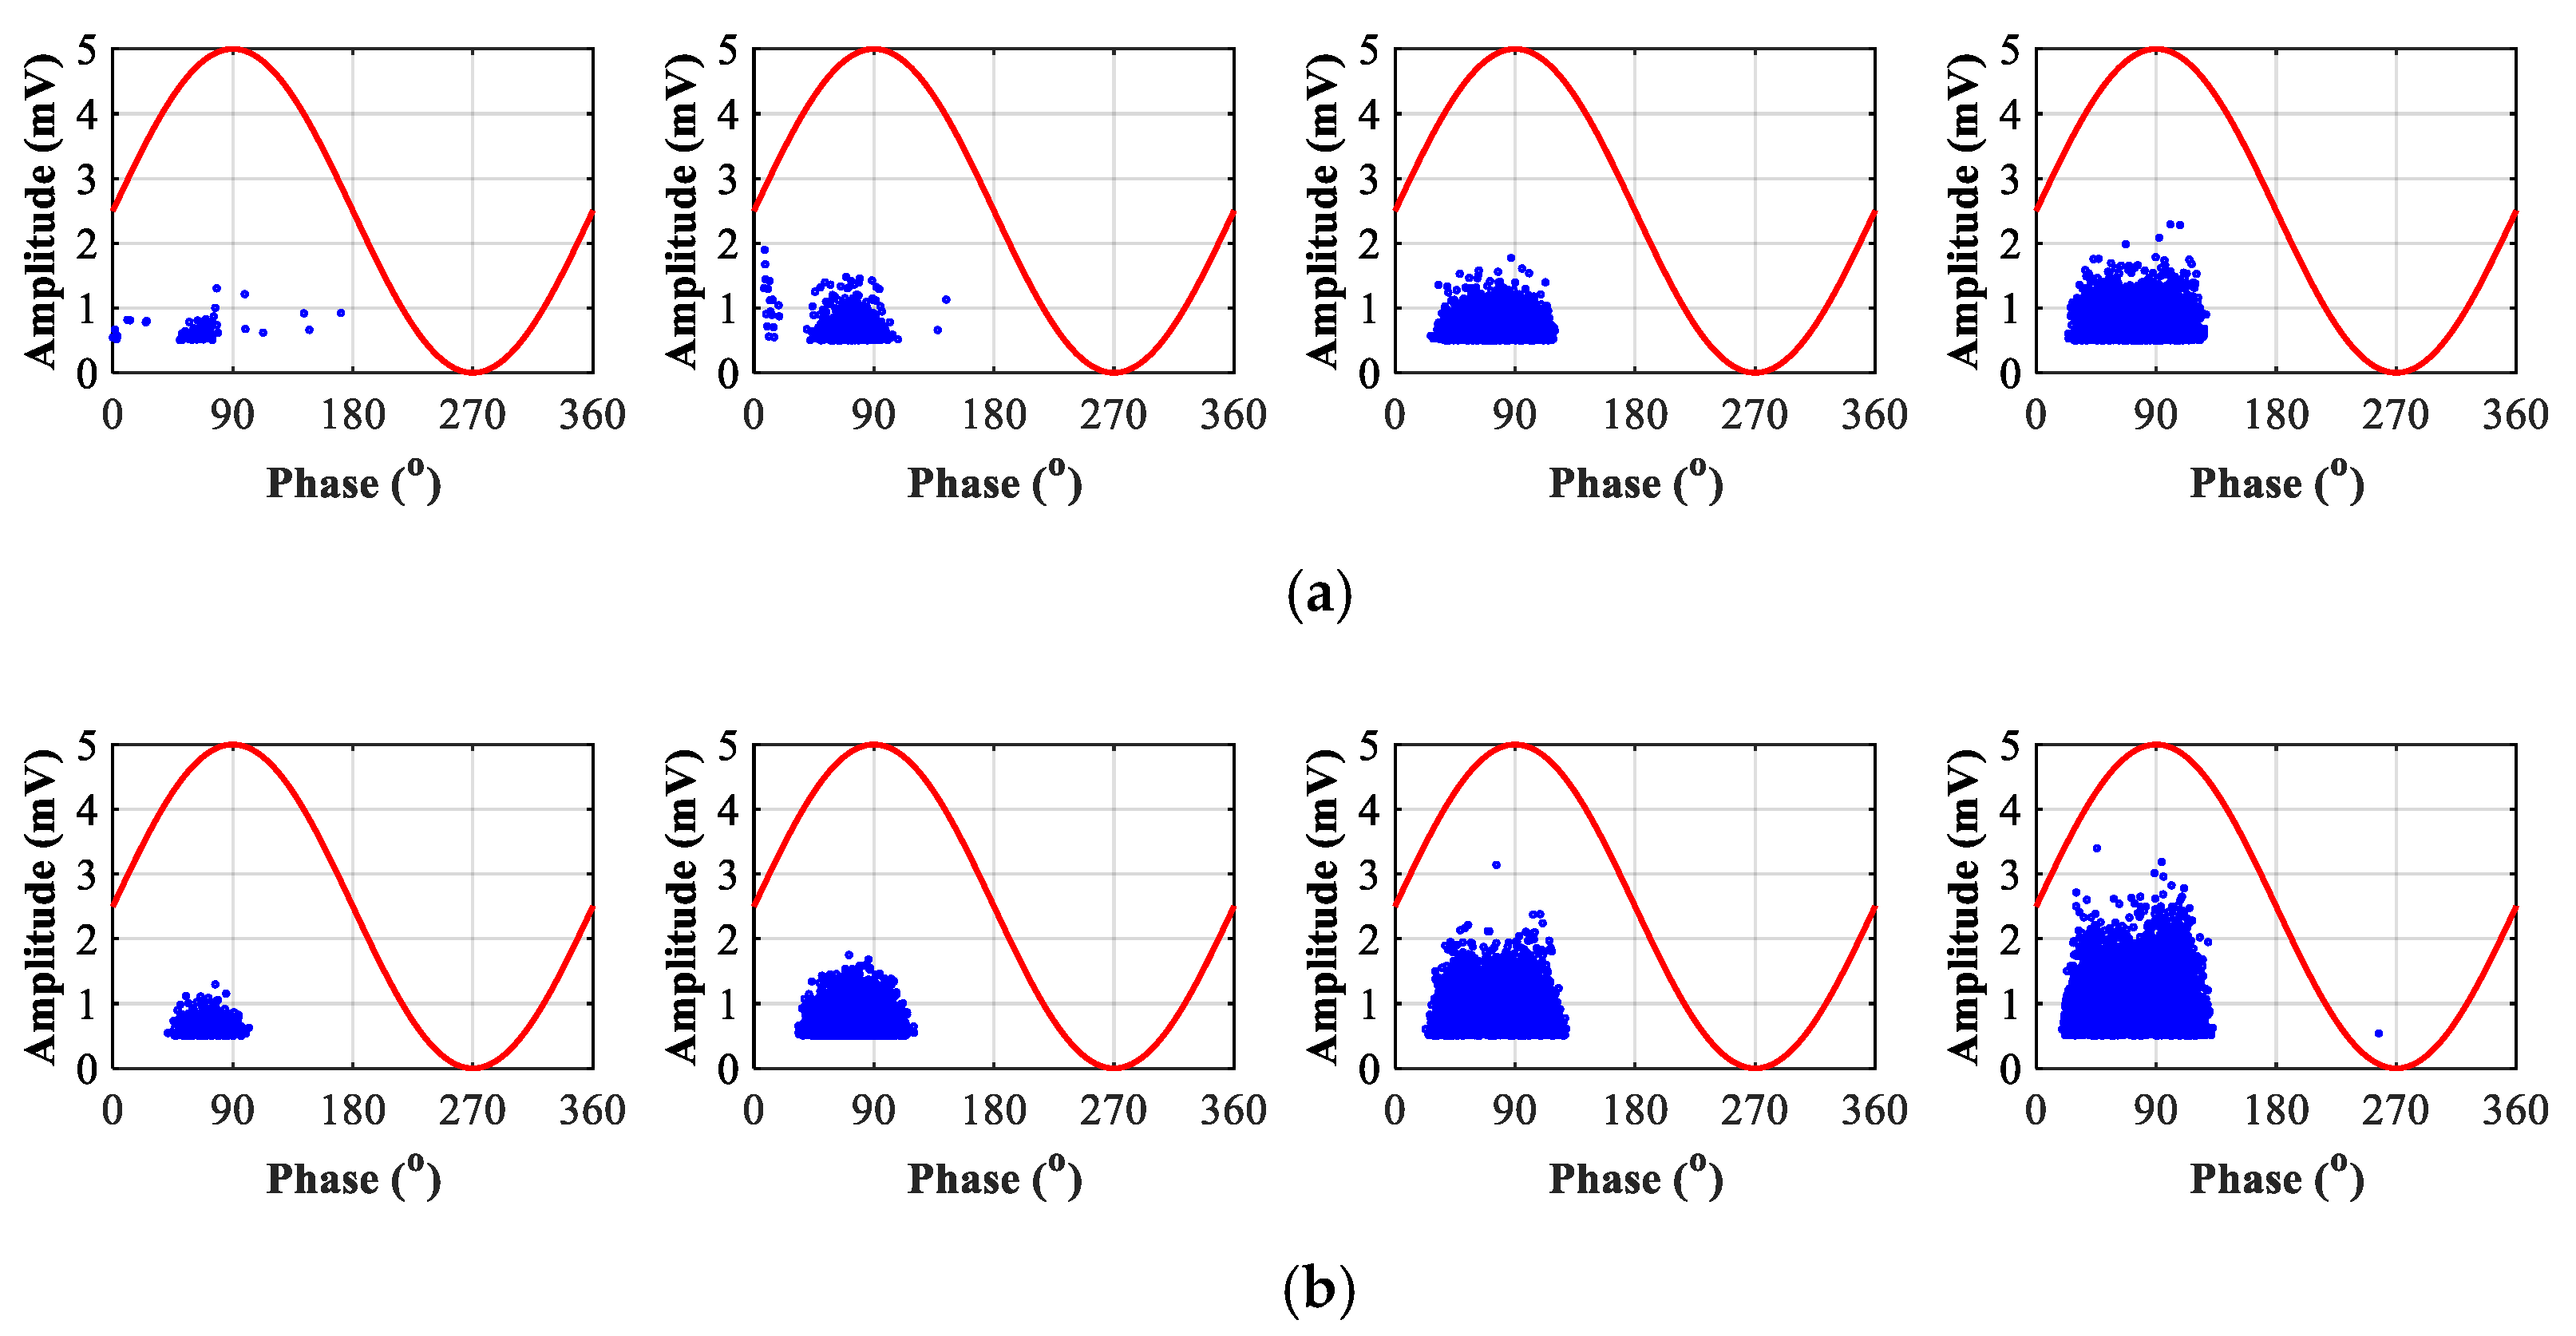
The measurement of the UHF signal is based on the EM wave emitted due to discharges at the needle tip. In the event of PD activity in the negative half-cycle, the discharge occurs when electrons are emitted from the needle, and positively charged particles move towards the needle. The ionisation process must also be sufficiently strong to capture the emitted EM wave through the UHF sensor. Conversely, PD activity in the positive half-cycle indicates the electrons or negatively charged particles move toward the needle and thereby generate signals detectable by the UHF sensor. As shown in Figure 7a, the PD is observed on both the positive and negative half-cycles for 20% C3F7CN/80% CO2 at the PDIV level using an RPC-5 mm configuration under 5 bar. In negative half-cycles, CO2 is being ionised and there are collisions between the positively charged particles in the gas medium and electrons around the needle tip. It is assumed that when the electric field is low, only CO2 is ionised and discharging in CO2 under negative half-cycles as reported in [11]. When the electric field has increased above certain voltage level, the CO2 is in an ionised state. In this case, C3F7CN as part of the binary mixture will be ionised and contributes to the PD activity, which subsequently releases current pulses at positive half-cycles.
Figure 7b shows PRPD patterns of SF6 under 5 bar for the RPC-5 mm configuration. For SF6, PDs mostly occurred on the positive half-cycle of the AC waveform, with some PD activity also observed on the negative half-cycle as the applied voltage increased. The polarity effect is due to the streamer being initiated at lower voltages in the negative half-cycle. Note that the negative streamer was limited in size when compared to the positive ones. Thus, the signal amplitude may be insufficient for UHF detection as it is based on the distance of EM emission at the needle tip where PD activity is localised in the negative half-cycle [28]. For PRPD measurements, the PD signal due to positive streamer can be more readily detected. Hence, discharges were observed in the positive half-cycle for both SF6 and the C3F7CN/CO2 mixture. Due to the strong electron affinity of SF6, negative ions were formed with enhanced discharge activities observed in the positive half-cycle.
To summarise, the 20% C3F7CN/80% CO2 gas mixture was observed to go through a 3-stage transitional PRPD behaviour using both RPC-5 mm and RPC-15 mm: (i) PDs appear on the negative half-cycle at the PDIV level, (ii) consistent PDs on both the positive and negative half-cycles at higher voltages, and (iii) majority of PDs shift to the positive half-cycle at very high voltages (200% PDIV) where it starts to behave as SF6. The PD activity for SF6 mostly occurred on the positive half-cycle with some small activity on the negative half-cycle without a transitional phase as found for a 20% C3F7CN/80% CO2 gas mixture. The SF6 results are in good agreement with reported findings in [15], where the majority of PDs occurred on the positive half-cycle.
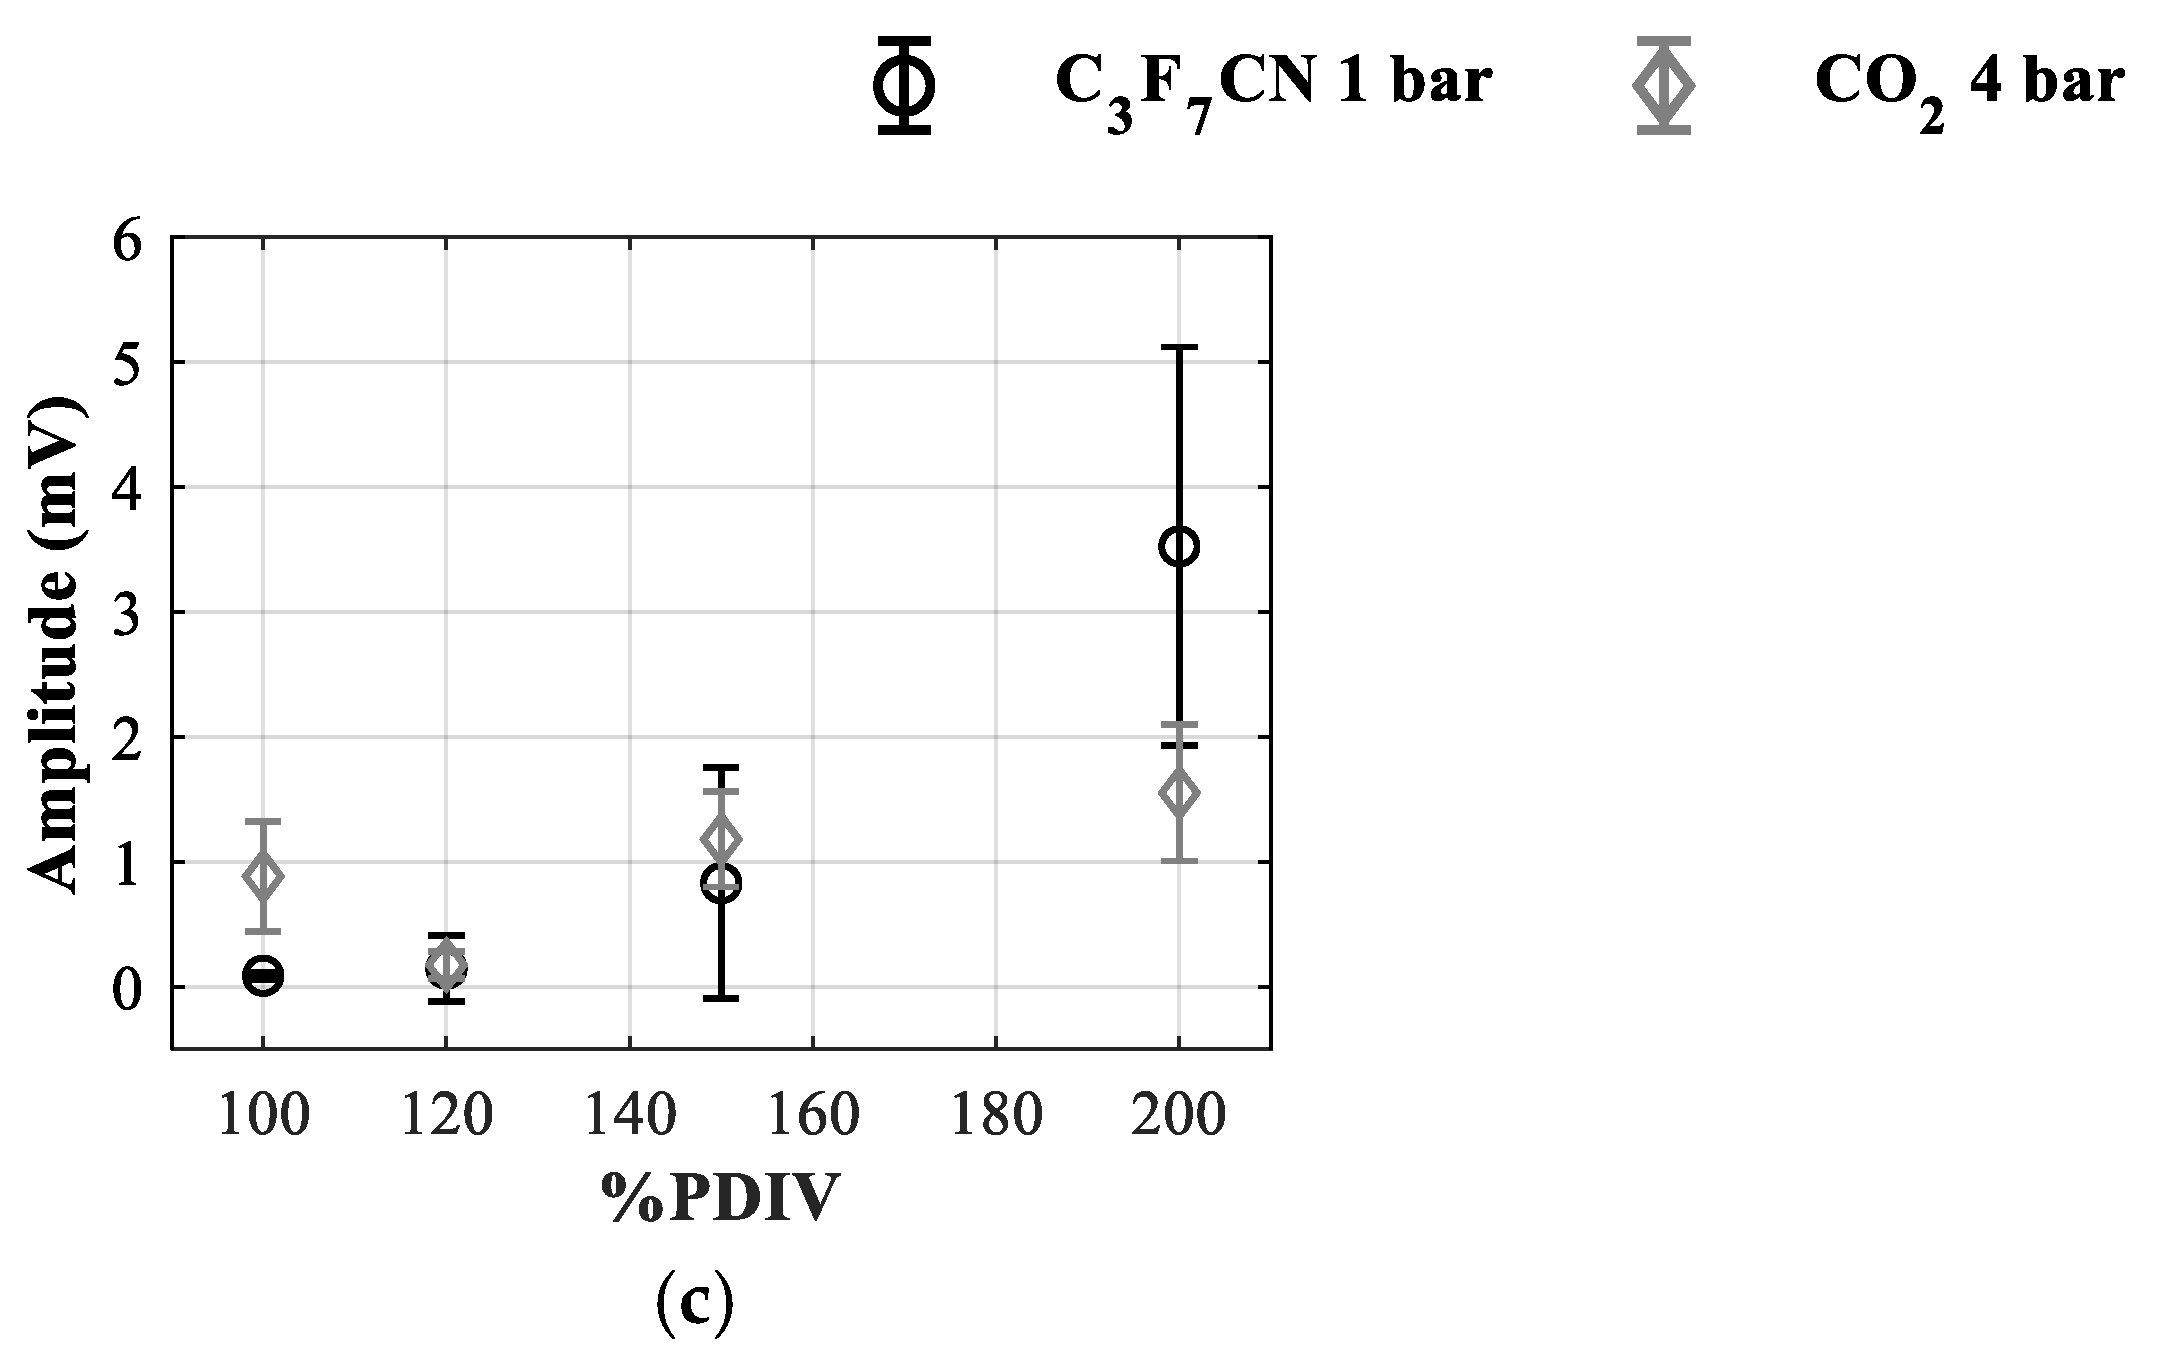
To further examine the effect of gas medium on PD behaviour, pure CO2 and C3F7CN gases were tested using RPC-5 mm. This helps identify which of the two gases is the main contributor for the transitional PRPD behaviour observed in a 20% C3F7CN/80% CO2 gas mixture. Figure 8 shows the PRPD patterns of CO2 under 4 bar and C3F7CN under 1 bar when stressed up to 200% of its PDIV levels using the RPC-5 mm. This corresponds to the use of a 20% C3F7CN/80% CO2 gas mixture under 5 bar pressure. As shown in Figure 8, most PD activity occurred on the negative half-cycle for CO2 at 4 bar and positive half-cycle for C3F7CN at 1 bar. This shows that the different PD behaviour, relative to SF6, observed in the PRPD patterns for 20% C3F7CN/80% CO2 gas mixture could be caused by different contributions from C3F7CN and CO2 gases. The PD events on the positive half-cycle appear to be attributed to the use of C3F7CN, while PD events on the negative half-cycle appear to be from both gases. According to [28,29], for a GIL/GIB with a needle on the HV conductor, there are three distinct phases in which corona discharges can develop in insulating gases with an increase in applied voltage.
The signal amplitude depends on the characteristic difference between SF6 and 20% C3F7CN/80% CO2, gas pressure, voltage magnitude, and field uniformity. The average amplitude in 20% C3F7CN/80% CO2 and SF6 using the RPC-5 mm configuration are shown in Figure 9a,b. The signal amplitude for both gases can be seen to increase with voltage magnitude. The average discharge amplitude of 20% C3F7CN/80% CO2 was significantly lower than SF6 for higher voltages, but there was no obvious relationship with increasing pressure.
For the gas mixture, the contribution of C3F7CN and CO2 to UHF signal shows a clear difference (Figure 9c). The signal amplitude of C3F7CN increases with applied voltage, whereas there is no significant difference with increasing voltage for CO2. When CO2 under 4 bar is energised at its PDIV level for 5 min, there was limited energy emission during discharges as observed in Figure 9c. This is due to the comparatively weak electron affinity of CO2, which indicates that CO2 will be more dominant in the discharge activity at lower voltage magnitudes as shown in the PRPD pattern of 100% PDIV shown in Figure 7a. At higher voltage magnitudes, C3F7CN will start to participate more in the discharge activity with an increased discharge signal. This supports the 3-stage transition observed for 20% C3F7CN/80% CO2 where the process transitioning from CO2 dominated discharge process to C3F7CN dominated discharge process. This also explains the signal parameter in Figure 9a, for 20% C3F7CN/80% CO2 seems independent with voltages, as CO2 appears to be more independent of the applied voltage.
The discharge in rod-plane configurations (RPC-5 mm and RPC-15 mm) show a 3-stage transition with increasing applied voltage for PRPD pattern in 20% C3F7CN/80% CO2 mixture. By testing the gas component individually, a significantly different PRPD pattern and signal amplitude trend was observed for CO2.

5.2. Plane-Plane Configuration

In the case of PPC-5 mm, 170% PDIV was recorded instead of the 200% PDIV level measured for RPC-5 mm. This was to avoid a potential breakdown because the PDIV of PPC-5 mm was comparatively higher than RPC-5 mm. The PRPD pattern captured for SF6 was similar to RPC-5 mm; PDs mostly occurred on the positive half-cycle of the AC waveform with some activity in the negative half-cycle occurring at higher voltages such as 150% and 170% of their PDIV levels.
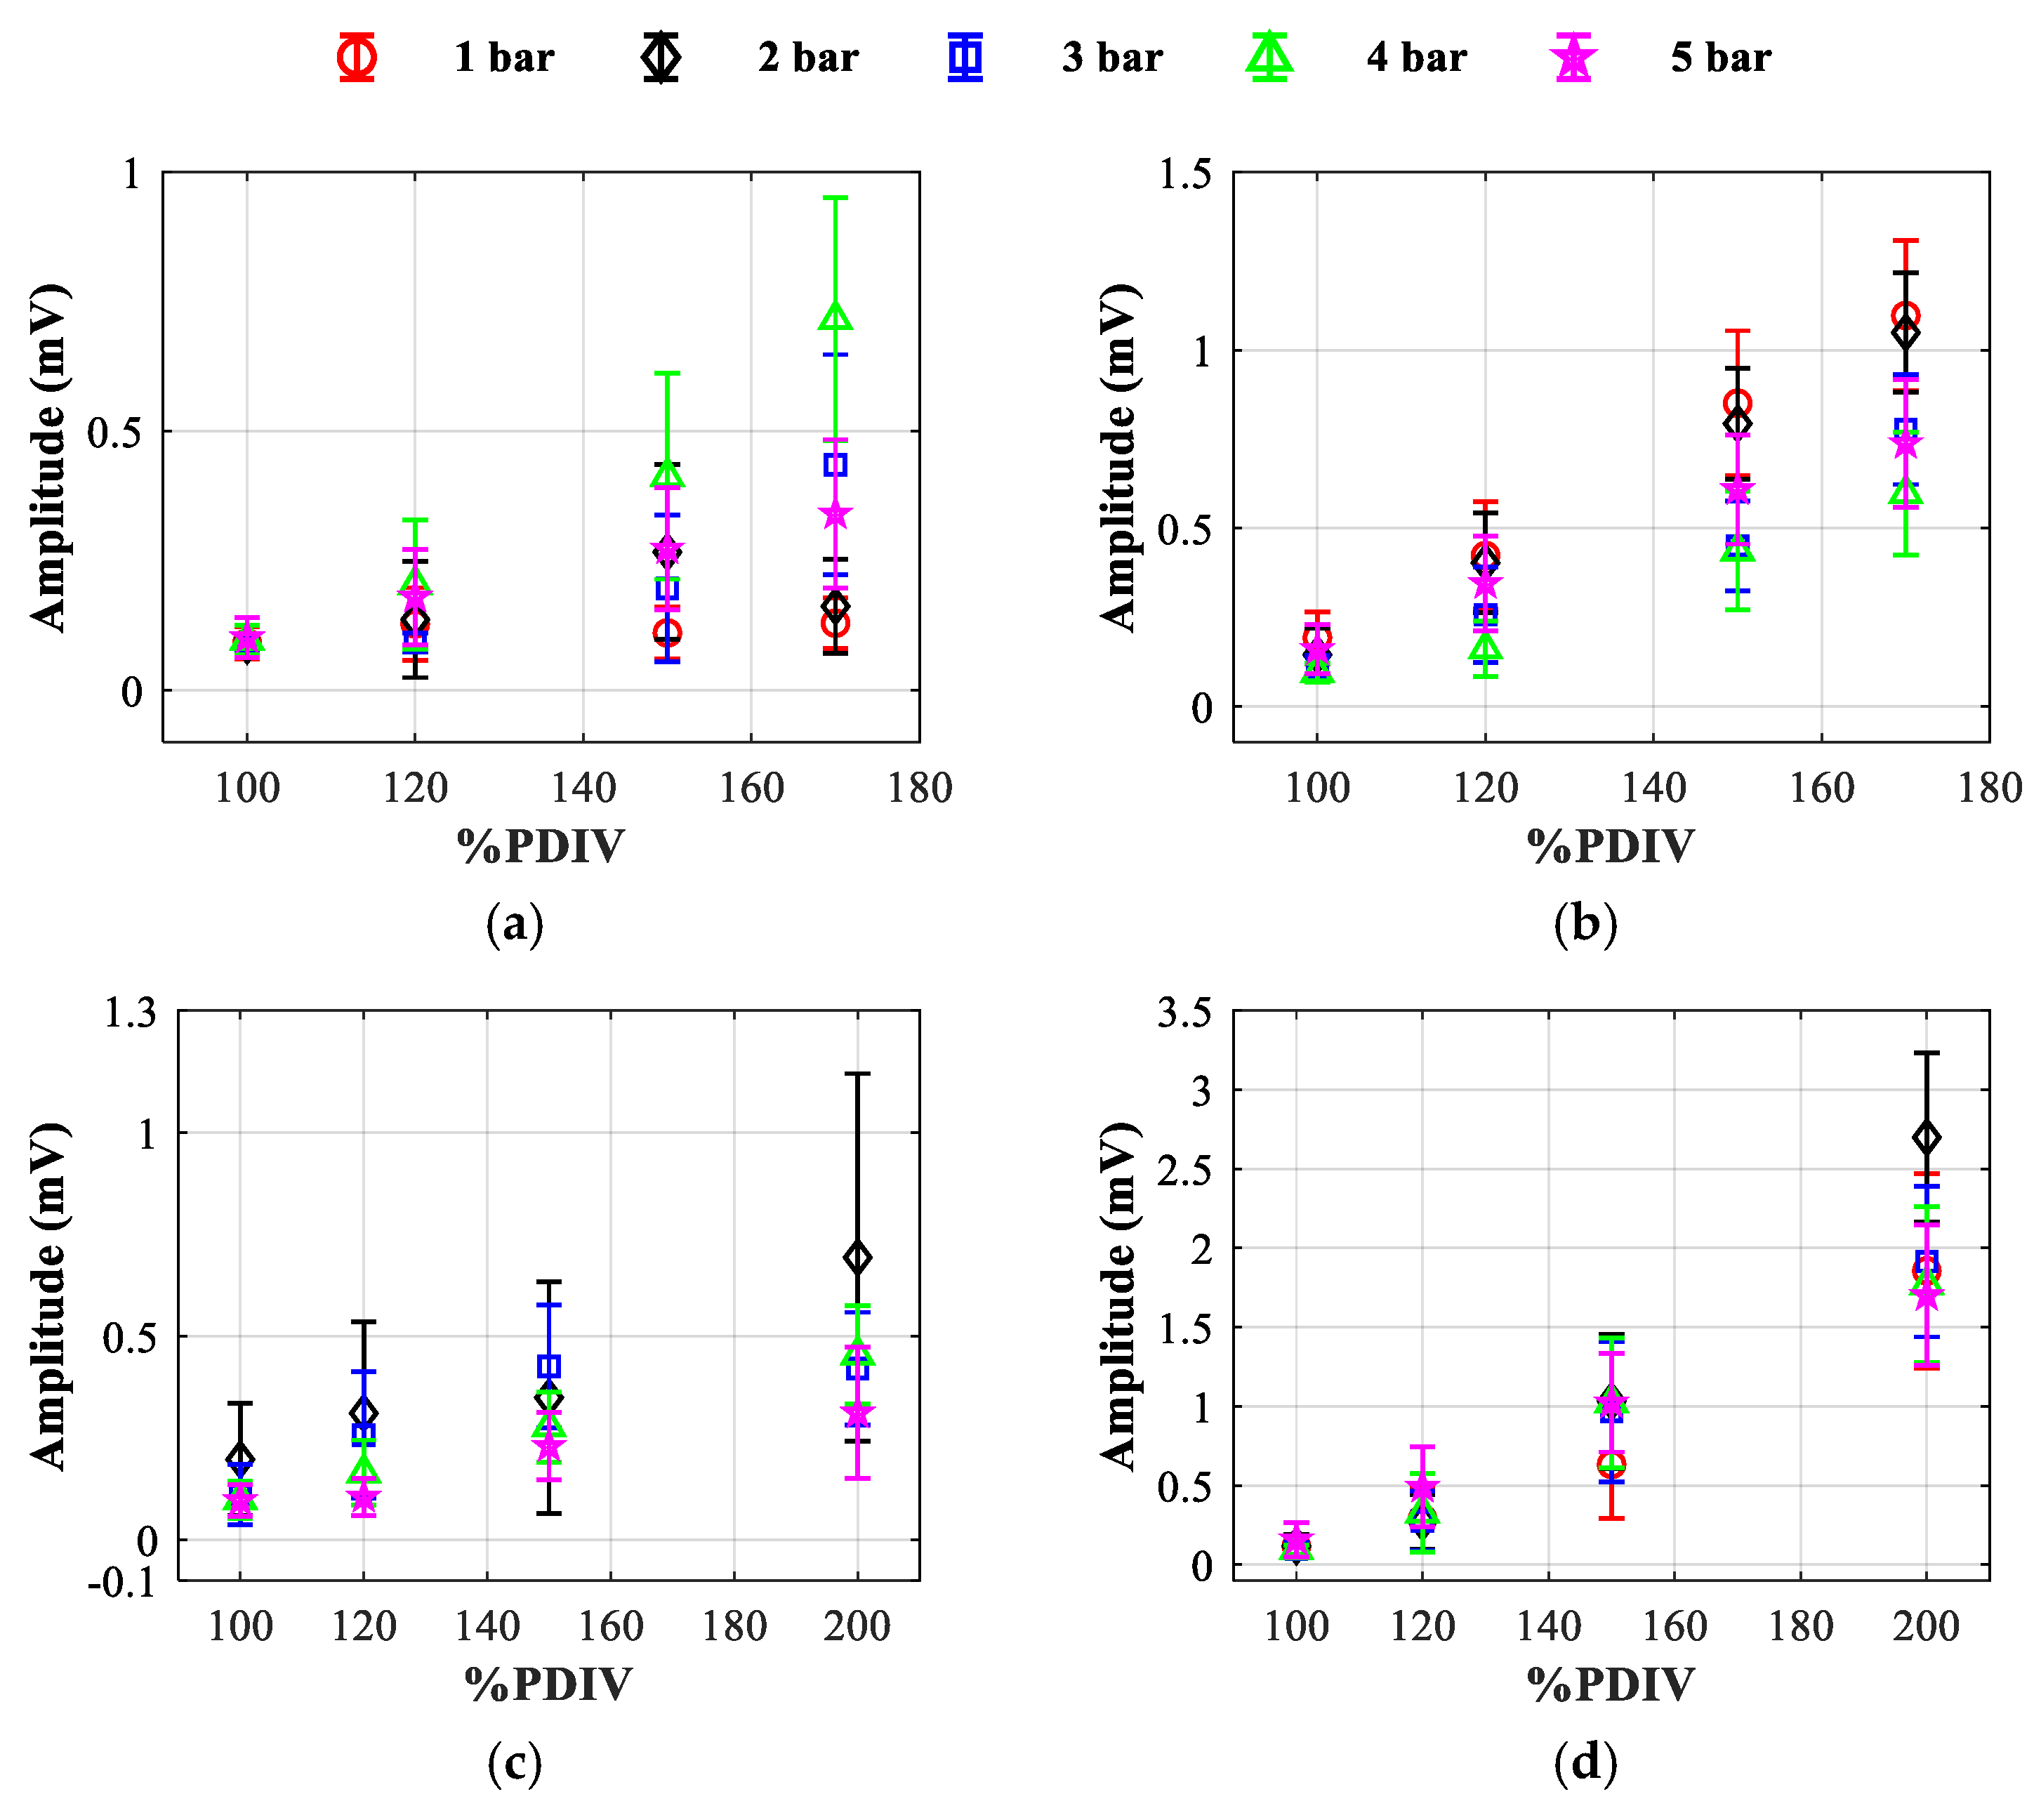
For the PPC-5 mm configuration, the PD characteristic of a 20% C3F7CN/80% CO2 gas mixture was comparable to SF6 where discharges initiate on the positive half-cycle and the PD activity increases with higher voltages as shown in Figure 10. The 3-stage transition for the C3F7CN/CO2 gas mixture was not observed under more uniform field configurations. This is due to the inception field being sufficiently high because of a more uniform electric field, which facilitates the C3F7CN to participate in the discharge process with only the third stage process observed. This shows that when a specific f threshold is exceeded, the 20% C3F7CN/80% CO2 gas mixture can suppress PDs as effectively as SF6.
Figure 11 compares the PRPD patterns for SF6 and the 20% C3F7CN/80% CO2 gas mixture under 5 bar using PPE-15 mm. In Figure 12, the average signal amplitude increases with applied voltage for both gases and electrode configurations, while the increase of signal amplitude in SF6 is comparatively higher than observed in the 20% C3F7CN/80% CO2 gas mixture. The purpose of these PRPD patterns was to examine the reverse behaviour of the gases using a needle on the grounded electrode. For SF6, the PDs started on the negative half-cycle of the AC waveform with some discharges on the positive half-cycle at higher voltages, whereas the reverse 3-stage transition phase was observed for the 20% C3F7CN/80% CO2 gas mixture. Note that only two stages were observed in Figure 11a for the gas mixture. The PDs initially started on the positive half-cycle, followed by discharges on both half-cycles and eventually at higher voltages most PD activity occurred on the negative half-cycle.
As discussed in Section 5.1, the role of positively charged ions is predominant in the negative half-cycle for RPC-15 mm. Positively charged ions could be ionised CO2 molecules with electron vacancy due to the weaker electron affinity of CO2. For the positive half-cycle, the electrons and negatively charged ions are the main sources of discharges, where the negative ions are C3F7CN or SF6 molecules attached with electrons. The PRPD pattern is reversed in Figure 11 when tested in the PPE-15 mm electrode configuration with the protrusion on the ground electrode, which demonstrate a consistent PD phenomenon.
For SF6, the negative ion actively participates in the discharge and reaches the needle tip when the needle is at positive polarity on the ground electrode. In the case of the 20% C3F7CN/80% CO2 mixture, the CO2 molecules first act as positively charged ions and contribute to the discharges at the negative half-cycle on the ground electrode. At higher voltage magnitude, the negatively charged C3F7CN molecules contribute to the discharge activity at the positive half-cycle on the ground electrode, which is the same as observed in SF6. This explains the similarity of the PRPD patterns in 20% C3F7CN/80% CO2 and SF6 at higher voltage magnitude. Note that the signal amplitude of SF6 is higher than 20% C3F7CN/80% CO2 when the electric field was more non-uniform.
Voltage magnitude and field uniformity can heavily influence the PRPD pattern of the 20% C3F7CN/80% CO2 gas mixture. This was demonstrated in the PRPD patterns where at voltage levels above the PDIV and tested for more uniform field configurations, the C3F7CN/CO2 gas mixture behaved like SF6.

6. Discussion

The PD results from this paper, with varying field uniformities, are important for investigating the feasibility of a 20% C3F7CN/80% CO2 gas mixture as a potential retro-fill solution to SF6-filled GIL/GIB equipment. The probability of having protrusions on the conductor or the enclosure longer than 5 mm in practical equipment is considered to be extremely low. Therefore, even though the C3F7CN/CO2 gas mixture was found to behave less favourably than SF6 under highly divergent fields (15 mm needle), it has demonstrated similar PDIV/EV values for protrusions up to a 5 mm length. Using the plane-plane configuration with a 5 mm needle results in the C3F7CN/CO2 gas mixture surpassing SF6 in PD performance.
The 5 mm needle length results are a good indication that the gas mixture is capable of being used in ageing assets as effectively as SF6 for typical defects found on the conductor/enclosure of GIL/GIB. This was also shown in [6], where a 20% C3F7CN/80% CO2 gas mixture passed the PD type tests as successfully as SF6 in a full-scale demonstrator rated for transmission voltages. However, further investigation is still required to fully evaluate the PD behaviour of the two gases by introducing artificial defects in practical GIL/GIB equipment.
As shown in this work, the PRPD patterns of a 20% C3F7CN/80% CO2 gas mixture can be influenced by the change in field uniformity and the voltage magnitude above the PDIV. As mentioned before, field uniformity and voltage magnitude have no effect on SF6 using small gaps as the PDs were observed to predominantly occur on the positive half-cycle of the AC waveform. However, the 20% C3F7CN and 80% CO2 gas mixture was found to behave differently to SF6 with field uniformity and voltage magnitude. Taking the PRPD pattern and discharge amplitude into consideration, two main parameters have been found to affect the PD behaviour of the C3F7CN/CO2 gas mixture:
  • Voltage magnitude was observed to affect the PD activity in the negative half-cycle started at the 100% PDIV level for the C3F7CN/CO2 gas mixture at 1 bar. The PD activity shifted to the positive half-cycle when the gas medium was subjected to 200% PDIV and under higher pressures. The discharge process is dependent on the insulating gas tested. This observation was found for all tests under different pressures with the needle protrusion on the HV conductor. For a protrusion on the conductor, at lower voltage magnitudes, CO2 was ionised first and resulted in the UHF signals measured in negative half-cycle, while C3F7CN participated in the discharge process when voltage magnitude was increased. It was observed that the increasing voltage magnitude can also change the signal parameters (amplitude and phase).
  • Field uniformity was observed to affect the 3-stage transition phase of the gas mixture. For f less than 0.0033, the transition phase occurred for almost all the investigated pressures. Once this critical f value was exceeded for the PPE-5 mm configuration (f = 0.0043), the C3F7CN/CO2 gas mixture was able to suppress the PD activity more effectively than SF6 as shown by the PDIV/EV values. Comparatively higher PDIV/EV values for the C3F7CN/CO2 gas mixture will not have 3-phase transition because both C3F7CN and CO2 actively participated in the discharge activity. This demonstrates that for passive equipment with quasi-uniform fields, a 20% C3F7CN/80% CO2 mixture can suppress PDs as effectively as SF6 and can be considered as a viable retro-fill solution.
The gas mixture appears to be more affected by the aforementioned parameters than SF6. This could be due to the presence of weakly attaching CO2 molecules, which can result in PDs initiated at lower voltages than a gas with strong electron affinity like SF6.
The PD results demonstrate promising behaviour for a mixture of 20% C3F7CN and 80% CO2 with a liquefaction temperature of −5.1 °C at 5 bar calculated using the Peng-Robinson equation [30]. This is acceptable for indoor applications in cold climate countries and outdoor/indoor applications in hot climate countries with a specified minimum operating temperature of −5.1 °C for these scenarios in accordance with IEC 62271-203: 2011 [31].

7. Conclusions

This paper presents results on the PD characteristics of SF6 and a 20% C3F7CN/80% CO2 gas mixture to comparatively evaluate their PD performance in the presence of defects. The conclusions drawn from this investigation are given below.
It has been demonstrated that a 20% C3F7CN/80% CO2 gas mixture has a comparatively lower PDIV/EV performance than SF6 under highly divergent fields (RPC-15 mm and PPC-15 mm) using the UHF method. Comparable PDIV/EV performance was observed for both SF6 and the 20% C3F7CN/80% CO2 gas mixture tested for more uniform field configurations (RPC-5 mm and PPC-5 mm) over pressures of 2 to 5 bar. Despite the different electrode geometries, the PDIV/EV results are similar as both geometries have comparable f values.
The PRPD patterns of SF6 and the 20% C3F7CN/80% CO2 gas mixture were found to behave differently under highly non-uniform fields. For SF6 energised at higher voltages, most PD activity occurred on the positive half-cycle with a few discharges observed on the negative half-cycle independent of the field uniformity.
On the contrary, PRPD patterns for the 20% C3F7CN/80% CO2 gas mixture show a 3-stage transition behaviour where CO2 started to discharge at negative half-cycle due to its weaker electron affinity under a lower applied voltage. The discharge activity was subsequently observed to shift gradually from negative to positive half-cycle as C3F7CN ionises at higher voltages. This shows that a mixture of both strongly and weakly attaching gases such as C3F7CN and CO2 could lead to different PRPD patterns under varying conditions. This should be taken into consideration for developing condition monitoring diagnostic systems of C3F7CN/CO2 gas mixture in future high voltage plants.

Author Contributions

Conceptualization, L.C. and M.S.-G.; methodology, L.C., R.F.B. and M.S.-G.; software, R.F.B. and M.S.-G.; validation, L.L., R.F.B. and Q.H.; formal analysis, L.L. and Q.H.; investigation, L.L. and Q.H.; resources, L.C., Q.L., M.W. and G.W.; writing—original draft preparation, L.L. and Q.H.; writing—review and editing, L.L., Q.H., L.C. and Q.L.; supervision, L.C. and Q.L.; project administration, L.C.; funding acquisition, L.C. and Q.L. All authors have read and agreed to the published version of the manuscript.

Funding

This work was supported in part by a Ph.D. studentship from the Engineering and Physical Sciences Research Council (EPSRC), Industrial Cooperative Awards in Science and Technology, and in part by National Grid, UK. The authors also acknowledge EPSRC for support through ‘High Voltage Test Systems for Electricity Network Research’ [grant number EP/P030343/1].

Data Availability Statement

The data that support the findings of this study are available upon reasonable request from the corresponding author, L.C.

Conflicts of Interest

The authors declare no conflict of interest.

References

  1. Climate Action—Kyoto 2nd Commitment Period (2013–2020). Available online: https://ec.europa.eu/clima/policies/strategies/progress/kyoto_2_en#:~:text=This%20period%20bridges%20the%20gap,to%20make%20further%20emissions%20cuts (accessed on 2 October 2022).
  2. IPCC. Climate Change 2021: The Physical Science Basis; Contribution of Working Group I to the Sixth Assessment Report of the Intergovernmental Panel on Climate Change; Cambridge University Press: Cambridge, UK; New York, NY, USA, 2021. [Google Scholar]
  3. Kieffel, Y.; Irwin, T.; Ponchon, P.; Owens, J. Green Gas to Replace SF6 in Electrical Grids. IEEE Power Energy Mag. 2016, 14, 32–39. [Google Scholar] [CrossRef]
  4. Kieffel, Y. Characteristics of g3—An alternative to SF6. In Proceedings of the International Conference on Dielectrics, Montpellier, France, 3–7 July 2016; pp. 880–884. [Google Scholar]
  5. Owens, J.G. Greenhouse Gas Emission Reductions through use of a Sustainable Alternative to SF6. In Proceedings of the IEEE lectrical Insulation Conference, Montreal, Canada, 19–22 July 2016; pp. 535–538. [Google Scholar]
  6. Loizou, L.; Chen, L.; Liu, Q.; Cotton, I.; Waldron, M.; Owens, J. Technical Viability of Retro-filling C3F7CN/CO2 Gas Mixtures in SF6-designed Gas Insulated Lines and Busbars at Transmission Voltages. IEEE Trans. Power Deliv. 2020, 35, 2394–2402. [Google Scholar] [CrossRef]
  7. IEC 60060-1:2010; High-Voltage Test Techniques—Part 1: General Definitions and Test Requirements. IEC: Geneva, Switzerland, 2010.
  8. National Grid and Hitachi Energy Announce World First Collaboration to Replace SF6 in Existing High-Voltage Equipment. Available online: https://www.nationalgrid.com/national-grid-and-hitachi-energy-announce-world-first-collaboration-replace-sf6-existing-high (accessed on 2 October 2022).
  9. Wang, G.; Kim, W.H.; Kil, G.; Kim, S.W.; Jung, J.R. Green Gas for a Grid as An Eco-Friendly Alternative Insulation Gas to SF6: From the Perspective of Partial Discharge Under AC. Appl. Sci. 2019, 9, 651. [Google Scholar] [CrossRef] [Green Version]
  10. Zhang, B.; Uzelac, N.; Cao, Y. Fluoronitrile/CO2 mixture as an eco-friendly alternative to SF6 for medium voltage switchgears. IEEE Trans. Dielectr. Electr. Insul. 2018, 25, 1340–1350. [Google Scholar] [CrossRef]
  11. Loizou, L.; Chen, L.; Liu, Q.; Fernandez Bautista, R.; Seltzer-Grant, M. Evaluation of UHF Partial Discharge Measurements for SF6 and 20% C3F7CN/80% CO2 Gas Mixture. In Proceedings of the 3rd International Conference on Dielectrics (ICD), Valencia, Spain, 5–31 July 2020; pp. 818–821. [Google Scholar]
  12. Arora, R.; Wolgang, M. High Voltage and Electrical Insulation Engineering; John Wiley & Sons: Hoboken, NJ, USA, 2011. [Google Scholar]
  13. Prabakaran, T.; Usa, S.; Santosh Kumar, A. Analysis of Partial Discharge Signals in 420 kV Gas Insulated Substation. In Proceedings of the 1st International Conference on Condition Assessment Techniques in Electrical Systems (CATCON), Kolkata, India, December, 6–8 December 2013; pp. 249–254. [Google Scholar]
  14. Metwally, I.A. Status review on partial discharge measurement techniques in gas-insulated switchgear/lines. Electr. Power Syst. Res. 2004, 69, 25–36. [Google Scholar] [CrossRef]
  15. Wang, G.; Kil, G.S. Measurement and Analysis of Partial Discharge Using an Ultra-high Frequency Sensor for Gas Insulated Structures. Metrol. Meas. Syst. 2017, 24, 515–524. [Google Scholar] [CrossRef]
  16. De Kock, N.; Coric, B.; Pietsch, R. UHF PD detection in gas-insulated switchgear—Suitability and sensitivity of the UHF method in comparison with the IEC 270 method. IEEE Electr. Insul. Mag. 1996, 12, 20–26. [Google Scholar] [CrossRef]
  17. Li, X.; Liu, W.; Xu, Y.; Ding, D. Discharge characteristics and detectability of metal particles on the spacer surface in gas-insulated switchgears. IEEE Trans. Power Deliv. 2021, 37, 187–196. [Google Scholar] [CrossRef]
  18. He, Y.; Li, M.; Meng, Z.; Chen, S.; Huang, S.; Hu, Y.; Zou, X. An overview of acoustic emission inspection and monitoring technology in the key components of renewable energy systems. Mech. Syst. Signal Process 2021, 148, 107146. [Google Scholar] [CrossRef]
  19. Darwish, A.; Refaat, S.S.; Toliyat, H.A.; Abu-Rub, H. On the electromagnetic wave behavior due to partial discharge in gas insulated switchgears: State-of-art review. IEEE Access 2019, 7, 75822–75836. [Google Scholar] [CrossRef]
  20. Han, X.; Zhang, X.; Guo, R.; Wang, H.; Li, J.; Li, Y.; Zhao, M. Partial Discharge Detection in Gas-Insulated Switchgears Using Sensors Integrated With UHF and Optical Sensing Methods. IEEE Trans. Dielectr. Electr. Insul. 2022, 29, 2026–2033. [Google Scholar] [CrossRef]
  21. COMSOL—Finite Element Mesh Refinement. Available online: https://www.comsol.com/multiphysics/mesh-refinement (accessed on 2 October 2022).
  22. Ultra High Frequency Detection for Partial Discharge. Available online: https://www.hvpd.co.uk/products/uhf-barrier-sensor/ (accessed on 2 October 2022).
  23. HVPD Kronos® Spot Tester. Available online: https://www.hvpd.co.uk/products/kronos-spot-tester/ (accessed on 2 October 2022).
  24. Boeck, W.; Albiez, M.; Bengtsson, T.; Diessner, A.; Feger, R.; Feser, K.; Girodet, A.; Gulski, E.; Hampton, B.F.; Hücker, T.; et al. Partial Discharge Detection System for GIS: Sensitivity Verification for the UHF Method and the Acoustic Method. Cigre Electra 1999, 183, 77–87. [Google Scholar]
  25. IEC 62478:2016; High Voltage Test Techniques—Measurement of Partial Discharges by Electromagnetic and Acoustic Methods. IEC: Geneva, Switzerland, 2016.
  26. Loizou, L.; Chen, L.; Liu, Q.; Waldron, M. Lightning Impulse Breakdown Characteristics of SF6 and 20% C3F7CN/80% CO2 Mixture under Weakly Non-Uniform Electric Fields. IEEE Trans. Dielectr. Electr. Insul. 2020, 27, 848–856. [Google Scholar] [CrossRef]
  27. Loizou, L.; Chen, L.; Liu, Q. A Comparative Study on the Breakdown Characteristics of SF6 and 20% C3F7CN/80% CO2 Gas Mixture in a Coaxial Configuration. In Proceedings of the IEEE Conference on Electrical Insulation and Dielectric Phenomena (CEIDP), Washington, DC, USA, 20–23 October 2019; pp. 234–237. [Google Scholar]
  28. Haddad, A.; Warne, D. Advances in High Voltage Engineering, 1st ed.; IET: London, UK, 2004. [Google Scholar]
  29. Pearson, J.S.; Farish, O.; Hampton, B.F.; Judd, M.D.; Templeton, D. Partial Discharge Diagnostics for Gas Insulated Substations. IEEE Trans. Dielectr. Electr. Insul. 1995, 2, 893–905. [Google Scholar] [CrossRef]
  30. Richard, E.J.; Lira, C.T. Chapter 15 Phase Equilibria in Mixtures by an Equation of State. In Introductory Chemical Engineering Thermodynamics, 2nd ed.; Prentice Hall: Upper Saddle River, NJ, USA, 2012. [Google Scholar]
  31. IEC 62271-203:2011; High-Voltage Switchgear and Controlgear—Gas-Insulated Metal-Enclosed Switchgear for Rated Voltages above 52 kV. IEC: Geneva, Switzerland, 2011.
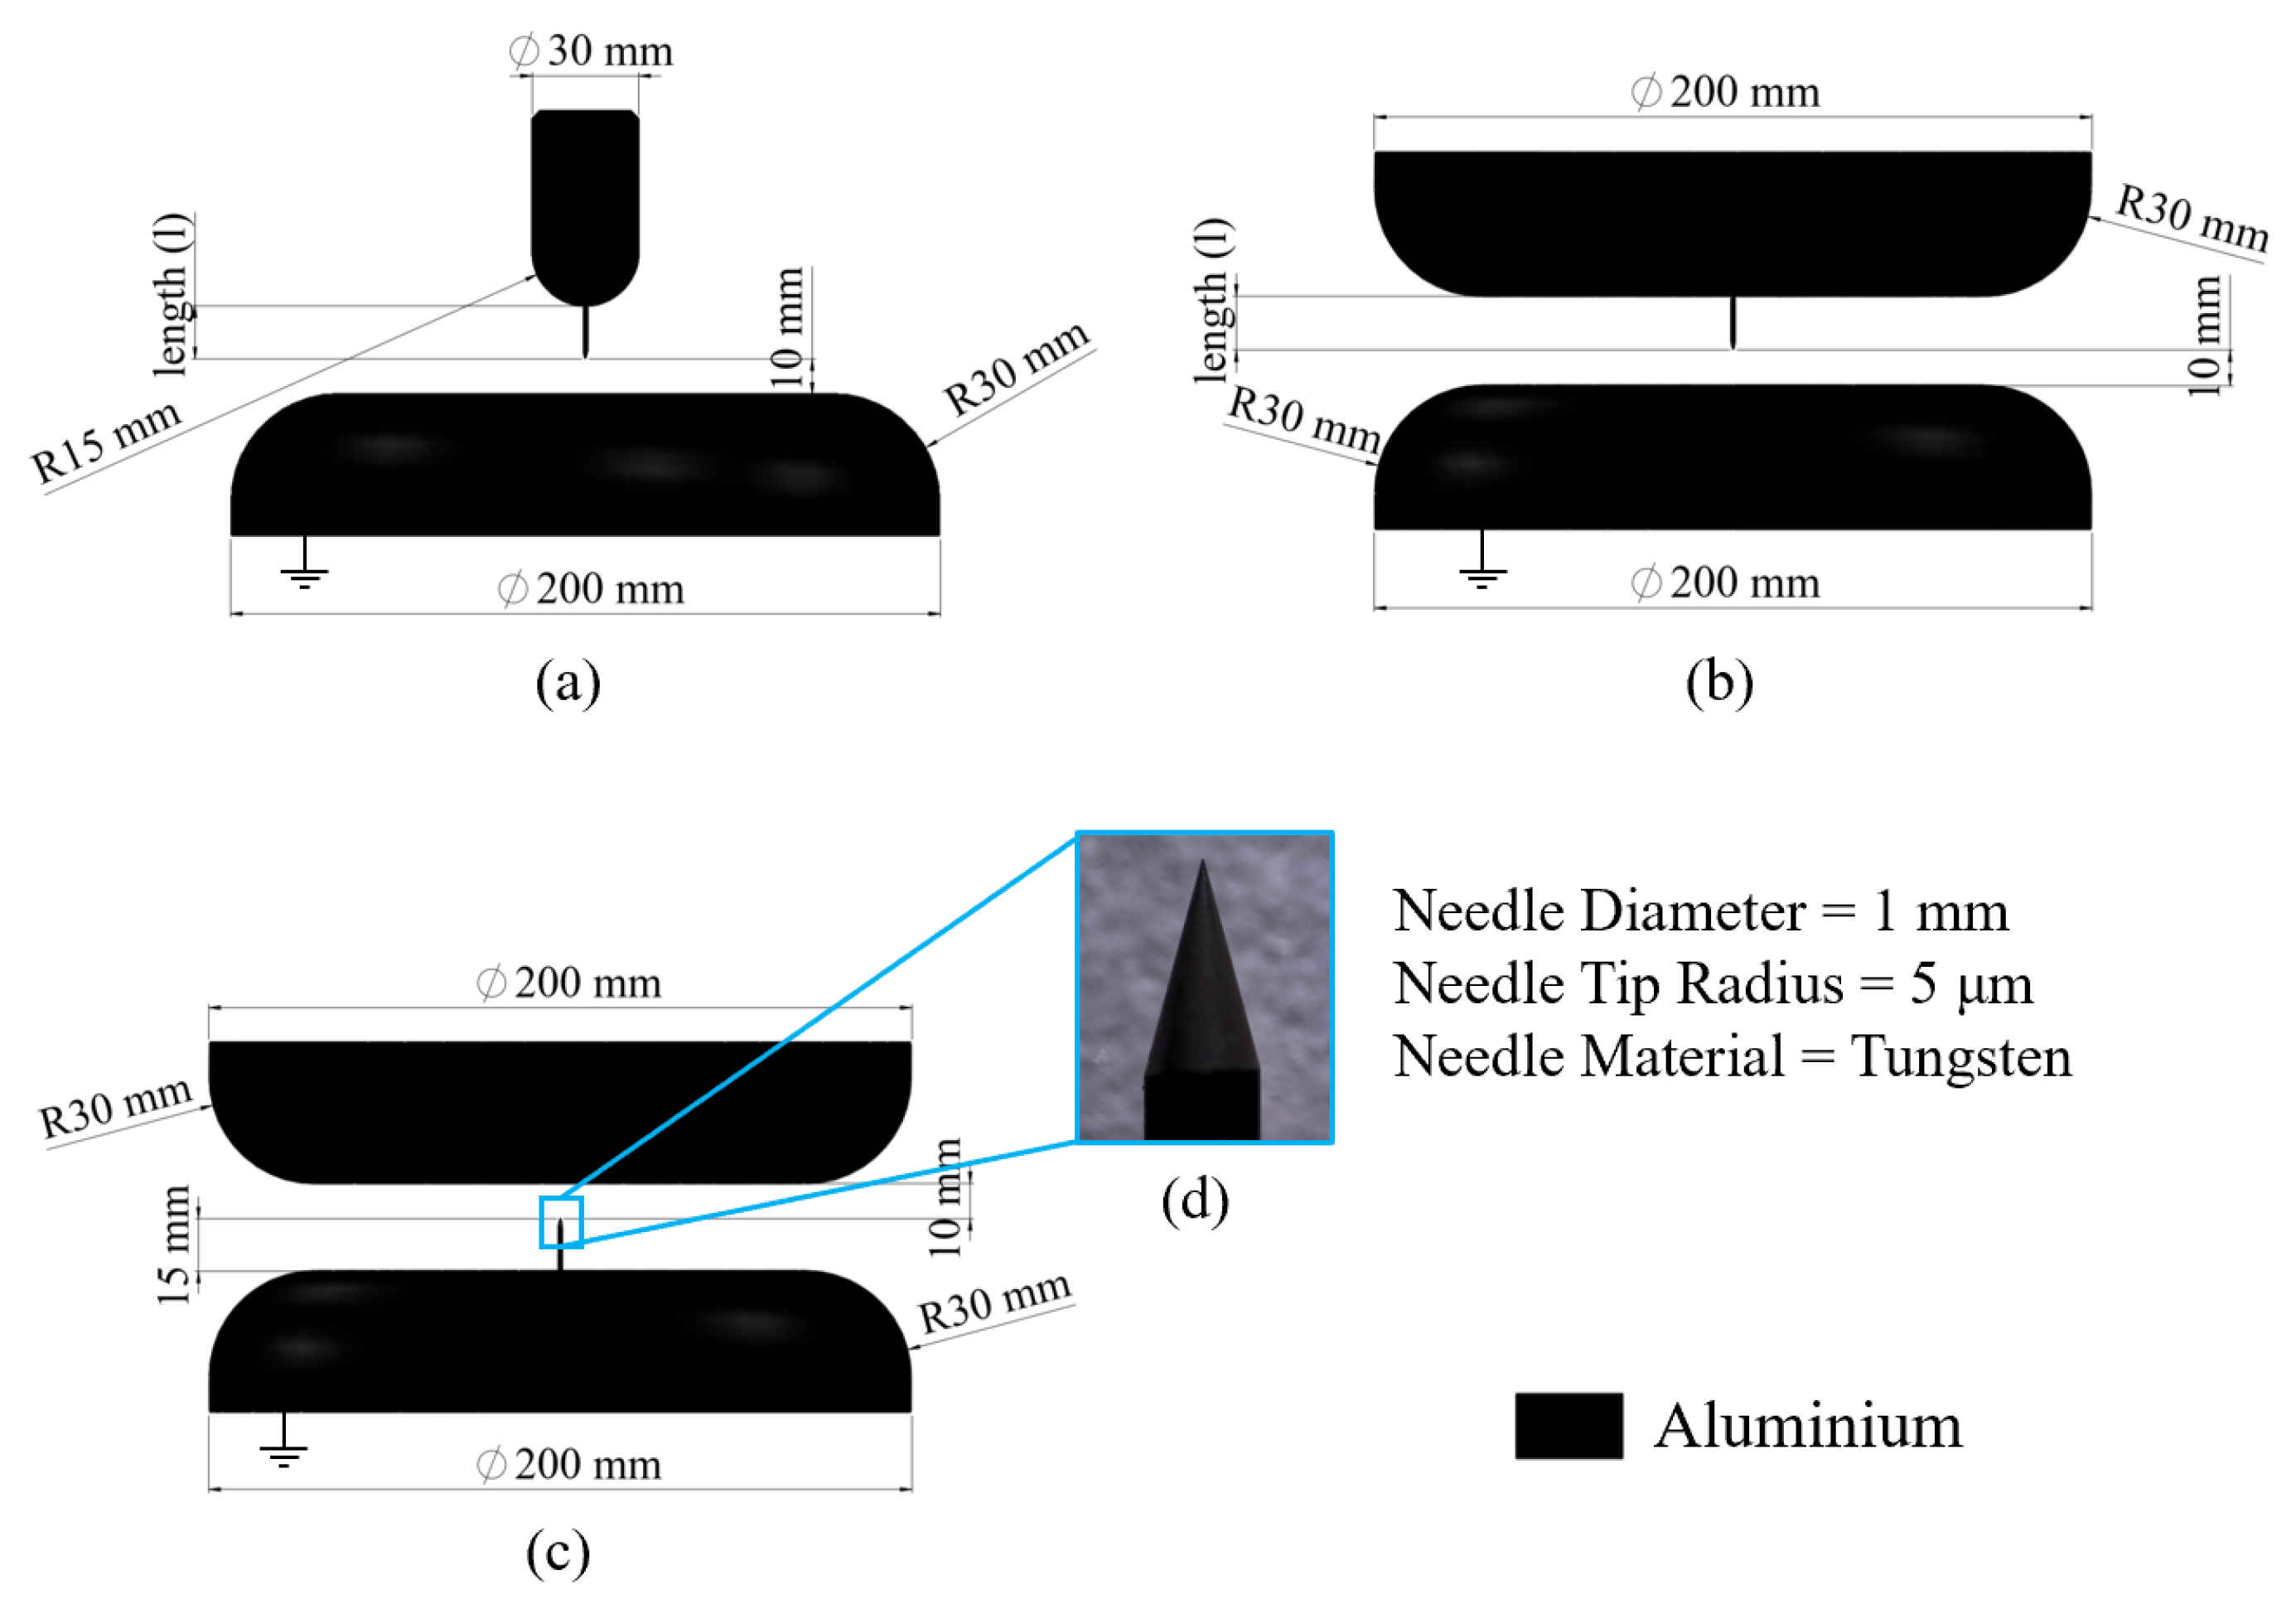
Figure 1. Artificial defects on electrode configurations for modelling PD sources of practical GIL/GIB systems (a) rod-plane with a needle inserted in the HV rod, (b) plane-plane with a needle on the HV plane, (c) plane-plane with a needle on the grounded plane and (d) microscope image of the needle used for protrusions.
Energies 15 07731 g001
Figure 2. (a) An illustration of meshing element and (b) electric field distribution in COMSOL simulation for RPC-15 mm configuration.
Energies 15 07731 g002
Figure 3. Experimental setup.
Energies 15 07731 g003
Figure 4. Signals recorded from the UHF sensors for (a) the PD signal (20.9 mVpk-pk) and (b) the noise level (7.5 mVpk-pk).
Energies 15 07731 g004
Figure 5. ACRMS PDIV and PDEV of SF6 and 20% C3F7CN/80% CO2 tested for the (a) RPC-5 mm (f = 0.0033), (b) PPC-15 mm (f = 0.0029), (c) PPC-5 mm (f = 0.0043) and (d) PPE-15 mm (f = 0.0029) electrode configuration under 1 to 5 bar pressure, plotted with error bars.
Energies 15 07731 g005
Figure 6. Signal amplitude of SF6 and 20% C3F7CN/80% CO2 tested for (a) RPC-5 mm, (b) PPC-15 mm, (c) PPC-5 mm and (d) PPE-15 mm electrode configurations under a pressure range of 1 to 5 bar.
Energies 15 07731 g006
Figure 7. PRPD patterns of (a) 20% C3F7CN/80% CO2 and (b) SF6 under pressure of 5 bar tested at 100%, 120%, 150%, and 200% of their PDIV levels using the RPC-5 mm configuration.
Energies 15 07731 g007
Figure 8. PRPD patterns of (a) CO2 under 4 bar and (b) C3F7CN under 1 bar at 200% of their PDIV levels to illustrate its PRPD behaviour using the RPC-5 mm configuration.
Energies 15 07731 g008
Figure 9. Average signal amplitude of (a) 20% C3F7CN/80% CO2 for pressures of 1 to 5 bar, (b) SF6 for pressures of 1 to 5 bar, and (c) CO2 at 4 bar and C3F7CN at 1 bar, all tested at 100, 120, 150, and 200% of their PDIV levels using the RPC-5 mm configuration.
Energies 15 07731 g009aEnergies 15 07731 g009b
Figure 10. PRPD patterns of (a) 20% C3F7CN/80% CO2 and (b) SF6 under pressure of 5 bar tested at 100%, 120%, 150%, and 170% of their PDIV values using the PPC-5 mm configuration.
Energies 15 07731 g010
Figure 11. PRPD patterns of (a) 20% C3F7CN/80% CO2 and (b) SF6 under pressure of 5 bar tested at 100%, 120%, 150%, and 200% of their PDIV values using the PPE-15 mm configuration (protrusion on the earth electrode).
Energies 15 07731 g011
Figure 12. Average signal amplitude of (a) PPC-5 mm, 20% C3F7CN/80% CO2, (b) PPC-5 mm, SF6, (c) PPE-15 mm, 20% C3F7CN/80% CO2 and (d) PPE-15 mm, SF6, tested at 100%, 120%, 150%, and 170%, or 200% of their PDIV levels and for pressures of 1 to 5 bar.
Energies 15 07731 g012
Table 1. Emax and f values for all electrode configurations used in the PD experiments.
Electrode
Configuration
AbbreviationNeedle Length (mm)Maximum
Electric Field, Emax (kV/mm)
Field Utilisation Factor, f
Rod-plane (POC)RPC-5 mm530.040.0033
RPC-15 mm1540.550.0025
Plane-plane (POC)PPC-5 mm523.140.0043
PPC-15 mm1534.580.0029
Plane-plane (POE)PPE-15 mm1534.580.0029
Publisher’s Note: MDPI stays neutral with regard to jurisdictional claims in published maps and institutional affiliations.